Artificial Neural Networks for Image Processing in Precision Agriculture: A Systematic Literature Review on Mango, Apple, Lemon, and Coffee Crops


Abstract
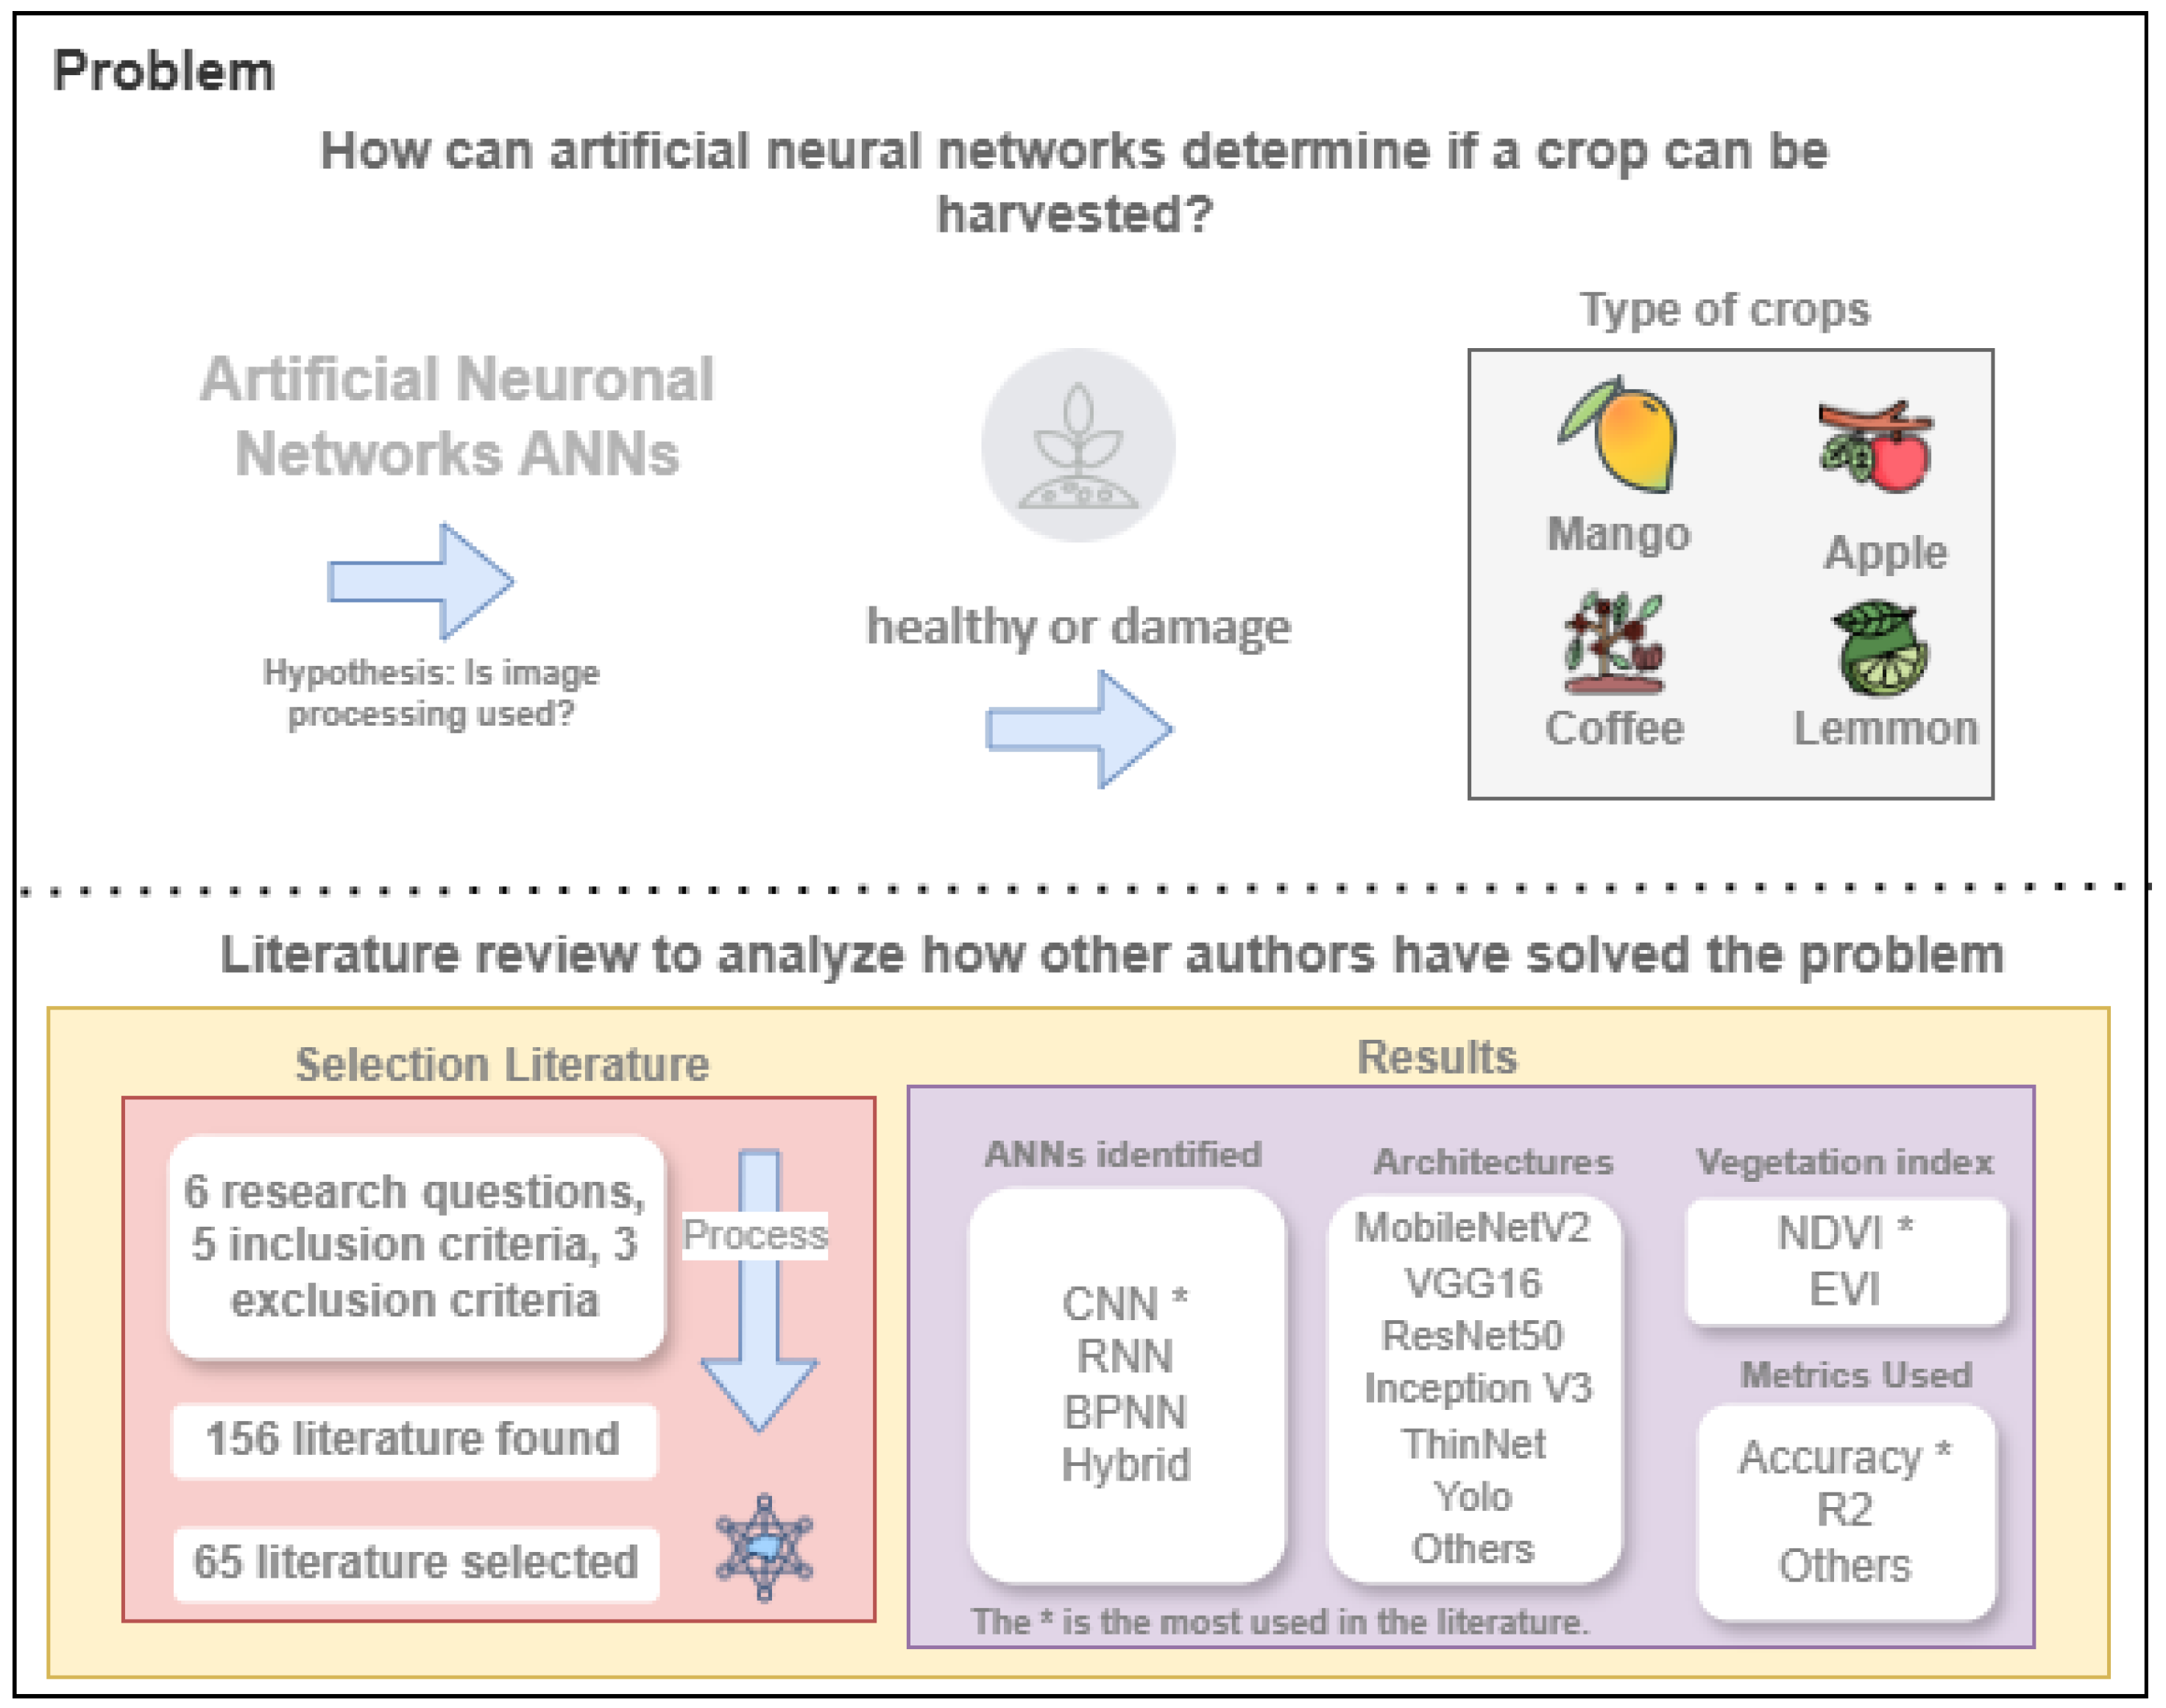
:1. Introduction
Highlights
- We analyze how neural networks can determine the state of fruits in crops such as mango, apple, lemon, and coffee.
- We find that CNN neural networks, including architectures such as VGG16 and ResNet50 networks, are the most used to detect crop maturity.
- We discuss the integration of hardware and software, image preprocessing methods, and evaluation metrics employed.
- We analyze whether the approaches were post-harvest or pre-harvest.
2. Methodology
2.1. Research Questions
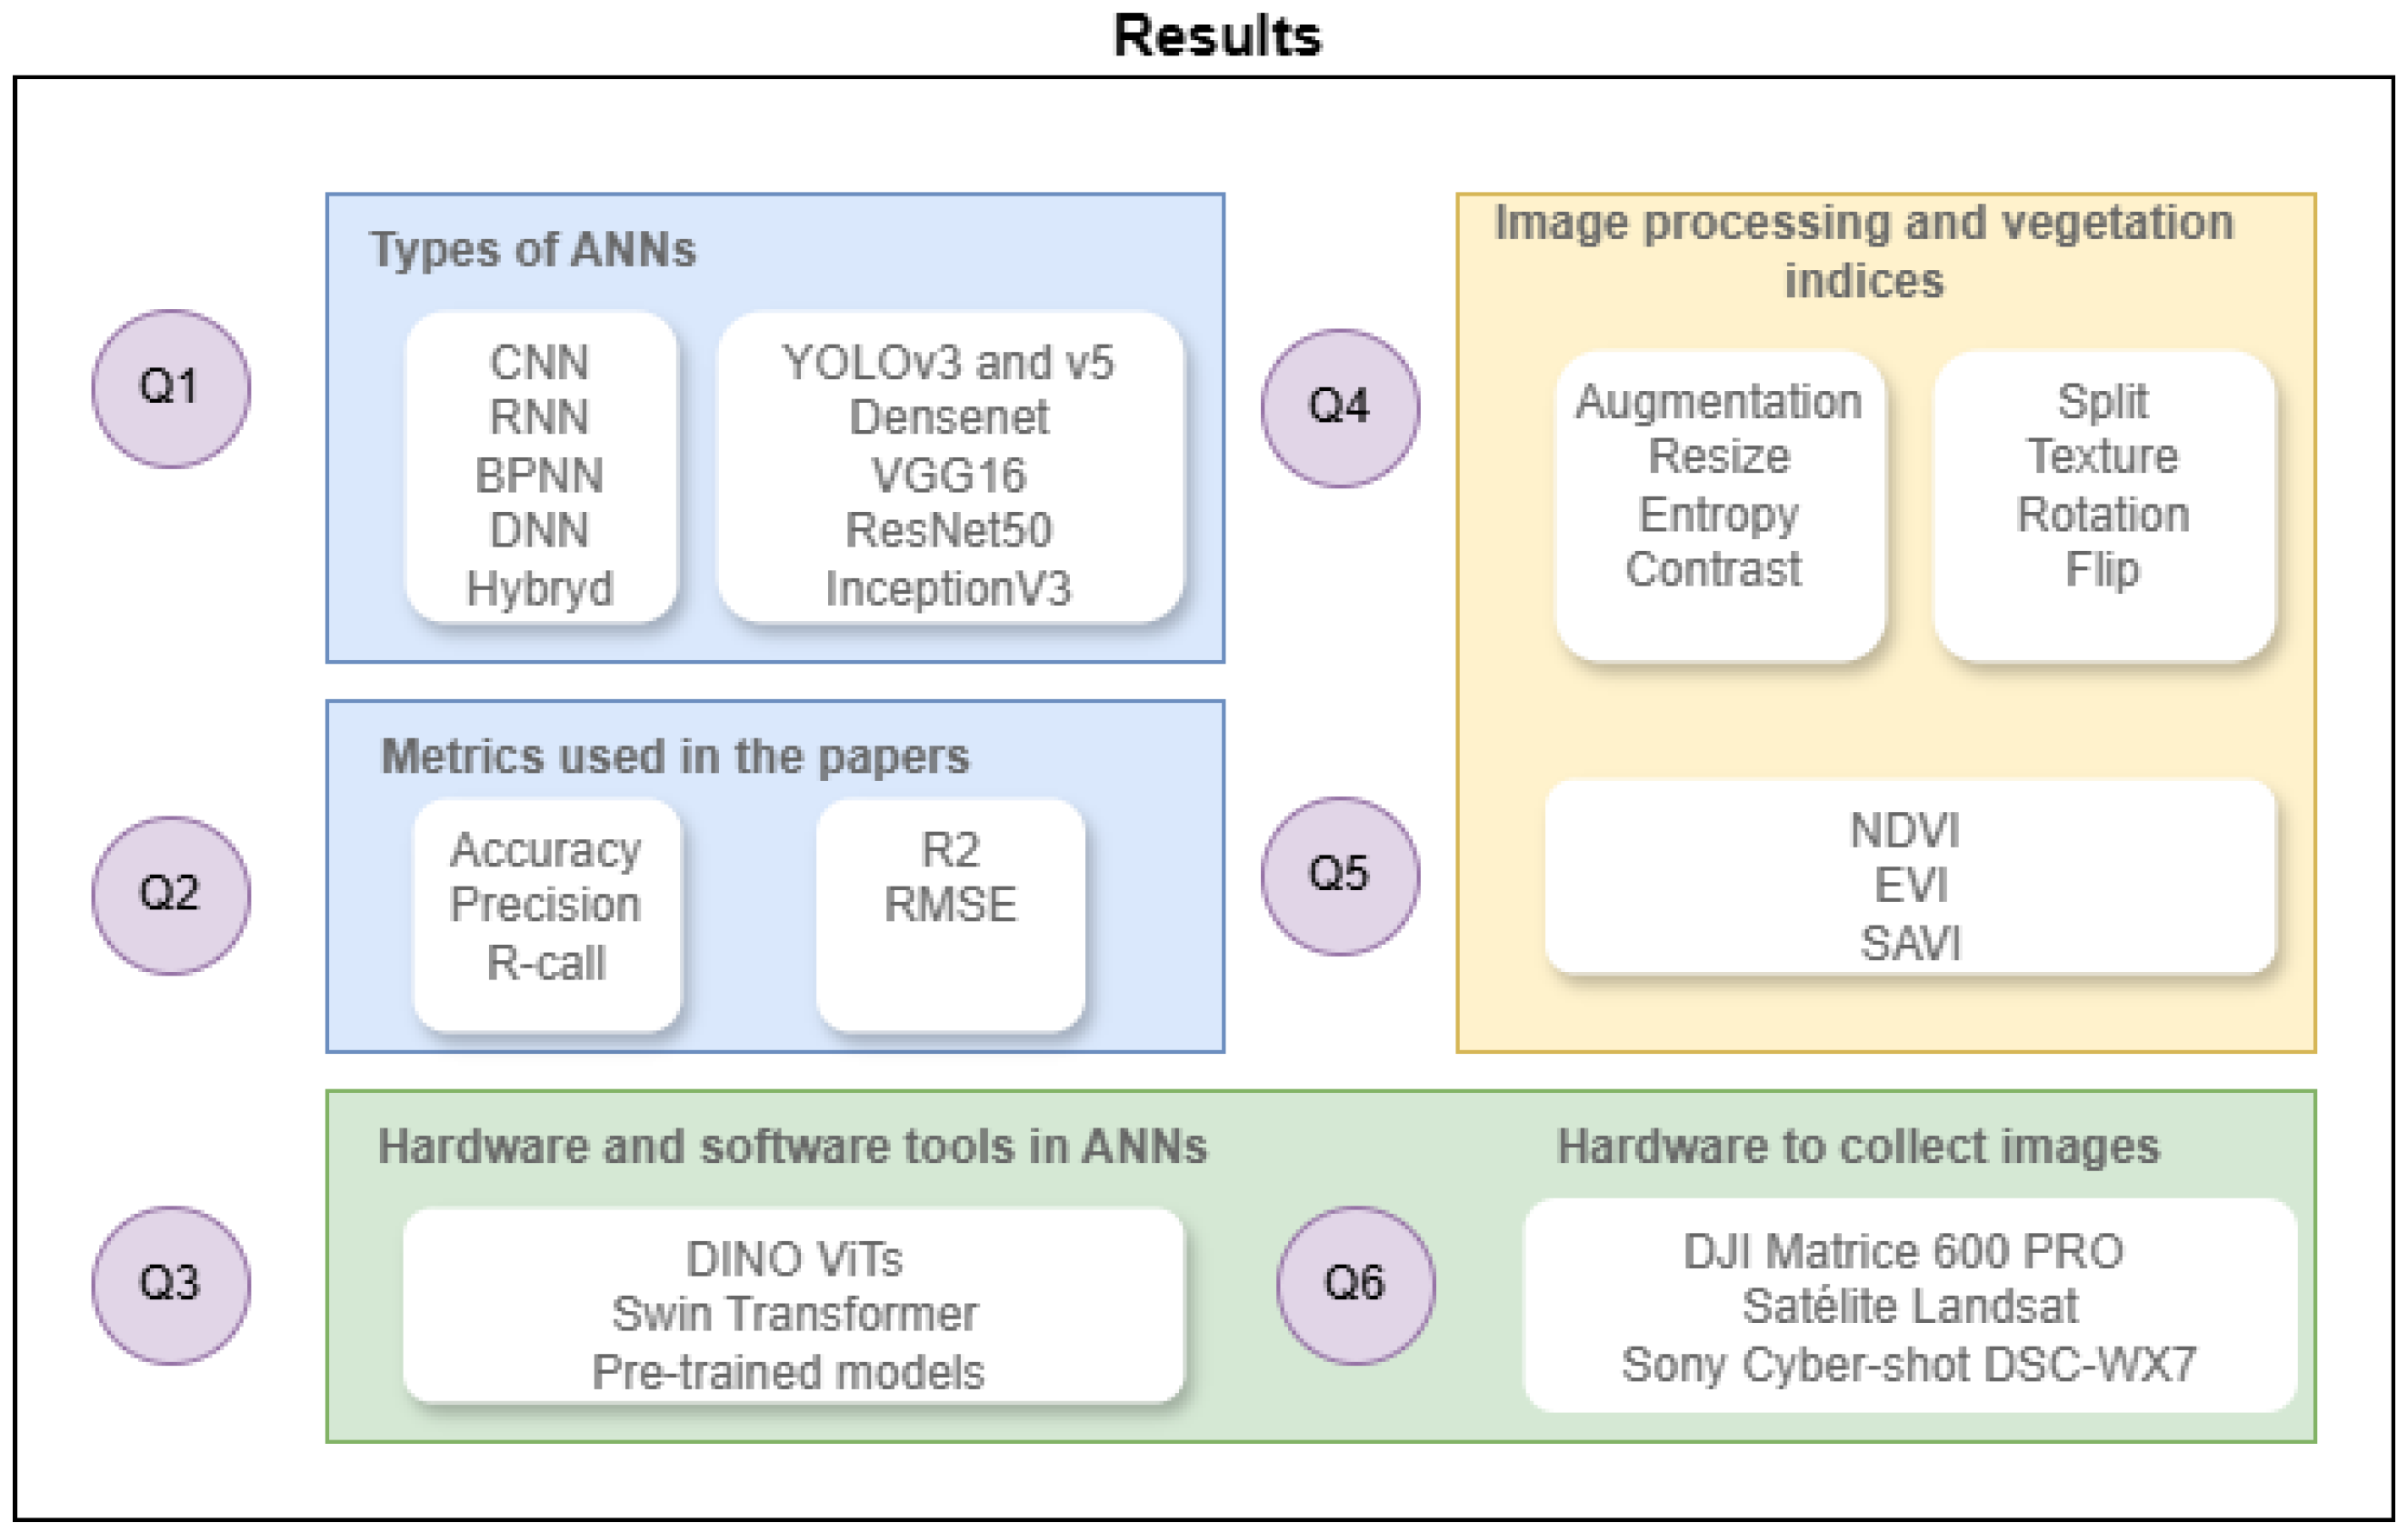
- Q1. What types of ANNs are most frequently used to detect the status of mango, apple, lemon, and coffee crops?
- Q2. What are the performance evaluation metrics of ANNs in predicting the status of each fruit or crop product?
- Q3. Which hardware and software tools have been used to implement ANNs for predicting and monitoring crop status in agriculture?
- Q4. How are images prepared and processed for input into ANNs?
- Q5. What vegetation indices have been calculated using ANNs in mango, apple, lemon, and coffee crops?
- Q6. Which hardware tools or devices are used to collect images for datasets?
2.1.1. Search Strategy
- Type of Crop: The kind of agricultural product studied or analyzed (mango, apple, lemon, or coffee).
- Device for Image Processing: The equipment used to capture or analyze images, such as drones, cameras, or satellites.
- Computer Vision Task: The specific goal of analyzing images, such as classification, segmentation, or object detection.
- Artificial Neural Network Architecture: The specific design or structure of the neural network, including layers, nodes, and connections.
2.1.2. Selected Journals and Conferences
2.2. Study Selection Criteria
2.2.1. Inclusion Criteria
- IC1: Articles focused on fruit crops such as apples, mangoes, lemons, or coffee. These crops were selected because of their economic importance and frequent use in studies involving ANNs for agricultural monitoring.
- IC2: Studies that involve the application of ANNs for analyzing crop health, predicting maturity, or calculating vegetation indices.
- IC3: Research articles published between 2019 and 2024 to ensure the inclusion of recent advancements in precision agriculture.
- IC4: Peer-reviewed articles in the domains of agriculture, computer science, or engineering to maintain high-quality and relevant sources.
- IC5: The literature that includes information on how images are processed to use the images in ANNs.
2.2.2. Exclusion Criteria
- EC1: Studies that do not use ANNs as part of their methodology for crop monitoring or analysis.
- EC2: Articles that do not involve selected crops (apple, mango, lemon, or coffee) or focus on other unrelated agricultural products.
- EC3: Publications such as opinion papers, editorials, or conference abstracts that lack a detailed methodology or experimental results.
- EC4: Publications that do not mention image processing.
2.3. Study Quality Assessment
2.4. Data Extraction
- The title, authors, journal or conference, and publication details (year, country, and reference);
- The article database where it was found;
- The topic area;
- The problem to be solved;
- Objectives;
- Methods used to provide a solution;
- Results.
2.5. Data Synthesis and Quality Verification
3. Results
3.1. Methods for Classification and Segmentation
3.2. Image Features
3.3. Mathematical Methods
3.3.1. Residual Predictive Deviation (RPD)
3.3.2. Particle Swarm Optimization (PSO)
3.3.3. Chicken Swarm Optimization (CSO)
3.3.4. Discriminant Score
3.3.5. Discrete Fourier Transform (DFT)
3.3.6. Monte Carlo
3.3.7. Multicount Measurement Classification and Recognition
3.3.8. Principal Component Analysis (PCA)
3.3.9. Land Surface Temperature (LST)
3.3.10. Shannon Entropy
3.4. Fruit Harvest Using Artificial Neural Networks
3.5. Image Augmentation
Identified Techniques for Image Processing
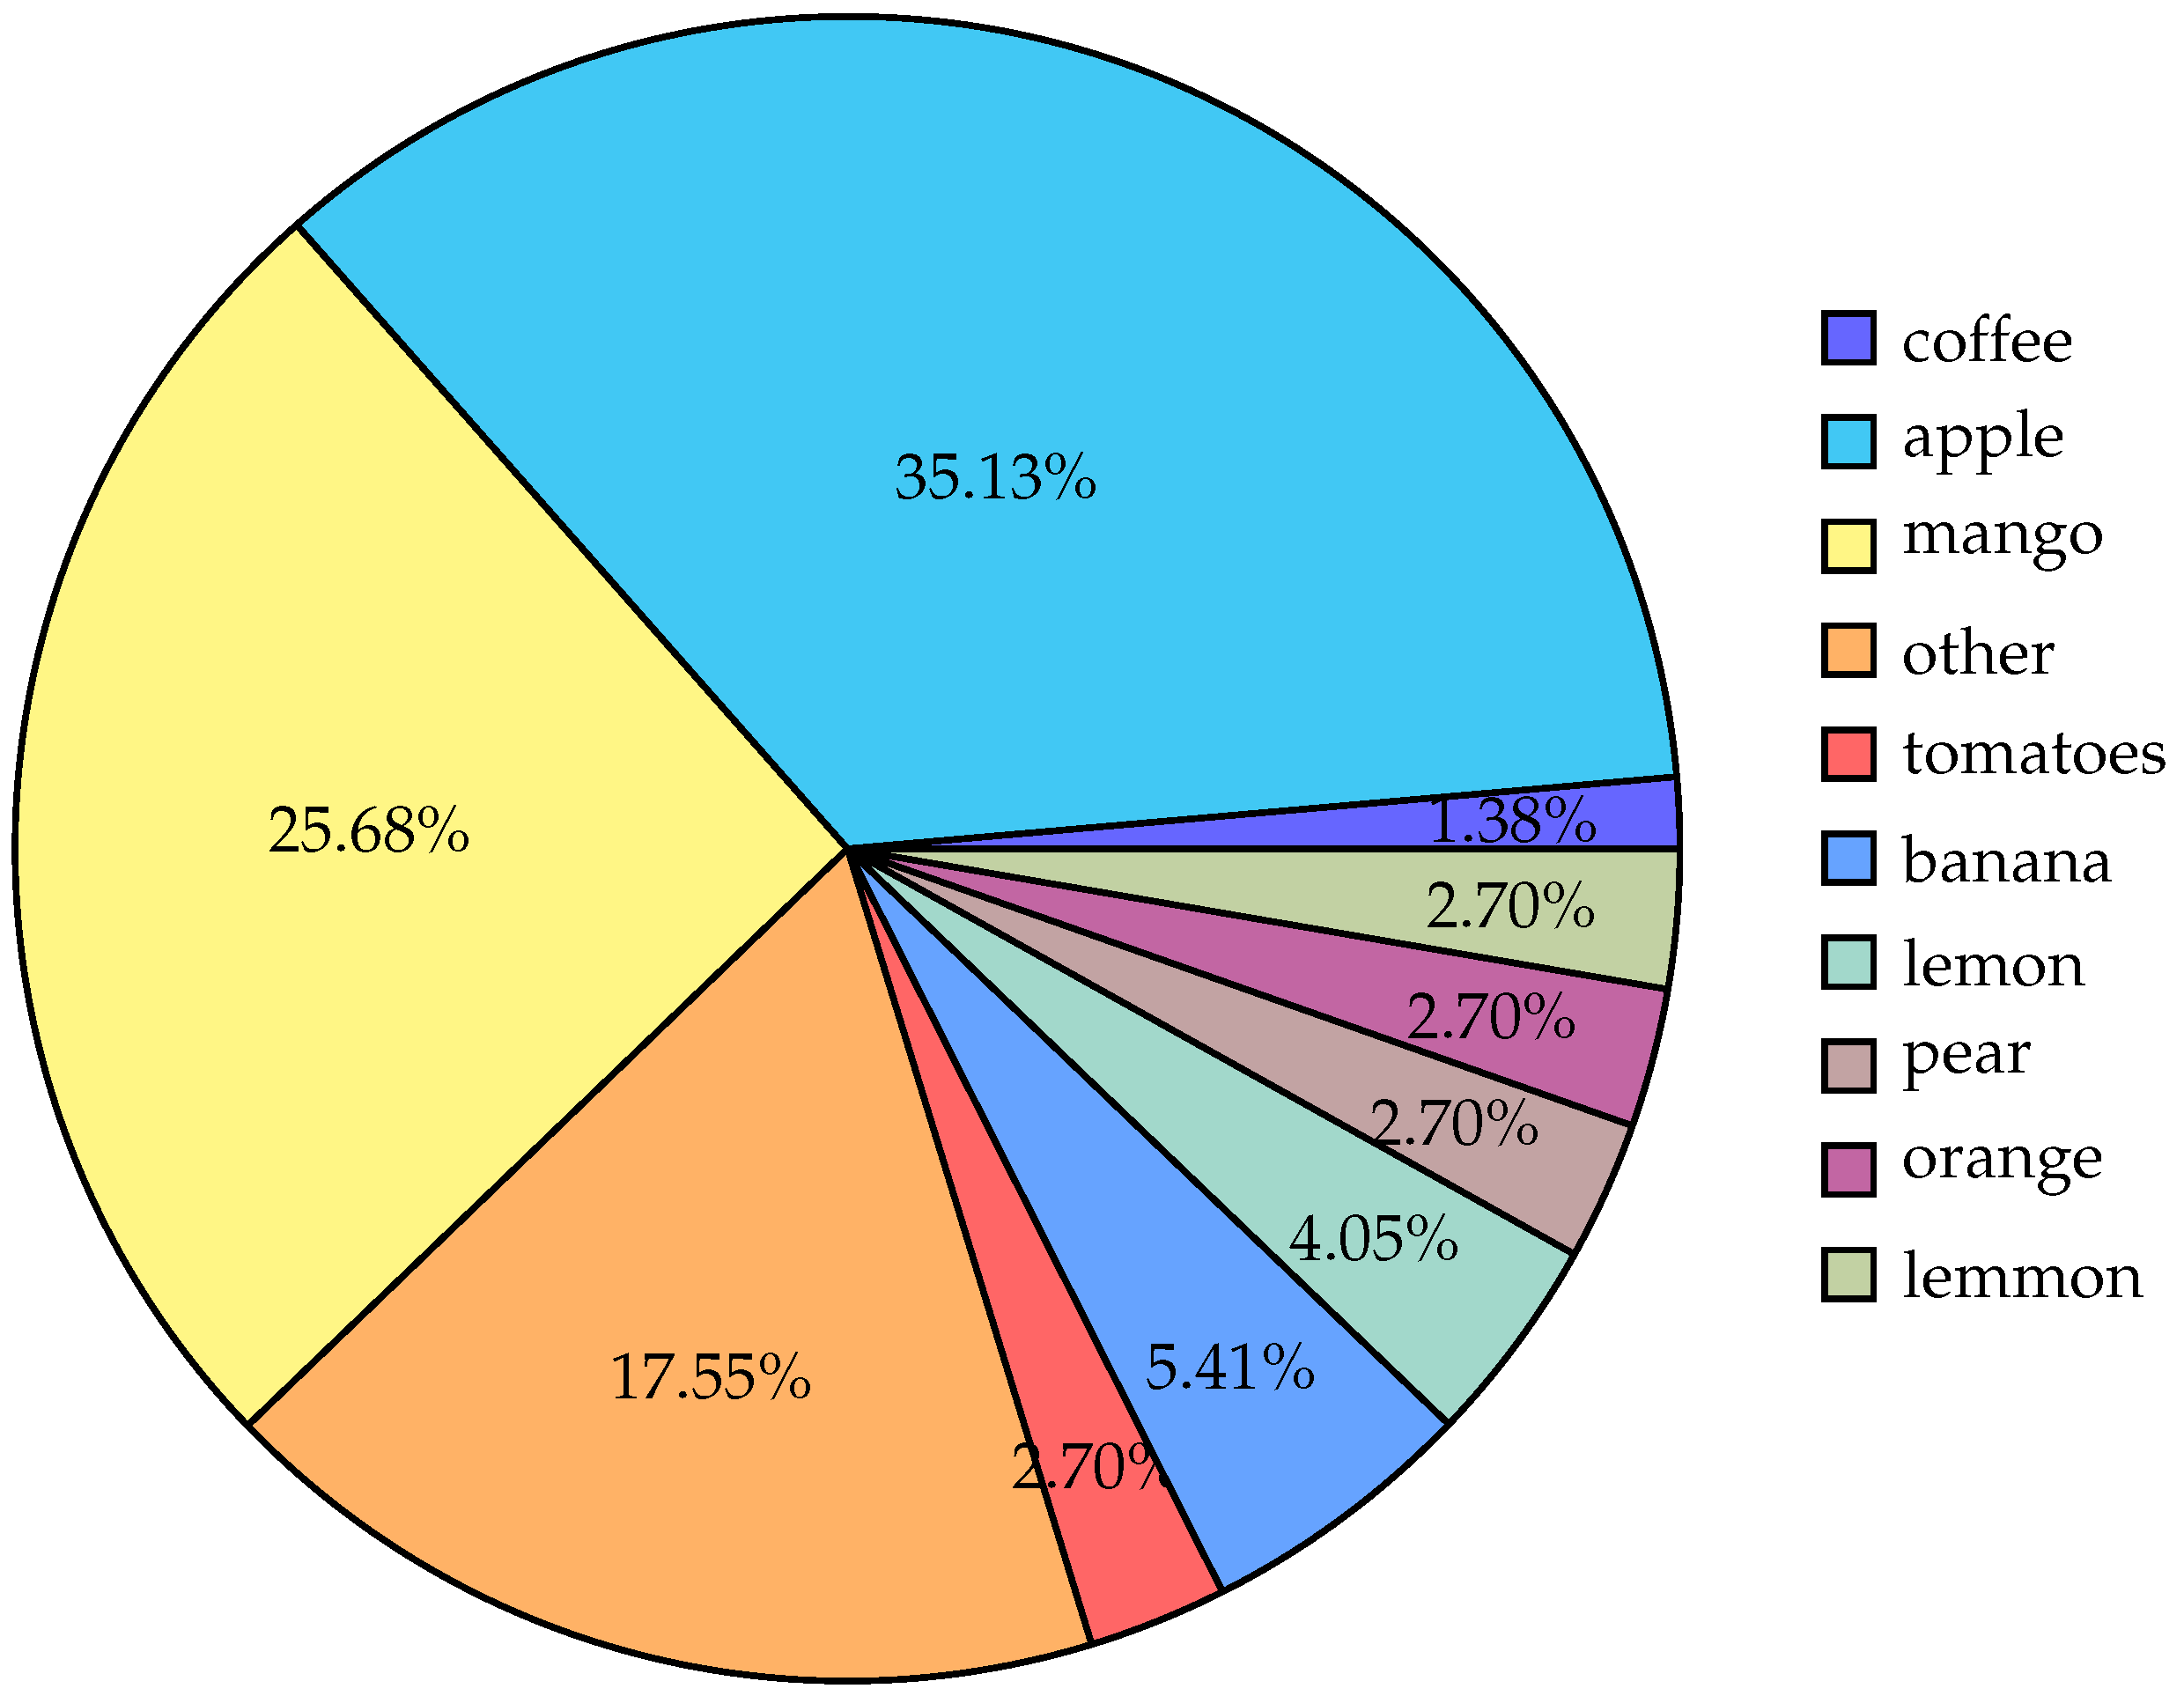
3.6. Type of Crops
3.7. Calculating Vegetation Index
3.8. Software and Hardware in Artificial Neural Networks in Crops
3.9. Common ANN Architectures and Models
3.9.1. MobileNetV2 [31]
- MobileNetV2 uses depthwise separable convolutions to reduce computational complexity.
- A standard 2D convolution with kernel is factored into
- It includes inverted residual blocks with linear bottlenecks, designed to reduce parameters while preserving representational capacity.
3.9.2. VGG16 [26,27,57,58,59]
- VGG16 is characterized by sequential 3 × 3 convolutions with fixed spatial padding and ReLU activations.
- Each layer transforms an input feature map viawhere is a nonlinear activation function (ReLU).
3.9.3. ResNet50 [23,59]
- ResNet50 introduces skip connections (or residual connections) to combat vanishing gradients and enable very deep architectures.
- The residual block can be written aswhere is a stack of convolution, batch normalization and ReLU layers.
3.9.4. Inception V3 [58]
- Inception V3 uses inception modules that factorize convolutions into parallel paths with different kernel sizes (e.g., ) and then concatenate their outputs along the channel dimension.
- Mathematically, for an inception block with k parallel paths, the following applies:where ⨁ denotes concatenation along channels.
3.9.5. ThinNet [60]
- ThinNet is a family of lightweight CNNs focusing on channel reduction or factorized convolutions to reduce computation.
- It may use techniques similar to depthwise separable convolutions or group convolutions to achieve smaller parameter counts while maintaining accuracy.
3.9.6. Faster R-CNN [54]
- A Faster R-CNN is a two-stage object detection architecture.
- Stage 1: The Region Proposal Network (RPN) predicts candidate bounding boxes, where represents objectness probabilities and represents bounding-box coordinates.
- Stage 2: It classifies the proposals and refines their coordinates.
3.9.7. Mask R-CNN [51,54]
- A Mask R-CNN extends a Faster R-CNN with a third branch for instance segmentation.
- It adds a -style head for predicting the segmentation mask of an object within each detected bounding box.
3.9.8. YOLOv3 [61] and YOLOv5 [62]
- YOLOv3 and YOLOv5 are single-stage detection architectures designed to perform object localization and classification simultaneously, providing bounding boxes and associated class probabilities.
- They operate on multiple scale levels, detecting objects of varying sizes efficiently.
- Each detection scale generates feature maps through convolutional layers (Conv2D), predicting anchor boxes as follows:where the following applies:
- –
- denotes the objectness probabilities and class probabilities.
- –
- represents bounding-box coordinate adjustments at the corresponding scale level.
- –
- indicates the input feature map generated by the backbone network at scale ℓ.
3.9.9. DenseNet [63]
- DenseNet uses dense connections: each layer takes as input all the feature maps of preceding layers.
- If are previous feature maps, the ℓ-th layer output iswhere denotes concatenation and F is a convolution-based transformation.
- : the value of the feature map at a value position for the c output channel.
- : the value of the input feature map at spatial position for the d input channel.
- : the value of the convolutional filter (or kernel) at position for the d input channel and c output channel.
- : the bias added to the c output channel.
- : model parameters.
- : learning rate.
- : the gradient of the loss function with respect to parameter .
3.10. Metrics for Evaluating the Artificial Neural Networks
3.10.1. R-Squared ()
- : the observed value for the i-th data point.
- : the predicted value for the i-th data point from the regression model.
- : the mean of all observed values.
3.10.2. Root Mean Square Error (RMSE)
- n: the total number of data points.
- : the observed values for the i-th data point.
- : the predicted value for the i-th data point.
3.10.3. Acccuracy
- : true positives.
- : true negatives.
- : false positives.
- : false negatives.
3.10.4. Precision, Recall and F1-Score
- : true positives.
- : false negatives.
- : true positives.
- : false positives.
3.11. Input Data Dimensionality and Dataset Sizes
3.12. Training and Validation Methodologies
3.13. Model Hyperparameters and Architecture Details
4. Discussion
4.1. Using Customized Datasets
4.2. Indices Not Related to Ripeness and Quality of Fruits
4.3. Infrared Images as a Better Dataset to Improve Detection
4.4. Machine Learning Architectures Designed for Robotic Purposes
4.5. Standarized Evaluation Metrics
4.6. Integration of Hardware and Software
4.7. Discussion on the Complexity of Approaches
4.8. Recommendations According to the Results
- Post harvest
- –
- Crop type. At this point, it is recommended to use a single crop type to calculate fruit quality, primarily regarding apples and mangoes, which have been studied the most.
- –
- Artificial Neural Network. It is recommended to use a CNN-type neural network, which is used in a model to calculate the condition of the fruit based on previously taken photos. Preprocessing should be focused on generating rotations, as the fruit could be in different positions or have extra elements around it, which could lead to incorrect predictions.
- –
- Pretrained model. It is recommended to use Yolo v3 as the results of the selected studies show good accuracy.
- –
- Image processing technology. Because these types of studies are designed to be carried out on conveyor belts or in containers, it is recommended to use a professional camera that allows you to take photos to take pictures. This device must have an internet connection to upload the image to the cloud. In this sense, image resizing and texture techniques must be applied to transfer the image to the model and achieve good results.
- In harvest
- –
- Crop type. Due to the shape of the fruit, it is best to use a single crop type in the study. Due to size, it was evident that apples and mangoes are the best to study. Lemons and coffee are smaller in size, so these crop types could make it difficult to calculate the fruit’s state.
- –
- Artificial Neural Network. Much work has been carried out with CNNs. It is recommended to use CNNs to calculate the fruit’s state, performing image preprocessing to classify the fruit’s ripeness.
- –
- Pretrained Model. ResNet-50 is used to classify ripeness based on color changes. However, YOLO v5 could be used as long as adjustments are made to calculate fruit size, since we identified that YOLO has good results, while taking into account the size and shape of the fruit.
- –
- Image processing technology. It is recommended to take spectral images with drones to determine the overall condition of the crop using the NDVI. To calculate the condition of individual fruits, photos can be taken manually with a camera. Otherwise, an approach must be created where a drone is trained to fly from fruit to fruit and takes photos of them. This means that a model is needed to determine if it is a fruit and for the drone to generate a flight path, and another model is needed to calculate the condition of the fruit.
4.9. Reliability and Significance of Reported Results
5. Future Work
5.1. Generate New Literature Review
5.2. New Approaches in Crop Monitoring
- Using ANNs. We want to use Convolutional Neural Networks to detect the state of fruits. A dataset with images of fruits in different states (ripe, unripe, healthy, and damaged) could be created. In addition, we want to calculate the vegetation index with aerial images to have a complete analysis of the crop. So, with the vegetation index, we can calculate the diseases, physical damage, and water deficit. This combination of looking at each fruit with neural networks and generally the crop with the vegetation index would give us a complete approach to industrializing the crop and measuring its quality.
- Multiple types of crops in the analysis. In most cases, researchers focused on a single type of crop. Therefore, it is necessary to have an approach that can analyze different types of crops. In this way, a complete solution can be provided. However, this is a challenge because there would be several types of problems that the neural network must solve.
6. Conclusions
Author Contributions
Funding
Institutional Review Board Statement
Informed Consent Statement
Data Availability Statement
Conflicts of Interest
Abbreviations
| ANN | Artificial Neural Network |
| BPNN | Backpropagation neural network |
| CNN | Convolutional neural networks |
| GAN | Generative adversarial network |
| MLP | Multilayer Perceptron |
| SVM | Support Vector Machine |
| UAV | Unmanned aerial vehicle |
| YOLO | You Only Look Once |
References
- Sood, S.; Singh, H. Computer vision and machine learning based approaches for food security: A review. Multimed. Tools Appl. 2021, 80, 27973–27999. [Google Scholar] [CrossRef]
- Jararweh, Y.; Fatima, S.; Jarrah, M.; AlZu’bi, S. Smart and sustainable agriculture: Fundamentals, enabling technologies, and future directions. Comput. Electr. Eng. 2023, 110, 108799. [Google Scholar] [CrossRef]
- Singh, B.K.; Delgado-Baquerizo, M.; Egidi, E.; Guirado, E.; Leach, J.E.; Liu, H.; Trivedi, P. Climate change impacts on plant pathogens, food security and paths forward. Nat. Rev. Microbiol. 2023, 21, 640–656. [Google Scholar] [CrossRef] [PubMed]
- Chin, R.; Catal, C.; Kassahun, A. Plant disease detection using drones in precision agriculture. Precis. Agric. 2023, 24, 1663–1682. [Google Scholar] [CrossRef]
- Havlin, J.; Heiniger, R. Soil fertility management for better crop production. Agronomy 2020, 10, 1349. [Google Scholar] [CrossRef]
- Benos, L.; Moysiadis, V.; Kateris, D.; Tagarakis, A.C.; Busato, P.; Pearson, S.; Bochtis, D. Human–robot interaction in agriculture: A systematic review. Sensors 2023, 23, 6776. [Google Scholar] [CrossRef]
- Zhao, S.; Liu, J.; Bai, Z.; Hu, C.; Jin, Y. Crop pest recognition in real agricultural environment using convolutional neural networks by a parallel attention mechanism. Front. Plant Sci. 2022, 13, 839572. [Google Scholar] [CrossRef]
- Zhang, W.; Chen, G.; Zhuang, P.; Zhao, W.; Zhou, L. CATNet: Cascaded attention transformer network for marine species image classification. Expert Syst. Appl. 2024, 256, 124932. [Google Scholar] [CrossRef]
- Saqib, M.A.; Aqib, M.; Tahir, M.N.; Hafeez, Y. Towards deep learning based smart farming for intelligent weeds management in crops. Front. Plant Sci. 2023, 14, 1211235. [Google Scholar] [CrossRef]
- Ghanei Ghooshkhaneh, N.; Mollazade, K. Optical techniques for fungal disease detection in citrus fruit: A review. Food Bioprocess Technol. 2023, 16, 1668–1689. [Google Scholar] [CrossRef]
- Ngugi, H.N.; Akinyelu, A.A.; Ezugwu, A.E. Machine Learning and Deep Learning for Crop Disease Diagnosis: Performance Analysis and Review. Agronomy 2024, 14, 3001. [Google Scholar] [CrossRef]
- Zhang, W.; Li, Z.; Li, G.; Zhuang, P.; Hou, G.; Zhang, Q.; Li, C. GACNet: Generate adversarial-driven cross-aware network for hyperspectral wheat variety identification. IEEE Trans. Geosci. Remote Sens. 2023, 62, 5503314. [Google Scholar] [CrossRef]
- Zhang, W.; Li, Z.; Sun, H.H.; Zhang, Q.; Zhuang, P.; Li, C. SSTNet: Spatial, spectral, and texture aware attention network using hyperspectral image for corn variety identification. IEEE Geosci. Remote Sens. Lett. 2022, 19, 5514205. [Google Scholar] [CrossRef]
- Folorunso, O.; Ojo, O.; Busari, M.; Adebayo, M.; Joshua, A.; Folorunso, D.; Ugwunna, C.O.; Olabanjo, O.; Olabanjo, O. Exploring machine learning models for soil nutrient properties prediction: A systematic review. Big Data Cogn. Comput. 2023, 7, 113. [Google Scholar] [CrossRef]
- Mkhatshwa, J.; Kavu, T.; Daramola, O. Analysing the performance and interpretability of CNN-based architectures for plant nutrient deficiency identification. Computation 2024, 12, 113. [Google Scholar] [CrossRef]
- Glória, A.; Cardoso, J.; Sebastião, P. Sustainable irrigation system for farming supported by machine learning and real-time sensor data. Sensors 2021, 21, 3079. [Google Scholar] [CrossRef]
- Oliveira, R.C.d.; Silva, R.D.d.S.e. Artificial intelligence in agriculture: Benefits, challenges, and trends. Appl. Sci. 2023, 13, 7405. [Google Scholar] [CrossRef]
- Unigarro, C.; Florez, H. RGB Image Reconstruction for Precision Agriculture: A Systematic Literature Review. In Proceedings of the International Conference on Applied Informatics, Vina del Mar, Chile, 24–26 October 2024; Springer: Cham, Switzerland, 2024; pp. 211–227. [Google Scholar]
- Rodríguez, Y.; Huérfano, A.; Yepes-Calderon, F.; McComb, J.G.; Florez, H. Cerebrospinal Fluid Containers Navigator. A Systematic Literature Review. In Proceedings of the International Conference on Computational Science and Its Applications, Malaga, Spain, 4–7 July 2022; Springer: Cham, Switzerland, 2022; pp. 340–351. [Google Scholar]
- Gupta, R.; Kaur, M.; Garg, N.; Shankar, H.; Ahmed, S. Lemon Diseases Detection and Classification using Hybrid CNN-SVM Model. In Proceedings of the 2023 Third International Conference on Secure Cyber Computing and Communication (ICSCCC), Jalandhar, India, 26–28 May 2023; pp. 326–331. [Google Scholar]
- Govindharaj, I.; Thapliyal, N.; Manwal, M.; Kukreja, V.; Sharma, R. Enhancing Mango Quality Evaluation: Utilizing an MLP Model for Five-Class Severity Grading. In Proceedings of the 2024 International Conference on Innovations and Challenges in Emerging Technologies (ICICET), Nagpur, India, 7–8 June 2024; pp. 1–4. [Google Scholar]
- Ghodeswar, U.; Puri, C.; Shingade, S.; Waware, T.; Ladhe, A.; Durge, T. Sorting of Fresh and Damaged Apple Fruits using Machine Learning Approach. In Proceedings of the 2024 5th International Conference for Emerging Technology (INCET), Belgaum, India, 24–26 May 2024; pp. 1–4. [Google Scholar]
- Dakwala, K.; Shelke, V.; Bhagwat, P.; Bagade, A.M. Evaluating performances of various CNN architectures for multi-class classification of rotten fruits. In Proceedings of the 2022 Sardar Patel International Conference on Industry 4.0-Nascent Technologies and Sustainability for’Make in India’Initiative, Mumbai, India, 22–23 December 2022; pp. 1–4. [Google Scholar]
- Ahmed, I.; Yadav, P.K. Predicting Apple Plant Diseases in Orchards Using Machine Learning and Deep Learning Algorithms. SN Comput. Sci. 2024, 5, 700. [Google Scholar] [CrossRef]
- Admass, W.S.; Munaye, Y.Y.; Bogale, G.A. Convolutional neural networks and histogram-oriented gradients: A hybrid approach for automatic mango disease detection and classification. Int. J. Inf. Technol. 2024, 16, 817–829. [Google Scholar] [CrossRef]
- Bezabh, Y.A.; Ayalew, A.M.; Abuhayi, B.M.; Demlie, T.N.; Awoke, E.A.; Mengistu, T.E. Classification of mango disease using ensemble convolutional neural network. Smart Agric. Technol. 2024, 8, 100476. [Google Scholar] [CrossRef]
- Bhavya, K.; Raja, S.P. Fruit quality prediction using deep learning strategies for agriculture. Int. J. Intell. Syst. Appl. Eng. 2023, 11, 301–310. [Google Scholar]
- Singh, S.; Gupta, I.; Gupta, S.; Koundal, D.; Aljahdali, S.; Mahajan, S.; Pandit, A.K. Deep learning based automated detection of diseases from Apple leaf images. Comput. Mater. Contin. 2022, 71, 1849–1866. [Google Scholar]
- Shi, H.; Wang, Z.; Peng, H.; Jiang, J. Application Research of Non-destructive Detection of Apple Sugar Content Based on Convolution Neural Network. In Proceedings of the 2023 5th International Conference on Electronics and Communication, Network and Computer Technology (ECNCT), Guangzhou, China, 18–20 August 2023; pp. 168–171. [Google Scholar]
- Jayaweera, S.; Sewwandi, P.; Tharaka, D.; Pallewatta, P.; Halloluwa, T.; Wickramasinghe, M.; Karunanayaka, K.; Arachchi, S.M. MangoDB-A TJC Mango Dataset for Deep-Learning-Based on Classification and Detection in Precision Agriculture. In Proceedings of the 2024 4th International Conference on Advanced Research in Computing (ICARC), Belihuloya, Sri Lanka, 21–24 February 2024; pp. 115–120. [Google Scholar]
- Kona, M.S.R.; Guvvala, A.; Eedara, V.V.L.; Gowri, M.S.; Aluri, V. Mango Fruit Defect Detection Using MobileNetV2. In Proceedings of the 2024 International Conference on Emerging Innovations and Advanced Computing (INNOCOMP), Sonipat, India, 25–26 May 2024; pp. 22–27. [Google Scholar]
- Li, W.; Zhu, X.; Yu, X.; Li, M.; Tang, X.; Zhang, J.; Xue, Y.; Zhang, C.; Jiang, Y. Inversion of nitrogen concentration in apple canopy based on UAV hyperspectral images. Sensors 2022, 22, 3503. [Google Scholar] [CrossRef] [PubMed]
- Peng, W.; Ren, Z.; Wu, J.; Xiong, C.; Liu, L.; Sun, B.; Liang, G.; Zhou, M. Qualitative and Quantitative Assessments of Apple Quality Using Vis Spectroscopy Combined with Improved Particle-Swarm-Optimized Neural Networks. Foods 2023, 12, 1991. [Google Scholar] [CrossRef]
- Kumari, N.; Dwivedi, R.K.; Bhatt, A.K.; Belwal, R. Automated fruit grading using optimal feature selection and hybrid classification by self-adaptive chicken swarm optimization: Grading of mango. Neural Comput. Appl. 2022, 34, 1285–1306. [Google Scholar] [CrossRef]
- Ashok, V.; Bharathi, R.; Shivakumara, P. Building a Medium Scale Dataset for Non-destructive Disease Classification in Mango Fruits Using Machine Learning and Deep Learning Models. Int. J. Image Graph. Signal Process. 2023, 15, 83–95. [Google Scholar] [CrossRef]
- Guo, Z.; Zou, Y.; Sun, C.; Jayan, H.; Jiang, S.; El-Seedi, H.R.; Zou, X. Nondestructive determination of edible quality and watercore degree of apples by portable Vis/NIR transmittance system combined with CARS-CNN. J. Food Meas. Charact. 2024, 18, 1–16. [Google Scholar] [CrossRef]
- Lian, J.; Ma, L.; Wu, X.; Zhu, T.; Liu, Q.; Sun, Y.; Mei, Z.; Ning, J.; Ye, H.; Hui, G.; et al. Visualized pattern recognition optimization for apple mechanical damage by laser relaxation spectroscopy. Int. J. Food Prop. 2023, 26, 1566–1578. [Google Scholar] [CrossRef]
- Dhiman, B.; Kumar, Y.; Hu, Y.C. A general purpose multi-fruit system for assessing the quality of fruits with the application of recurrent neural network. Soft Comput. 2021, 25, 9255–9272. [Google Scholar] [CrossRef]
- Francis, J.; Disney, M.; Law, S. Monitoring canopy quality and improving equitable outcomes of urban tree planting using LiDAR and machine learning. Urban For. Urban Green. 2023, 89, 128115. [Google Scholar] [CrossRef]
- Neyns, R.; Efthymiadis, K.; Libin, P.; Canters, F. Fusion of multi-temporal PlanetScope data and very high-resolution aerial imagery for urban tree species mapping. Urban For. Urban Green. 2024, 99, 128410. [Google Scholar] [CrossRef]
- Rayed, M.E.; Akib, A.A.; Alfaz, N.; Niha, S.I.; Islam, S.S. A vision transformer-based approach for recognizing seven prevalent mango leaf diseases. In Proceedings of the 2023 26th International Conference on Computer and Information Technology (ICCIT), Cox’s Bazar, Bangladesh, 13–15 December 2023; pp. 1–6. [Google Scholar]
- Mir, T.A.; Gupta, S.; Malhotra, S.; Devliyal, S.; Banerjee, D.; Chythanya, K.R. Hybrid CNN-SVM System for Multiclass Detection of Apple Leaf Diseases. In Proceedings of the 2024 IEEE International Conference on Information Technology, Electronics and Intelligent Communication Systems (ICITEICS), Bangalore, India, 28–29 June 2024; pp. 1–6. [Google Scholar]
- Huang, Y.; Wang, J.; Li, N.; Yang, J.; Ren, Z. Predicting soluble solids content in “Fuji” apples of different ripening stages based on multiple information fusion. Pattern Recognit. Lett. 2021, 151, 76–84. [Google Scholar] [CrossRef]
- Liu, Y.; Jiang, L.; Kong, L.; Xiang, Q.; Liu, X.; Chen, G. Wi-Fruit: See through fruits with smart devices. Proc. ACM Interact. Mob. Wearable Ubiquitous Technol. 2021, 5, 1–29. [Google Scholar] [CrossRef]
- Watnakornbuncha, D.; Am-Dee, N.; Sangsongfa, A. Adaptive Deep Learning with Optimization Hybrid Convolutional Neural Network and Recurrent Neural Network for Prediction Lemon Fruit Ripeness. Prz. Elektrotech. 2024, 2024, 202–211. [Google Scholar] [CrossRef]
- Magro, R.B.; Alves, S.A.M.; Gebler, L. Computational models in Precision Fruit Growing: Reviewing the impact of temporal variability on perennial crop yield assessment. SN Comput. Sci. 2023, 4, 554. [Google Scholar] [CrossRef]
- Awotunde, J.B.; Misra, S.; Obagwu, D.; Florez, H. Multiple colour detection of RGB images using machine learning algorithm. In Proceedings of the International Conference on Applied Informatics, Arequipa, Peru, 27–29 October 2022; Springer: Cham, Switzerland, 2022; pp. 60–74. [Google Scholar]
- Kumar, S.; Shwetank, S.; Jain, K. Development of spectral signature of land cover and feature extraction using artificial neural network model. In Proceedings of the 2021 International Conference on Computing, Communication, and Intelligent Systems (ICCCIS), Greater Noida, India, 19–20 February 2021; pp. 113–118. [Google Scholar]
- Farjon, G.; Huijun, L.; Edan, Y. Deep-learning-based counting methods, datasets, and applications in agriculture: A review. Precis. Agric. 2023, 24, 1683–1711. [Google Scholar] [CrossRef]
- Knott, M.; Perez-Cruz, F.; Defraeye, T. Facilitated machine learning for image-based fruit quality assessment. J. Food Eng. 2023, 345, 111401. [Google Scholar] [CrossRef]
- Xiao, B.; Nguyen, M.; Yan, W.Q. Fruit ripeness identification using transformers. Appl. Intell. 2023, 53, 22488–22499. [Google Scholar] [CrossRef]
- Das, D.H.; Dey Roy, S.; Dey, S.; Saha, P.; Bhowmik, M.K. A novel self-attention guided deep neural network for bruise segmentation using infrared imaging. Innov. Syst. Softw. Eng. 2024, 20, 1–9. [Google Scholar] [CrossRef]
- Afsar, M.M.; Bakhshi, A.D.; Hussain, E.; Iqbal, J. A deep learning-based framework for object recognition in ecological environments with dense focal loss and occlusion. Neural Comput. Appl. 2024, 36, 9591–9604. [Google Scholar] [CrossRef]
- Mirbod, O.; Choi, D.; Heinemann, P.H.; Marini, R.P.; He, L. On-tree apple fruit size estimation using stereo vision with deep learning-based occlusion handling. Biosyst. Eng. 2023, 226, 27–42. [Google Scholar] [CrossRef]
- Bongulwar, D.M.; Singh, V.P.; Talbar, S. Evaluation of CNN based on Hyperparameters to Detect the Quality of Apples. Int. J. Eng. Trends Technol. 2022, 70, 232–246. [Google Scholar] [CrossRef]
- Huang, Y.; Ren, Z.; Li, D.; Liu, X. Phenotypic techniques and applications in fruit trees: A review. Plant Methods 2020, 16, 2–22. [Google Scholar] [CrossRef]
- Sadhana, T.; RJ, A.K.; Bhavani, S.; BN, S.K. Fruit Quality Identification Using Deep LearningTechniques. In Proceedings of the 2022 Fourth International Conference on Emerging Research in Electronics, Computer Science and Technology (ICERECT), Mandya, India, 26–27 December 2022; pp. 1–4. [Google Scholar]
- Goel, D.; Singh, D.; Gupta, A.; Yadav, S.P.; Sharma, M. An Efficient Approach For To Predict The Quality Of Apple Through Its Appearance. In Proceedings of the 2023 International Conference on Computer, Electronics & Electrical Engineering & Their Applications (IC2E3), Srinagar Garhwal, India, 8–9 June 2023; pp. 1–6. [Google Scholar]
- Sharma, G.; Singh, A.; Jain, S. Hybrid deep learning techniques for estimation of daily crop evapotranspiration using limited climate data. Comput. Electron. Agric. 2022, 202, 107338. [Google Scholar]
- Sundaram, K.M.; Shankar, T.; Reddy, N.S. An efficient fruit quality monitoring and classification using convolutional neural network and fuzzy system. Int. J. Eng. Syst. Model. Simul. 2024, 15, 20–26. [Google Scholar] [CrossRef]
- Karthikeyan, M.; Subashini, T.; Srinivasan, R.; Santhanakrishnan, C.; Ahilan, A. YOLOAPPLE: Augment Yolov3 deep learning algorithm for apple fruit quality detection. Signal Image Video Process. 2024, 18, 119–128. [Google Scholar] [CrossRef]
- Chandak, M.; Rawat, S. Hyperspectral Imaging Technique to Analyse Fruit Quality Using Deep Learning: Apple Perspective. Int. J. Intell. Syst. Appl. Eng. 2024, 12, 114–123. Available online: https://ijisae.org/index.php/IJISAE/article/view/4797 (accessed on 5 May 2024).
- Zhao, M.; You, Z.; Chen, H.; Wang, X.; Ying, Y.; Wang, Y. Integrated Fruit Ripeness Assessment System Based on an Artificial Olfactory Sensor and Deep Learning. Foods 2024, 13, 793. [Google Scholar] [CrossRef]
- Sannidhan, M.; Martis, J.E.; Suhas, M.; Sunil Kumar Aithal, S. Predicting Citrus Limon Maturity with Precision Using Transfer Learning. In Proceedings of the 2023 International Conference on Recent Advances in Information Technology for Sustainable Development (ICRAIS), Manipal, India, 6–7 November 2023; pp. 182–187. [Google Scholar]
- Arivalagan, D.; Nikitha, P.; Manoj, G.; Jeevanantham, C.; Vignesh, O. Intelligent Fruit Quality Assessment Using CNN Transfer Learning Techniques. In Proceedings of the 2024 International Conference on Distributed Computing and Optimization Techniques (ICDCOT), Bengaluru, India, 15–16 March 2024; pp. 1–6. [Google Scholar]
- Hasanzadeh, B.; Abbaspour-Gilandeh, Y.; Soltani-Nazarloo, A.; Hernández-Hernández, M.; Gallardo-Bernal, I.; Hernández-Hernández, J.L. Non-destructive detection of fruit quality parameters using hyperspectral imaging, multiple regression analysis and artificial intelligence. Horticulturae 2022, 8, 598. [Google Scholar] [CrossRef]
- Kaur, A.; Sharma, R.; Thapliyal, N.; Aeri, M. Improving Mango Quality Assessment: A Multi-Layer Perceptron Approach for Grading. In Proceedings of the 2024 2nd World Conference on Communication & Computing (WCONF), Raipur, India, 12–14 July 2024; pp. 1–4. [Google Scholar]
- Meléndez, A.S.; Burry, L.S.; Palacio, P.I.; Trivi, M.E.; Quesada, M.N.; Freire, V.Z.; D’Antoni, H. Ecosystems dynamics and environmental management: An NDVI reconstruction model for El Alto-Ancasti mountain range (Catamarca, Argentina) from 442 AD through 1980 AD. Quat. Sci. Rev. 2024, 324, 108450. [Google Scholar] [CrossRef]
- Zhang, C.; Valente, J.; Kooistra, L.; Guo, L.; Wang, W. Orchard management with small unmanned aerial vehicles: A survey of sensing and analysis approaches. Precis. Agric. 2021, 22, 2007–2052. [Google Scholar] [CrossRef]
- Pan, L.; Wu, W.; Hu, Z.; Li, H.; Zhang, M.; Zhao, J. Updating apple Vis-NIR spectral ripeness classification model based on deep learning and multi-seasonal database. Biosyst. Eng. 2024, 245, 164–176. [Google Scholar] [CrossRef]
- Tan, W.K.; Husin, Z.; Yasruddin, M.L.; Ismail, M.A.H. Development of a non-destructive fruit quality assessment utilizing odour sensing, expert vision and deep learning algorithm. Neural Comput. Appl. 2024, 36, 19613–19641. [Google Scholar] [CrossRef]

| Filter | Years Interval | Query |
|---|---|---|
| Scopus | 2019–2024 | TITLE-ABS-KEY (“neural networks”) AND ((TITLE-ABS-KEY (“fruit ripeness” OR “harvest prediction” OR “crop maturity detection” OR “fruit quality”)) OR (TITLE-ABS-KEY(“NDVI” OR “EVI” OR “SAVI”))) AND TITLE-ABS-KEY (“apple” OR “coffee” OR “lemon” OR “mango”) AND PUBYEAR > 2019 AND PUBYEAR < 2025 AND DOCTYPE (ar) AND (LIMIT-TO (SUBJAREA,“AGRI”) OR LIMIT-TO (SUBJAREA,“COMP”) OR LIMIT-TO (SUBJAREA,“ENGI”)) |
| Science Direct | 2019–2024 | (“neural networks” AND ((“fruit ripeness” OR “harvest prediction” OR “crop maturity detection” OR “fruit quality”) OR (“NDVI” OR “EVI” OR “SAVI”)) Year: 2019–2026) |
| Springer Link | 2019–2024 | “neural networks” AND (“fruit ripeness” OR “harvest prediction” OR “crop maturity detection” OR “fruit quality”) AND (“NDVI” OR “EVI” OR “SAVI”) AND (“apple” OR “coffee” OR “lemon” OR “mango”) |
| IEEE Explore | 2019–2024 | ((“neural networks”) AND ((“fruit ripeness” OR “harvest prediction” OR “crop maturity detection” OR “fruit quality”) OR (“NDVI” OR “EVI” OR “SAVI”)) AND (“apple” OR “coffee” OR “lemon” OR “mango”)) |
| Database | Retrieved | Selected |
|---|---|---|
| Scopus | 52 | 30 |
| IEEE Xplore | 37 | 19 |
| Science Direct | 56 | 6 |
| Springer Link | 11 | 10 |
| Total | 156 | 65 |
| Module | Basic type | Definition |
|---|---|---|
| Train data | Input | This module focuses on collecting and preparing the data used to train the ANN. It includes labeled datasets of images representing crops and their respective states (e.g., maturity, quality). |
| Neural network architecture | Processing | This module defines the design and structure of the neural networks, including the number of layers, activation functions, and connection strategies tailored for agricultural image processing. |
| Image preprocessing | Input | This module involves preparing the images for neural network input, such as resizing, filtering, and augmentation to enhance learning and reduce noise. |
| Vegetation indices | Feature extraction | This module computes indices like NDVI, EVI, and SAVI from images to enhance the representation of crop health and maturity levels. |
| Hardware and devices | Acquisition | This module discusses the tools and devices (e.g., drones, cameras, satellites) used for capturing the images required for the analysis. |
| Evaluation metrics | Output | This module focuses on defining the metrics used to evaluate the performance of the neural networks, such as accuracy, precision, recall, and F1-score. |
| Prediction and monitoring | Output | This module focuses on how the trained models are used to predict crop maturity, detect diseases, or estimate yield, providing actionable insights for farmers. |
| Module | Quality Criteria |
|---|---|
| Training data | VC1. The dataset includes labeled images relevant to the selected crops (mango, apple, lemon, or coffee). VC2. The dataset covers diverse environmental conditions to ensure model generalizability. VC3. The data are balanced to avoid bias in training the neural networks. |
| Neural network architecture | VC1. The architecture is explicitly described, including the number of layers, activation functions, and optimization techniques. VC2. The choice of architecture (e.g., CNNs, GANs, transformers) is justified based on the problem being addressed. VC3. The architecture incorporates techniques to mitigate overfitting, such as dropout or regularization. |
| Image preprocessing | VC1. The preprocessing steps, such as resizing, normalization, and augmentation, are clearly detailed. VC2. The preprocessing techniques align with best practices for neural network training. |
| Hardware and devices | VC1. The hardware used for image acquisition (e.g., drones, cameras) is specified. VC2. The resolution and quality of the captured images are appropriate for the intended analysis. |
| Evaluation metrics | VC1. The evaluation process includes both training and validation datasets. |
| Prediction and monitoring | VC1. The models provide insights for farmers, such as predicting fruit ripeness or detecting crop diseases. VC2. The prediction outputs are validated with real-world data. VC3. The monitoring solutions are scalable and practical for agricultural use. |
| Stage | Description |
|---|---|
| Image Acquisition | Images of fruits are captured using RGB cameras, hyperspectral cameras, drones, or professional cameras. |
| Preprocessing | Techniques such as resizing, color normalization, rotation, segmentation, and data augmentation are applied to improve image quality. |
| Feature Extraction | Convolutional layers detect textures, edges, and patterns associated with fruit ripeness. Pretrained models like ResNet, DenseNet, or MobileNet are used for this. |
| Classification or Prediction | Fully connected layers (Softmax) or algorithms like SVM are used to predict fruit ripeness in categories or continuous values. |
| Post-Processing and Decision Making | Alerts for harvesting are generated, data are integrated into agricultural databases, and automated harvesting systems are activated. |
| Paper | Type of ANN or Model | Metrics | Values |
|---|---|---|---|
| [32] | BPNN (Back Propagation Neural Network) | Section 3.10.1, RMSE Section 3.10.2 | 0.77, 0.16 |
| [33] | SDSG-PCA-BPNN | Accuracy Section 3.10.3 | 87.88% |
| [24,25,27,28,34,35,50,54,60] | CNN | Accuracy Section 3.10.3 | 91.52%, 83.17%, 92.00%, 99.00%, 99.5%, 90.00%, 94.79%, 99.20% |
| [43] | SAE-BPNN | Section 3.10.1, RMSE Section 3.10.2 | 0.5953, 0.8856% |
| [44] | Light ANN + Visual Fusion | RMSE Section 3.10.2 | 0.319 |
| [50] | Pre-Trained Vision Transformer (ViT) | Accuracy Section 3.10.3 | 95.0% |
| [66] | Neural network feed-forward (trained with LM) | Section 3.10.1, RMSE Section 3.10.2 | 0.93, 0.03 |
| [67] | MLP (Multilayer Perceptron) | Accuracy Section 3.10.3 | 95.0% |
| [36] | CARS-CNN | Accuracy Section 3.10.3 | 9.43% |
| [38] | RNN | Accuracy Section 3.10.3, Precision Section 3.10.4, Recall Section 3.10.4 | 98.47%, 98.93%, 75.44% |
| [55] | CNN-LSTM | Accuracy Section 3.10.3 | 96.08% |
| [61] | YOLO v3 | Precision Section 3.10.4 | 99.13% |
| [62] | YOLO v5 | Precision Section 3.10.4 | 95.00% |
| [23] | RestNet50 | Accuracy Section 3.10.3 | 98.27% |
| [23] | VGG | Accuracy Section 3.10.3 | 98.41% |
| [63] | DenseNet | Accuracy Section 3.10.3 | 97.39% |
| Approach | Advantages | Disadvantages | Level of Complexity |
|---|---|---|---|
| MobileNetV2 | Lightweight, fast inference | Lower accuracy than deeper models | Low |
| ResNet | Handles vanishing gradients well | Computationally expensive | High |
| VGG | Simple architecture, good accuracy | Large number of parameters, slow | High |
| Yolo v3 | Fast object detection | Lower accuracy for small objects | Medium |
| Yolo v5 | Optimized, lightweight | Requires retraining for custom datasets | Medium |
| Densenet | Efficient parameter usage, improved feature reuse | High memory consumption | High |
| CNN | Effective for image tasks | Requires large datasets | Medium |
| RNN | Good for sequential data | Struggles with long dependencies | Medium |
| DPNN | Robust feature extraction | High computational cost | High |
| DNN | General-purpose, scalable | Requires careful tuning | Medium |
Disclaimer/Publisher’s Note: The statements, opinions and data contained in all publications are solely those of the individual author(s) and contributor(s) and not of MDPI and/or the editor(s). MDPI and/or the editor(s) disclaim responsibility for any injury to people or property resulting from any ideas, methods, instructions or products referred to in the content. |
© 2025 by the authors. Licensee MDPI, Basel, Switzerland. This article is an open access article distributed under the terms and conditions of the Creative Commons Attribution (CC BY) license (https://creativecommons.org/licenses/by/4.0/).
Share and Cite
Unigarro, C.; Hernandez, J.; Florez, H. Artificial Neural Networks for Image Processing in Precision Agriculture: A Systematic Literature Review on Mango, Apple, Lemon, and Coffee Crops. Informatics 2025, 12, 46. https://doi.org/10.3390/informatics12020046
Unigarro C, Hernandez J, Florez H. Artificial Neural Networks for Image Processing in Precision Agriculture: A Systematic Literature Review on Mango, Apple, Lemon, and Coffee Crops. Informatics. 2025; 12(2):46. https://doi.org/10.3390/informatics12020046
Chicago/Turabian StyleUnigarro, Christian, Jorge Hernandez, and Hector Florez. 2025. "Artificial Neural Networks for Image Processing in Precision Agriculture: A Systematic Literature Review on Mango, Apple, Lemon, and Coffee Crops" Informatics 12, no. 2: 46. https://doi.org/10.3390/informatics12020046
APA StyleUnigarro, C., Hernandez, J., & Florez, H. (2025). Artificial Neural Networks for Image Processing in Precision Agriculture: A Systematic Literature Review on Mango, Apple, Lemon, and Coffee Crops. Informatics, 12(2), 46. https://doi.org/10.3390/informatics12020046