Abstract
Cross-platform mobile application development has gained significant traction in recent years, driven by the growing demand for efficient, cost-effective solutions that cater to both iOS and Android platforms. This paper presents a state-of-the-art review of cross-platform mobile application development, emphasizing the industry trends, framework popularity, and adoption in the job market. By analyzing developer preferences, community engagement, and market demand, this study provides a comprehensive overview of how cross-platform mobile development frameworks shape the mobile development landscape. The research employs a data-driven methodology, drawing insights from three key categories: Developer Sentiment and Survey Data, Community Engagement and Usage Data, and Market Adoption and Job Market Data. By analyzing these factors, the study identifies the key challenges and emerging trends shaping cross-platform mobile application development. It assesses the most widely used frameworks, comparing their strengths and weaknesses in real-world applications. Furthermore, the research examines the industry adoption patterns and the presence of these frameworks in job market trends. Unlike earlier research, which included now-obsolete platforms like Windows Phone and frameworks such as Xamarin, this study is tailored to the current cross-platform mobile application development market landscape. The conclusions offer actionable insights for developers and researchers, equipping them with the knowledge needed to navigate the evolving cross-platform mobile application development ecosystem effectively.
1. Introduction
The rapid expansion of the global mobile application market presents both unique opportunities and substantial challenges for developers. With the market size projected to grow by USD 2.63 trillion from 2025 to 2029, driven by a compound annual growth rate (CAGR) of 31.1% [1], mobile app development has become a cornerstone of modern business and consumer engagement. As the number of smartphones continues to rise and the Internet of Things (IoT) becomes increasingly integrated into daily life, the demand for cross-platform mobile applications has surged. However, the inherent challenges, ranging from performance optimization to cost management, make the development process complex. Despite these challenges, adopting cross-platform mobile application development frameworks (CMADFs) has proven to be a critical strategy for reducing costs, improving efficiency, and delivering high-quality applications across both iOS and Android ecosystems.
The existing literature on hybrid mobile app development primarily focuses on early-generation frameworks and addresses the challenges of building applications for now-obsolete platforms such as Windows Phone, BlackBerry OS, or Symbian. However, as the mobile market dynamics have shifted and Windows Phone and other obsolete platforms have been phased out, much of this literature has become outdated. Most of the current research neglects to address the evolving industry focus on iOS and Android, the dominant operating systems accounting for 99.5% of the global market share (Q4 2024: Android 72.04%, iOS 27.49%) [2]. Additionally, the emergence of frameworks like Flutter (2017) and React Native (2015) has introduced new challenges and opportunities that need to be systematically analyzed. Empirical data from industry reports and real-world scenarios can offer a more comprehensive understanding of the current landscape.
A recent systematic review [3] of secondary studies, such as systematic reviews (SRs) and systematic mapping studies (SMSs) in mobile app software engineering, aimed to provide an overview and analysis of these secondary studies to assist researchers and practitioners. The review covered 24 secondary studies addressing various software engineering phases, with a strong emphasis on testing and design. The key research topics included usability evaluation, test automation, context-aware testing, and cloud-based development. Notably, the study highlighted an increasing focus on architectural design models and intelligent mobile applications. However, it also identified significant research gaps, particularly in areas such as software evolution, maintenance, and cross-platform mobile application development, underscoring the need for further exploration in this domain.
One of the critical challenges in cross-platform mobile application development is ensuring optimal performance while maintaining access to platform-specific features. Unlike hybrid solutions such as Apache Cordova or Ionic, which rely on WebView-based rendering and often suffer from performance limitations, frameworks like React Native, Flutter, and .NET MAUI (hereinafter referred to as MAUI) generate code that runs closer to native execution [4,5]. This shift reflects the current industry trend as developers and organizations increasingly favor natively compiled solutions for better performance, stability, and user experience. As a result, traditional hybrid approaches have seen a decline in relevance, with many businesses transitioning to frameworks that offer deeper integration with native platforms and broader industry adoption.
By narrowing our scope to frameworks that produce native binaries, we aim to evaluate solutions that optimize performance, maintainability, and developer experience in modern mobile application development. This study integrates recent market data and technological advancements to provide a comprehensive analysis of the contemporary mobile development landscape. By systematically evaluating cross-platform mobile development solutions, it aims to offer developers a structured framework for informed decision-making. Additionally, it seeks to guide researchers in identifying and prioritizing the most relevant frameworks and approaches for further investigation.
Based on the current state of cross-platform mobile application development, we focused on Flutter, React Native, and MAUI as these are the predominant frameworks according to various industry surveys [6]. This study aims to analyze the key trends related to the popularity, desirability, and adoption of these frameworks, as well as their correlation with job demand and industry usage. By leveraging multiple data sources, including developer surveys (Stack Overflow and JetBrains), job postings (Hacker News), and GitHub platform repository metrics, this research provides a data-driven comparison of these leading technologies.
To achieve this, we focus on the following research questions:
- RQ1. How do most commonly used cross-platform mobile application development frameworks compare in terms of popularity, developer interest, and long-term developer satisfaction within the developer community?
- -
- H1a. There is a significant difference in popularity between the most commonly used cross-platform mobile application development frameworks.
- -
- H1b. There is a significant difference in developer interest between the most commonly used cross-platform mobile application development frameworks.
- -
- H1c. There is a significant difference in long-term developer satisfaction between the most commonly used cross-platform mobile application development frameworks.
- RQ2. Is there a difference in job demand between the most commonly used cross-platform mobile application development frameworks based on job posting data?
- -
- H2. There is a difference in job demand between the most commonly used cross-platform mobile application development frameworks.
- RQ3. Does a higher level of framework popularity influence the number of job postings for that framework?
- -
- H3. Higher measured popularity of a cross-platform mobile application development framework correlates with an increase in job postings.
By addressing these questions and hypotheses, this study aims to provide actionable insights into the evolving cross-platform mobile application development landscape.
The rest of this article is structured as follows: Section 2 provides an overview of the research background, discussing the evolution of cross-platform mobile application development frameworks (CMADFs), their key characteristics, and their impact on the mobile development landscape. Section 3 outlines the research methodology, detailing the data sources, collection strategies, and analytical techniques employed in this study. Section 4 presents the results, including the findings on developer sentiment, community engagement, and job market adoption trends for CMADFs. Section 5 explains the statistical analysis methodology used to evaluate the differences between frameworks and test the research hypotheses. Section 6 discusses the implications of the results, offering insights into the relative strengths and adoption patterns of the selected CMADFs. Section 7 concludes the study by summarizing the key findings, addressing the limitations, and, finally, Section 8 provides directions for future research.
2. Research Background
The popularity of mobile devices, including cell phones, smartphones, and tablets, has steadily increased over the years [7]. As their significance has grown, so has the number of available applications. As of August 2024, Google Play featured over 2.2 million apps, while the Apple App Store hosted approximately 2 million, highlighting the rapid expansion of the mobile application market [8]. Consequently, the development of mobile applications has evolved significantly, leading to the emergence of various frameworks and approaches for cross-platform and native mobile application development.
In fast-paced environments where timely market entry is crucial, leveraging Write Once, Run Anywhere (WORA) mobile development tools offers significant advantages over developing separate native applications for each platform [9]. Native development demands more time, effort, and resources to support multiple operating systems, making it less ideal for scenarios where rapid deployment is essential. This is particularly relevant for early-stage startups, whose primary goal is to build a Minimum Viable Product (MVP) within a short timeframe. In such cases, where efficiency, cost-effectiveness, and cross-platform compatibility are key factors, developers often prefer CMADFs over native approaches [10].
CMADFs have emerged as strong alternatives to native development for Android and iOS, streamlining development, enabling simultaneous deployment across multiple platforms, and reducing implementation costs. The increasing reliance on mobile devices over traditional computers has driven extensive research into different development approaches and frameworks. Studies highlight how evolving paradigms accommodate diverse operating systems, devices, and screen resolutions, focusing on balancing performance, usability, and cost-effectiveness.
According to Khachouch et al. [11], developers must consider existing operating systems, SDKs, and rapidly evolving mobile technologies when choosing an approach. Failing to align application demands with the appropriate development strategy can result in project failure. Early review studies and surveys related to this matter mostly compared different cross-platform mobile application development approaches [12,13,14,15]. Those early studies managed to identify different approaches for developing cross-platform mobile applications that focused on enabling developers to create applications that could run on multiple mobile operating systems using a single codebase. Various approaches emerged, each with distinct advantages and limitations [11,12,13]:
- Native Development focuses on building applications specifically for a particular platform (e.g., iOS or Android) using platform-specific languages and SDKs. While this approach provides optimal performance and user experience, it requires separate codebases for different platforms, increasing development costs and time.
- The Web Approach relies on technologies like HTML, CSS, and JavaScript to create applications that run in mobile browsers. While this method was easy to develop and maintain, with no need for installation, it had limitations such as restricted access to native features, slower performance, and dependency on an active internet connection.
- The Hybrid Approach combines web technologies with native containers like Cordova or Ionic, allowing apps to be installed on devices and access to native features via plugins. This enabled distribution through app stores and leveraged web development skills, but performance issues, complex debugging, and inconsistent user experience remained challenges.
- The Interpreted Approach uses a common language like JavaScript, which was interpreted at runtime to generate native components. This provided native user interfaces and access to APIs but introduced performance overhead and reliance on the development environment, potentially limiting access to new platform features.
- The Cross-Compiled Approach involves transforming code written in a common language into native code for each platform using cross-compilers like Xamarin. This method achieved near-native performance and full access to native features but required platform-specific adjustments, resulted in larger app sizes, and had a learning curve for developers.
- The Cloud-Based Approach relies on cloud computing to provide backend services, reducing the dependency on local storage and processing power.
- Finally, the Model-Driven Approach allows developers to describe applications at a high level using models that generate platform-specific code. While this provided native performance, efficient memory use, and faster initialization, it was constrained by the application domain of the model language and often required manual completion of platform-specific features.
Gerges and Elgalb [16] further elaborated on these paradigms, particularly focusing on native, hybrid, web, and Progressive Web Apps (PWAs). They emphasized how native development offers high performance but lacks cross-platform efficiency, leading to the development of web apps aimed at solving native limitations. Hybrid apps attempt to merge the benefits of both native and web applications. At the same time, PWAs serve as an innovative solution bridging the gap between the two by leveraging service workers and modern web technologies.
Parallel to the evolution of development approaches, several more studies [4,17,18,19] have explored the capabilities and trade-offs of various CMADFs, evaluating their performance, development efficiency, and suitability for different application scenarios. Some of the most widely studied frameworks include the following:
- Ionic: A hybrid development framework based on Angular and Apache Cordova, allowing developers to create cross-platform mobile applications using web technologies (HTML, CSS, or JavaScript) [4,18,19].
- Xamarin: A Microsoft-owned framework that enables cross-platform mobile application development using C# and .NET, allowing it to compile applications to native code for both iOS and Android, which makes it a preferred choice for enterprise applications [17,18].
- React Native: A JavaScript framework developed by Meta (formerly known as Facebook) that allows developers to write native-like applications using React components. It combines JavaScript and JSX with native components, providing a balance between performance and flexibility, making it ideal for applications requiring a native-like experience [4].
- Flutter: A UI toolkit by Google that leverages the Dart programming language and its Skia graphics engine, allowing for high-performance applications with custom UI elements and smooth animations [19].
- PhoneGap/Cordova: A framework that enables hybrid app development by wrapping web-based applications in a native shell, allowing access to device features [9].
These frameworks play a crucial role in modern application development by offering various trade-offs in performance, ease of use, and platform coverage. As more frameworks emerge dedicated to cross-platform mobile application development, more studies are focusing on the transition from developing native mobile applications to developing cross-platform mobile applications using such frameworks. The authors in [20] analyzed several frameworks, like Adobe PhoneGap, Apache Cordova, Xamarin, React Native, and Ionic, by focusing more on the comparison between developing native mobile applications and developing cross-platform mobile applications.
Another related study [9] conducted similar research with more detailed focus on comparing and evaluating CMADFs based on their features, structures, and suitability for different types of cross-platform mobile application development. Their conclusions highlight that Flutter is overall the best choice among all the CMADFs, combining the advantages of the development tools from other approaches.
A couple of studies [4,17] performed a comparison of CMADFs from a performance perspective. At the time of their writing, Flutter and Xamarin achieved near-native execution by compiling directly to native code, whereas React Native, despite being performant, was noted for potential delays due to the JavaScript bridge. Similarly, Ionic, which relied on WebView, was reported to face performance limitations, particularly in graphically intensive applications.
The development experience varies as well [4]. Flutter, React Native, and Ionic offer rapid iteration through hot reload capabilities, while Xamarin, due to its more complex setup, requires a longer initial configuration. UI customization is a strong point for Flutter and React Native, whereas Ionic is more web-centric, and Corona SDK focuses on game-oriented graphics.
A more recent study [21] examined Kotlin Multiplatform, a relatively new cross-platform solution that has gained notable industry traction, particularly following Google’s official support for using it to share business logic between Android and iOS [22]. The authors demonstrated its growing maturity, especially with the introduction of Compose Multiplatform, and highlighted its near-native performance and expanding library support, including the migration of several Jetpack libraries. In addition to Kotlin Multiplatform, the study included a SWOT analysis of several other major frameworks, such as Flutter, Xamarin, .NET MAUI, React Native, NativeScript, and Electron, offering a comparative overview of their respective strengths and limitations. However, while the study provides broad comparisons and conceptual insights, it lacks quantitative benchmarks and real-world case studies that would more robustly validate its conclusions.
While many studies compare CMADFs, a critical gap remains: many focus on outdated frameworks or obsolete shortcomings. For instance, while Xamarin has since been deprecated in favor of MAUI [23], it continues to appear in comparative analyses as many of these studies were conducted before its deprecation and reflect its relevance at the time. This historical inclusion underscores the importance of contextualizing findings within the timeframe of each study, particularly as the ecosystem rapidly evolves. Similarly, React Native’s previous dependency on the JavaScript-to-native bridge has been eliminated in the New Architecture, replaced by the JavaScript Interface (JSI) for direct and efficient communication, resolving a formerly cited limitation. Furthermore, many studies rely on theoretical evaluations or simple test applications rather than real-world use cases. Our study aims to bridge this gap by investigating the current state of CMADFs from multiple perspectives, including Developer Sentiment and Survey Data, Community Engagement and Usage Data, and Market Adoption and Job Market Data. By integrating insights from industry reports and diverse sources, we seek to provide a comprehensive up-to-date analysis of the most effective frameworks for modern iOS and Android development. To maintain relevance, we omit WebView-based frameworks such as Ionic and deprecated tools like Xamarin, focusing instead on actively supported solutions that compile to native code.
Ultimately, this research will contribute to the evolving discourse by aligning theoretical knowledge with practical industry applications, ensuring that cross-platform mobile application development strategies remain relevant and efficient in the rapidly changing mobile landscape.
3. Methodology
In our pursuit of analyzing the latest trends in cross-platform mobile application development, we have focused our study on data from 2019 onwards. This decision is grounded in several key considerations:
- 1.
- Before 2019, the mobile development landscape was dominated by frameworks such as Cordova, Ionic, and Xamarin [20]. While instrumental during their time, these tools have seen a decline in usage with the advent of more performant native-like solutions. By concentrating on data from 2019 and beyond, we aim to eliminate the influence of these older technologies, ensuring our analysis reflects current practices and preferences.
- 2.
- The period starting in 2019 marks the introduction and adoption of modern declarative UI frameworks that have significantly influenced cross-platform mobile application development strategies:
- (a)
- Jetpack Compose for Android: Announced by Google in May 2019 [24], Jetpack Compose offers a Kotlin-based declarative approach to building native UIs. Its design facilitates seamless integration with existing Android apps, promoting a more efficient development process.
- (b)
- SwiftUI for iOS: Introduced by Apple in 2019 [25], SwiftUI provides a declarative framework for constructing UIs across all Apple platforms. Its introduction has streamlined UI development for iOS, macOS, watchOS, and tvOS, promoting code reuse and consistency.
Adopting these frameworks has encouraged developers to rethink their cross-platform mobile application development strategies, often leading to selecting tools and methodologies that align with the principles of declarative UI design.
3.1. Data Collection
Data were collected from three broad categories: Developer Sentiment and Survey Data, Community Engagement and Usage Data, and Market Adoption and Job Market Data. The sources, collection methodologies, and inherent scopes for each category are described below.
3.1.1. Developer Sentiment and Survey Data
The primary source of our developer sentiment analysis is the annual Stack Overflow Developer Survey, which reaches tens of thousands of developers worldwide and thus provides a demographically diverse sample. The survey includes both quantitative questions (e.g., “Which technology do you use?”) and qualitative inputs that capture the nuanced opinions of the developer community. Over the past six years, the survey has gathered responses from a significant number of developers globally, ranging from 65,000 to nearly 90,000 participants annually, covering 179 to 186 countries:
- 2024: 65,437 responses from 185 countries [26];
- 2023: 89,184 responses from 185 countries [27];
- 2022: 73,268 responses from 180 countries [28];
- 2021: 83,439 responses from 181 countries [29];
- 2020: 65,000 responses from 186 countries [30];
- 2019: 88,883 responses from 179 countries [31].
Our study focuses on three key sentiment metrics: popularity, desired, and admired.
- Popularity: This metric represents the current usage and adoption of a technology within the developer community. It provides a snapshot of how widely a technology is being used at a given time.
- Desired: This reflects the extent to which developers express a preference or intention to work with a particular technology in the future. It serves as an indicator of potential growth and future trends.
- Admired: This captures the level of respect, satisfaction, and positive sentiment that developers associate with a technology. It is indicative of the overall perception and advocacy within the community.
Throughout this paper, we adopt the updated terminology from the annual Stack Overflow Developer Survey. In older studies, the metric now referred to as “desired” was labeled as “wanted”, while the metric currently known as “admired” was previously termed “loved”. We have chosen to use the newer labels, i.e., “desired” to reflect developers’ aspirations for future technology adoption and “admired” to capture the level of respect and satisfaction associated with technology, since these terms more accurately represent the nuanced perspectives of the developer community. Consequently, our analysis and discussion will consistently employ these updated labels to align with the latest survey methodologies and evolving insights into developer sentiment.
Complementary to the Stack Overflow Survey, the JetBrains Survey targets a diverse and global audience of developers as well, employing rigorous data collection and cleaning methodologies to ensure high-quality responses. It gathers insights on technology usage, satisfaction, and future adoption trends while implementing measures to reduce bias and enhance representativeness. JetBrains Survey, conducted annually, has seen increasing participation over the years, with responses from nearly 7000 to over 31,000 developers globally:
- 2023: 26,348 responses [32].
- 2022: 29,269 responses [33].
- 2021: 31,743 responses [34].
- 2020: 19,696 responses [35].
- 2019: response count was approximated as “nearly 7000” [36].
The 2024 JetBrains Survey [37] was omitted from this study because it did not provide data on cross-platform mobile application development usage, a key area of our analysis. While JetBrains surveys continue to offer valuable insights into various aspects of the developer ecosystem, the absence of this specific data point in the latest edition limited its applicability for our comparative study.
The data from the Stack Overflow Developer Survey were cross-referenced with the JetBrains Survey results to validate observed trends, mitigate potential biases, and provide a more comprehensive understanding of developer sentiment and industry adoption patterns.
3.1.2. Community Engagement and Usage Data
Data regarding the number of questions associated with specific technology tags (Flutter, React Native, and MAUI) were collected directly from the Stack Overflow website using the Stack Overflow API. Additionally, visual tag trend graphs provided by the platform were used to supplement the numerical data. This information serves as a proxy for the level of community engagement and the frequency with which developers encounter issues related to these technologies.
We collected several key GitHub repository metrics for each technology to quantify community activity and project maintenance. These metrics provide insights into both popularity and ongoing development efforts:
- Stars: Indicating overall popularity and community endorsement.
- Commits: Reflecting the level of active development and code contributions.
- Open Pull Requests: Showcasing ongoing contributions and pending feature additions or fixes.
- Open Issues: Highlighting current challenges, bugs, and feature requests under discussion.
- Closed Issues: Demonstrating how efficiently a project resolves reported problems.
- Latest Release Date: Indicating how recently the technology has been updated, reflecting active maintenance.
These metrics enable direct comparisons of development activity across different CMADFs.
Finally, Google Trends data were obtained from 2019 to 2024 to capture the evolution of public interest over time. Data extraction was performed via API, focusing on search interest for keywords related to each technology. This external measure complements community-driven metrics by providing broader public and market attention insights.
3.1.3. Market Adoption and Job Market Data
Hacker News (HN) is a widely respected social news platform focused on computer science, technology, and entrepreneurship. Operated by Y Combinator, a leading startup incubator and investment fund, HN has become a key forum for industry professionals, investors, and developers to discuss emerging trends and opportunities. The platform’s curated content and engaged community make it a valuable source for tracking technological developments and hiring patterns.
To this end, we observed the HN “Who is Hiring” graph [38], which visually represents hiring trends within the tech industry. To complement this qualitative analysis, we systematically collected and examined raw numerical data on a monthly basis, enabling a more precise evaluation of long-term trends. By extracting and quantifying shifts in demand for specific technologies, we moved beyond mere visual interpretation, ensuring a data-driven assessment of hiring patterns. This dual approach provided deeper insights into the prominence of cross-platform mobile application development tools and frameworks in job postings, making it a reliable indicator of market demand. Additionally, while not as nuanced, we also investigated the number of job postings on LinkedIn to further validate our findings. Although LinkedIn data do not offer the same level of structured historical analysis as the HN dataset, they serve as a useful supplementary measure of real-time industry demand, providing a broader perspective on hiring trends across different regions and companies.
3.2. Alignment with Research Questions and Hypotheses
Our methodology was carefully crafted to directly address the research questions and hypotheses presented in the Introduction. Analysis of Developer Sentiment and Survey Data was pivotal for addressing RQ1 and RQ2, while examining Market Adoption and Job Market Data provided robust insights into RQ3 and RQ4. Additionally, the study of Community Engagement and Usage Data further enriched our understanding of the findings, ensuring a comprehensive evaluation of cross-platform mobile application development trends.
4. Results
4.1. Data Overview
To provide context for the results discussed in this section, we outline the descriptive statistics derived from the various sources.
4.1.1. Developer Sentiment and Survey Data
To set the stage for the results explored in this section, we first outline the descriptive statistics derived from the Stack Overflow survey. The descriptive statistics for Flutter are displayed in Table 1, while those for React Native are shown in Table 2. The full dataset can be found in Table A1 of Appendix A.

Table 1.
Descriptive statistics of Flutter’s measurements (in %).
Table 2.
Descriptive statistics of React Native’s measurements (in %).
A detailed look at the data reveals that, for Flutter, the “popularity” metric reaches a maximum score of 13.55, with a median of 9.26 and an interquartile range (IQR) of 5.44, which suggests moderate variability across the years. The distribution for popularity exhibits slight negative skewness (−0.50), indicating a minor tail toward lower values, and an excess kurtosis near zero (−0.08) implies that the distribution is close to normal in terms of peakedness. Regarding the “desired” metric, Flutter attains a maximum value of 16.43, with a median of 12.96 and an IQR of 3.34. Here, the negative skew (−0.83) suggests a slight tilt toward higher values, while an excess kurtosis of 1.09 indicates that the distribution is somewhat more peaked than a normal distribution. The “admired” metric for Flutter shows a maximum of 75.4, a median of 68.1, and an IQR of 4.37. This distribution is characterized by a slight positive skew (0.28) and an excess kurtosis of 1.08, indicating that the data are moderately concentrated with a minor right-tail.
Turning to React Native, its “popularity” metric reaches a higher maximum of 14.51, with a median of 11 and a smaller IQR of 4.14, indicating a tighter data concentration than Flutter. The distribution displays a mild positive skew (0.30) and a negative excess kurtosis (−0.96), suggesting a flatter distribution with a slight bias toward higher scores. For the “desired” metric, React Native records a maximum of 17.75, a median of 13.08, and a notably smaller IQR of 2.19, which indicates less variability over time. The data in this case are noticeably right-skewed (1.66) with a high excess kurtosis (3.12), indicating a pronounced concentration of values accompanied by a longer tail toward the higher end. As for the “admired” metric, React Native has a maximum of 62.5, a median of 57.2, and an IQR of 2.10, with the distribution exhibiting a positive skewness (1.00) and moderate excess kurtosis (1.89). This suggests a tendency toward lower values with some extreme higher observations.
These analyses reveal that Flutter exhibits greater variability in its popularity scores compared to React Native, as evidenced by a larger IQR. Additionally, the “desired” and “admired” metrics for React Native are more right-skewed and peaked than those for Flutter, implying that, while React Native may achieve higher maximum values in some cases, its central tendency is lower and more concentrated. These differences in distribution likely reflect distinct trends in developer sentiment and market positioning, with Flutter showing a more balanced spread over time and React Native indicating more polarized views in terms of desirability and admiration.
Notably, MAUI was omitted from our descriptive statistics as it only began appearing in industry surveys in 2023 and 2024. Due to its relatively recent adoption, there are insufficient historical data to meaningfully compare its trajectory against more established frameworks. However, its emerging presence in recent surveys suggests growing interest, which may warrant closer examination in future studies.
The overall popularity trends of Flutter, React Native, and MAUI from 2019 to 2024 are illustrated in the graph in Figure 1 based on Stack Overflow survey data. The results indicate that React Native initially held the highest popularity, peaking in 2021, while Flutter experienced a steady rise, surpassing React Native in some years. Despite slight fluctuations, Flutter maintained a strong position, reflecting growing adoption and community support.
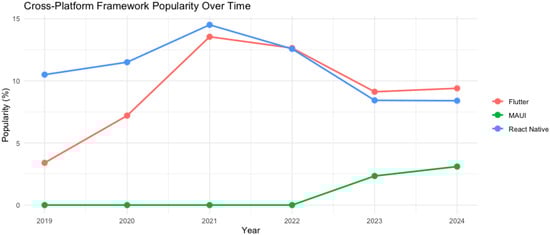
Figure 1.
Popularity trends of CMADFs (2019–2024).
In addition to the Stack Overflow Developer Survey, we incorporate data from the JetBrains Developer Ecosystem Survey as a supplementary source of validation. While Stack Overflow provides a broad, community-driven perspective, JetBrains’ survey reflects insights from a different sample of developers, potentially offering a more focused view on tool adoption within professional settings.
The available JetBrains survey data (2019–2024) capture the percentages of developers using Flutter and React Native, although MAUI is not yet represented in this dataset (Table 3). The full dataset can be found in Table A2 of Appendix B. The figures provide additional context for the trends observed in Stack Overflow’s popularity metrics.
Table 3.
Descriptive statistics for JetBrains survey data (in %).
Turning to Flutter, its data show a minimum value of 30 and a maximum of 46, resulting in a range of 16. The mean for Flutter is 40.6, with a standard deviation of 6.62, indicating a moderate spread of values around the mean. The data show a mild negative skewness (−1.26), suggesting a slight bias toward lower scores, and a positive excess kurtosis (1.34), indicating a distribution with a moderate concentration of values around the mean and longer tails on both ends. The interquartile range (IQR) is 7, with Q1 at 39 and Q3 at 46, suggesting a fairly compact middle 50% of the data.
For React Native, the data show a minimum of 32 and a maximum of 42, giving it a range of 10. The mean for React Native is 37.8, with a smaller standard deviation of 4.38, indicating less variability compared to Flutter. The skewness for React Native is slightly negative (−0.34), reflecting a slight tendency toward higher values, and the excess kurtosis is negative (−1.84), suggesting a distribution that is flatter than normal with fewer extreme values. The interquartile range is also 7, with Q1 at 35 and Q3 at 42, showing a similarly compact central range to Flutter but with less overall spread.
By integrating both data sources, we achieve a more comprehensive perspective on developer sentiment, with JetBrains data supporting the broader adoption trends observed in the Stack Overflow survey.
4.1.2. Community Engagement and Usage Data
In this section, we present data related to the three platforms (namely Flutter, React Native, and MAUI) from GitHub. Table 4 summarizes key metrics, including the number of stars, commits, open pull requests, open issues, closed issues, and the date of the latest release.
Table 4.
GitHub statistics for Flutter, React Native, and MAUI.
The data reveal several important characteristics of each platform. Flutter leads in the number of stars and commits, indicating higher levels of community engagement and activity regarding code contributions. React Native has a notably higher number of open pull requests compared to Flutter, suggesting a more active review process and community contribution. MAUI, while having fewer stars and commits, shows a relatively higher number of open issues, which may suggest that the platform is still undergoing significant development and addressing user-reported problems.
The latest release for Flutter occurred in October 2023, whereas React Native and MAUI had recent releases in 2025. This difference in release timelines may indicate variations in release cadence, ongoing development priorities, or long-term roadmap strategies among these frameworks.
Furthermore, we present the descriptive statistics derived from Google Trends data for Flutter, React Native, and MAUI from January 2019 to December 2024, which are summarized in Figure 2.

Figure 2.
Google Trends search interest over time (January 2019–December 2024).
The data represent the worldwide search interest, measured on a scale of 0 to 100, for each platform relative to the highest point on the chart for the given region and time. A value of 100 is the peak popularity for the term. A value of 50 means that the term is half as popular. A score of 0 means that the data were insufficient for this term. This analysis provides insights into the relative trends and patterns of search interest over the given period. A more detailed summary of these statistics is shown in Table 5 below. The full dataset can be found in Table A3 of Appendix C.
Table 5.
Descriptive statistics for Google Trends data.
The descriptive statistics from Google Trends highlight interesting trends in the search interest for Flutter, React Native, and MAUI. Flutter consistently stands out with the highest search interest across all three platforms, achieving a maximum value of 100 and a median of 61. This suggests that Flutter has experienced considerable and sustained attention over time, although with some variation, as indicated by the wide interquartile range of 52. This variability suggests that, while there have been fluctuations in search interest, Flutter remains the most popular among the three platforms. The slight negative skewness (−0.12) and excess kurtosis of −1.65 suggest a distribution close to normal, with a slight tail towards lower values but overall balanced trends.
React Native, on the other hand, exhibits a maximum search interest of 55 and a median value of 41. While it shows a consistent level of interest, the search data are less variable than Flutter’s, as indicated by the smaller interquartile range of 13.5. This concentration of data around the median suggests a more stable but less intense trend than Flutter. The skewness value of −1.16 and the positive excess kurtosis of 1.85 reveal that the distribution is more left-skewed, indicating that most of the data points lie on the lower end of the scale, although the data are still somewhat peaked.
MAUI shows the least search interest of the three, with a maximum value of just 5 and a median of 0.5. The majority of the observations for MAUI cluster at very low values, reflecting minimal interest over time. The positive skewness (0.67) and negative excess kurtosis (−1.15) indicate that, while most of the data points are low, there is a minor tail towards higher values. This suggests that MAUI has yet to gain traction in terms of public interest when compared to Flutter and React Native.
Overall, the data suggest that Flutter maintains the highest and most consistent search interest, React Native shows moderate interest, and MAUI remains mainly under the radar regarding global search trends.
4.1.3. Market Adoption and Job Market Data
Furthermore, we present the descriptive statistics for the hiring trends of Flutter and React Native, as observed on Hacker News, based on the raw data collected between 2019 and 2024, which are summarized in Figure 3.
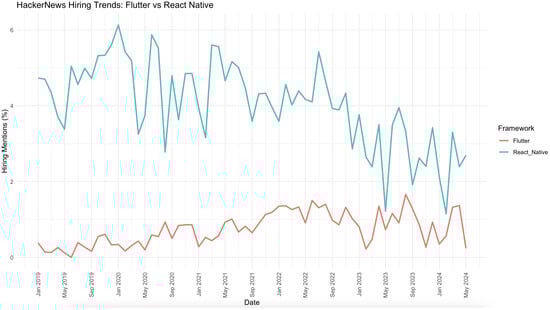
Figure 3.
Hiring trends over time: Flutter vs. React Native (January 2019–December 2024).
Detailed descriptive statistics can help us to understand the central tendency, spread, and shape of the hiring trends for each technology (Table 6). The full dataset can be found in Table A4 of Appendix D.
Table 6.
Descriptive statistics for Hacker News hiring trend data (in %).
The mean value of the data for Flutter was found to be 0.74, with a standard deviation of 0.43, indicating that the values are relatively close to the mean but with moderate variability. The data for Flutter exhibited a slight positive skew (0.21), suggesting that there are a few higher values pulling the distribution to the right.
In contrast, the mean value for React Native was 4.04, which is higher than the mean of Flutter. The standard deviation for React Native was 1.13, reflecting greater variability in the data compared to Flutter. The data for React Native showed a slight negative skew (−0.48), meaning that the distribution has a small tail to the left, with lower values pulling in that direction.
Overall, the React Native data showed a much greater range (4.98) and interquartile range (1.47) than Flutter, indicating a wider spread and more variability in the data. The findings suggest that the distributions of the two groups are different both in terms of central tendency and spread, with React Native showing higher values and more variability across the observations.
Both technologies demonstrate positive overall hiring trends; however, React Native exhibits more fluctuation in adoption within the job market. In the next chapter, we will test whether these variations are statistically significant.
5. Methodological Framework of the Statistical Analysis
In this study, we aimed to assess the differences and potential correlations between various CMADFs, focusing on Flutter and React Native. The data used for analysis span the period from 2019 to 2024.
As our datasets were small, particularly for comparisons between different frameworks (e.g., Flutter and React Native), we utilized the non-parametric Mann–Whitney U test. This test is appropriate for comparing two independent groups when the sample sizes are small and when normality assumptions cannot be reliably met. The Mann–Whitney U test allows for comparisons of medians between groups, making it a suitable choice for comparing metrics such as popularity, developer interest, and long-term satisfaction between the frameworks.
In addition to comparing the datasets between frameworks, we sought to explore whether there was any correlation between the popularity of a framework and the number of job postings associated with it. For this purpose, we used Pearson correlation analysis. This method measures the strength and direction of a linear relationship between two continuous variables. It is particularly useful for assessing how changes in one variable (e.g., popularity of a framework) may be associated with changes in another (e.g., job postings).
The analysis of data collected was conducted using R 4.3.3 in RStudio.
Results and Interpretations
For Research Question 1 (RQ1), we used the Stack Overflow Survey as our primary data source as it offers more detailed insights into framework usage. Furthermore, our focus was on comparing React Native and Flutter, excluding MAUI due to its insufficient sample size (n = 2) as developers did not choose it until 2023. Given the small sample size (n = 6) and the limitations of normality tests, we applied the non-parametric Mann–Whitney U test to compare the popularity, developer interest, and long-term satisfaction metrics between Flutter and React Native.
The H1a hypothesis predicted that there would be a significant difference in popularity between the two most widely used CMADFs, Flutter and React Native. However, the Mann–Whitney U test resulted in a p-value of 0.59, well above the significance threshold of 0.05. This indicates that the evidence is insufficient to support the claim of a significant difference in popularity. The bar plots of mean framework popularity (Figure 4) visually illustrate this trend, showing that, while React Native has a higher median value, the difference is not statistically significant.

Figure 4.
Framework popularity.
We performed a similar analysis using the JetBrains survey to further validate this finding. The results revealed a p-value of 0.396, which further reinforces that there is no statistically significant difference in popularity between Flutter and React Native in the dataset.
Furthermore, the H1b hypothesis proposed that there would be a significant difference in developer interest between Flutter and React Native. However, the p-value of 0.818 suggests that the observed difference in interest among developers, i.e., those who expressed a desire to use the frameworks but had not yet done so, is not statistically significant. This finding is further supported by the bar plots (Figure 5), which show that the median values for developer interest in both frameworks are very close. Overall, these results align with the earlier findings on popularity, suggesting that developers perceive similar potential in both technologies, thereby reflecting the broader trends in cross-platform mobile application development, where both frameworks are regarded as top contenders.
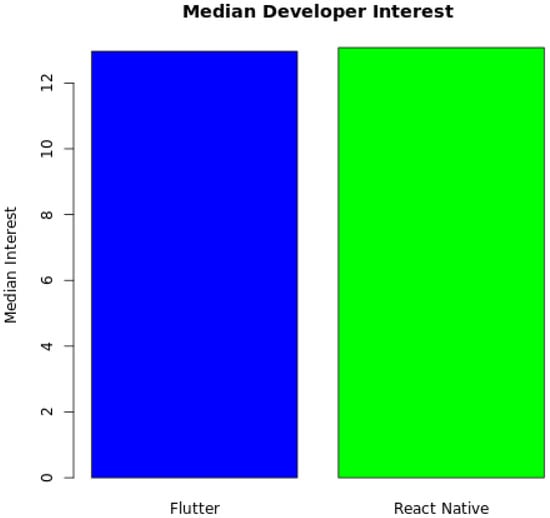
Figure 5.
Developer interest.
Finally, for the H1c hypothesis, we anticipated a significant difference in long-term satisfaction between developers using Flutter and React Native. The Mann–Whitney U test produced a p-value of 0.004, providing strong evidence for a difference in long-term satisfaction. As also noted by the bar plots in Figure 6, developers reported higher satisfaction with Flutter (median = 68.1) than React Native (median = 57.2). This finding suggests that, for developers committed to long-term use, Flutter may offer advantages such as better performance, an easier learning curve, or a richer toolset. While this result is intriguing, it is essential to consider that long-term satisfaction is subjective and influenced by many factors, such as project requirements, team preferences, and the specific challenges developers face during implementation. The result highlights that, for those developers who are committed to using one of the two frameworks long-term, Flutter seems to offer a more satisfying experience.

Figure 6.
Framework long-term satisfaction.
A similar trend is observed when considering the Google Trends data. After 2019, Flutter emerged as the predominant framework for online search interest. Although earlier intervals saw React Native with higher initial figures (24.42 for Flutter versus 33.33 for React Native), the subsequent periods revealed a noticeable shift. Flutter’s relative values climb significantly, reaching 88.33 compared to React Native’s 49.08 and 87.92 compared to 46.83. These figures suggest that, over time, Flutter has maintained and increased its visibility and appeal in the developer community, further reinforcing the survey and GitHub findings that point toward a more positive long-term user experience with Flutter.
This quantitative finding is further enriched when viewed alongside GitHub repository metrics. On GitHub, Flutter’s repository demonstrates strong community engagement, with 168,618 stars, the highest among the three frameworks, and 82,816 commits. The high number of closed issues (90,152) suggests an active and dedicated maintenance effort, which may at least partially explain long-term satisfaction with the framework.
However, Flutter also has a significantly higher number of open issues (13,122) than React Native’s 598, indicating a larger backlog that could slow down individual issue resolution. Additionally, its latest release was in October 2023, meaning it has not received an update in nearly two years (as of 2025). In contrast, React Native and MAUI have both seen updates as recently as February 2025. While Flutter’s strong community and extensive issue resolution history contribute to its appeal, these challenges in release cadence and backlog management may also influence developer satisfaction over time.
For Research Question 2 (RQ2) and the H2 hypothesis, which posits that there is a difference in job demand between the most commonly used CMADFs based on job posting data, we explored the variations in job postings for Flutter and React Native on Hacker News. To determine the appropriate statistical test for comparing the two groups, we first assessed the normality of the data using the Shapiro–Wilk test. The results indicated that the Flutter dataset was not normally distributed (W = 0.95, p = 0.016), while the React Native dataset followed a normal distribution (W = 0.98, p = 0.241). Since one of the datasets violated the assumption of normality (p < 0.05 for Flutter), we opted for the non-parametric Mann–Whitney U test, allowing for a robust comparison of the two groups without assuming normality.
The analysis revealed a statistically significant difference between Flutter and React Native, with the React Native job postings having a higher median (4.1) than Flutter (0.73). The p-value < 0.0001 indicates that the difference in job postings between the two frameworks is statistically significant. This substantial disparity is also clearly evident from the bar plots, which visually underscore the large gap between the two frameworks (Figure 7).
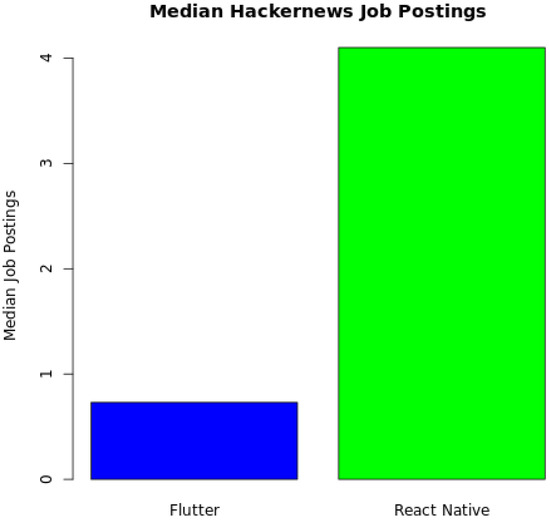
Figure 7.
Framework job postings.
This finding suggests that React Native is currently more prevalent in job postings on Hacker News than Flutter, reflecting higher demand for developers with React Native expertise in the job market. The higher number of React Native job postings may be due to its longer presence in the market and established adoption across various industries. In contrast, Flutter shows fewer job postings in this context, which could indicate relatively less widespread adoption compared to React Native.
MAUI was not included in the Hacker News analysis due to its absence from job postings on this platform. This absence may reflect the framework’s smaller community or a lower volume of job opportunities at the time of the analysis.
Additionally, we considered the latest LinkedIn data from 23 February 2025, which provide additional perspective on job postings. Flutter had 1835 job postings as of this date, while React Native had 2037. This close disparity in the job postings between the two frameworks indicates that both are similarly represented in the job market on LinkedIn. However, React Native still slightly edges out Flutter in terms of overall opportunities. MAUI had 615 job postings, which is a considerably lower number, supporting its current position as a less commonly adopted framework for cross-platform mobile application development.
Overall, these findings highlight the current job market dynamics, with React Native leading in job postings across both Hacker News and LinkedIn, while Flutter also shows a strong presence. The relatively low number of job postings for MAUI on both platforms suggests that it is still developing traction among developers and employers. As adopting these frameworks evolves, future analyses will be helpful to track how job opportunities shift over time, particularly as MAUI gains more visibility and adoption in the development community.
For Research Question 3 (RQ3), we investigated whether a correlation exists between the popularity of a framework and the number of job postings associated with it. The analysis revealed differing trends for Flutter and React Native, highlighting interesting dynamics in how popularity translates into job market demand. To perform this comparison, we first had to group the Hacker News data by year to ensure that both frameworks’ popularity could be analyzed consistently over time.
For Flutter, the Pearson correlation analysis revealed a significant positive correlation between its popularity and job postings (r(4) = 0.816, p = 0.048). Since the p-value is below our 0.05 significance threshold, this finding supports hypothesis H3, which posits that greater popularity of a CMADF is associated with an increase in job postings. This trend may reflect the growing industry adoption of Flutter alongside a rising demand for skilled developers. However, given the small sample size (n = 6), this relationship should be interpreted with caution. The scatterplot (Figure 8) visually supports this association, showing a positive linear trend between popularity and job postings.
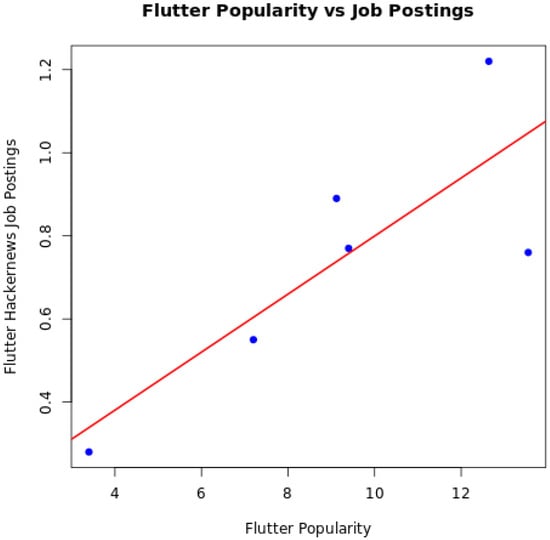
Figure 8.
Flutter popularity vs. job postings.
For React Native, the Pearson correlation coefficient was relatively high (r(4) = 0.752), indicating a positive association between popularity and job postings. However, the p-value of 0.085 exceeds the 0.05 significance threshold, meaning the correlation is not statistically significant. While the results suggest a possible relationship, the lack of significance indicates that the trend may be less consistent or influenced by external factors. This could reflect fluctuations in job postings due to industry-specific demand, alternative hiring preferences, or market saturation. The corresponding scatterplot (Figure 9) visually suggests a positive trend, although it does not reach statistical significance.
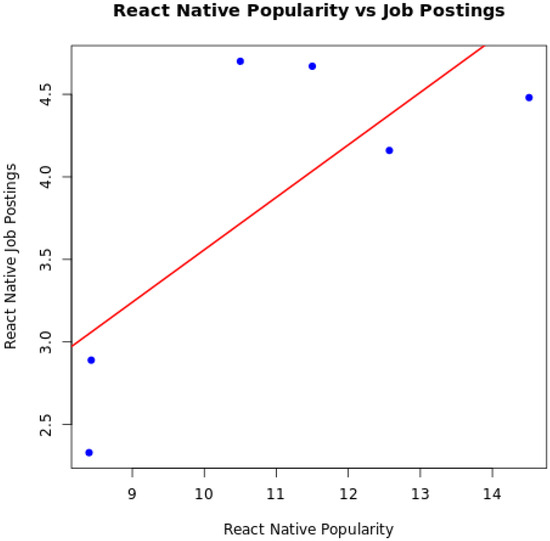
Figure 9.
React Native popularity vs. job postings.
These findings provide key insights into the evolving job market for CMADFs. Flutter’s job demand appears to scale with its rising popularity, while React Native’s job market may be influenced by additional factors beyond popularity alone. Essentially, while Flutter’s demand seems to scale directly with its growing appeal, React Native’s job postings appear to be influenced by more complex, enduring factors rather than short-term surges in popularity.
Future research could explore additional factors influencing job demand, such as regional differences, industry-specific adoption rates, and long-term hiring trends. Additionally, the growing presence of MAUI, although currently less popular, could introduce new dynamics into the cross-platform mobile application development job market in the coming years.
6. Discussion
The analysis of data from various sources, including Stack Overflow, JetBrains, GitHub, Google Trends, Hacker News, and LinkedIn, provides a comprehensive view of the current landscape surrounding Flutter, React Native, and MAUI. This section will discuss the key findings, divided into three categories: Developer Sentiment and Survey Data, Community Engagement and Usage Data, and Market Adoption and Job Market Data.
6.1. Developer Sentiment and Survey Data
The Stack Overflow and JetBrains surveys offer valuable insights into developer sentiment, with Flutter and React Native emerging as the top two CMADFs. In terms of popularity, developer interest, and admiration, the analysis indicates that both Flutter and React Native have comparable levels of usage and desirability, with no statistically significant differences found between the two frameworks regarding popularity or developer interest (p-values > 0.05). This suggests that developers perceive both frameworks as viable options, with no clear preference in the early stages of framework evaluation. These results were further corroborated by the JetBrains survey, which showed parallel trends in adoption between Flutter and React Native.
However, long-term satisfaction reveals an important distinction. Flutter outperforms React Native in developer satisfaction (p = 0.004). This finding indicates that, for developers who have committed to using either of the frameworks, Flutter provides a more satisfying experience. Factors such as performance, a more approachable learning curve, and better tooling [9] likely contribute to this higher satisfaction level. Despite the subjective nature of satisfaction, these results suggest that Flutter may be a more attractive option for developers seeking long-term engagement with a CMADF.
In contrast, React Native continues to hold a solid position in terms of popularity and developer interest. Its relatively high adoption rate and consistent interest from developers might suggest a framework that is well entrenched in the market. However, its lower long-term satisfaction could imply challenges that developers face, e.g., performance issues, reliance on third-party libraries for essential functionality, and ecosystem fragmentation.
6.2. Community Engagement and Usage Data
The GitHub metrics provide further context regarding developer sentiment, revealing that Flutter leads in overall community engagement. Flutter’s repository has 168,618 stars and 82,816 commits, indicating strong community support and active contribution. The high number of closed issues (90,152) suggests an efficient issue resolution process, which may at least partially explain its long-term appeal. However, Flutter also has a significantly higher number of open issues (13,122), indicating a larger backlog that could slow down certain fixes. Additionally, its latest release was in October 2023, meaning it has not been updated in nearly two years. While Flutter remains a popular and well-supported framework, we can perhaps see the beginning of how these factors impact development needs. In response to challenges like these, Flock was created as a community-driven fork of Flutter, providing companies with a way to access critical bug fixes and missing features without waiting for the official Flutter team [42].
On the other hand, React Native’s repository, while also exhibiting strong community activity with 120,570 stars and 35,103 commits, has a notably higher number of open pull requests. This could indicate a more complex or fragmented development process, potentially leading to slower contribution resolution times. However, React Native benefits from a much lower number of open issues (598) and has received a recent update in February 2025, suggesting a more frequent release cycle. Despite its challenges, React Native’s established presence and steady updates may contribute to sustained developer confidence in the framework over time.
As a newcomer, MAUI shows a significantly lower level of community engagement than Flutter and React Native. Its fewer stars, commits, and open issues suggest that it is still developing a community of contributors and may face challenges in attracting attention from developers. However, its relatively high number of open issues (compared to its closed issues) indicates that the platform is actively working to address user feedback and improve its offerings.
Regarding Google Trends data, Flutter emerges as the most searched framework, with a consistent rise in search interest over time. React Native shows moderate search interest, although its trend is somewhat more stable. At the same time, MAUI has minimal search interest, suggesting that it has yet to capture widespread attention from the developer community.
6.3. Market Adoption and Job Market Data
The Job Market Data from Hacker News and LinkedIn add an interesting dimension to the analysis, highlighting the adoption trends of these frameworks in the industry. React Native leads in job postings, both on Hacker News and LinkedIn, with significantly more opportunities for developers skilled in React Native compared to Flutter. This result could be explained by React Native’s earlier entry into the market and broader adoption by organizations seeking cross-platform mobile application development solutions. The higher demand for React Native developers reflects its established presence in the industry, where many companies have already integrated it into their tech stacks.
Flutter’s lower job posting numbers may be attributed to its somewhat later entry into the market compared to React Native. However, despite the gap in job postings between the two frameworks, Flutter is showing consistent growth in demand. As the recent trends indicate, the number of job postings for Flutter has been steadily increasing, signaling growing adoption and interest within the developer community. While React Native continues to lead in terms of job opportunities, the data suggest that Flutter’s momentum is picking up, and its presence in the job market is strengthening.
Finally, MAUI shows the least job posting activity, both on Hacker News and LinkedIn, which aligns with its status as a new and emerging framework. As its community and adoption continue to grow, it may start to see more job postings in the future. However, for now, React Native and Flutter dominate in terms of industry demand for developers, particularly for larger organizations looking for proven cross-platform mobile application development solutions.
The correlation between framework popularity and job market demand was examined using Pearson’s correlation analysis to understand the relationship between developer interest and employment opportunities for Flutter and React Native. The findings suggest that, as Flutter’s popularity within the developer community grows, there appears to be an increase in the demand for Flutter developers, as reflected in the job postings. This statistically significant relationship indicates a potential association between Flutter’s rising popularity and the demand for skilled professionals, possibly reflecting greater industry adoption.
In contrast, React Native’s correlation between popularity and job postings, while still relatively strong, did not reach statistical significance. This suggests that, while React Native remains widely used and continues to dominate the mobile development landscape, the link between its popularity and job market demand is less pronounced than Flutter’s. The lack of statistical significance could point to factors such as the maturity of React Native in the market, where demand for developers may be more stable and less directly correlated to shifts in its popularity.
These results provide insights into the interaction between developer interest and market demand for these two frameworks. The significant correlation for Flutter suggests that its increasing adoption within the development community may be linked to growing job opportunities. In contrast, the weaker correlation for React Native, despite its longer-established presence, could indicate a more stable equilibrium in job postings, where demand remains consistent but less responsive to fluctuations in popularity. Further research could explore whether this trend holds over a longer timeframe or in different geographical markets.
7. Conclusions
This research initiated an in-depth examination of CMADFs’ subtle yet significant roles in influencing the developer sentiment, community engagement, and job market dynamics within the fast-paced mobile development ecosystem. Focused on a multi-faceted analysis drawing from sources such as the Stack Overflow Developer Survey, GitHub repository metrics, and job posting data from Hacker News and LinkedIn, this study specifically addressed how widely adopted frameworks like Flutter and React Native compare in terms of popularity, developer interest, and long-term satisfaction while also investigating differences in job demand and the relationship between framework popularity and employment opportunities. More specifically, our research shows the following.
RQ1: The analysis addressing developer metrics indicates that, while Flutter and React Native are comparable in terms of popularity and developer interest, there is a significant difference in long-term satisfaction, with developers reporting notably higher satisfaction with Flutter.
RQ2: Our investigation into the job market dynamics reveals a significant difference in demand between the frameworks. React Native consistently garners a higher number of job postings, particularly as evidenced by the Hacker News data, although the LinkedIn figures suggest a slightly narrower gap.
RQ3: Examining the relationship between framework popularity and job postings, we found that increased popularity strongly correlates with more job postings for Flutter, whereas a similar trend for React Native did not reach statistical significance.
Collectively, these findings highlight that, despite similar overall appeal, Flutter may provide a more satisfying long-term experience and a job market that scales with its growing popularity. At the same time, React Native continues to dominate in terms of overall job demand.
While reading our study, the following limitations should be considered. First, by focusing solely on data from 2019 onward, we exclude earlier frameworks such as Cordova and Ionic, which limits our understanding of the full evolution of mobile development and the context surrounding the current trends. While this approach allows for an in-depth examination of the modern declarative UI paradigms introduced by Jetpack Compose and SwiftUI, it may overlook the historical factors that influenced the contemporary practices. Moreover, while Ionic and similar solutions remain viable for specific use cases, particularly among teams with strong web development backgrounds, this study focused exclusively on frameworks that compile to native code. As a result, WebView-based technologies are excluded despite offering alternative trade-offs in performance, flexibility, and integration. Additionally, our reliance on self-reported survey data from sources like Stack Overflow and JetBrains introduces potential demographic and response biases. At the same time, community engagement metrics from Stack Overflow, GitHub, and Google Trends serve as indirect proxies for real-world usage that may not fully capture production environments. Market adoption indicators derived from platforms such as Hacker News and LinkedIn are also influenced by external economic and regional fluctuations, which can affect the interpretation of long-term trends. Moreover, the use of API-based data extraction from publicly available sources inherently excludes proprietary or enterprise-specific information and limits our ability to establish causative relationships between observed phenomena. Future work should address these limitations by expanding the temporal scope and incorporating a broader range of data sources to enhance the generalizability and robustness of the findings.
8. Future Directions
8.1. Implications for Academia
The increasing emphasis on CMADFs that compile to native code presents a significant area for further research. Both Flutter and React Native offer varying degrees of native compilation, albeit through different mechanisms. Flutter employs the Dart Ahead of Time (AOT) compiler, translating Dart code directly into native ARM or x86 machine code, while React Native relies on JavaScript interacting with native components via the JavaScriptCore engine. Although not addressed in the study due to its relatively limited traction compared to Flutter or React Native, Kotlin Multiplatform represents an emerging alternative. It enables various levels of code sharing, from business logic only to full UI through Compose Multiplatform, while maintaining native UI flexibility. As WebView-based frameworks decline in popularity, future research should further explore the implications of native compilation on performance, developer experience, and long-term adoption, particularly as platforms like Kotlin Multiplatform continue to mature.
Our study confirms that developers working with Flutter exhibit significantly higher long-term satisfaction than those using React Native. This trend may be attributed to Flutter’s comprehensive suite of development tools, including built-in UI components, state management solutions, and testing utilities. Additionally, the direct compilation of Flutter applications into binary code potentially results in enhanced performance and consistency. To better understand the underlying factors contributing to this satisfaction gap, future studies should focus on key aspects such as framework performance, documentation quality, community engagement, and the overall learning curve.
Gaining insights into developer preferences regarding CMADFs could inform tooling, documentation, and community support improvements. A structured survey could be conducted to identify which features developers find most valuable, such as debugging tools, third-party library support, integration with native modules, and general productivity enhancements. A comparative analysis of these aspects across Flutter and React Native could provide a clearer understanding of how each framework aligns with developer needs and industry demands.
The frequency of release cycles in CMADFs may influence the effectiveness of AI-powered development assistants, such as automated code suggestions, error detection, and debugging support. React Native follows a more rapid release cycle than Flutter, which could impact the relevance and reliability of AI-driven development tools. Further investigation is needed to assess how well AI-assisted coding tools remain synchronized with framework updates and whether discrepancies in update frequency affect developer productivity and code stability.
8.2. Implications for Industry
Given the comparable popularity of Flutter and React Native, framework selection often depends on a company’s existing expertise and technical requirements. Organizations with a background in React or web development may find React Native more intuitive, whereas those prioritizing high-performance mobile applications may benefit from Flutter’s rendering and compilation advantages. As debates persist regarding the optimal framework for various use cases, empirical research examining real-world application performance, development efficiency, and long-term maintainability would provide valuable insights for industry decision-makers.
The recent trends in job postings suggest a decline in demand for cross-platform mobile application development roles, raising the question of whether native development is regaining traction. Examining industry hiring patterns and employer preferences could offer insights into whether companies are shifting back toward native development due to performance considerations, evolving platform-specific requirements, or other factors. Such research could help to predict the future landscape of mobile application development and inform educational curricula for software development programs.
MAUI has emerged as a potential competitor in the cross-platform mobile application development space, leveraging its integration with the Microsoft ecosystem. As its adoption grows, further research is needed to evaluate its performance, ease of use, ecosystem support, and long-term viability compared to established frameworks like Flutter and React Native. Similarly, Kotlin Multiplatform is beginning to attract industry attention, particularly with growing support from JetBrains and Google. Its ability to share business logic while preserving native UI appeals to companies prioritizing performance and platform-specific design. As Kotlin Multiplatform adoption grows, especially within the Android ecosystem, it may also influence how Google allocates resources between its cross-platform offerings, potentially impacting the long-term roadmap and investment focus for Flutter. Investigating real-world adoption patterns, developer preferences, and production use cases of Kotlin Multiplatform could offer meaningful insights into its emerging role in shaping the future of cross-platform development strategies across the industry.
Author Contributions
Conceptualization, G.J.; methodology, G.J.; validation, V.T.; formal analysis, G.J.; investigation, V.T.; resources, G.J.; data curation, G.J.; writing—original draft preparation, G.J.; writing—review and editing, V.T.; visualization, G.J. and V.T.; supervision, V.T. All authors have read and agreed to the published version of the manuscript.
Funding
The authors acknowledge the financial support from the Slovenian Research and Innovation Agency (ARIS) (Research Core Funding No. P2-0057).
Institutional Review Board Statement
Not applicable.
Informed Consent Statement
Not applicable.
Data Availability Statement
Data are contained within the article.
Conflicts of Interest
The authors declare no conflicts of interest.
Abbreviations
The following abbreviations are used in this manuscript:
| CAGR | Compound Annual Growth Rate |
| CMADF | Cross-platform Mobile Application Development Framework |
| SR | Systematic Review |
| SMS | Systematic Mapping Study |
| WORA | Write Once, Run Anywhere |
| MVP | Minimum Viable Product |
| PWA | Progressive Web App |
| HN | Nacker News |
Appendix A. Stack Overflow Survey Data
Table A1.
Stack Overflow survey data.
Table A1.
Stack Overflow survey data.
| Year | Flutter | React Native | MAUI | ||||||
|---|---|---|---|---|---|---|---|---|---|
| Popularity | Desired | Admired | Popularity | Desired | Admired | Popularity | Desired | Admired | |
| 2019 | 3.4 | 6.7 | 75.4 | 10.5 | 13.1 | 62.5 | – * | – | – |
| 2020 | 7.2 | 10.7 | 68.8 | 11.5 | 14.0 | 57.9 | – | – | – |
| 2021 | 13.55 | 16.43 | 68.17 | 14.51 | 17.75 | 58.08 | – | – | – |
| 2022 | 12.64 | 13.52 | 68.03 | 12.57 | 13.05 | 55.98 | – | – | – |
| 2023 | 9.12 | 14.04 | 64.43 | 8.43 | 11.81 | 54.00 | 2.34 | 6.02 | 58.93 |
| 2024 | 9.40 | 12.40 | 60.60 | 8.40 | 11.70 | 56.50 | 3.10 | 5.50 | 53.10 |
* Note: A dash (–) indicates that data for MAUI were not available for the corresponding year.
Appendix B. JetBrains Developer Ecosystem Survey Data
Table A2.
JetBrains developer ecosystem survey data (%).
Table A2.
JetBrains developer ecosystem survey data (%).
| Year | Flutter | React Native |
|---|---|---|
| 2019 | 30 | 42 |
| 2020 | 39 | 42 |
| 2021 | 42 | 38 |
| 2022 | 46 | 32 |
| 2023 | 46 | 35 |
| 2024 | x | x |
Appendix C. Google Trends Data
Table A3.
Google Trends data.
Table A3.
Google Trends data.
| Month | Flutter: (Worldwide) | React Native: (Worldwide) | .NET MAUI: (Worldwide) |
|---|---|---|---|
| 2019-01 | 16 | 0 | 0 |
| 2019-02 | 16 | 11 | 0 |
| 2019-03 | 19 | 33 | 0 |
| 2019-04 | 19 | 36 | 0 |
| 2019-05 | 24 | 37 | 0 |
| 2019-06 | 25 | 43 | 0 |
| 2019-07 | 28 | 46 | 0 |
| 2019-08 | 27 | 41 | 0 |
| 2019-09 | 29 | 42 | 0 |
| 2019-10 | 29 | 40 | 0 |
| 2019-11 | 30 | 37 | 0 |
| 2019-12 | 31 | 34 | 0 |
| 2020-01 | 33 | 37 | 0 |
| 2020-02 | 35 | 39 | 0 |
| 2020-03 | 36 | 37 | 0 |
| 2020-04 | 41 | 39 | 0 |
| 2020-05 | 43 | 38 | 0 |
| 2020-06 | 42 | 39 | 0 |
| 2020-07 | 48 | 41 | 0 |
| 2020-08 | 45 | 37 | 0 |
| 2020-09 | 45 | 37 | 0 |
| 2020-10 | 35 | 28 | 0 |
| 2020-11 | 32 | 25 | 0 |
| 2020-12 | 33 | 24 | 0 |
| 2021-01 | 35 | 24 | 0 |
| 2021-02 | 38 | 26 | 0 |
| 2021-03 | 45 | 28 | 0 |
| 2021-04 | 42 | 26 | 0 |
| 2021-05 | 42 | 27 | 0 |
| 2021-06 | 45 | 27 | 0 |
| 2021-07 | 45 | 27 | 0 |
| 2021-08 | 45 | 26 | 0 |
| 2021-09 | 48 | 27 | 0 |
| 2021-10 | 44 | 27 | 0 |
| 2021-11 | 49 | 29 | 0 |
| 2021-12 | 49 | 27 | 0 |
| 2022-01 | 76 | 41 | 1 |
| 2022-02 | 91 | 47 | 1 |
| 2022-03 | 91 | 52 | 1 |
| 2022-04 | 92 | 55 | 1 |
| 2022-05 | 86 | 48 | 1 |
| 2022-06 | 93 | 53 | 2 |
| 2022-07 | 90 | 50 | 2 |
| 2022-08 | 86 | 50 | 2 |
| 2022-09 | 93 | 51 | 1 |
| 2022-10 | 84 | 46 | 2 |
| 2022-11 | 90 | 49 | 2 |
| 2022-12 | 88 | 47 | 2 |
| 2023-01 | 89 | 50 | 2 |
| 2023-02 | 100 | 51 | 3 |
| 2023-03 | 92 | 51 | 3 |
| 2023-04 | 85 | 45 | 3 |
| 2023-05 | 91 | 48 | 3 |
| 2023-06 | 85 | 47 | 3 |
| 2023-07 | 89 | 47 | 3 |
| 2023-08 | 87 | 48 | 4 |
| 2023-09 | 88 | 45 | 4 |
| 2023-10 | 85 | 47 | 4 |
| 2023-11 | 84 | 42 | 4 |
| 2023-12 | 80 | 41 | 4 |
| 2024-01 | 87 | 46 | 4 |
| 2024-02 | 97 | 49 | 5 |
| 2024-03 | 93 | 50 | 5 |
| 2024-04 | 89 | 49 | 5 |
| 2024-05 | 93 | 49 | 5 |
| 2024-06 | 80 | 41 | 4 |
| 2024-07 | 84 | 47 | 4 |
| 2024-08 | 82 | 47 | 4 |
| 2024-09 | 75 | 42 | 4 |
| 2024-10 | 77 | 43 | 5 |
| 2024-11 | 73 | 42 | 5 |
| 2024-12 | 73 | 39 | 4 |
Note: Numbers represent search interest relative to the highest point on the chart for the given region and time. A value of 100 is the peak popularity for the term. A value of 50 means that the term is half as popular. A score of 0 means there were not enough data for this term.
Appendix D. Hacker News Hiring Trend Data
Table A4.
Hacker News hiring trend data (%).
Table A4.
Hacker News hiring trend data (%).
| Month | Flutter | React Native |
|---|---|---|
| 2019-01 | 0.38 | 4.73 |
| 2019-02 | 0.14 | 4.7 |
| 2019-03 | 0.13 | 4.35 |
| 2019-04 | 0.26 | 3.7 |
| 2019-05 | 0.12 | 3.38 |
| 2019-06 | 0 | 5.04 |
| 2019-07 | 0.39 | 4.56 |
| 2019-08 | 0.27 | 4.99 |
| 2019-09 | 0.16 | 4.72 |
| 2019-10 | 0.55 | 5.32 |
| 2019-11 | 0.61 | 5.33 |
| 2019-12 | 0.33 | 5.61 |
| 2020-01 | 0.34 | 6.13 |
| 2020-02 | 0.17 | 5.42 |
| 2020-03 | 0.31 | 5.19 |
| 2020-04 | 0.43 | 3.25 |
| 2020-05 | 0.2 | 3.74 |
| 2020-06 | 0.59 | 5.87 |
| 2020-07 | 0.55 | 5.52 |
| 2020-08 | 0.93 | 2.78 |
| 2020-09 | 0.5 | 4.79 |
| 2020-10 | 0.84 | 3.63 |
| 2020-11 | 0.86 | 4.85 |
| 2020-12 | 0.86 | 4.85 |
| 2021-01 | 0.28 | 3.93 |
| 2021-02 | 0.53 | 3.16 |
| 2021-03 | 0.44 | 5.6 |
| 2021-04 | 0.57 | 5.56 |
| 2021-05 | 0.93 | 4.66 |
| 2021-06 | 1.01 | 5.16 |
| 2021-07 | 0.67 | 5.01 |
| 2021-08 | 0.82 | 4.47 |
| 2021-09 | 0.65 | 3.59 |
| 2021-10 | 0.89 | 4.31 |
| 2021-11 | 1.13 | 4.33 |
| 2021-12 | 1.19 | 3.95 |
| 2022-01 | 1.35 | 3.59 |
| 2022-02 | 1.36 | 4.56 |
| 2022-03 | 1.26 | 4.02 |
| 2022-04 | 1.33 | 4.39 |
| 2022-05 | 0.91 | 4.17 |
| 2022-06 | 1.5 | 4.1 |
| 2022-07 | 1.31 | 5.42 |
| 2022-08 | 1.4 | 4.65 |
| 2022-09 | 0.98 | 3.93 |
| 2022-10 | 0.86 | 3.89 |
| 2022-11 | 1.32 | 4.33 |
| 2022-12 | 1.02 | 2.86 |
| 2023-01 | 0.81 | 3.76 |
| 2023-02 | 0.22 | 2.65 |
| 2023-03 | 0.48 | 2.39 |
| 2023-04 | 1.35 | 3.5 |
| 2023-05 | 0.73 | 1.22 |
| 2023-06 | 1.16 | 3.49 |
| 2023-07 | 0.91 | 3.95 |
| 2023-08 | 1.66 | 3.32 |
| 2023-09 | 1.28 | 1.92 |
| 2023-10 | 0.87 | 2.62 |
| 2023-11 | 0.27 | 2.4 |
| 2023-12 | 0.93 | 3.42 |
| 2024-01 | 0.35 | 2.11 |
| 2024-02 | 0.57 | 1.15 |
| 2024-03 | 1.32 | 3.3 |
| 2024-04 | 1.37 | 2.39 |
| 2024-05 | 0.24 | 2.69 |
References
- Mobile Application Market to Grow by USD 2.63 Trillion from 2025–2029, Driven by Smartphone Penetration, Report on How AI is Driving Market Transformation. Available online: https://archive.today/kPoSt (accessed on 11 March 2025).
- Market Share of Mobile Operating Systems Worldwide from 2009 to 2024, by Quarter. Available online: https://archive.today/iVOuN (accessed on 11 March 2025).
- Zein, S.; Salleh, N.; Grundy, J. Systematic reviews in mobile app software engineering: A tertiary study. Inf. Softw. Technol. 2023, 164, 107323. [Google Scholar] [CrossRef]
- Zou, D.; Darus, M.Y. A Comparative Analysis of Cross-Platform Mobile Development Frameworks. In Proceedings of the 2024 IEEE 6th Symposium on Computers & Informatics (ISCI), Kuala Lumpur, Malaysia, 10 August 2024; pp. 84–90. [Google Scholar] [CrossRef]
- Jangassiyev, R.; Umarova, Z.; Ussenova, A.; Makhanova, Z.; Zhumatayev, N.; Amirov, M.; Koishibekova, G. Comparative analysis of cross-platform development methodologies: A comprehensive study. Telkomnika Telecommun. Comput. Electron. Control. 2025, 23, 108–118. [Google Scholar] [CrossRef]
- Cross-Platform Mobile Frameworks Used by Developers Globally 2019–2023. Available online: https://archive.ph/x2Ook (accessed on 11 March 2025).
- Mehrnezhad, M.; Toreini, E. What Is This Sensor and Does This App Need Access to It? Informatics 2019, 6, 7. [Google Scholar] [CrossRef]
- Number of Apps Available in Leading App Stores 2024. Available online: https://archive.ph/2itBr (accessed on 11 March 2025).
- Shah, K.; Sinha, H.; Mishra, P. Analysis of Cross-Platform Mobile App Development Tools. In Proceedings of the 2019 IEEE 5th International Conference for Convergence in Technology (I2CT), Bombay, India, 29–31 March 2019; pp. 1–7. [Google Scholar] [CrossRef]
- Stanojević, J.; Šošević, U.; Minović, M.; Milovanović, M. An Overview of Modern Cross-platform Mobile Development Frameworks. In Central European Conference on Information and Intelligent Systems; Faculty of Organization and Informatics Varazdin: Varaždin, Croatia, 2022; pp. 489–497. [Google Scholar]
- Khachouch, M.K.; Korchi, A.; Lakhrissi, Y.; Moumen, A. Framework Choice Criteria for Mobile Application Development. In Proceedings of the 2020 International Conference on Electrical, Communication, and Computer Engineering (ICECCE), Istanbul, Turkey, 12–13 June 2020; pp. 1–5. [Google Scholar] [CrossRef]
- Charkaoui, S.; Adraoui, Z.; Benlahmar, E.H. Cross-platform mobile development approaches. In Proceedings of the 2014 Third IEEE International Colloquium in Information Science and Technology (CIST), Tetuan-Chefchaouen, Morocco, 20–22 October 2014; pp. 188–191. [Google Scholar] [CrossRef]
- Latif, M.; Lakhrissi, Y.; Nfaoui, E.H.; Es-Sbai, N. Cross platform approach for mobile application development: A survey. In Proceedings of the 2016 International Conference on Information Technology for Organizations Development (IT4OD), Fez, Morocco, 30 March–1 April 2016; pp. 1–5. [Google Scholar] [CrossRef]
- Taneja, K.; Taneja, H.; Bhullar, R.K. Cross-platform application development for smartphones: Approaches and implications. In Proceedings of the 2016 3rd International Conference on Computing for Sustainable Global Development (INDIACom), New Delhi, India, 16–18 March 2016; pp. 1752–1758. [Google Scholar]
- Bernardes, T.F.; Miyake, M.Y. Cross-platform Mobile Development Approaches: A Systematic Review. IEEE Lat. Am. Trans. 2016, 14, 1892–1898. [Google Scholar] [CrossRef]
- Gerges, M.; Elgalb, A. Comprehensive Comparative Analysis of Mobile Apps Development Approaches. J. Artif. Intell. Gen. Sci. (JAIGS) 2024, 6, 430–437. [Google Scholar] [CrossRef]
- Nawrocki, P.; Wrona, K.; Marczak, M.; Sniezynski, B. A Comparison of Native and Cross-Platform Frameworks for Mobile Applications. Computer 2021, 54, 18–27. [Google Scholar] [CrossRef]
- Fatkhulin, T.; Alshawi, R.; Kulikova, A.; Mokin, A.; Timofeyeva, A. Analysis of Software Tools Allowing the Development of Cross-Platform Applications for Mobile Devices. In Proceedings of the 2023 Systems of Signals Generating and Processing in the Field of on Board Communications, Moscow, Russia, 14–16 March 2023; pp. 1–5. [Google Scholar] [CrossRef]
- Gowri, S.; Kanmani Pappa, C.; Tamilvizhi, T.; Nelson, L.; Surendran, R. Intelligent Analysis on Frameworks for Mobile App Development. In Proceedings of the 2023 5th International Conference on Smart Systems and Inventive Technology (ICSSIT), Tirunelveli, India, 23–25 January 2023; pp. 1506–1512. [Google Scholar] [CrossRef]
- Pinto, C.M.; Coutinho, C. From Native to Cross-platform Hybrid Development. In Proceedings of the 2018 International Conference on Intelligent Systems (IS), Funchal, Portugal, 25–27 September 2018; pp. 669–676. [Google Scholar] [CrossRef]
- Stanić, N.; Ćirković, S. Analysis of Approaches to Developing Kotlin Multiplatform Applications and Their Impact on Software Engineering. In Proceedings of the 10th International Scientific Conference Technics, Informatic, and Education, TIE 2024; University of Kragujevac, Faculty of Technical Sciences: Čačak, Serbia, 2024; pp. 53–59. [Google Scholar] [CrossRef]
- Kotlin Multiplatform Overview. Available online: https://developer.android.com/kotlin/multiplatform (accessed on 22 April 2025).
- Xamarin Support Policy. Available online: https://archive.ph/wip/ljC9x (accessed on 22 April 2025).
- Count ‘Em Up: 100 Things We Announced at I/O ‘19. Available online: https://archive.ph/xLCcv (accessed on 11 March 2025).
- SwiftUI. Available online: https://archive.ph/hNcuE (accessed on 11 March 2025).
- Stack Overflow Developer Survey 2024. Available online: https://archive.ph/gjEgs (accessed on 11 March 2025).
- Stack Overflow Developer Survey 2023. Available online: https://archive.ph/CrNvd (accessed on 11 March 2025).
- Stack Overflow Developer Survey 2022. Available online: https://archive.ph/CnHFQ (accessed on 11 March 2025).
- Stack Overflow Developer Survey 2021. Available online: https://archive.ph/JVyBL (accessed on 11 March 2025).
- Stack Overflow Developer Survey 2020. Available online: https://archive.ph/Ao7HT (accessed on 11 March 2025).
- Stack Overflow Developer Survey 2019. Available online: https://archive.ph/34Cmo (accessed on 11 March 2025).
- Developer Ecosystem Report 2023. Available online: https://archive.ph/T9TaX (accessed on 22 April 2025).
- Developer Ecosystem Report 2022. Available online: https://archive.ph/DazVv (accessed on 22 April 2025).
- Developer Ecosystem Report 2021. Available online: https://archive.ph/Vvhf0 (accessed on 22 April 2025).
- Developer Ecosystem Report 2020. Available online: https://archive.ph/EvX0y (accessed on 22 April 2025).
- Developer Ecosystem Report 2019. Available online: https://archive.ph/yyI0K (accessed on 22 April 2025).
- Developer Ecosystem Report 2024. Available online: https://archive.ph/NhJ2P (accessed on 22 April 2025).
- “Who is Hiring?” Postings Bounce Back to Twelve Month High (May 2024). Available online: https://archive.ph/SHrdw (accessed on 22 April 2025).
- GitHub Flutter. Available online: https://archive.ph/TTCzG (accessed on 22 April 2025).
- GitHub React-Native. Available online: https://archive.ph/IFxAd (accessed on 22 April 2025).
- GitHub MAUI. Available online: https://archive.ph/lYbs7 (accessed on 22 April 2025).
- Flock. Available online: https://archive.ph/KKSBC (accessed on 13 March 2025).
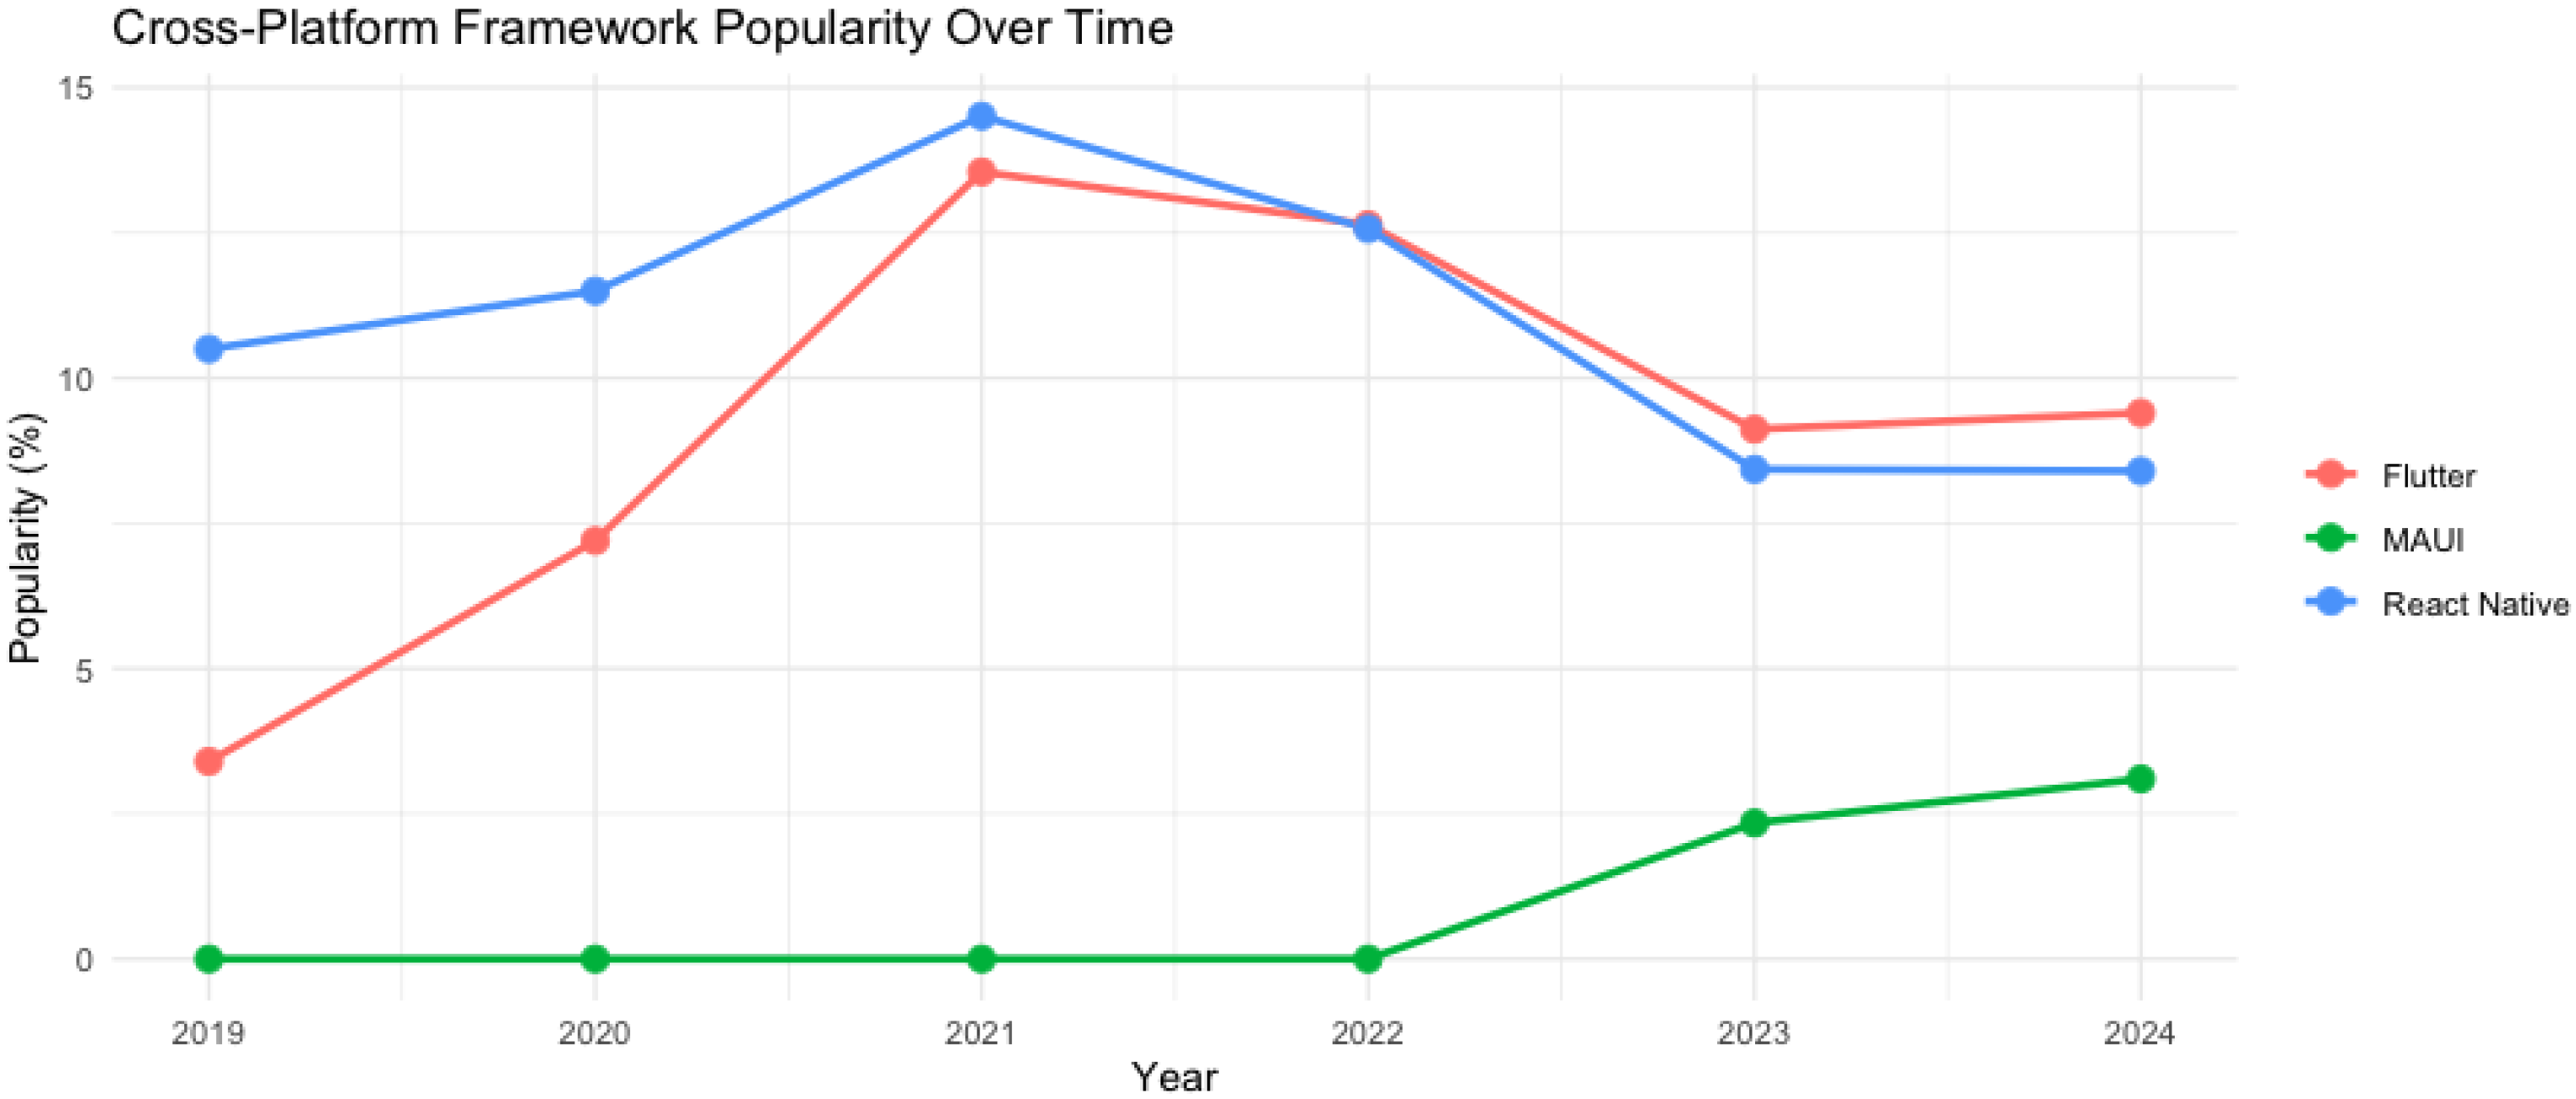
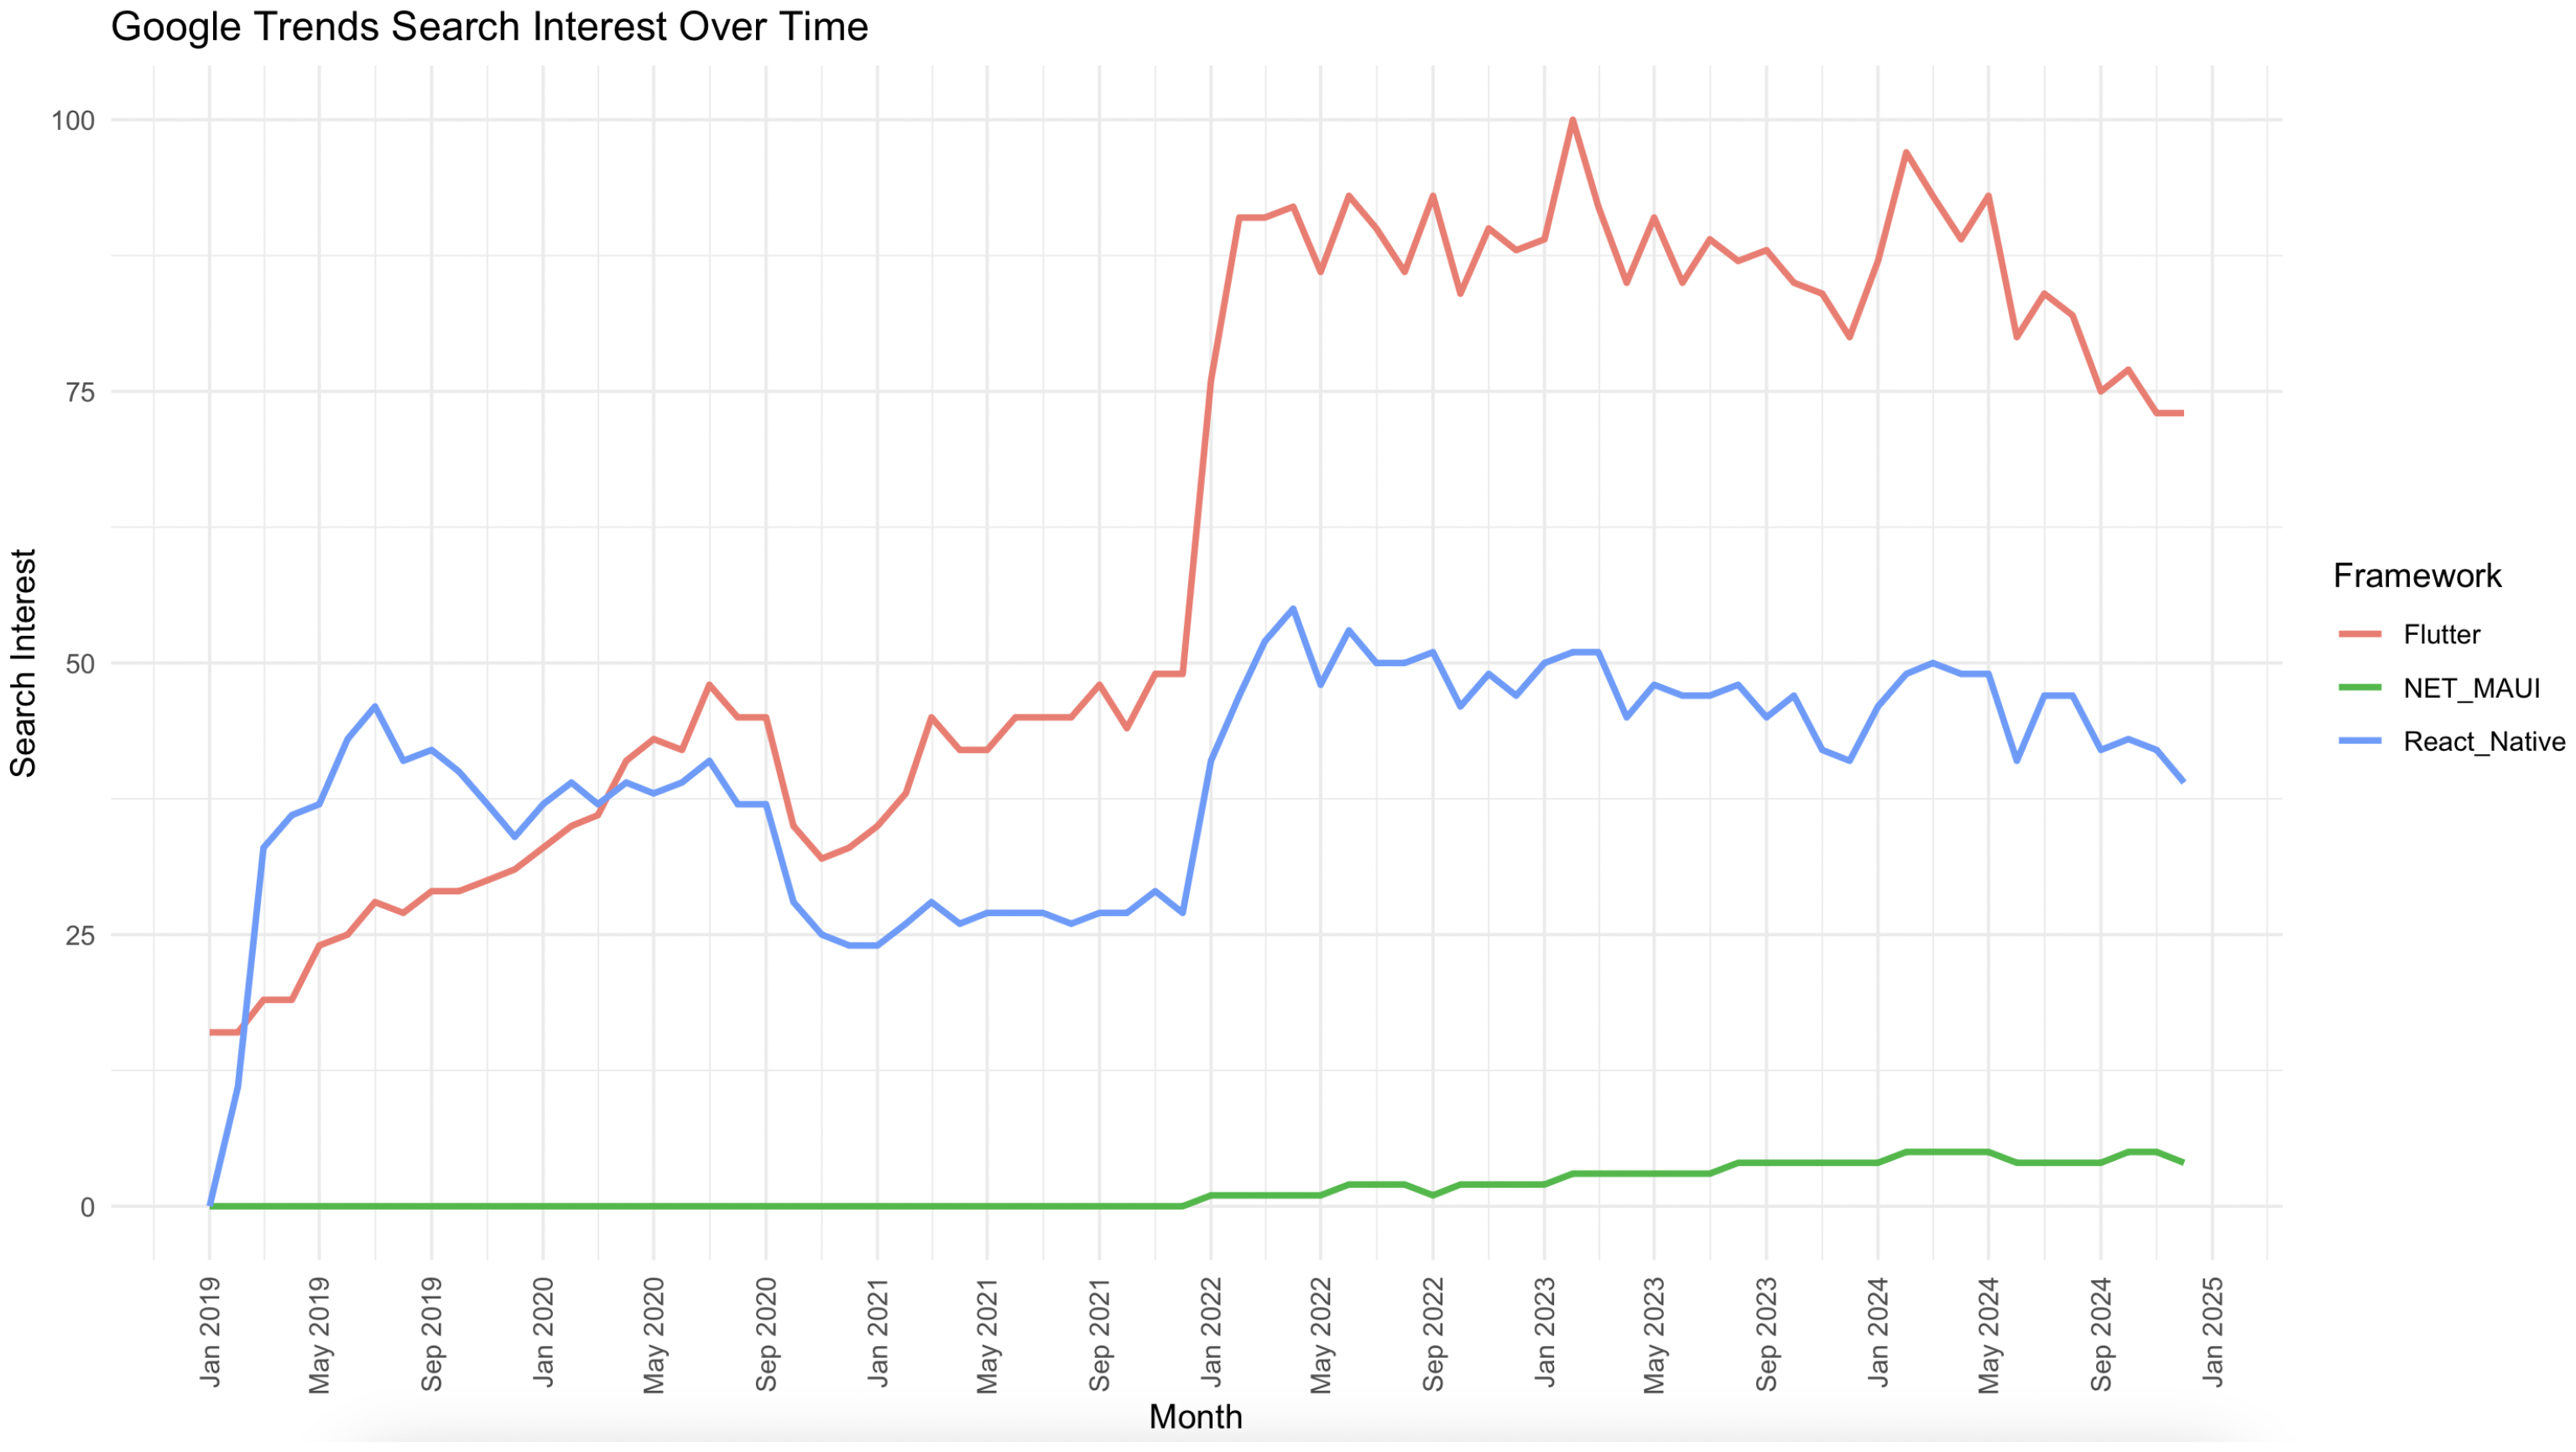
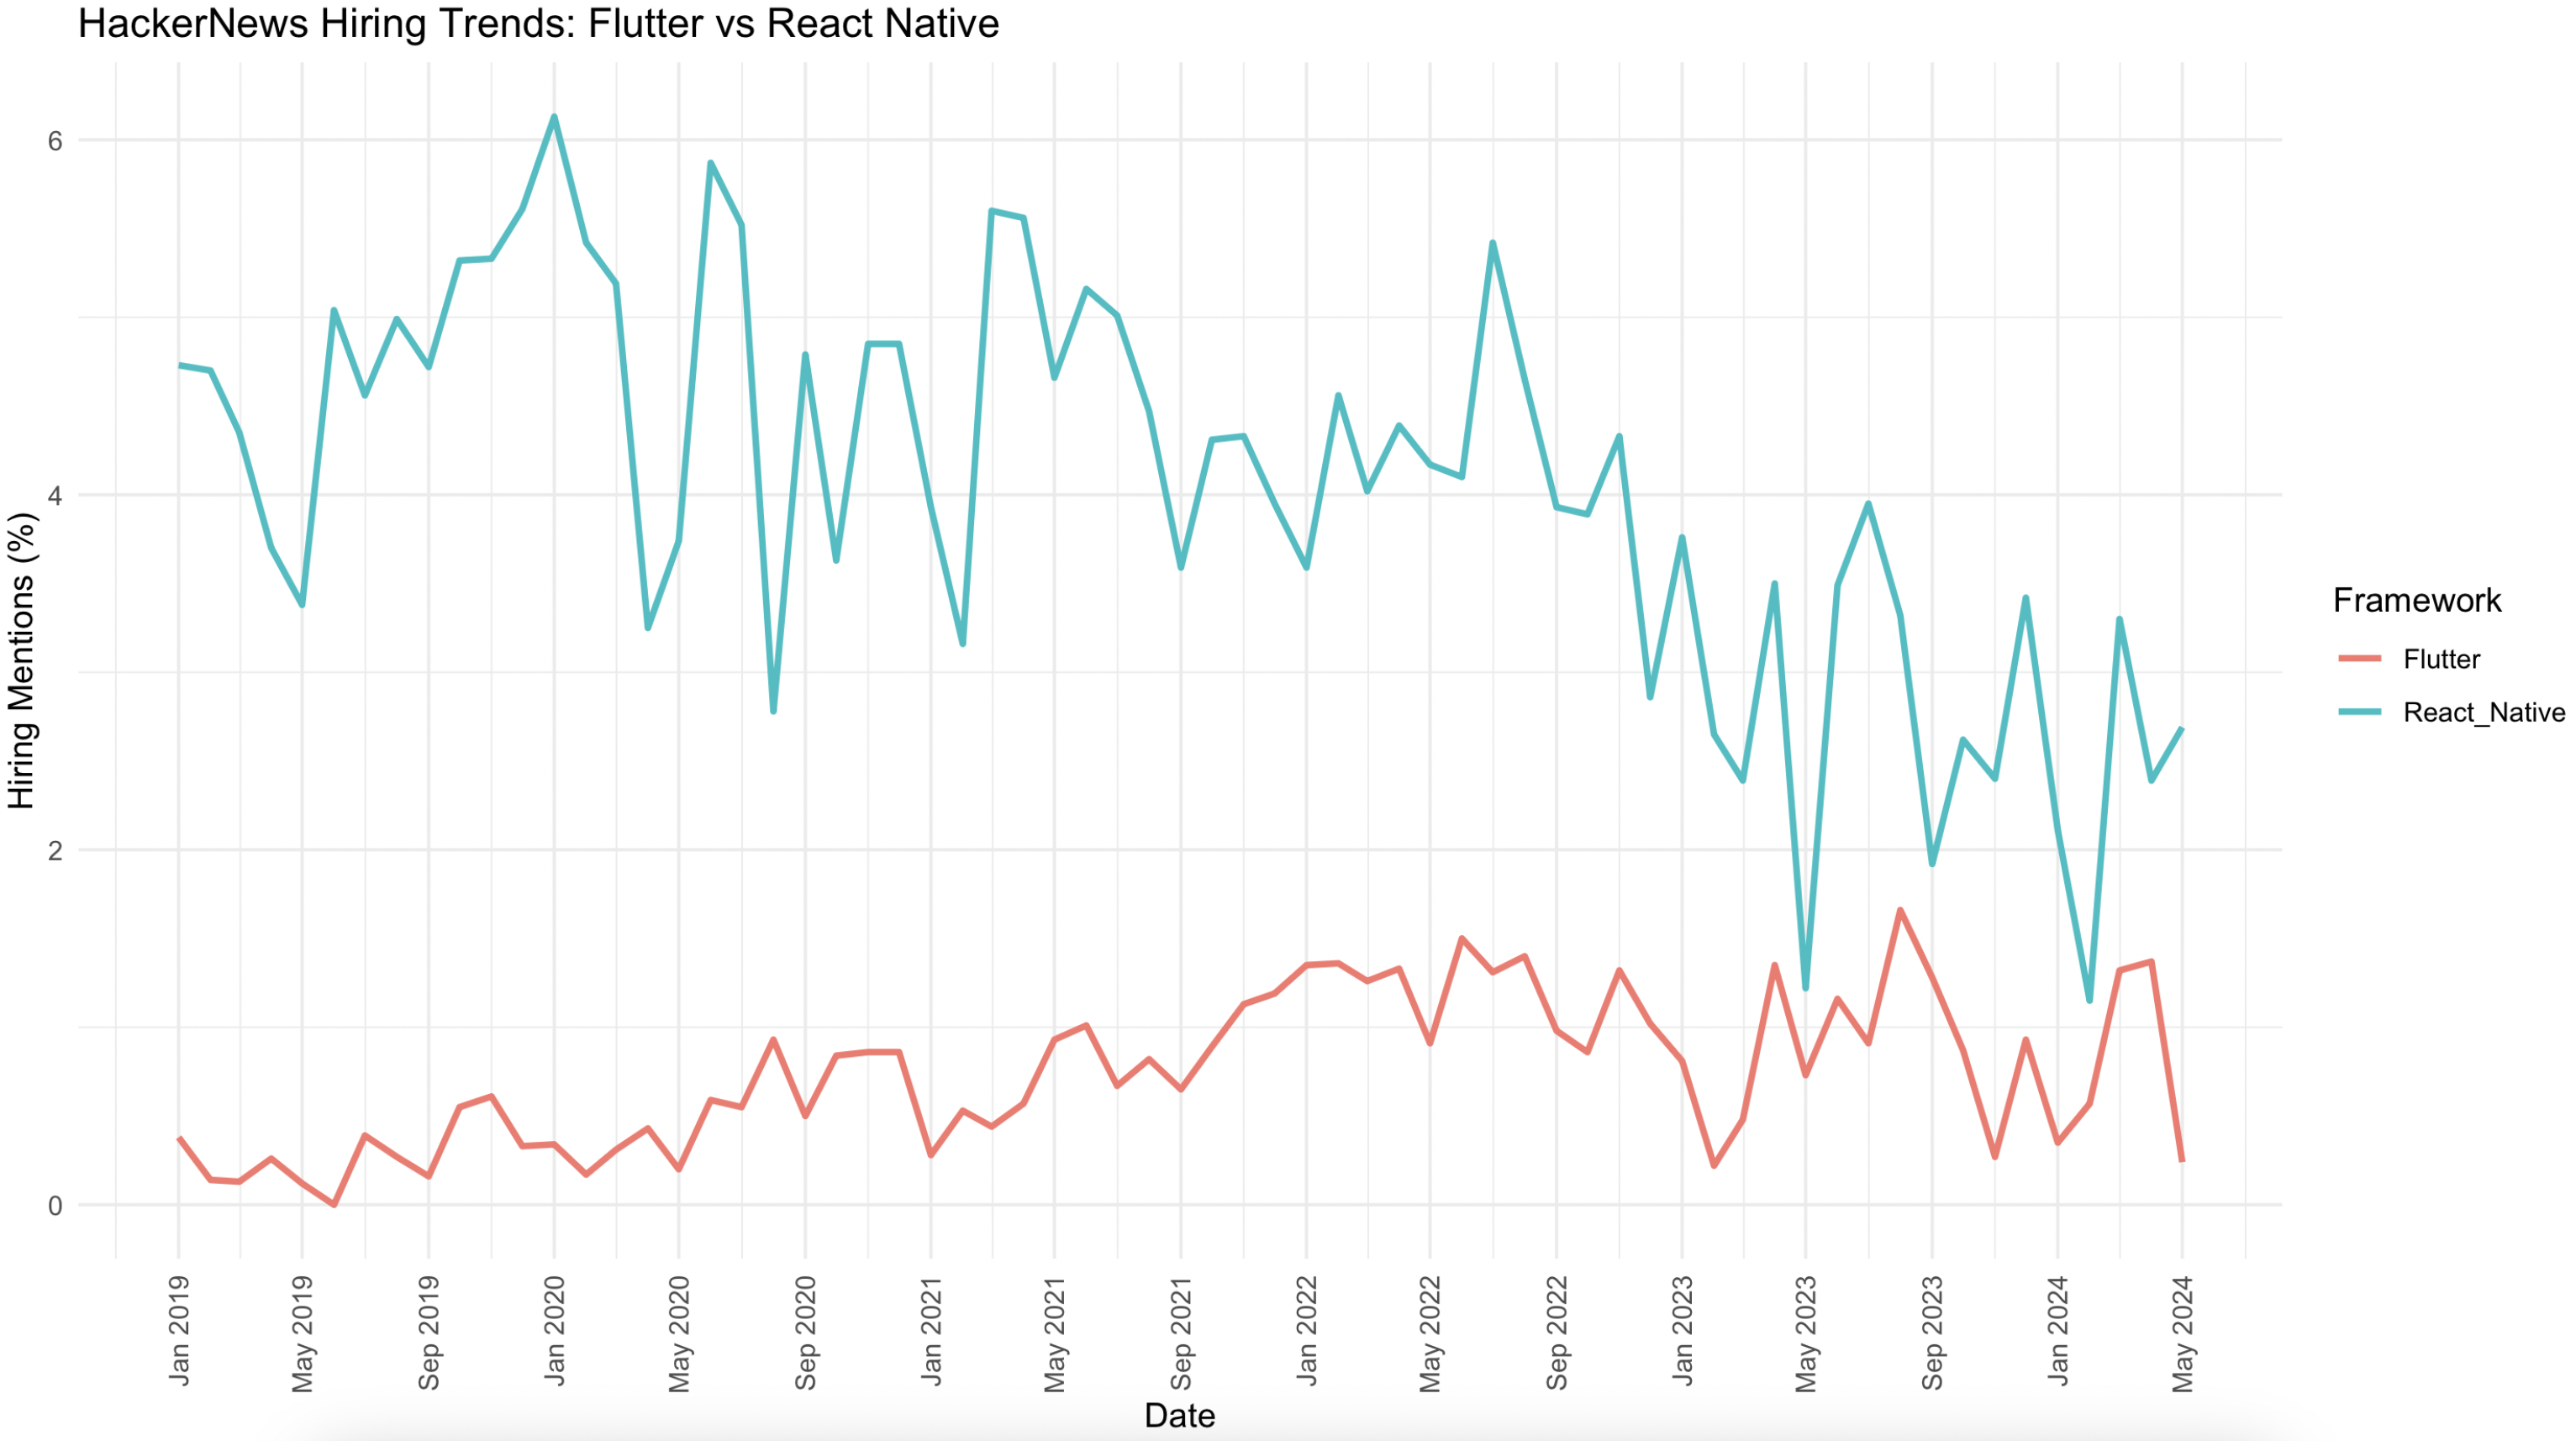
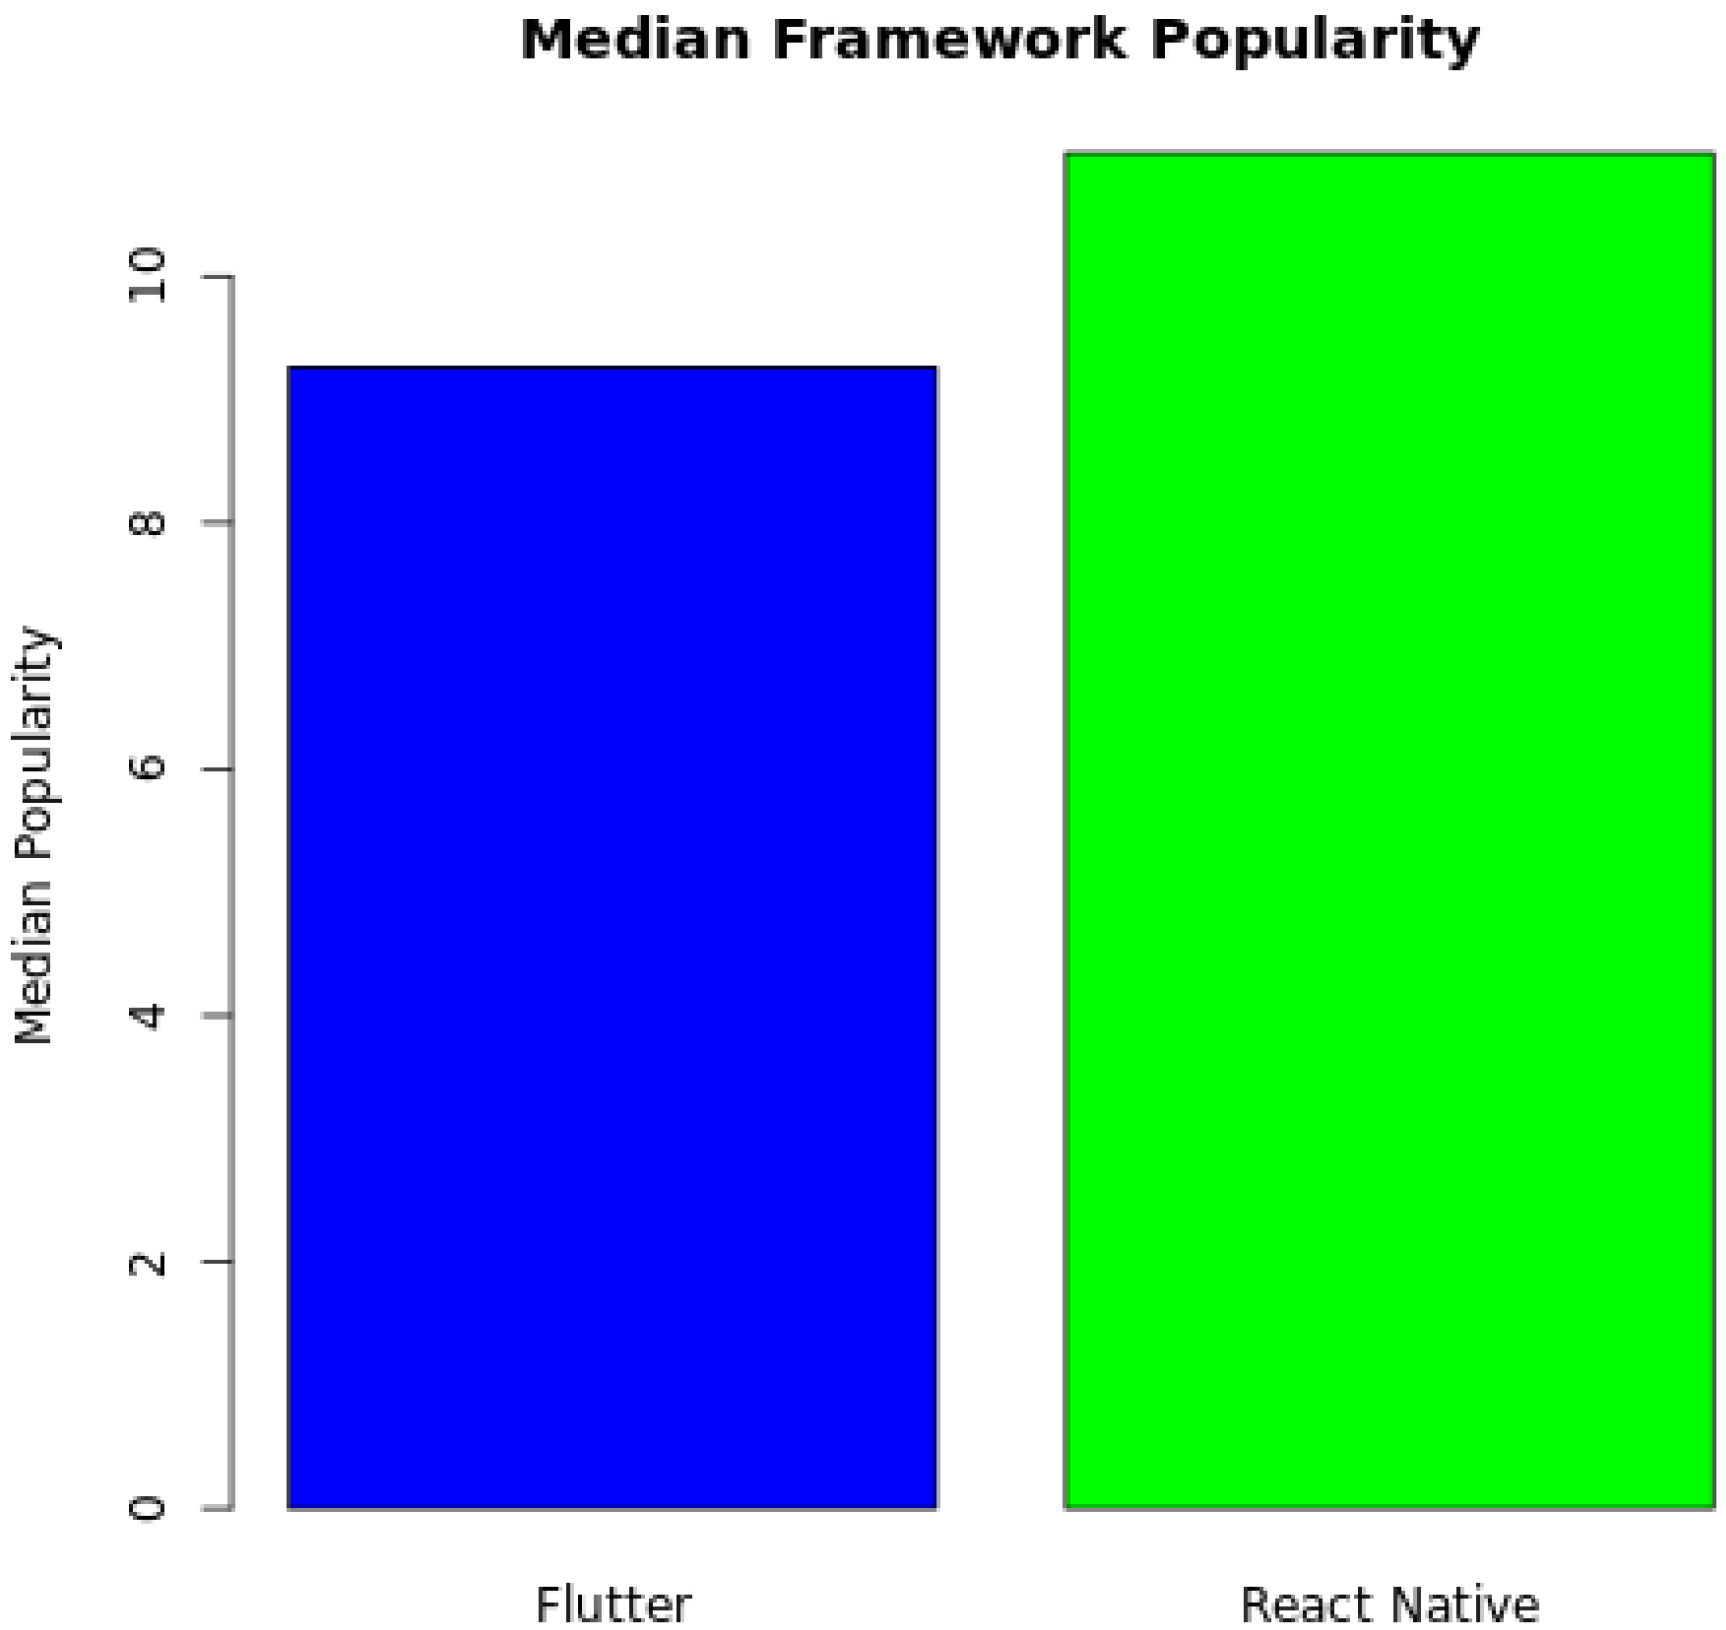
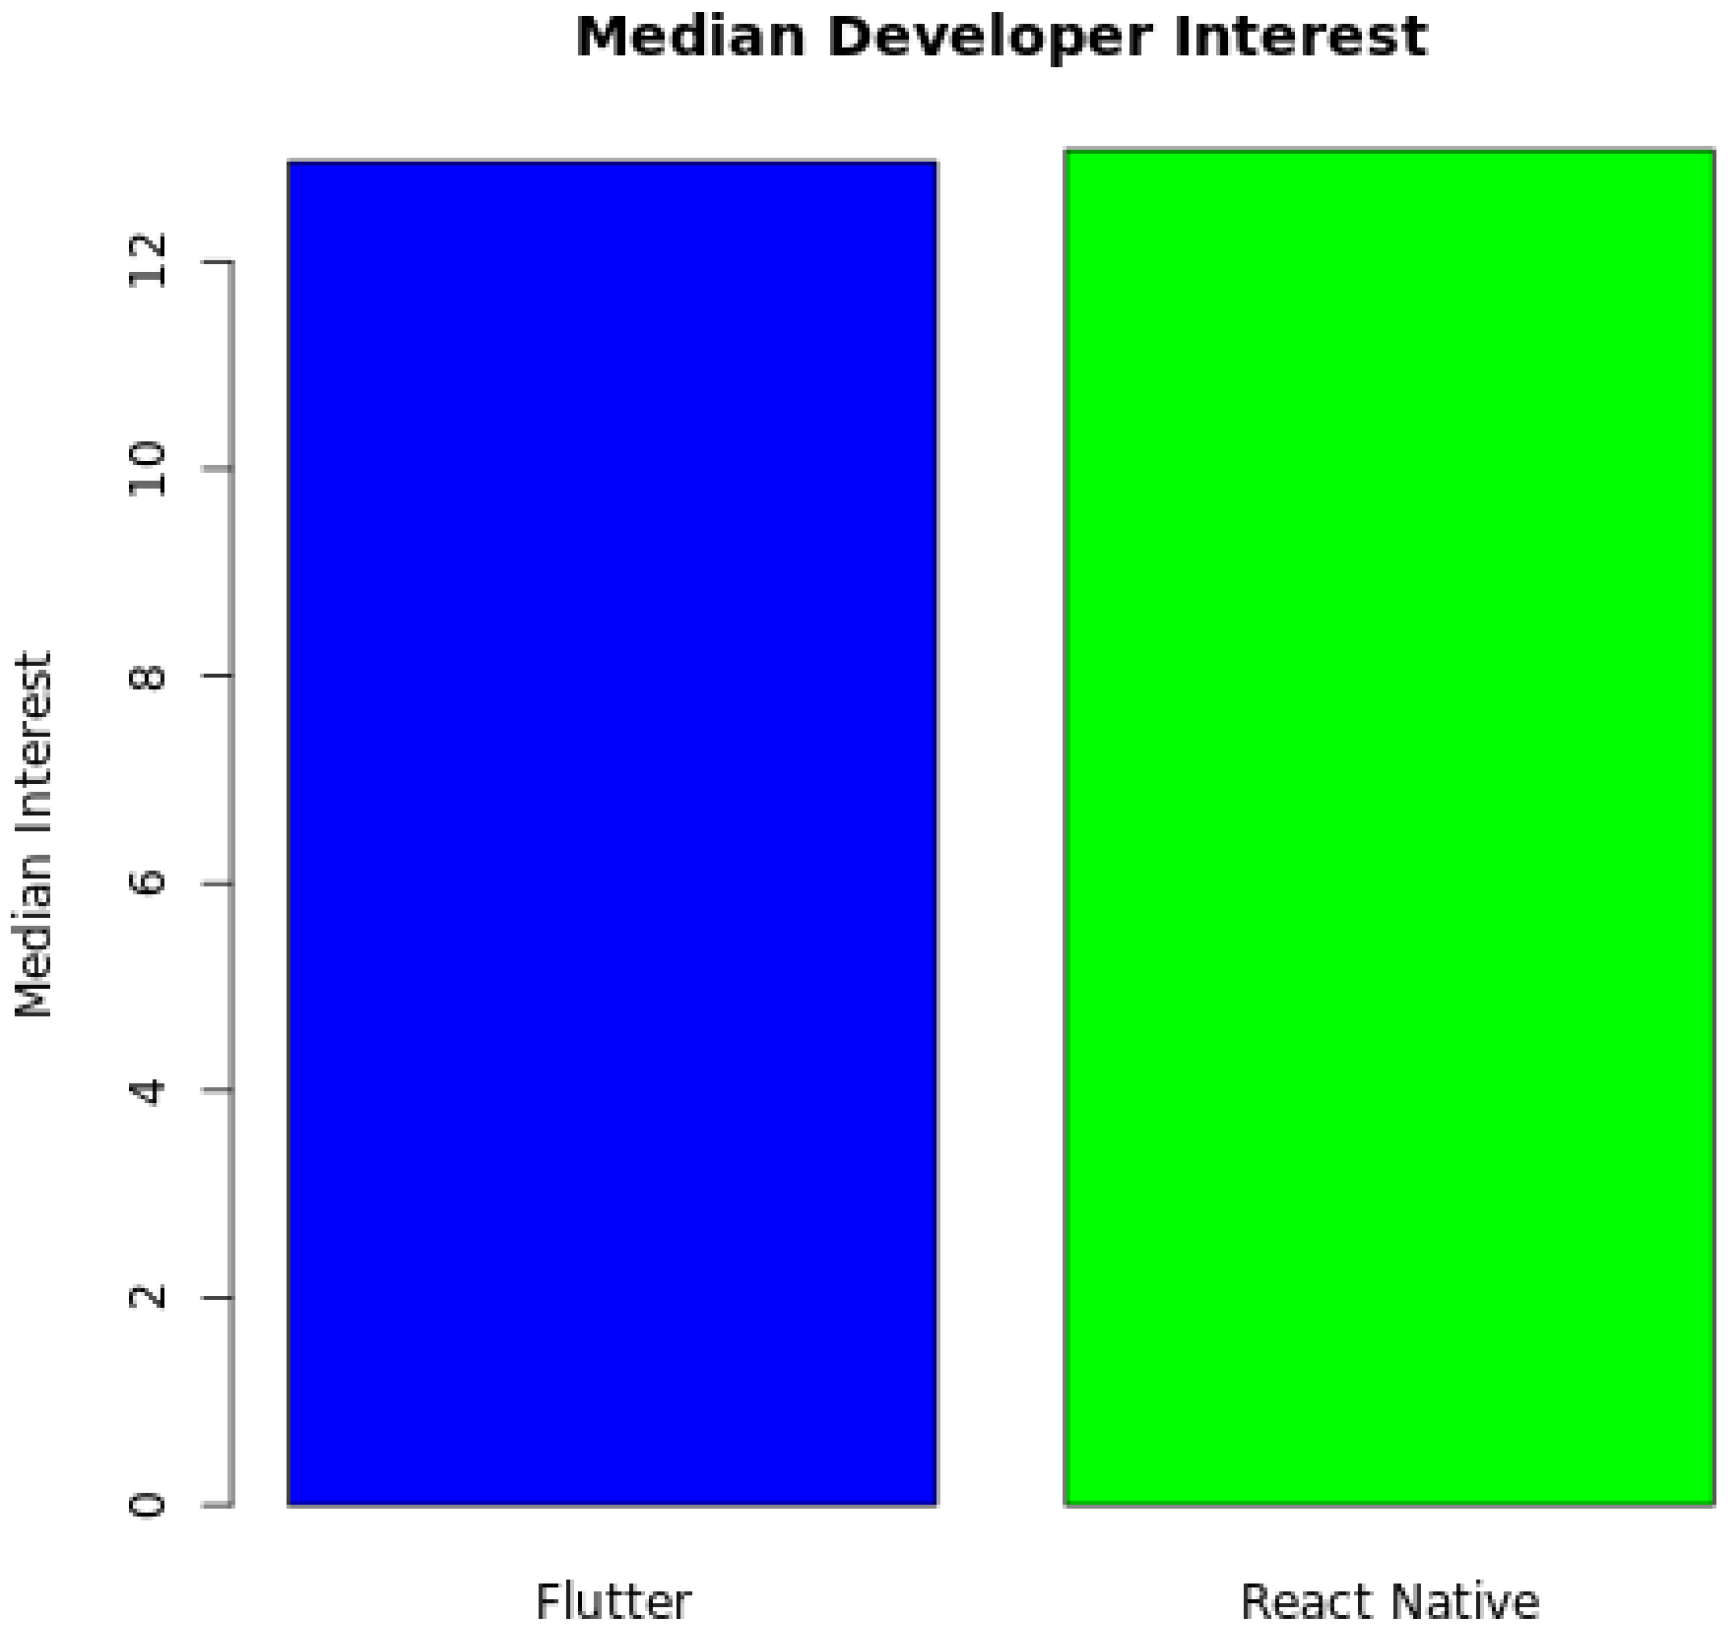
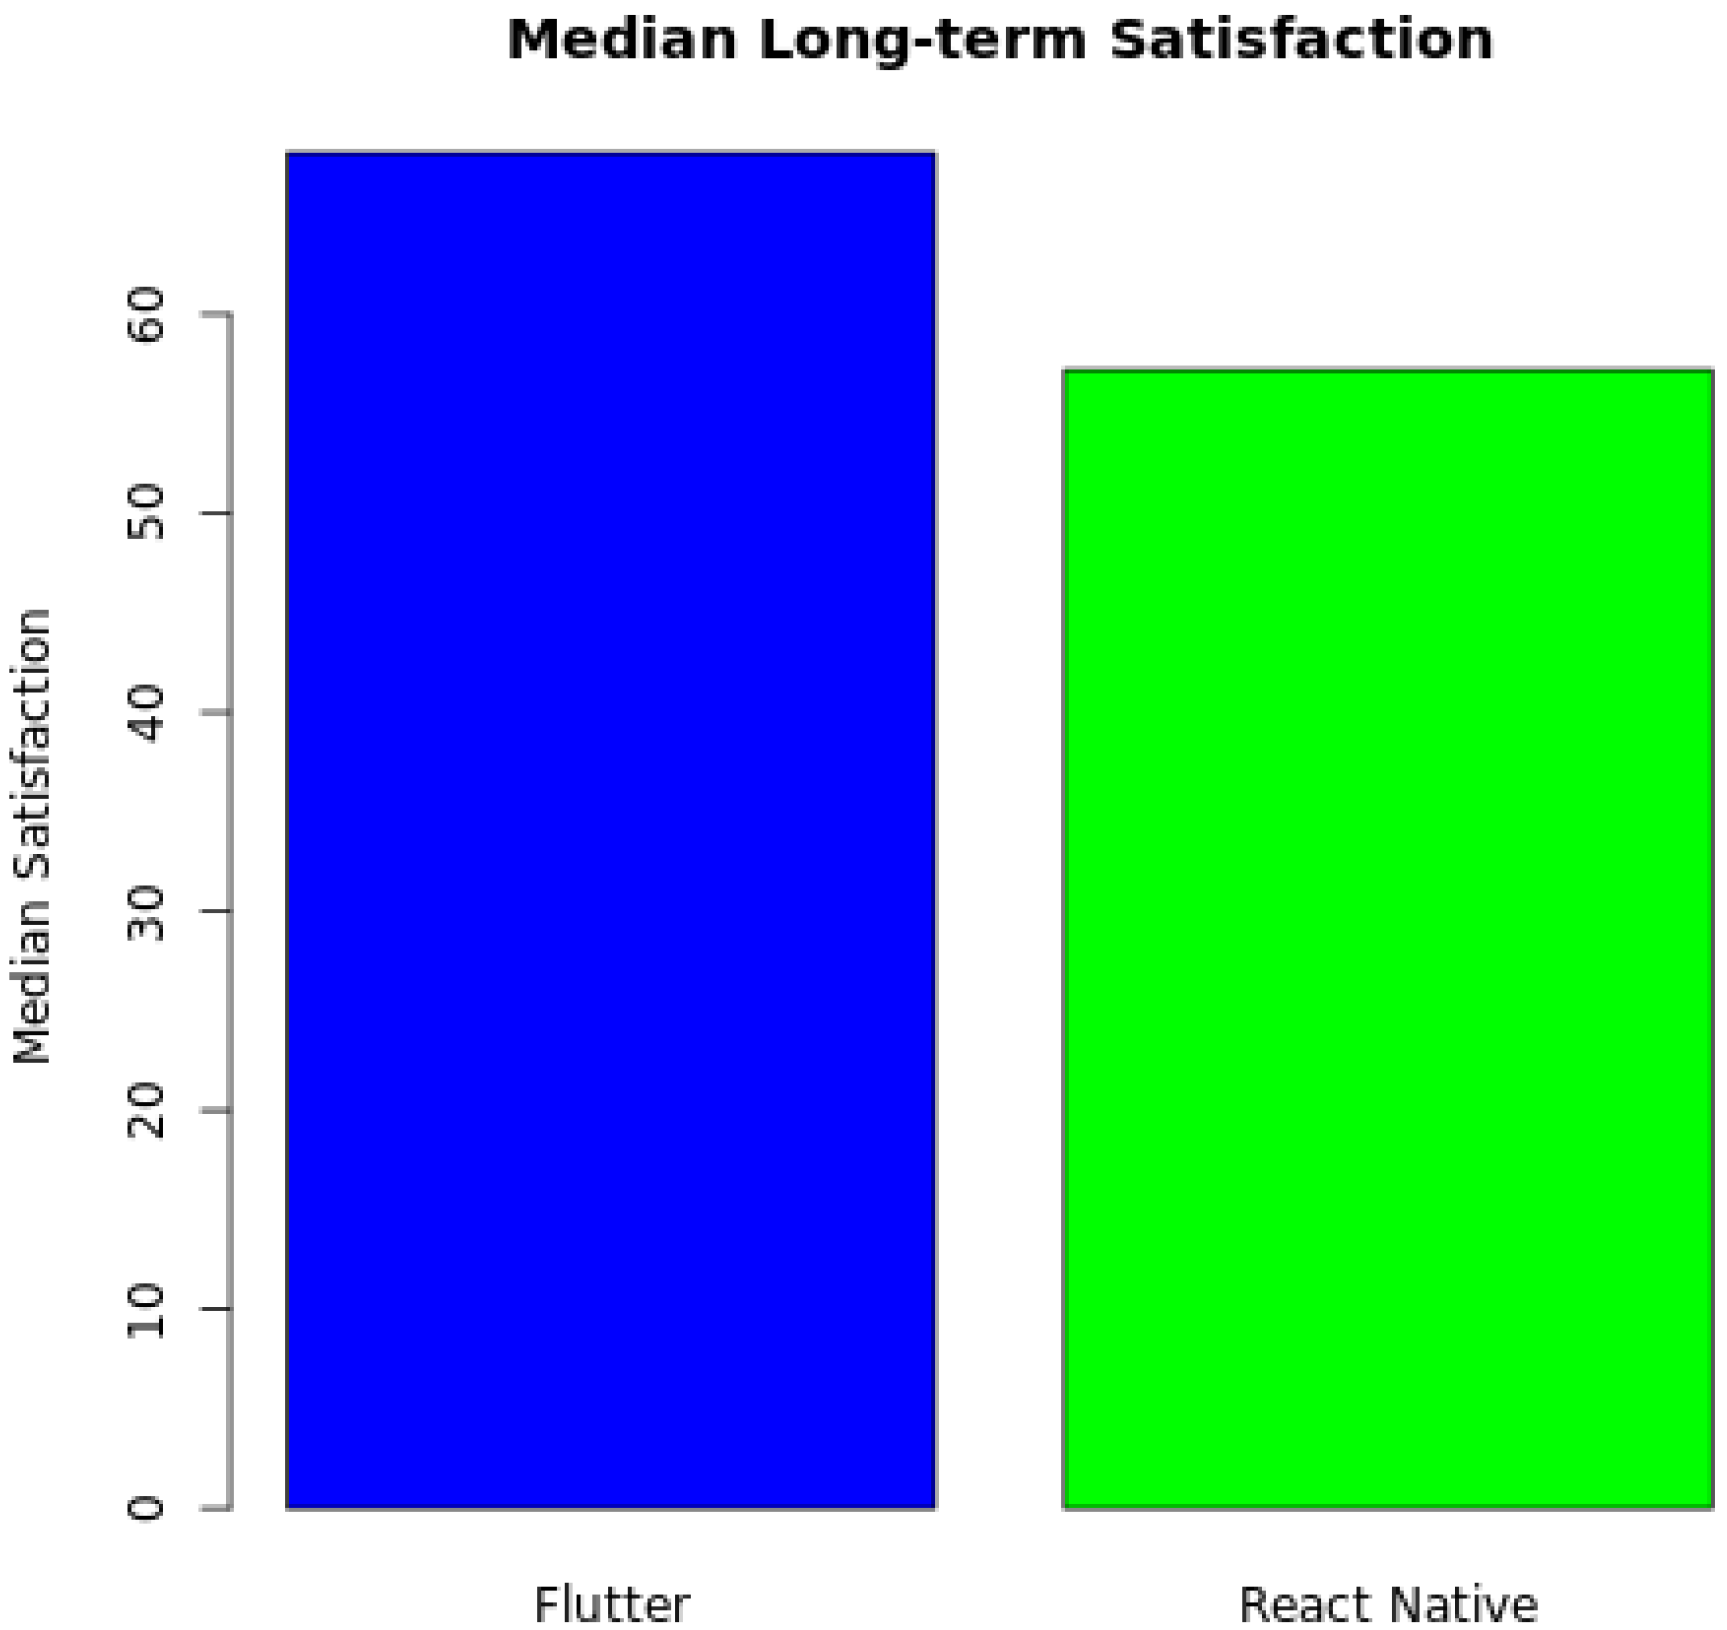

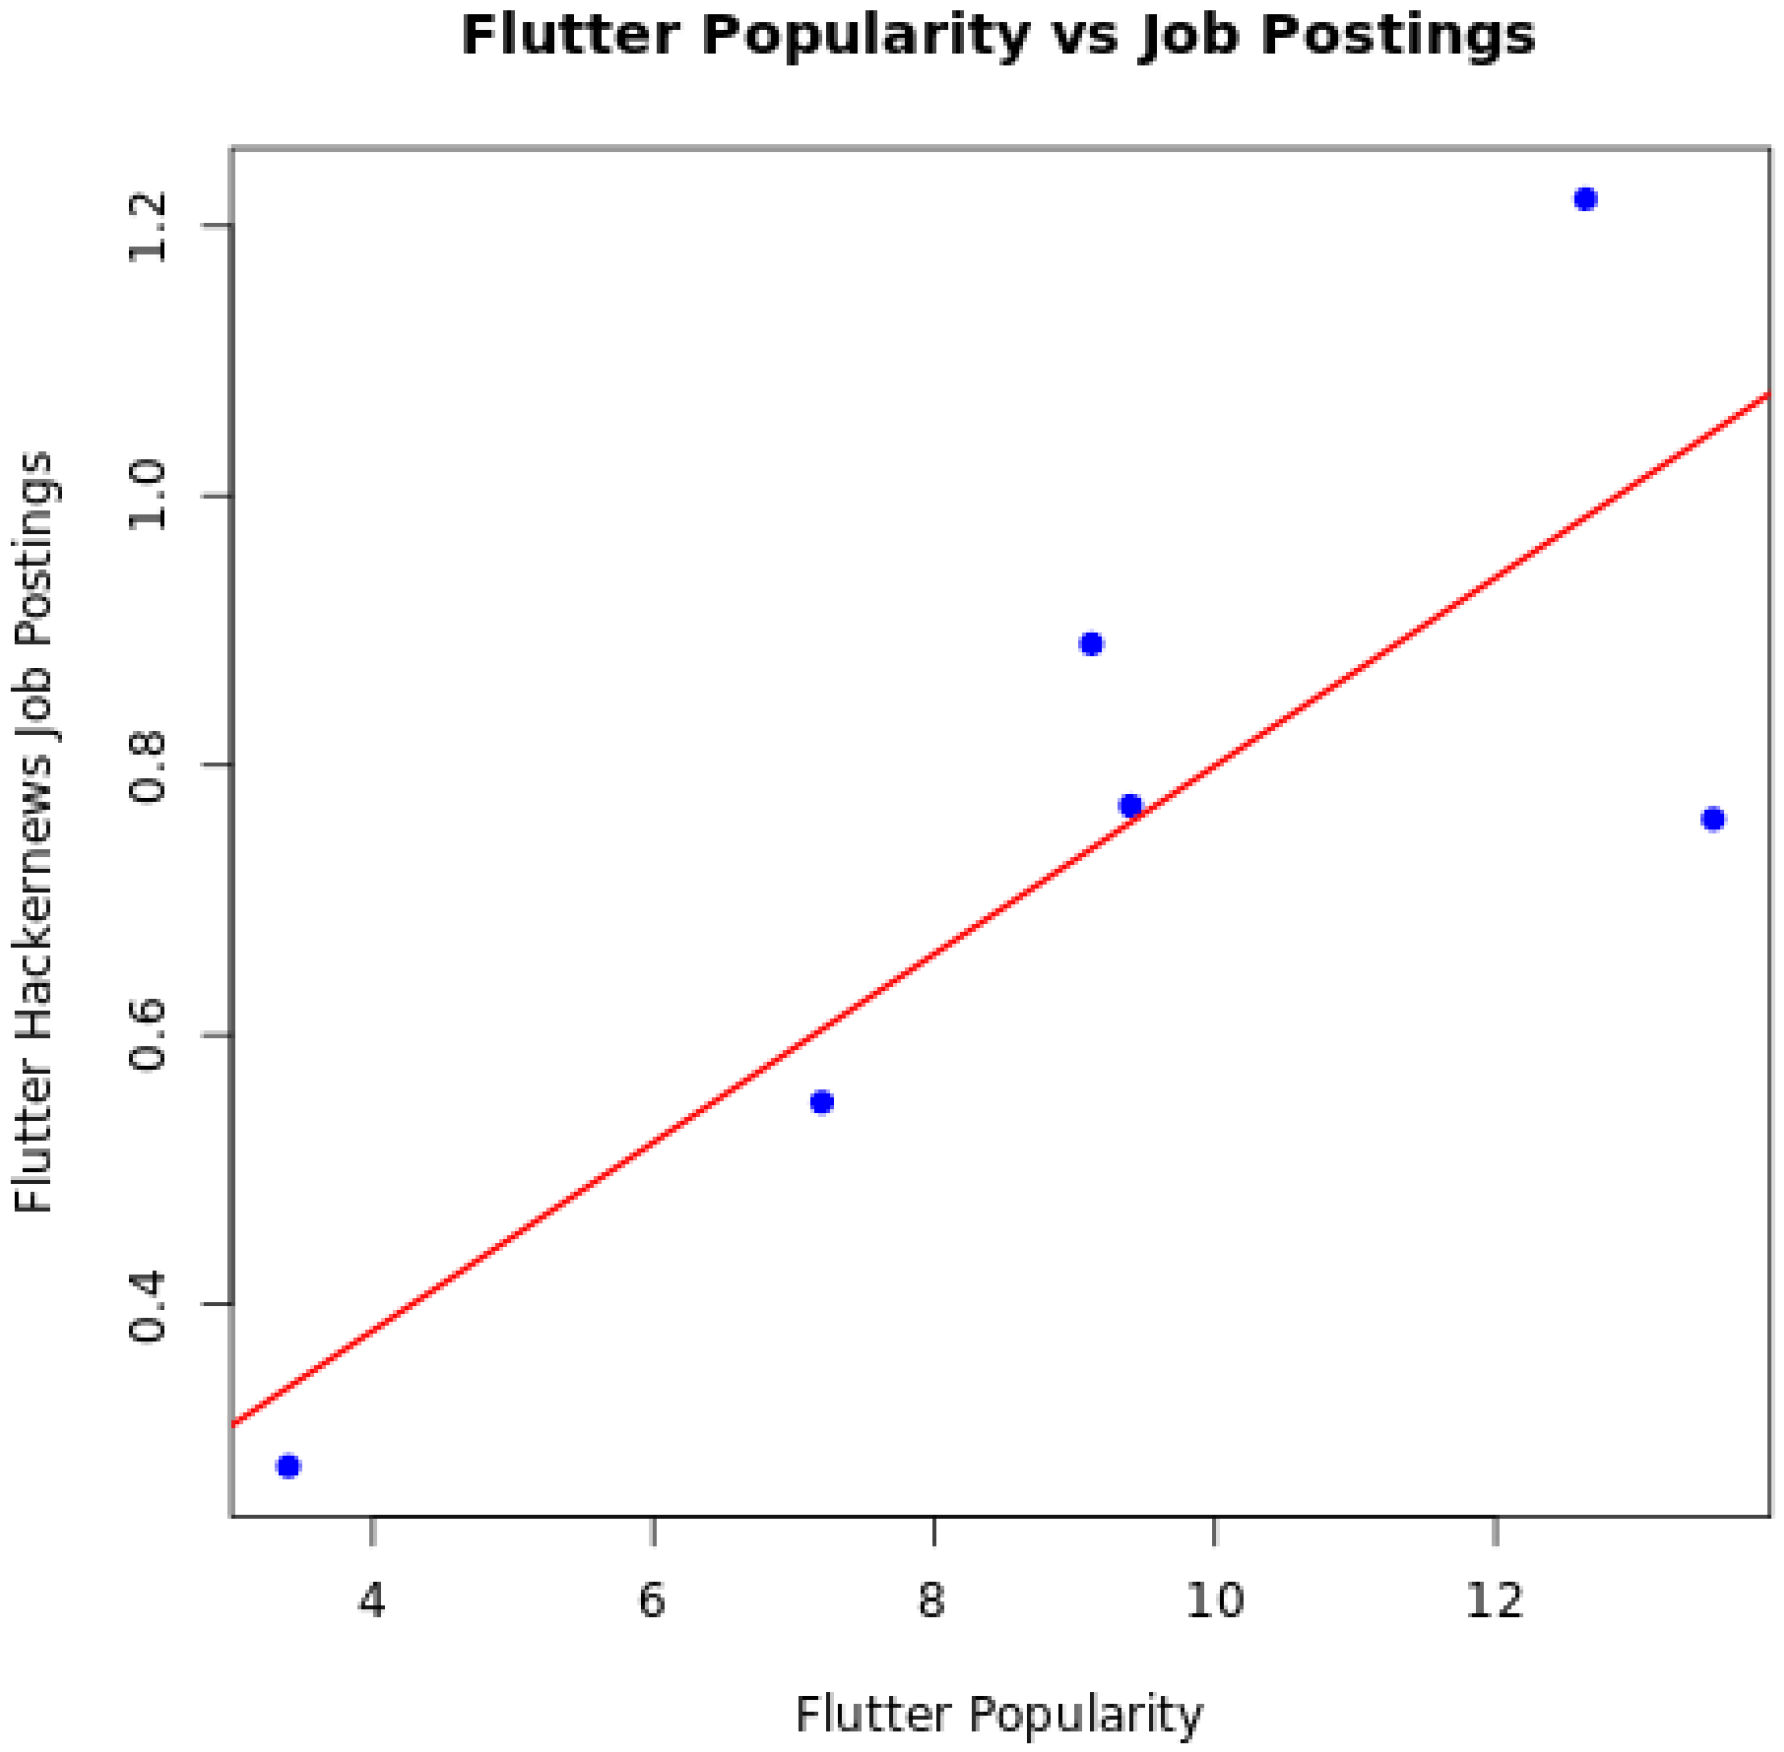
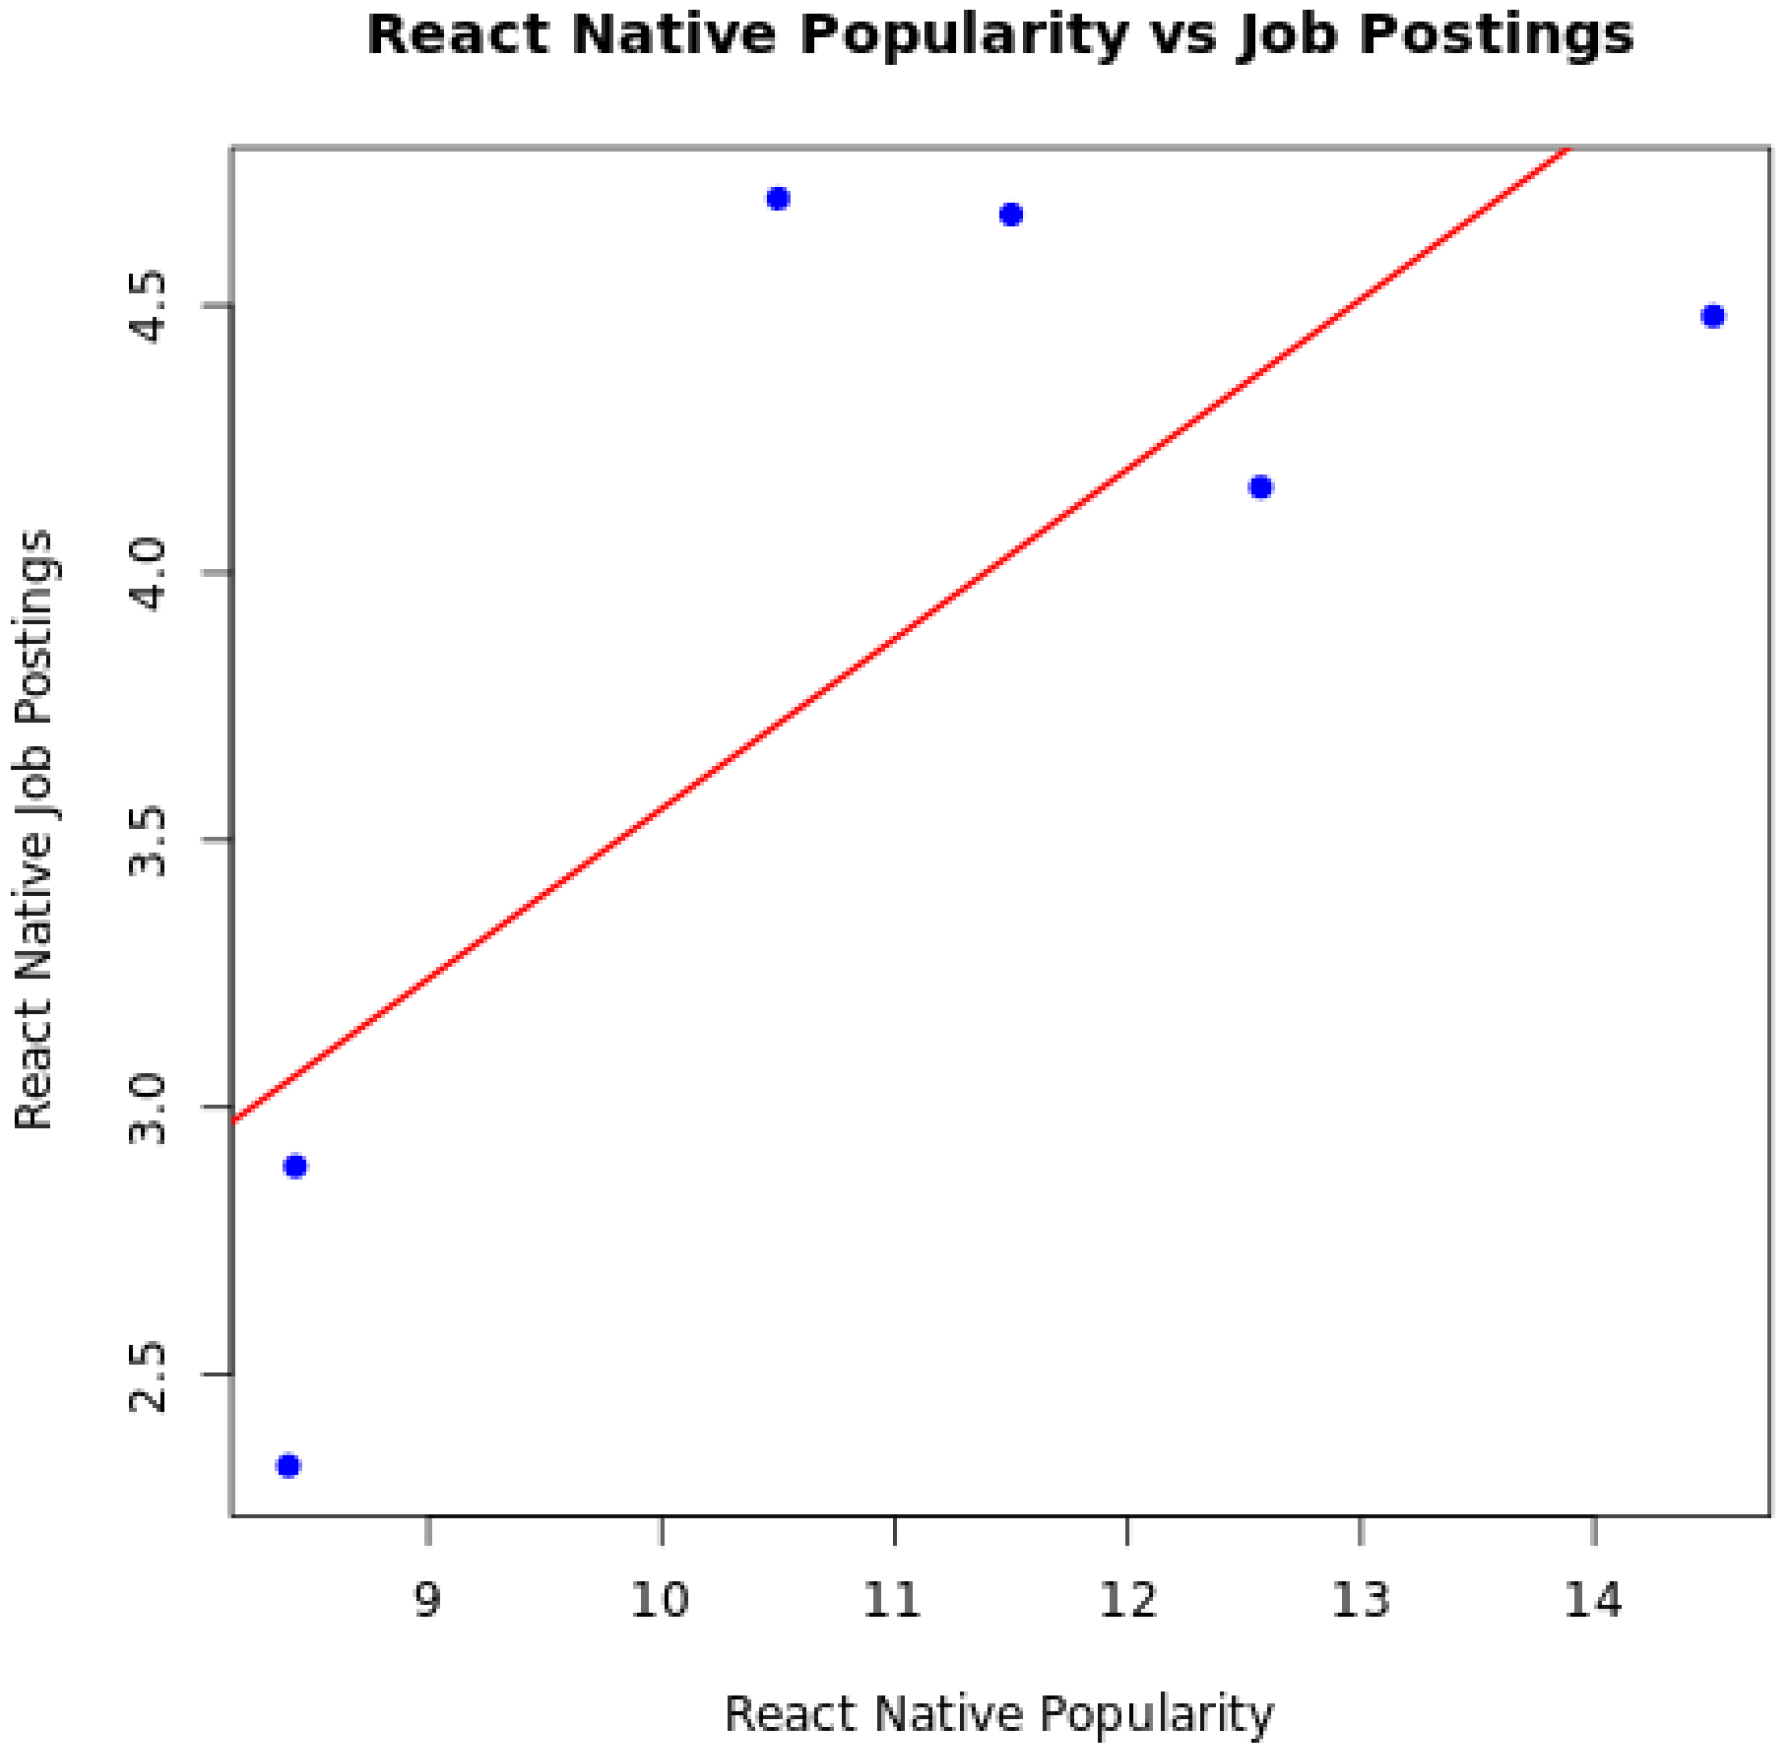
Disclaimer/Publisher’s Note: The statements, opinions and data contained in all publications are solely those of the individual author(s) and contributor(s) and not of MDPI and/or the editor(s). MDPI and/or the editor(s) disclaim responsibility for any injury to people or property resulting from any ideas, methods, instructions or products referred to in the content. |
© 2025 by the authors. Licensee MDPI, Basel, Switzerland. This article is an open access article distributed under the terms and conditions of the Creative Commons Attribution (CC BY) license (https://creativecommons.org/licenses/by/4.0/).