Abstract
This paper examines online learner engagement, a complex concept encompassing several dimensions (behavioral, emotional, and cognitive) and recognized as a key indicator of learning effectiveness. Engagement involves participation, motivation, persistence, and reflection, facilitating content understanding. Predicting engagement, particularly behavioral engagement, encourages interaction and aids teachers in adjusting their methods. The aim is to develop a predictive model to classify learners based on their engagement, using indicators such as academic outcomes to identify signs of difficulty. This study demonstrates that engagement in quizzes and exams predicts engagement in lessons, promoting personalized learning. We utilized supervised machine learning algorithms to forecast engagement at three levels: quizzes, exams, and lessons, drawing from a Kaggle database. Quiz and exam scores were employed to create predictive models for lessons. The performance of the models was evaluated using classic metrics such as precision, recall, and F1-score. The Decision Tree model emerged as the best performer among those evaluated, achieving 97% and 98.49% accuracy in predicting quiz and exam engagement, respectively. The K-Nearest Neighbors (KNN) and Gradient Boosting models also showed commendable performance, albeit slightly less effective than the Decision Tree. The results indicate a strong correlation between engagement predictions across the three levels. This suggests that engagement in quizzes and exams, known as assessments, is a pertinent indicator of overall engagement. Active learners tend to perform better in these assessments. Early identification of at-risk learners allows for targeted interventions, optimizing their engagement.
1. Introduction
Adaptive e-learning environments have revitalized e-learning worldwide by making learning resources affordable and available. With this transition, many challenges have emerged [1]. The learning process can be attributed to a decline in learner motivation and interest due to a lack of interaction with the instructor [2], leading to course dropout or even abandonment of the learning path. Learner engagement in a learning environment is considerably crucial, as it is linked to learning rates [3]. Learner engagement can be defined as a combination of the cognitive, behavioral, and emotional aspects of the learner to accomplish a task [4,5] by matching academic success, perseverance, satisfaction, and a sense of belonging. It can also be defined as a unit for measuring the learner’s degree of interaction and effort [6]. A significant level of engagement requires adaptive and flexible environments able to match different levels of engagement and learners’ preferences to have a thorough and holistic understanding of their behaviors in a learning environment. According to [7], learner engagement can be divided into four domains, namely: emotional, behavioral, cognitive, and agentic engagement. The learner’s cognitive aspect refers to their psychological engagement in educational activities, including motivation to learn, understanding, and willingness to master skills [8,9]. The behavioral aspect refers to his participation, effort, and perseverance in activities.
Our work is based on the conception of engagement proposed by [10], who defines it according to three dimensions: behavioral, emotional, and cognitive. Additionally, it is inspired by the theory of self-determination [11], according to which the satisfaction of fundamental needs such as autonomy, the feeling of competence, and social relations plays an important role in maintaining long-term engagement.
Predicting learner engagement, particularly behavioral, in e-learning environments is crucial, as many studies have shown. This enhances learning dynamics by giving students a sense of ownership over their education and empowering instructors to modify the way they teach based on their interactions and behaviors. Ultimately, this leads to the development of recommender systems. The current work focuses on identifying the most effective machine learning techniques for predicting engagement, as explored by [12,13,14,15].
Therefore, our paper aims to propose an intelligent predictive model to classify learners according to their engagement in the virtual learning environment (VLE). The input data represent students, exams, quizzes, and lessons, and the algorithm must predict whether the learner is engaged. In addition, the paper also presents the methods used in a large body of work on learner modeling and adaptive learning.
2. Related Work
Learner performance is the measure of progress in a learning path. It is generally influenced by several elements, including engagement, which is important in e-learning. Many studies have examined the measurement of this performance by exploring learner engagement, particularly in e-learning environments. Most studies have affirmed the positive impact of information technologies in these environments [16,17].
Certainly, these technologies facilitate access to content and enhance learner interaction. They enable learners to acquire not only knowledge, but also behavioral skills such as problem solving, analytical, critical, and synthesizing thinking, and collaborative work, which is an essential element of engagement [18]. Reasons why learners feel a sense of belonging to their learning environments [19]. Consequently, it is worth focusing on learner engagement to ensure effectiveness [20]. Dixson has proposed that skills, participation, performance, and emotion represent measurement indicators and components of engagement [21]. This highlights a holistic approach to understanding how these factors interact. Competence manifests itself in learning style, while participation appears in the interactivity of different peers through discussions and sending messages that make the learning environment dynamic.
The performance component is promoted by results and grades from past exams and quizzes. In addition, the majority of studies use surveys and observations [17,22], while others use approaches based on machine learning [20,23]. However, other studies adopt a more quantitative approach, collecting information from learners in real time to assess their engagement. This section focuses specifically on research into learner engagement in e-learning environments. To this end, various methods and input data were deployed to examine the correlation between learner information and engagement.
The authors of [24] surveyed 325 students to examine their goal of continued use of asynchronous online courses based on four key factors (intrinsic motivation, extrinsic motivation, perception of multiple sources, and cognitive engagement). They revealed that cognitive engagement was the only factor linked to the continued use of online courses. This observation underlines the importance of cognitive engagement in developing learners’ perseverance. Other researchers have looked at analyzing learners’ emotions and facial expressions to predict their engagement by using facial recognition techniques [25,26,27]. For example, Bhardwaj used computer vision techniques to measure learner engagement, highlighting the importance of emotions. Moreover, learner engagement was predicted based on images collected in real time by webcams. They combined both deep learning-based methods for engagement detection and facial emotion recognition [7].
In another study, machine learning methods were used to predict early performance and therefore engagement of learners based on specific characteristics (such as gender, age, etc.) and engagement indicators (such as course satisfaction, frequency of logging in, accessing, and downloading courses) and assessment scores. This design underlines the importance of combining demographic data for better engagement accuracy [12]. In another study [28], learner engagement was the basis for analyzing the test results of five convolutional neural network (CNN) models.
Different predictive models with different algorithms (Naïve Bayes, Random Forest, K-Nearest Neighbors (k-NN), Support Vector Machine (SVM), and Artificial Neural Networks (ANN) Data Mining and machine learning algorithms) have been used [29] to predict learner performance based on the analysis of demographic, engagement, and performance data from the Open University dataset taken from Kaggle. This multitude of algorithms underlines the importance of choosing the right model based on the characteristics of the data. The results showed that k-NN and ANN performed best.
Several works have used the Open University Learning Analytics Dataset (OULAD) [30], which includes information on 22 courses and 32,593 students. The specificity of this dataset lies in the assembly of demographic data as well as learner interaction data in the virtual learning environment (VLE). To investigate the impact of different activities on learner engagement, ref. [31] exploited cross-lag modeling techniques and concluded that course design and student perception variables have a large impact compared to individual characteristics on engagement. No less than multitasking harms engagement. That said, the quality of content conception has an important role to play in improving engagement.
A study by [32] intended to examine the correlation between learning material and learners’ final grades using a statistical approach. Ref. [33] showed that machine learning algorithms are effective in predicting learner engagement. According to [34], the various works that correspond to learner engagement used machine learning or deep learning models (XGboost, LightGBM, random forest, neural networks, CATBoost, and stacking methods).
Lima, Costa, Araújo, and Dorça explored the relationship between learner engagement and academic performance, taking into account learners’ self-regulation profiles. Clustering algorithms such as K-means, EM, and Agglomerative were applied to the OULAD database. The results showed a positive correlation: the more learners interact with learning resources, the better their academic performance. This finding reinforces the idea that interaction is a lever for academic success [35].
Alruwais and M. Zakariah aimed to predict learner engagement based on data taken from an online learning platform (VLE). The data were prepared using data preparation techniques and then evaluated by various machine learning algorithms. The CATBoost model showed the best performance, with an accuracy of around 92.23%, a precision of 94.40%, and a recall of 100% [6].
Similarly, ref. [36] used deep learning to build a CNN model from data consisting of videos and images of learners at Ibn Tofaïl University in Kenitra, Morocco. The study aimed to measure learners’ levels of engagement and emotions during the learning process. The results show that it is possible to quantify learners’ participation and identify their emotions, to make decisions to improve interaction and learning. In another work [37], the same authors examined the increase in drop out rates linked to learners’ emotional and health status. For this purpose, they adopted an approach to analyzing learners’ video sequences, which enables both their emotions to be analyzed and their level of engagement to be measured. This approach combines advanced algorithms and machine learning methods. The results provide valuable insights into learners’ experiences, influencing the teaching methodologies adopted by teachers.
Recently, several works have revealed advanced approaches for detecting learner engagement by exploring artificial intelligence, as well as emotional and cognitive data. For example, the automated analysis of collaborative online discussions, in synchronous and non-synchronous contexts, through a probabilistic clustering approach, enables the identification of learners’ roles and transition categories to better understand the complexity of their engagement [38].
Other studies have adopted an automated configurational approach, combining bidirectional encoder representation from transformers (BERT) and fuzzy set qualitative comparative analysis (fsQCA). The aim is to understand the multidimensional characteristics of learner engagement in MOOCs and to identify specificities across disciplines [39].
Although our study focuses on behavioral engagement, due to the limitations of the available data, we recognize the importance and significant contribution of recent approaches that lead to the detection of the emotional and cognitive dimensions of engagement. Exploiting multimodal data offer a promising avenue for enriching engagement analysis, which we plan to exploit in future work.
Our study follows the continuity of research on the analysis of learner engagement in e-learning environments such as those already mentioned. However, in contrast to previous work, which focused mainly on behavioral or emotional aspects, our approach is distinguished by the integration of concrete data from learners’ interactions with quizzes and exams, enabling more accurate prediction of engagement in lessons.
This work makes an innovative contribution to the field of e-learning by focusing on the analysis of engagement through quizzes, exams, and lessons. Based on measurable indicators such as academic performance and engagement, it aims to personalize the learning experience. Using machine learning (ML) techniques, we offer an effective solution to improve pedagogical personalization.
3. Materials and Methods
3.1. Dataset
The goal of this study was to propose an intelligent predictive model for classifying students according to their participation in the virtual learning environment (VLE). The algorithm should be able to predict whether the learner is engaged or not based on input data, which includes student information, exams, quizzes, and lessons.
For this study, the Kaggle Student Engagement dataset that is open to the public was used [40]. This dataset includes the details about learner participation in exams, quizzes, and lessons, such as the course title, level, date the course was scored, exam category, exam length, and correctness of the answer, as well as the number of quizzes, exams, and lessons that the learner completed, as well as the date of engagement and the exam result, and more information.
The dataset contains 11 CSV files, summarized in Table 1, covering the different learning data: course info, course ratings, exam info, quiz info, student engagement, student exams, hub questions, student info, student learning, student purchases, and student quizzes. Each CSV file contains data related to its topic. Table 1 shows a general overview of the files, facilitating understanding of the data used.

Table 1.
Dataset content.
The steps followed to develop the most appropriate predictive model of student engagement are briefly illustrated in Figure 1.

Figure 1.
Model development process.
The first step was to select and extract the data in an organized and well-prepared way so that our model is not at risk of being biased. It also involved cleaning the dataset of poorly annotated data, missing data, and duplicate data. We then proceeded to the most characteristic phase of our methodology, the modeling step, which consisted of training the algorithms and tuning the hyperparameters. Finally, after the model testing step, we evaluated and compared the performance of each model to identify the most effective one.
3.2. Data Pre-Processing
Due to their format, the raw datasets were typically inappropriate for analysis. Thus, preparing the data before performing advanced analytical exploration was crucial. Our initial task was to combine these files. For this, we used the similar features of each file. Due to the size of our data, we excluded two optional files—Student Purchases and Student Information—from the combined dataset.
Initially, the pre-final dataset contained 22 features (namely: engagement_id, student_id, engagement_quizzes, engagement_exams, engagement_lessons, date_engaged, quiz_id, question_id, answer_id, answer_correct, course_id, course_rating, date_rated, minutes_watched, date_watched, exam_attempt_id, exam_id, exam_result, exam_completion, date_exam_completed, exam_category, exam_duration). Secondly, we developed two features called “Difference_rated_watched” and “Difference_examcompleted_engaged” that depict the differences between the features “date_rated” and “date_watched” and the differences between “date_exam_completed” and “date_engaged” in order. In addition, the ‘engagement_id’ feature was eliminated.
The “answer_correct” feature in the native dataset was set to “y” if the learner’s answer was correct and to “n” if, it was incorrect. The feature values in our dataset were successively assigned the values “1” and “0”. The value of the “exam_duration” feature was also adjusted in minutes. The prediction targets had assigned values of 1 for engaged students and 0 for unengaged learners. The two variables, Difference_rated_watched and Difference_examcompleted, were selected from the list below. More precisely,
- Difference_rated_watched = date_rated − date_watched;
- Difference_examcompleted = date_exam_completed − date_engaged.
These dates were converted into the standard YYYY-MM-DD format and then transformed into duration through direct subtraction of datetime-type objects. In this way, we were able to express the time differences between the student’s engagement and certain actions.
Finally, the final dataset is a CSV file with 19 features. Details of the features are as follows (Table 2).
Table 2.
The model’s training features.
Data pre-processing, which involved cleaning, transforming, and structuring raw data to make it more appropriate for analysis and processing, was a vital and integral component of data science. This significance affected the reliability, accuracy, and quality of the results.
Numerous factors, such as noise, missing numbers, inaccurate data entry, issues with data quality, technical issues, and more, could have led to data loss. To prevent biased or inaccurate outcomes, this required proper processing.
3.2.1. Missing Values
Missing values or data meant that data did not exist in a dataset. Missing values were often present in the dataset and might have been due to errors in data collection or non-recording. False conclusions, biased findings, or loss of information could have been the result of missing values, which could have affected the results and the model’s quality.
For our study, we applied a reasoned treatment based on the nature of the data distribution. In some cases, the mean was used when missing values were limited. In other situations, where this seemed more appropriate, the next available value was used.
As the majority of values were treated during the preparation of our final dataset, we had no missing values. The average of the numerical characteristics was used to process them.
3.2.2. Normalization and Encoding
Normalization was an equal step, generally applied in data pre-processing, which aimed to ensure that all variables are on the same scale. It contributed to the learning process of machine learning models by preventing certain variables from dominating or biasing the model due to their range of values, i.e., variables with high values were of more importance than those with low ones. For many, if not all, machine learning algorithms, this step was essential.
There were three main techniques for normalizing data: Min–Max Scaling, which kept all values in a range between 0 and 1; Standardization, which reduced variable values to a mean of 0 and a standard deviation of 1; and Robust Scaling, which was less sensitive to aberrant values than the other two techniques and employed the median and quartile. Categorical data coding was a manner of converting categorical (non-numerical) data into numerical data because the bulk of machine learning algorithms only take numerical data.
Regarding categorical variables, the majority of machine learning algorithms could only process them in numerical form. It was, therefore, necessary to transform them into numerical values. This could have been done in various ways: for example, ordinal variables were directly encoded with integers representing an order, while nominal variables were transformed by techniques such as One-Hot Encoding, which creates a binary column for each category.
For our dataset, we applied a StandardScaler to standardize numerical variables, ensuring that all variables were on the same scale. Regarding the categorical variables, they were appropriately transformed into numerical values, depending on their type (ordinal or nominal), to ensure their compatibility with the machine learning models used.
3.3. Modeling
For the prediction of learner engagement, we trained several models while optimally adjusting their hyperparameters. This section discusses the different algorithms used to find the best predictive model: SVM, Naive Bayes, Decision Tree, Random Forest, k-NN, Logistic Regression, Gradient Boosting, Ada Boost, and Multi-Layer Perceptron (MLP).
- Support Vector Machine (SVM)
SVM is one of the most popular and robust machine learning algorithms for classification and regression. Vladimir Vapnik first proposed them in 1960 [41]. The main objective of the SVM algorithm is to find a hyperplane able to separate and maximize the margin between different classes in a multidimensional space. According to the training data, this hyperplane is a maximum margin classifier and is therefore considered optimal [42]. The main property of SVMs is their performance and ability to solve binary classification problems, i.e., efficiently separating data into two distinct categories.
- Naive Bayes
Naive Bayes is also a popular machine learning technique based on Bayes’ theorem with considerable conditional independence between variables [43], hence the name Naive [44]. It can predict the class of a sample using the conditional probabilities of the variables given. It is also known as Idiot Bayes, Simple Bayes, and Independence Bayes. Despite the simplicity of its hypothesis, which may reduce its performance in the presence of highly correlated variables, Naive Bayes remains an efficient algorithm, fast and simple to implement.
- Decision Tree
The Decision Tree algorithm is one of the most powerful and commonly used algorithms in machine learning and data mining [45] due to its simplicity of analysis and accuracy on multiple forms of data [46]. This algorithm is represented as an architecture tree composed of nodes, branches, and leaves. Each internal node shows a feature, and each branch represents a decision based on that feature, while each leaf represents the final decision [47,48]. To entrain the best feature at each decision node, the Decision Tree uses various techniques such as entropy, gini index, or information gain. The Decision Tree is developed iteratively, choosing partitions between classes at each stage. Once the tree has been built, it can be used to divide new data according to the decision rules defined in the tree [47].
- Random Forest
Random Forest is a machine learning technique based on a set of Decision Trees that are independent of each other. It combines the prediction results of each Decision Tree. The average of the predictions of each Decision Tree is the final prediction result of the Random Forest.
- KNN
KNN is the most basic classification technique in the field of machine learning. It is founded on the approximation principle, i.e., those similar samples are those that are in proximity to each other [49]. The KNN algorithm relies on calculating the distance between data points, usually using Euclidean distance, although other distance measures can be adopted. Despite its simplicity, KNN can be vulnerable to the value of K (the number of neighbors) and the characteristics of the dataset.
- Logistic regression
Logistic regression is also a classification technique commonly used in machine learning due to its simplicity, interoperability, and ability to provide class probability. Despite what its name may suggest, logistic regression is mainly for binary classification. Its objective is to model the probability that a given observation belongs to one of two possible classes based on its characteristics.
The idea of this algorithm resides in the use of the sigmoid or logistic function to transform the number given by the hyper-right into a probability. In other words, turn a linear combination of characteristics into a probability.
- Gradient Boosting
Gradient Boosting is a machine learning ensemble technique known for its power and accuracy, as it combines several simpler machine learning models to build a more robust model.
This algorithm is based on operating iteratively on simple or weakly weighted models (usually shallow Decision Trees) while adjusting each to correct errors, i.e., minimizing the loss function that estimates the model’s ability to make predictions with the data provided. This is achieved by using optimization techniques.
- Ada Boost
Ada Boost, also known as adaptive boosting, belongs to the family of machine-learning ensemble techniques. It is commonly used in classification problems. As it is an ensemble technique, the final model is based on the combination of several weak models (such as Decision Trees). Its characteristic is that this classifier focuses more on poorly classified examples, adjusting their weights to give more value to the difficult cases when training the additional classifiers created during the iterative process, thus increasing the overall accuracy of the final model.
- Multi-Layer Perceptron
Multi-Layer Perceptron, also known as a multi-layer neural network, is one of the deep neural networks widely used for complex classification, regression, and data modeling problems. It is composed of several interconnected layers of neurons: an input layer, one or more hidden layers, and an output layer. Each layer is based on the output of the previous layer.
A multi-layer neural network relies primarily on the backpropagation algorithm, which iteratively adjusts the weights in the network to minimize the loss function.
In our work, we used a hierarchical neural network architecture as a multi-layer perceptron comprising four distinct layers: an input layer with 16 units representing input features, two similar hidden layers composed of 50 units, and a ReLU activation function. In addition, dropout regularization is used to avoid overfitting by randomly deleting neurons during the training process. Finally, an output layer is composed of a single unit using a sigmoid activation function for binary classification.
To briefly and clearly illustrate the various steps involved in our work, Figure 2 presents a schematic overview of the process that was followed. It includes the main stages: data pre-processing (missing value processing, normalization), feature selection, classification model training, and performance evaluation. This representation provides an overall, structured understanding of the methodology followed.
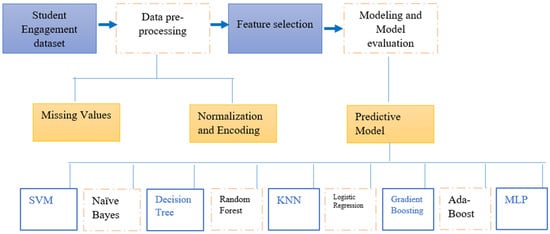
Figure 2.
A complete outline of the necessary steps.
We had three targets: engagement quizzes, engagement exams, and engagement lessons. For each target, we selected features that would be used. However, for the third ‘Engagement lessons’, we used the results of the metrics evaluating engagement with quizzes and exams as features for this model. This approach seemed logical and coherent for assessing students’ overall engagement in learning for the following reasons:
- Lesson assimilation is assessed using quizzes and exams focusing on lesson content;
- Engagement in quizzes and exams is an indicator of the learner’s overall engagement behavior if the learner actively and fully engages in quizzes and exams and demonstrates engagement behavior in the learning process;
- The fact that learners participate effectively and do well in quizzes and exams testifies to their behavior and involvement in the content taught in the corresponding lessons.
4. Results
This study seeks to build a classification model most adapted to predict learner engagement.
The Student Engagement Dataset from Kaggle and the features were selected to feed our model. The dataset, consisting of 19 features, was created by extracting and combining various columns, and a data pre-processing step was carried out.
Before presenting the results of our analysis, it is essential to understand the process and flow of our work. As mentioned in the previous section, we set three targets: engagement quizzes, engagement exams, and engagement lessons. To predict engagement lessons, we used the results of the engagement quizzes and engagement exams evaluation metrics.
For the study of each model, we involved several key steps: feature selection, testing on several algorithms (namely: SVM, Naive Bayes, Decision Tree, Random Forest, k-NN, Logistic Regression, Gradient Boosting, Ada Boost, and MLP), tuning the parameters of each algorithm to optimize performance. We then divided our dataset into training and test sets to train and evaluate the model. Techniques such as cross-validation were used to ensure model robustness. In addition, evaluation metrics like accuracy, recall, F1-score, and precision. Accuracy presents the number of correct predictions divided by the total number of predictions made. Recall measures the proportion of positive examples correctly classified among all positive ones. The F1-score combines both precision (minimizing false positives) and recall (correctly identifying positive examples) in a single measure. Precision measures the proportion of true positives among all the positive predictions in the model. We then carried out an in-depth comparison of each algorithm’s performance. These tests enabled us to determine which algorithm would perform best.
Before presenting the results, it is important to justify the choice of models used. These models were chosen carefully, depending on their performance, interpretability, and adaptability to the e-learning system:
- Decision Tree is highly recognized for its readability and transparency, and the extracted rules are easy for technical experts to interpret. In an educational context, it is important, even crucial, to understand why a model predicts a certain behavior for a learner.
- KNN was selected for its simplicity and effectiveness in capturing similarities, making it particularly relevant to apply in personalized or anticipatory recommendations
- Gradient Boosting was chosen for its high performance in structured data and its ability to capture complex interactions while limiting over-learning thanks to regularization mechanisms.
- Concerning the other models not retained,
- SVM, despite its power, presents significant computational complexity for nonlinear kernels, as well as its visibility in large-scale online systems;
- Logistic Regression does not exploit nonlinear interactions between variables at the level of learner behavior;
- Random Forest is conceptually similar to Gradient Boosting, but offers better performance and overfitting control.
As a next step, we examined Table 3, which compares the evaluation metrics of the algorithms used to predict each target. The analysis of these metrics helped us identify the model that best met our prediction objective.
Table 3.
Evaluation metrics of the used models.
According to the table, our main concern, which is also the core of our work, lies in identifying the best performing for predicting learner engagement. As distinguished, our model takes into account a variety of data sources, encompassing the learner’s multiple interactions with their learning environment. Our ultimate goal was to predict the level of engagement of these learners within their learning paths.
In this context, the following figure (Figure 3) represents a detailed comparison of the performance of three algorithms (Decision Tree, KNN, and Gradient Boosting) in predicting the three target engagement quizzes, engagement exams, and engagement lessons. Each algorithm is assessed using four evaluation metrics: accuracy, recall, F1-score, and precision. The metrics are represented on the y-axis, while the colored bars represent the performance of each. By examining the graph attentively, we can quickly identify which algorithm performs best for each engagement target.
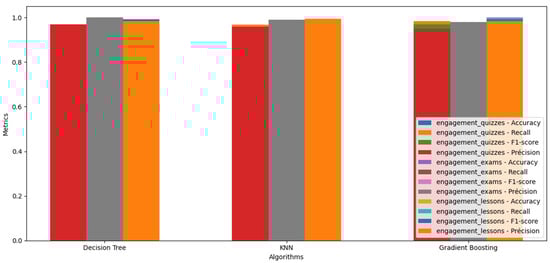
Figure 3.
Performance metrics for different targets and algorithms.
The three models, Decision Tree, KNN, and Gradient Boosting, were carefully parameterized and evaluated to determine their ability to predict learner engagement on specific targets. The hyperparameters were adjusted using the test-and-error method. Although this empirical approach provides a fast view of performance, the integration of rigorous cross-validation combined with systematic hyperparameter optimization would enhance the robustness and generalizability of the results, particularly in a large-scale deployment. The details of each model are as follows:
- Decision Tree
- The model was trained using entropy as the criterion for building the Decision Tree;
- Training and test data were standardized using StandardScaler;
- Model performance was evaluated in predicting engagement on the three targets.
- KNN
- The model was trained with n_neighbors = 3 to make decisions;
- Training and test data were standardized using StandardScaler;
- Model performance was evaluated in predicting engagement on the three targets.
- Gradient boosting
- Optimal parameters were chosen, including n_estimators = 100, learning_rate = 0.1 and random_state = 42 to ensure reproducibility of results;
- Training and test data were standardized using StandardScaler;
- Model performance was evaluated in predicting engagement on the three targets.
Each of these models has its strengths and weaknesses, and evaluating their performance gives us a better understanding of their suitability for engagement prediction tasks.
Several algorithms were tested to predict engagement from extracted features. Of these, Decision Tree, KNN, and Gradient Boosting performed best. In addition to the performance obtained, it is worth noting some of the limitations of these algorithms, as identified in the literature. Naive Bayes, for example, assumes independence between data, which can lead to an underestimation of performance when variables are highly correlated. SVM, while effective for well-separable data, can be sensitive to the choice of kernel and parameters. Finally, Random Forest, Logistic Regression, and Ada Boost can be affected by parameter overfitting, particularly in the presence of noise. This passage allows us to contextualize the performances obtained and shows that, despite theoretical limitations, the algorithms chosen responded well to the objectives of modeling learners’ behavioral engagement.
Figure 4 shows the precision–recall curve for evaluating the performance of the three algorithms. The precision–recall curve gives a perspective for evaluating the performance of classification models. All three models show well-determined precision and recall for the three targets, represented by the classification of many examples as positive. However, the Decision Tree curve represents the highest precision and recall compared to the others. This model was trained using entropy as a criterion for building the Decision Tree. Training and test data were standardized using StandardScaler.
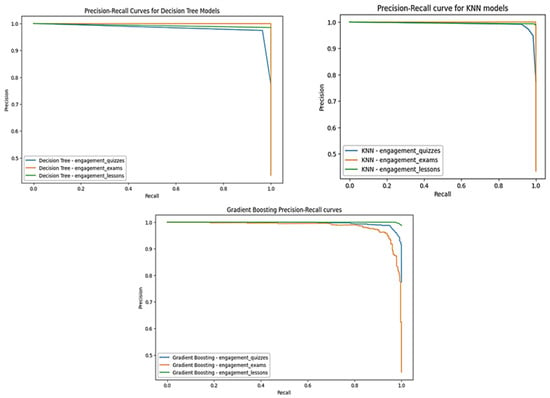
Figure 4.
Precision–recall curves.
5. Discussion
Machine learning is arguably an essential method and concept for predicting results from training data. It is known for its performance and the results it delivers. Indeed, machine-learning techniques, such as classification, have become ubiquitous in complex data analysis. These approaches make it possible to build predictive models from a dataset while developing significant knowledge in various domains.
This research aims to contribute to the existing literature on e-learning engagement by proposing a predictive model to classify learners according to their engagement in an e-learning environment. This model could detect learners who may be having trouble or exhibiting signs of disengagement, allowing them to provide targeted support and assistance. We used supervised machine learning algorithms to predict learner engagement. We trained these models on a significant dataset and assessed their performance using several evaluation metrics, including precision, recall, accuracy, and F1-score. The creation of precision-recall curves offers a comprehensive overview of each model. These tools generate essential information for anticipating learner behavior, paving the way for more precise and effective educational interventions.
Highly engaged learners tend to participate more effectively in different activities and may show indications of engagement that are not as evident in less engaged learners. Even so, this suggests that the approaches employed may be valid for detecting early signs of difficulties or academic failure in learners. Relying not only on learning outcomes, this requires the intervention of tutors or a personalized referral system to identify strengths and develop gaps, along with goal-setting to improve each learner’s learning throughout the learning journey [50].
The analysis indicated that the Decision Tree, KNN, and Gradient Boosting models demonstrated relatively higher performance in data categorization than the other algorithms. Each algorithm has features that make it suitable for the task of predicting engagement in an online learning environment. For example, the Decision Tree is valued for its simplicity of interpretation and its ability to handle complex data with little pre-processing, which is crucial in diverse e-learning environments. KNN, on the other hand, is well suited to capturing similarities between learners, while Gradient Boosting offers solid predictive performance, albeit at a higher computational cost. These specific advantages explain why we have selected these models to predict learner engagement.
These results suggest a linear relationship between inputs and learner engagement. Indeed, these classification algorithms produced better results, indicating an increased ability to predict learner behaviors based on their activities, an indicator of engagement.
The prediction model for the Decision Tree algorithm for target engagement_quizzes had an accuracy of 95.27%, a recall of 96.44%, an F1-score of 97%, and a precision of 97%. For engagement_exams, accuracy, and recall, the F1-score is 100%. Moreover, for engagement_lessons, accuracy is 98.49%, recall is 98.49%, F1-score is 99.24%, and precision is 98.49%. For target engagement_quizzes, accuracy, recall, f1-score, and KNN prediction model precision were 94.47%, 96.76%, 96%, and 96%, respectively. For the engagement_exams target, accuracy, recall, f1-score, and KNN prediction model precision were 99.18%, 98.79%, 99%, and 99%, respectively. For engagement_lessons, accuracy, recall, f1-score, and KNN prediction model precision were 98.43%, 98.86%, 99.2%, and 99.5%, respectively. The Gradient Boosting model, for target engagement_quizzes, accuracy, recall, f1-score, and precision were 94.97%, 98.46%, 97%, and 95%, respectively. For the target engagement_exams, the accuracy, recall, F1-score, and precision of the KNN prediction model were 93.54%, 86.87%, 92%, and 98%, respectively. Finally, for engagement_lessons, accuracy, recall, f1-score, and precision were 98.49%, 100%, 99.24%, and 98.49%, respectively.
The results obtained from the models reveal a strong correlation between predictions of engagement in quizzes, exams, and lessons. These results confirm that these items, namely quiz and exam engagement scores, referred to as assessment engagement, can be considered relevant indicators of lesson engagement. As mentioned above, engagement in these assessments directly correlates with understanding the concepts taught. Thus, learners who actively engage in lessons are more likely to excel and engage in quizzes and exams. This reinforces the validity of our approach, which considers quiz and exam engagement as robust indicators of lesson engagement.
Indeed, engagement in quizzes and exams reflects the effort made by learners to understand the concepts covered in the lessons. Although these two targets are distinct, they are all interconnected, providing a comprehensive overview of learner engagement.
The precision–recall curve is a commonly used evaluation tool in machine learning to measure the performance of classification models. For all three algorithms—namely, Decision Tree, KNN, and Gradient Boosting—three models were trained to predict learner engagement. In these models, the curves (Figure 4) showed a good balance between precision and recall, illustrated by their typical decreasing shape. This means that an increase in recall generally leads to a decrease in precision.
In terms of lesson engagement, the curve showed a small decline in accuracy compared to quizzes and exams, but recall remained high. Analysis of the results also revealed similar performance for quiz and exam engagement, indicating consistency in learners’ assessment behaviors. We can deduce that learners engaged in quizzes are also engaged in exams, confirming the validity and relevance of these indicators.
As shown in Figure 3, the Decision Tree model presented the best evaluation metrics, while the neural network model obtained the lowest results compared to the other algorithms. The model evaluation presents an in-depth assessment of the model’s performance on a dataset to measure its ability to predict future data. It also enabled us to measure its ability to predict learner engagement in e learning about their behaviors.
To corroborate our results, we also compared actual labels with those predicted by the best-performing algorithms to obtain a more nuanced view of their effectiveness and to assess the accuracy of the models on real data:
- Decision Tree—Engagement quizzes;
- Decision Tree—Engagement exams;
- Decision Tree—Engagement lessons (results of quizzes and exams will not be presented, we will only present other features);
- KNN—Engagement quizzes;
- KNN—Engagement exams;
- KNN—Engagement lessons (results of quizzes and exams will not be presented, we will only present other features);
- Gradient Boosting—Engagement quizzes;
- Gradient Boosting—Engagement exams;
- Gradient Boosting—Engagement lessons (results of quizzes and exams will not be presented, we will only present other features).
The results in the tables highlight a correspondence between the real labels and the predictions of all three algorithms, showing the robustness of our models for classifying learner engagement. The Decision Tree model performed best, with an almost perfect correspondence between real and predicted labels. However, some differences were observed in KNN predictions, possibly revealing a sensitivity to certain types of data. Regarding the Gradient Boosting model, although it performed well, it showed more errors, probably due to the complexity of the data.
For the Decision Tree algorithm, Table 4, Table 5 and Table 6 show that the Decision Tree algorithm exhibits excellent correspondence between actual labels and predictions for all three targets (quiz, exam, and lesson engagement) on randomly drawn indexes, indicating good model performance. Then, for the KNN algorithm, the results in Table 7, Table 8 and Table 9 confirm that the predictions are globally consistent, but a notable error was observed for quiz engagement, particularly for index 2174 in Table 7, suggesting a sensitivity of the model to certain types of data. For the Gradient Boosting algorithm, Table 10, Table 11 and Table 12 also show a good correspondence between actual labels and predictions for the three targets, similar to that of the Decision Tree, demonstrating that the Gradient Boosting model is also robust in predicting learner engagement.
Table 4.
Comparison of real and predicted labels for quiz engagement—Decision Tree model.
Table 5.
Comparison of real and predicted labels for exam engagement—Decision Tree model.
Table 6.
Comparison of real and predicted labels for lesson engagement—Decision Tree model.
Table 7.
Comparison of real and predicted labels for quiz engagement—KNN model.
Table 8.
Comparison of real and predicted labels for exam engagement—KNN model.
Table 9.
Comparison of real and predicted labels for lesson engagement—KNN model.
Table 10.
Comparison of real and predicted labels for quiz engagement—Gradient Boosting model.
Table 11.
Comparison of real and predicted labels for exam engagement—Gradient Boosting model.
Table 12.
Comparison of real and predicted labels for lesson engagement—Gradient Boosting model.
These remarks lead us to recommend the use of the Decision Tree model in environments where high accuracy is crucial for predicting engagement. However, the KNN model proves more suitable in contexts where similarity between learners plays a crucial and determining role.
Overall, these results offer promising prospects for the implementation of pedagogical interventions based on engagement prediction.
We also noted that some characteristics unquestionably influence learner engagement; however, others have a weaker impact. This indicates that although some learners are globally engaged in their learning, they may display different levels of involvement depending on the attributes taken into account. These variations underline the value of tailoring the learning process to the specific needs of each learner.
In terms of practical applications, these results can be used to develop personalized learning systems that quickly identify learners at risk of dropping out. Based on these predictions, recommendations for appropriate pedagogical interventions can be proposed, enabling systems to anticipate learners’ difficulties and adjust their learning processes accordingly. This opens up interesting prospects for improving the quality of e-learning.
Computational efficiency is a key factor in the deployment of e-learning platforms. Decision Tree is more adapted to environments requiring regular maintenance and continuous recalibration, given its fast training and inference speed, even on moderately-sized datasets. However, KNN, while offering significantly better performance with easier learning, requires a higher inference time, especially at large scales, as it has to traverse the entire set of examples for each prediction. Gradient reinforcement requires more training time owing to the sequential nature of the boosted trees, but presents good robustness and reasonable inference time once training is complete.
However, in an e-learning context, the choice of model depends not only on its performance, but also on its ability to adapt to operational constraints such as real-time response time, scalability of updates, and transparency.
Although this study focuses on behavioral engagement, it is essential to highlight the impact of cultural and institutional biases on learner engagement. For example, student-country differences can significantly influence student engagement. Although these biases were not taken into account in the models of this study, it would be relevant to incorporate them in future work. This could include analyzing learner subgroups and adapting models to cultural and institutional specificities, to better personalize learning. By taking these dimensions into account, learning systems could offer a more inclusive and equitable experience, fostering stronger engagement and better academic success for a diverse population of learners.
Furthermore, demographic factors such as socioeconomic status or educational history can affect the prediction or even distort it, risking misclassifications that can eliminate some learners from personalized support. This risk can be attenuated by incorporating algorithmic regularization techniques, model auditing with equity indicators (subgroup evaluation), diversification of training models, or human intervention before an automated action is triggered.
These approaches simultaneously reduce implicit discrimination and guarantee automation to strengthen decision-making and the ethics of AI systems.
6. Conclusions
The lack of interaction in learning environments is a serious challenge. Predicting learner engagement is of key importance, enabling us to understand the interaction and behavior of each learner. It opens the way to early detection of difficulties, personalization of learning paths, immediate feedback, interactive communications, and the creation of a sense of belonging. Our work is in line with previous work that focused mainly on behavioral or emotional dimensions and stands out for its integration of concrete data, measurable indicators derived from learner interactions (quizzes, exams), and the application of machine learning techniques. In this context, we tested nine machine learning algorithms on a Kaggle database. The database was subjected to various pre-processing techniques. The performance of these algorithms was evaluated using measures such as accuracy, recall, F1 score, and precision. The Decision Tree model proved to be the best-performing of those evaluated.
In the future, we plan to explore other dimensions of online learner engagement, including emotional and cognitive aspects. Specifically, this will include factors such as learning style, abundance, and learning materials, as well as other relevant parameters such as frequency of access to courses, participation in discussion forums, and collaboration with other learners. There are, however, several limitations. Our study relies in part on self-reported data, which may introduce a degree of subjectivity on the part of learners. Furthermore, the absence of real-time interventions limits the possibilities for immediate personalization and reactive adaptation as part of the learning process. These aspects represent future research prospects aimed at further enriching our approach. By considering these multiple dimensions, we intend to gain a holistic view of student engagement, enabling a more precise adaptation of pedagogical strategies and ongoing optimization of the online learning experience.
Author Contributions
Conceptualization, Y.B., H.M., A.J., H.T. and N.B.; methodology, Y.B. and A.J.; software, Y.B. and H.M.; validation, A.J., N.B. and H.T.; formal analysis, A.J. and N.B.; investigation, Y.B. and H.M.; resources, A.J. and Y.B.; data curation, Y.B.; writing—original draft preparation, Y.B. and A.J.; writing—review and editing, A.J., Y.B. and N.B.; visualization, A.J., Y.B. and N.B.; supervision, A.J., H.T. and N.B.; project administration, A.J., H.T. and N.B.; funding acquisition, A.J. and N.B. All authors have read and agreed to the published version of the manuscript.
Funding
This research received no external funding.
Institutional Review Board Statement
Not applicable.
Informed Consent Statement
Not applicable.
Data Availability Statement
The original data presented in the study are openly available at https://www.kaggle.com/datasets/thedevastator/student-engagement-with-tableau-a-data-science-p (accessed on 18 April 2025).
Conflicts of Interest
The authors declare no conflicts of interest.
References
- Kundu, A.; Bej, T. COVID-19 response: Students’ readiness for shifting classes online. Corporate Gov. Int. J. Bus. Soc. 2021, 21, 1250–1270. [Google Scholar] [CrossRef]
- Patricia Aguilera-Hermida, A. College students’ use and acceptance of emergency online learning due to COVID-19. Int. J. Educ. Res. Open 2020, 1, 100011. [Google Scholar] [CrossRef]
- Sugden, N.; Brunton, R.; MacDonald, J.; Yeo, M.; Hicks, B. Evaluating student engagement and deep learning in interactive online psychology learning activities. Australas. J. Educ. Technol. 2021, 37, 45–65. [Google Scholar] [CrossRef]
- Astin, A.W. Student involvement: A developmental theory for higher education. J. Coll. Stud. Dev. 1999, 40, 518–529. [Google Scholar]
- Schunk, D.H.; Mullen, C.A. Self-Efficacy as an Engaged Learner. In Handbook of Research on Student Engagement; Christenson, S.L., Reschly, A.L., Wylie, C., Eds.; Springer: Boston, MA, USA, 2012; pp. 219–235. ISBN 978-1-4614-2018-7. [Google Scholar]
- Alruwais, N.; Zakariah, M. Student-Engagement Detection in Classroom Using Machine Learning Algorithm. Electronics 2023, 12, 731. [Google Scholar] [CrossRef]
- Bhardwaj, P.; Gupta, P.K.; Panwar, H.; Siddiqui, M.K.; Morales-Menendez, R.; Bhaik, A. Application of Deep Learning on Student Engagement in e-learning environments. Comput. Electr. Eng. 2021, 93, 107277. [Google Scholar] [CrossRef]
- Holmes, N. Engaging with assessment: Increasing student engagement through continuous assessment. Act. Learn. High. Educ. 2018, 19, 23–34. [Google Scholar] [CrossRef]
- Jung, Y.; Lee, J. Learning Engagement and Persistence in Massive Open Online Courses (MOOCS). Comput. Educ. 2018, 122, 9–22. [Google Scholar] [CrossRef]
- Fredricks, J.A.; Blumenfeld, P.C.; Paris, A.H. School Engagement: Potential of the Concept, State of the Evidence. Rev. Educ. Res. 2004, 74, 59–109. [Google Scholar] [CrossRef]
- Deci, E.L.; Ryan, R.M. The general causality orientations scale: Self-determination in personality. J. Res. Personal. 1985, 19, 109–134. [Google Scholar] [CrossRef]
- Cagliero, L.; Canale, L.; Farinetti, L.; Baralis, E.; Venuto, E. Predicting Student Academic Performance by Means of Associative Classification. Appl. Sci. 2021, 11, 1420. [Google Scholar] [CrossRef]
- Hassan, S.-U.; Waheed, H.; Aljohani, N.R.; Ali, M.; Ventura, S.; Herrera, F. Virtual learning environment to predict withdrawal by leveraging deep learning. Int. J. Intell. Syst. 2019, 34, 1935–1952. [Google Scholar] [CrossRef]
- Henrie, C.R.; Bodily, R.; Larsen, R.; Graham, C.R. Exploring the Potential of LMS Log Data as a Proxy Measure of Student Engagement. J. Comput. High. Educ. 2018, 30, 344–362. [Google Scholar] [CrossRef]
- Tomasevic, N.; Gvozdenovic, N.; Vranes, S. An overview and comparison of supervised data mining techniques for student exam performance prediction. Comput. Educ. 2020, 143, 103676. [Google Scholar] [CrossRef]
- Duderstadt, J.J.; Atkins, D.E.; Van Houweling, D.E. Higher Education in the Digital Age: Technology Issues and Strategies for American Colleges and Universities; Greenwood Publishing Group: Boston, MA, USA, 2002. [Google Scholar]
- Mandernach, B.J. Assessment of student engagement in higher education: A synthesis of literature and assessment tools. Int. J. Learn. Teach. Educ. Res. 2015, 12, 1–14. [Google Scholar]
- Robinson, C.C.; Hullinger, H. New benchmarks in higher education: Student engagement in online learning. J. Educ. Bus. 2008, 84, 101–109. [Google Scholar] [CrossRef]
- Dabbagh, N.; Kitsantas, A. Supporting self-regulation in student-centered web-based learning environments. In International Journal on E-Learning; Association for the Advancement of Computing in Education (AACE): Waynesville, NC USA, 2004; Volume 3, pp. 40–47. [Google Scholar]
- Ayouni, S.; Hajjej, F.; Maddeh, M.; Al-Otaibi, S. A new ML-based approach to enhance student engagement in online environment. PLoS ONE 2021, 16, e0258788. [Google Scholar] [CrossRef]
- Dixson, M.D. Measuring student engagement in the online course: The Online Student Engagement scale (OSE). Online Learn. 2015, 19, n4. [Google Scholar] [CrossRef]
- Coates, H. A model of online and general campus-based student engagement. Assess. Eval. High. Educ. 2007, 32, 121–141. [Google Scholar] [CrossRef]
- Seaman, J.E.; Allen, I.E.; Seaman, J. Grade increase: Tracking distance education in the United States; Babson Survey Research Group: Babson Park, MA, USA, 2018. [Google Scholar]
- Lu, K.; Pang, F.; Shadiev, R. Understanding college students’ continuous usage intention of asynchronous online courses through extended technology acceptance model. Educ. Inf. Technol. 2023, 28, 9747–9765. [Google Scholar] [CrossRef]
- Alkabbany, I.; Ali, A.; Farag, A.; Bennett, I.; Ghanoum, M.; Farag, A. Measuring Student Engagement Level Using Facial Information. In Proceedings of the 2019 IEEE International Conference on Image Processing (ICIP), Taipei, Taiwan, 22–25 September 2019; IEEE: Taipei, Taiwan, 2019; pp. 3337–3341. [Google Scholar]
- Mohamad Nezami, O.; Dras, M.; Hamey, L.; Richards, D.; Wan, S.; Paris, C. Automatic Recognition of Student Engagement Using Deep Learning and Facial Expression. In Machine Learning and Knowledge Discovery in Databases; Brefeld, U., Fromont, E., Hotho, A., Knobbe, A., Maathuis, M., Robardet, C., Eds.; Springer International Publishing: Cham, Switzerland, 2020; pp. 273–289. [Google Scholar]
- Savchenko, A.V.; Savchenko, L.V.; Makarov, I. Classifying Emotions and Engagement in Online Learning Based on a Single Facial Expression Recognition Neural Network. IEEE Trans. Affect. Comput. 2022, 13, 2132–2143. Available online: https://ieeexplore.ieee.org/abstract/document/9815154/ (accessed on 23 September 2023). [CrossRef]
- Murshed, M.; Dewan, M.A.A.; Lin, F.; Wen, D. Engagement Detection in e-Learning Environments using Convolutional Neural Networks. In Proceedings of the 2019 IEEE Intl Conf on Dependable, Autonomic and Secure Computing, Intl Conf on Pervasive Intelligence and Computing, Intl Conf on Cloud and Big Data Computing, Intl Conf on Cyber Science and Technology Congress (DASC/PiCom/CBDCom/CyberSciTech), Fukuoka, Japan, 5–8 August 2019; IEEE: Fukuoka, Japan, 2019; pp. 80–86. [Google Scholar]
- Kumar Verma, B.; Srivastava, N.; Kumar Singh, H. Prediction of Students’ Performance in e-Learning Environment using Data Mining/Machine Learning Techniques. JUSST 2021, 23, 593–596. [Google Scholar] [CrossRef]
- Kuzilek, J.; Hlosta, M.; Zdrahal, Z. Open University Learning Analytics dataset. Sci. Data 2017, 4, 170171. [Google Scholar] [CrossRef]
- Manwaring, K.C.; Larsen, R.; Graham, C.R.; Henrie, C.R.; Halverson, L.R. Investigating student engagement in blended learning settings using experience sampling and structural equation modeling. Internet High. Educ. 2017, 35, 21–33. [Google Scholar] [CrossRef]
- Atherton, M.; Shah, M.; Vazquez, J.; Griffiths, Z.; Jackson, B.; Burgess, C. Using learning analytics to assess student engagement and academic outcomes in open access enabling programmes. Open Learn. J. Open Distance E-Learn. 2017, 32, 119–136. [Google Scholar] [CrossRef]
- Casalino, G.; Castellano, G.; Zaza, G. Neuro-Fuzzy Systems for Learning Analytics. In Intelligent Systems Design and Applications; Abraham, A., Gandhi, N., Hanne, T., Hong, T.-P., Nogueira Rios, T., Ding, W., Eds.; Lecture Notes in Networks and Systems; Springer International Publishing: Cham, Switzerland, 2022; pp. 1341–1350. [Google Scholar]
- Sharma, P.; Joshi, S.; Gautam, S.; Maharjan, S.; Khanal, S.R.; Reis, M.C.; Barroso, J.; de Jesus Filipe, V.M. Student Engagement Detection Using Emotion Analysis, Eye Tracking and Head Movement with Machine Learning. In Technology and Innovation in Learning, Teaching and Education; Reis, A., Barroso, J., Martins, P., Jimoyiannis, A., Huang, R.Y.-M., Henriques, R., Eds.; Communications in Computer and Information Science; Springer Nature: Cham, Switzerland, 2022; pp. 52–68. [Google Scholar]
- Lima, G.D.; Costa, J.A.; Araújo, R.D.; Dorça, F.A. Exploring the Relationship between Students Engagement and Self-Regulated Learning: A Case Study using OULAD Dataset and Machine Learning Techniques. In Proceedings of the Anais do XXXI Simpósio Brasileiro de Informática na Educação (SBIE 2023), Passo Fundo, Brazil, 6–10 November 2023; pp. 1154–1165. [Google Scholar]
- Abdellaoui, B.; Remaida, A.; Sabri, Z.; El Bouzekri El Idrissi, Y.; Moumen, A. Emotion Detection and Student Engagement in Distance Learning During Containment Due to the COVID-19. Baghdad Sci. J. 2024, 21, 1432. [Google Scholar] [CrossRef]
- Abdellaoui, B.; Remaida, A.; Sabri, Z.; Abdellaoui, M.; El Bouzekri El Idrissi, Y.; Moumen, A. Analyzing Recorded Video to Evaluate How Engaged and Emotional Students Are in Remote Learning Environments. In Proceedings of the 2024 International Conference on Intelligent Systems and Computer Vision (ISCV), Fez, Morocco, 8–10 May 2024; pp. 1–7. [Google Scholar]
- Wu, M.; Ouyang, F. Using an integrated probabilistic clustering approach to detect student engagement across asynchronous and synchronous online discussions. J. Comput. High. Educ. 2025, 37, 299–326. [Google Scholar] [CrossRef]
- Liu, Z.; Tang, Q.; Ouyang, F.; Long, T.; Liu, S. Profiling students’ learning engagement in MOOC discussions to identify learning achievement: An automated configurational approach. Comput. Educ. 2024, 219, 105109. [Google Scholar] [CrossRef]
- Student Engagement. Consulté le: 18 Avril 2025. [En Ligne]. Available online: https://www.kaggle.com/datasets/thedevastator/student-engagement-with-tableau-a-data-science-p (accessed on 18 April 2025).
- Cortes, C.; Vapnik, V. Support-vector networks. Mach. Learn. 1995, 20, 273–297. [Google Scholar] [CrossRef]
- Stitson, M.O.; Weston, J.A.E.; Gammerman, A.; Vovk, V.; Vapnik, V. Theory of support vector machines. Univ. Lond. 1996, 117, 188–191. [Google Scholar]
- Friedman, N.; Geiger, D.; Goldszmidt, M. Bayesian network classifiers. Mach. Learn. 1997, 29, 131–163. [Google Scholar] [CrossRef]
- Duda, R.O.; Hart, P.E. Pattern Classification and Scene Analysis; Wiley: New York, NY, USA, 1973; Volume 3, Available online: https://www.svms.org/classification/DuHS95.pdf (accessed on 24 October 2023).
- Gavankar, S.S.; Sawarkar, S.D. Eager decision tree. In Proceedings of the 2017 2nd International Conference for Convergence in Technology (I2CT), Mumbai, India, 7–9 April 2017; pp. 837–840. [Google Scholar]
- Mrva, J.; Neupauer, Š.; Hudec, L.; Ševcech, J.; Kapec, P. Decision Support in Medical Data Using 3D Decision Tree Visualisation. In Proceedings of the 2019 E-Health and Bioengineering Conference (EHB), Iasi, Romania, 21–23 November 2019; pp. 1–4. [Google Scholar] [CrossRef]
- Mahesh, B. Machine Learning Algorithms—A Review. Int. J. Sci. Res. (IJSR) 2019, 9. [Google Scholar] [CrossRef]
- Janikow, C.Z. Fuzzy decision trees: Issues and methods. IEEE Trans. Syst. Man Cybern. Part B (Cybern.) 1998, 28, 1–14. [Google Scholar] [CrossRef]
- Cover, T.; Hart, P. Nearest neighbor pattern classification. IEEE Trans. Inf. Theory 1967, 13, 21–27. [Google Scholar] [CrossRef]
- Bellarhmouch, Y.; Jeghal, A.; Tairi, H.; Benjelloun, N. A proposed architectural learner model for a personalized learning environment. Educ. Inf. Technol. 2023, 28, 4243–4263. [Google Scholar] [CrossRef]
Disclaimer/Publisher’s Note: The statements, opinions and data contained in all publications are solely those of the individual author(s) and contributor(s) and not of MDPI and/or the editor(s). MDPI and/or the editor(s) disclaim responsibility for any injury to people or property resulting from any ideas, methods, instructions or products referred to in the content. |
© 2025 by the authors. Licensee MDPI, Basel, Switzerland. This article is an open access article distributed under the terms and conditions of the Creative Commons Attribution (CC BY) license (https://creativecommons.org/licenses/by/4.0/).