Anemia Classification System Using Machine Learning

 , ,
, ,
Abstract
1. Introduction
2. Related Works
2.1. Bibliometric Analysis
- Anemia: types of anemia, such as microcytic, normocytic, macrocytic, and hemolytic anemia.
- Blood count: complete blood count (CBC), Mean corpuscular volume (MCV), hemoglobin, etc.
- Deep learning: applications involving neural networks, machine learning, predictive, and deep learning techniques.
2.2. Related Research
3. Materials and Methods
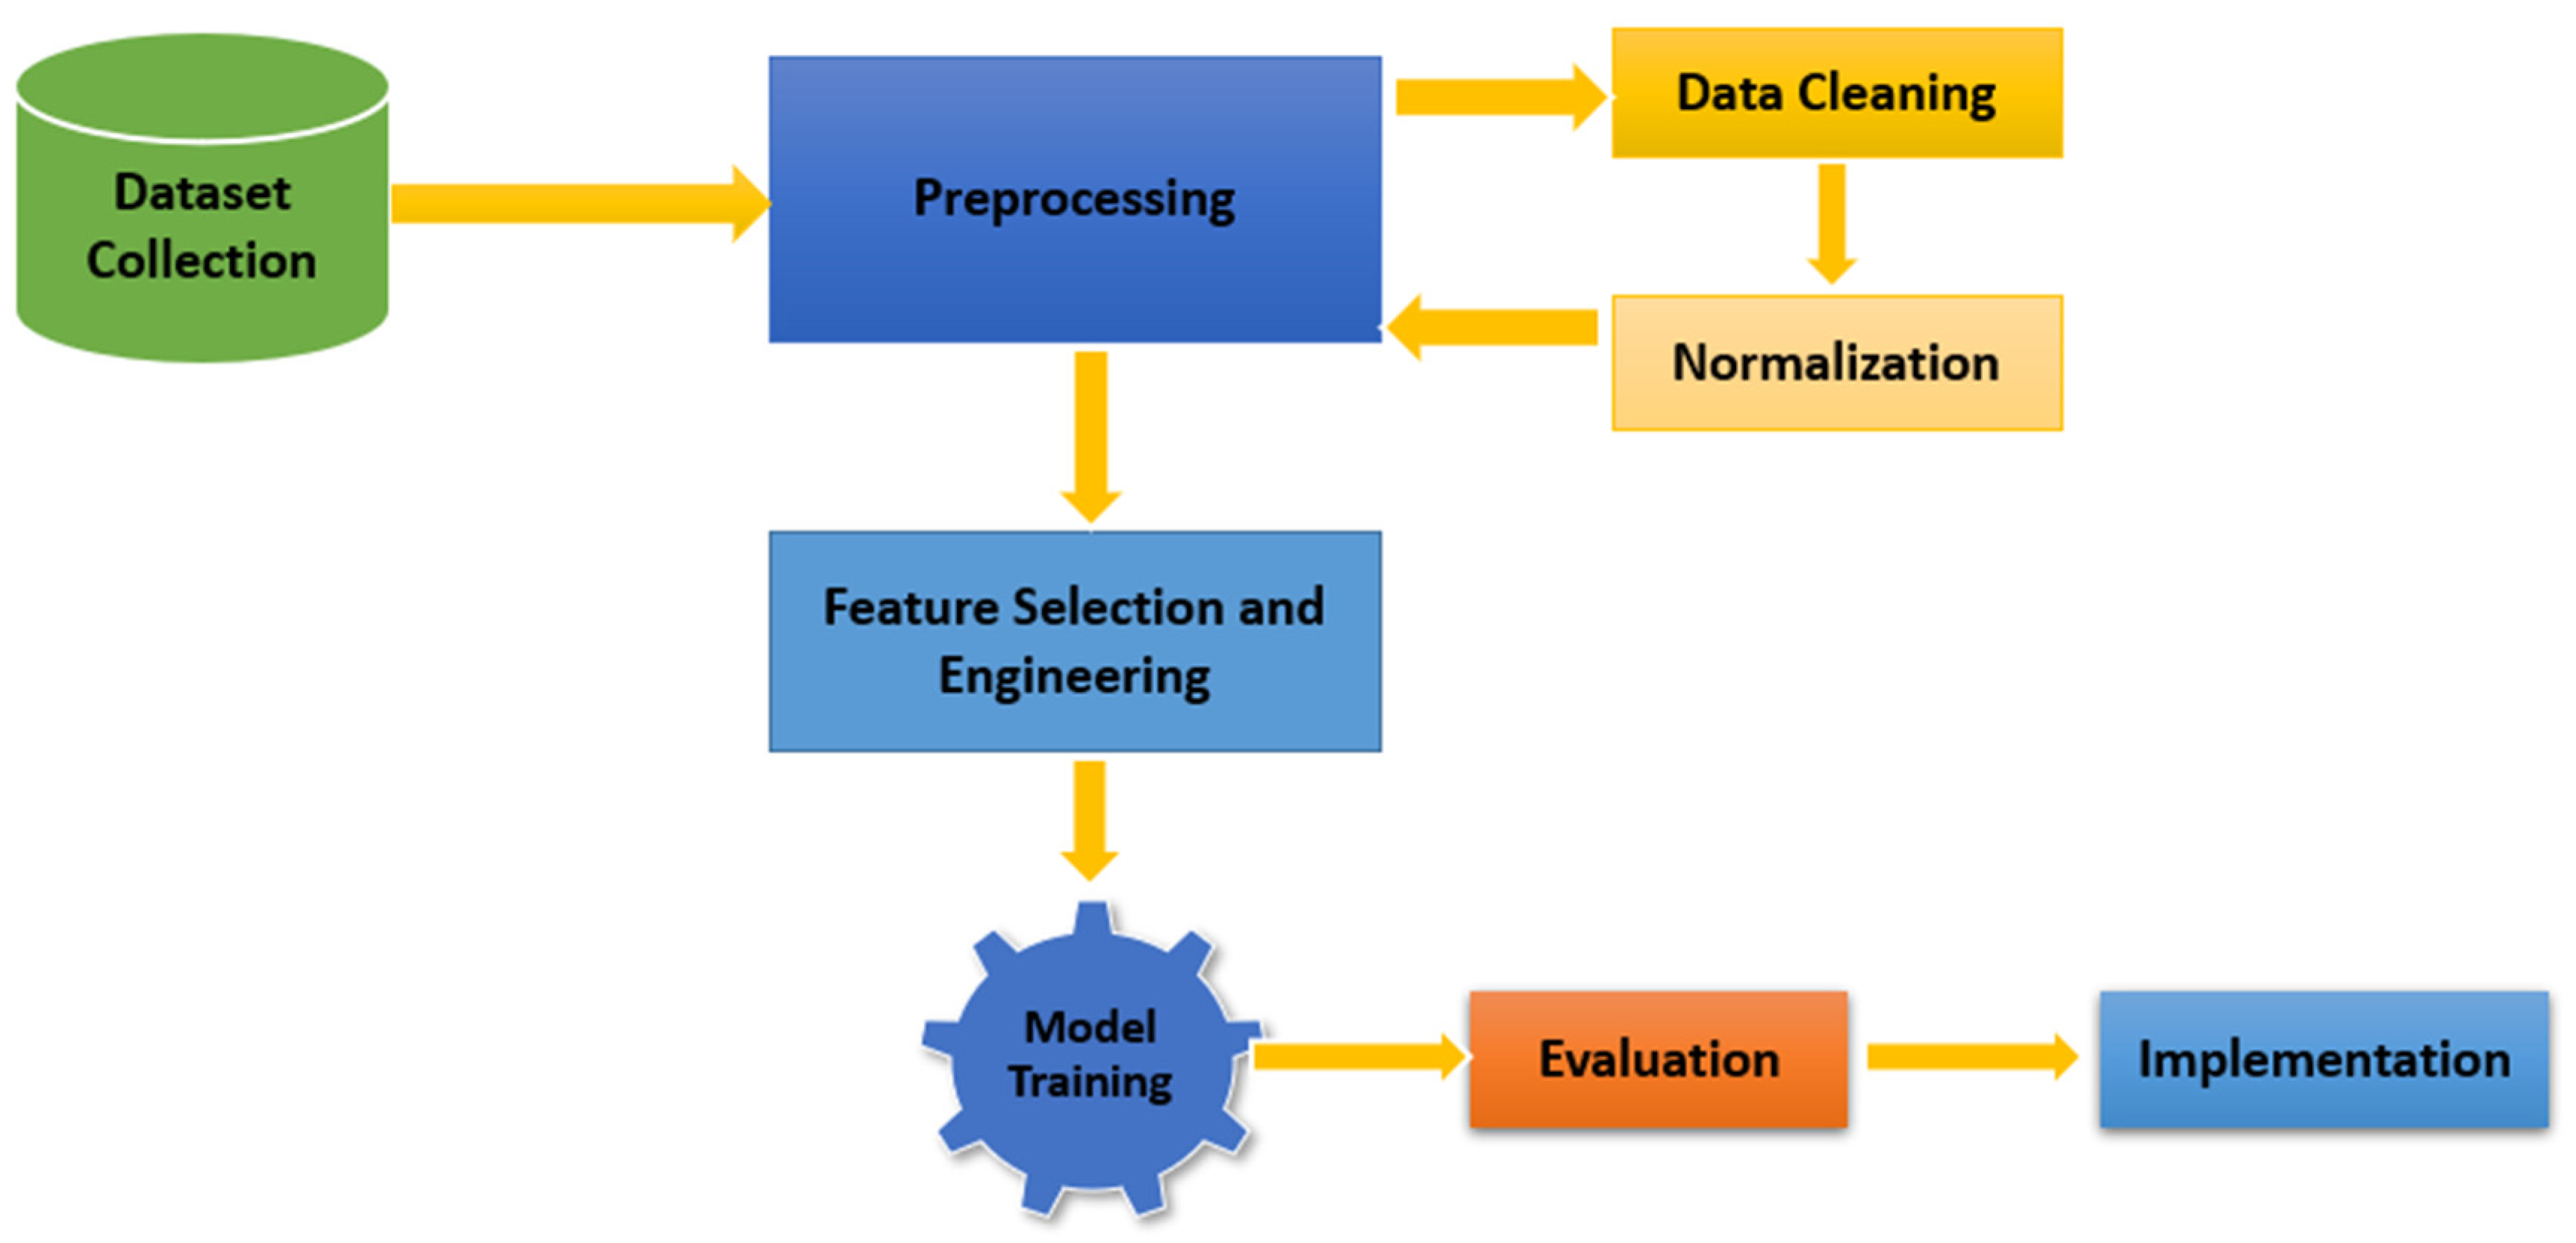
3.1. Framework and Workflow
- Dataset Collection and Preprocessing:
- Source: Kaggle dataset with 1421 instances.
- Data cleaning: removal of incomplete or inconsistent records.
- Normalization: ensuring values are scaled to eliminate bias due to variable magnitudes.
- Feature Selection and Engineering:
- Parameters like HGB, MCV, MCHC, and RDW were selected based on their diagnostic significance.
- Thresholds were defined for anemia classification (e.g., MCV for microcytic: <80).
- Model Training:
- Algorithms: Random Forest, Decision Trees, and Linear Discriminant Analysis.
- Dataset split into training (80%) and testing (20%) sets.
- Evaluation:
- Metrics: accuracy, precision, recall, F1 score, and confusion matrix.
- Implementation:
- Integration into a diagnostic system for clinical use.
- Designed for regions with limited access to laboratory tests.
3.2. DataSet Definition
- -
- HGB: determined the presence of anemia based on threshold levels (e.g., <13.6 g/dL for men).
- -
- MCV: differentiated anemia types (microcytic, normocytic, macrocytic) based on red blood cell size.
- -
- MCH and MCHC: indicated the content and concentration of hemoglobin within cells, aiding in subclassification.
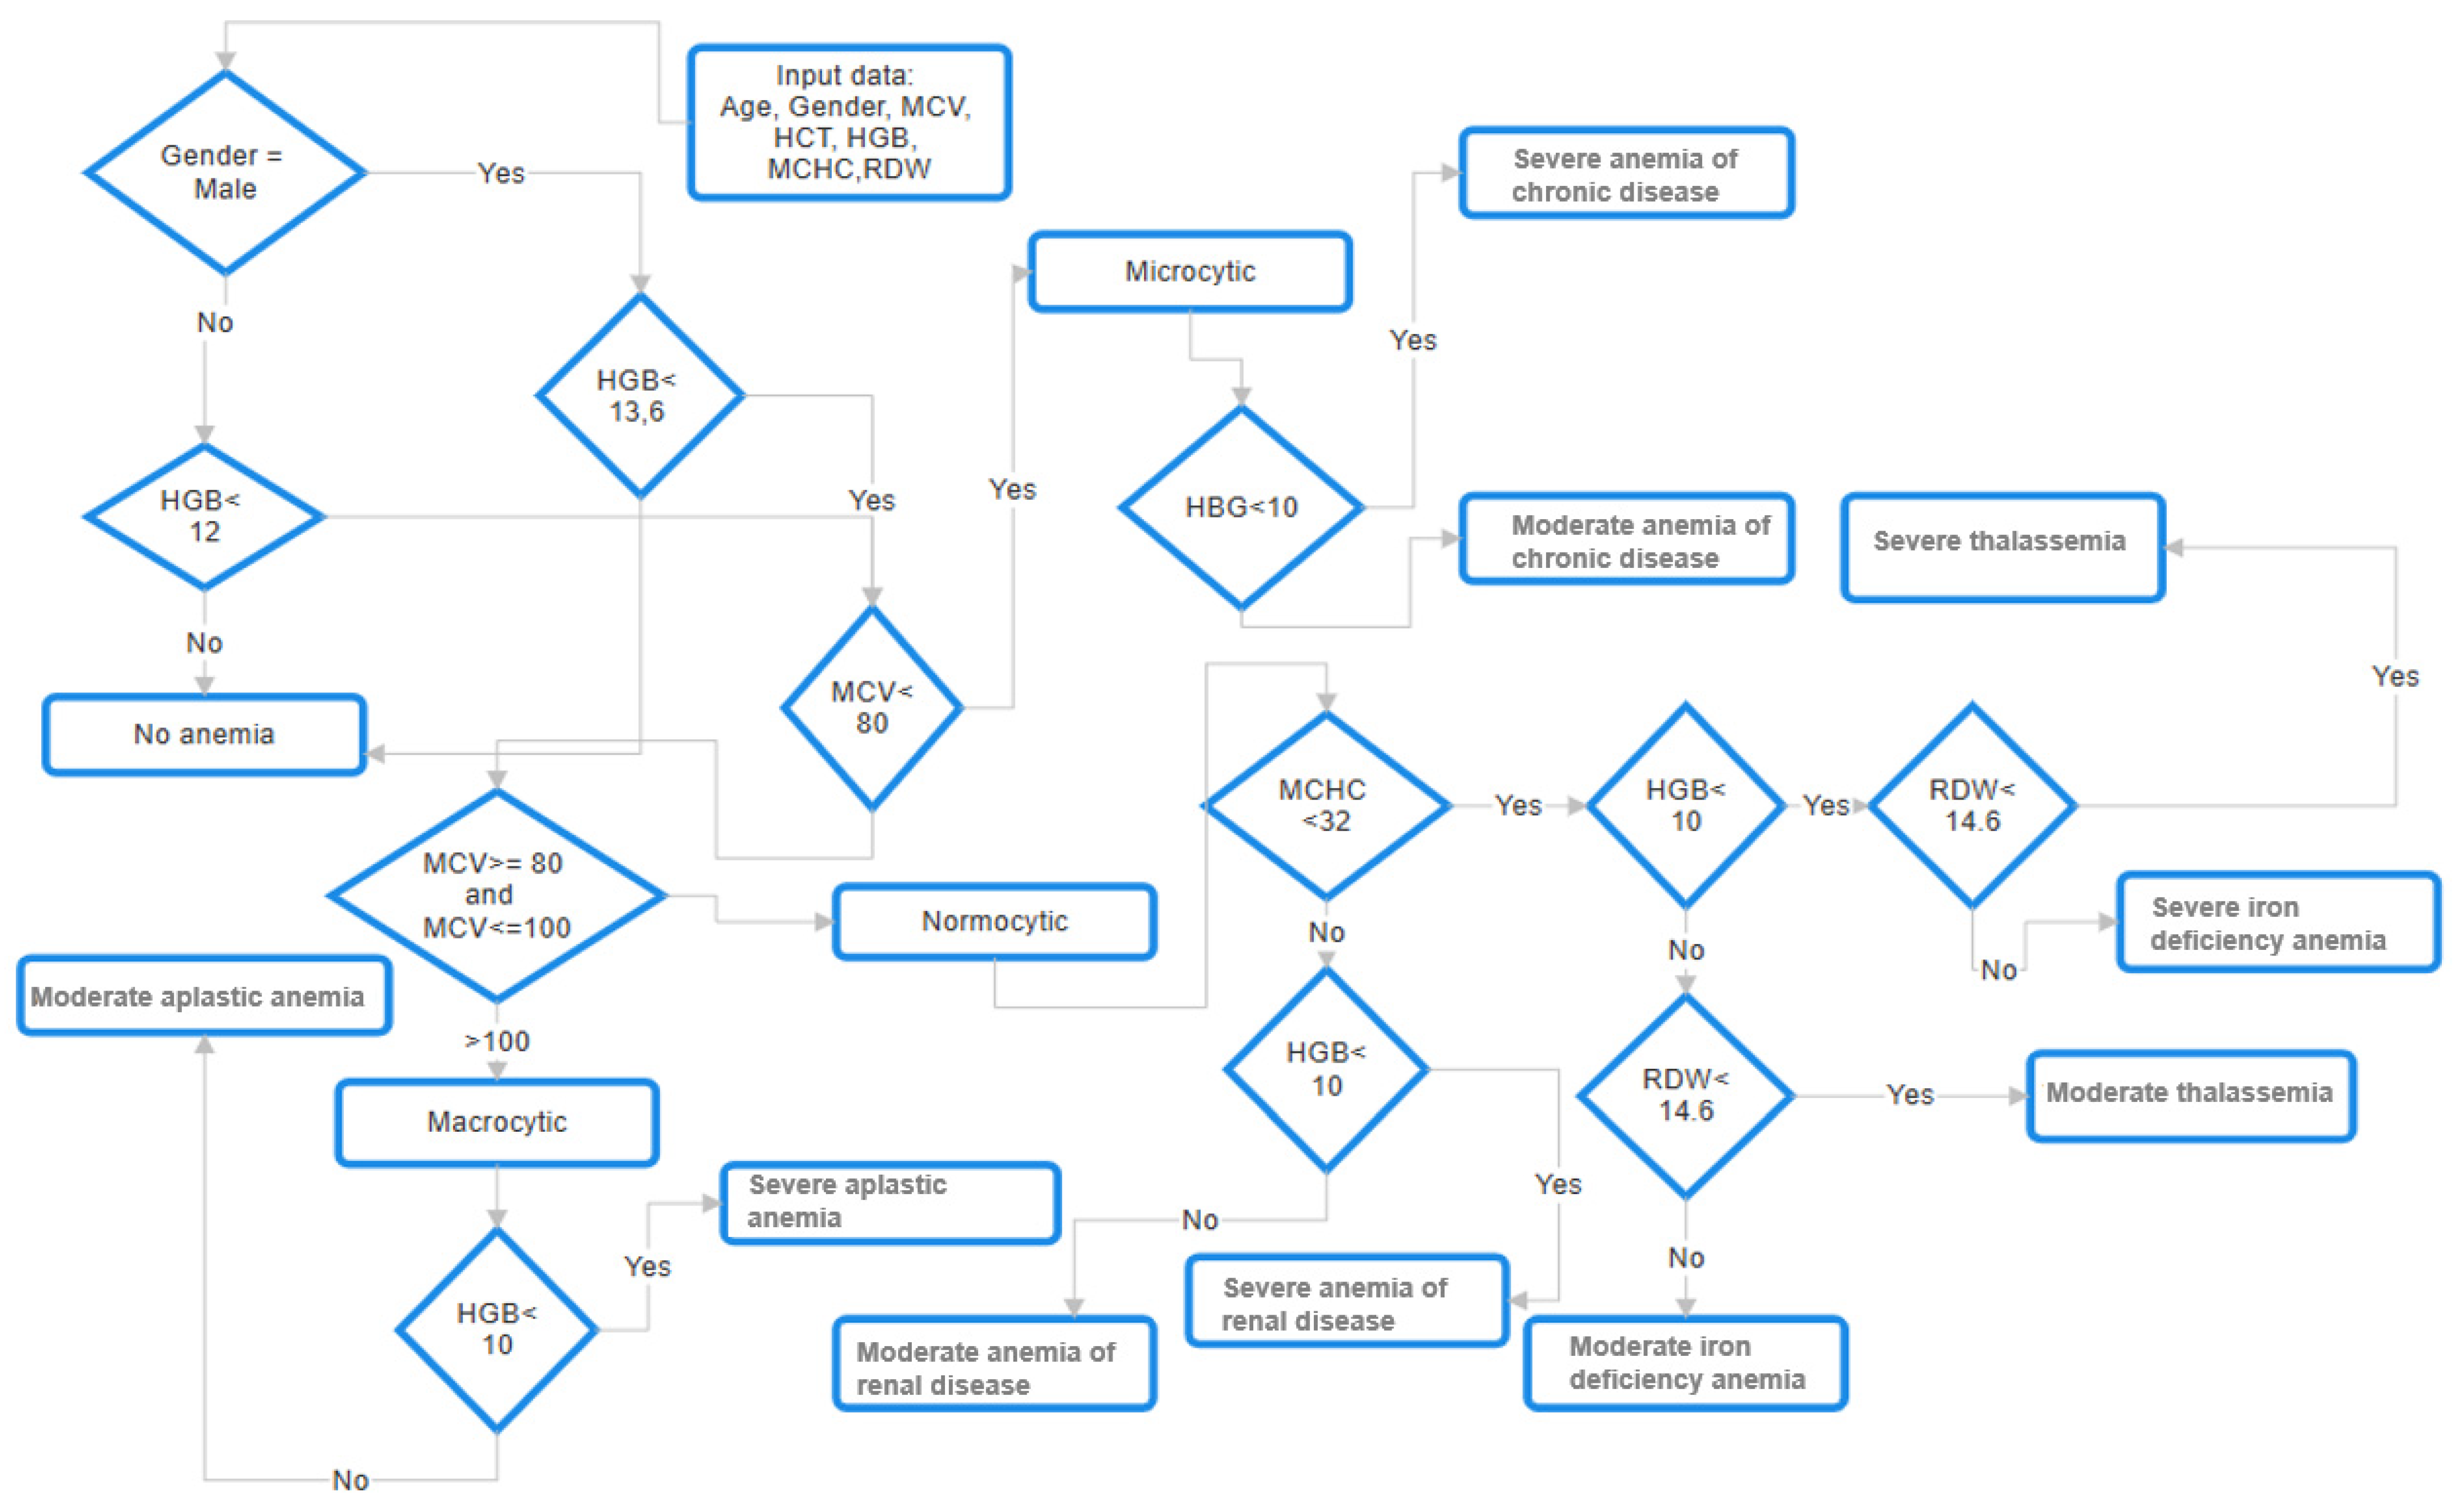
3.3. Training the Data
| Algorithm 1. Classification of anemia | |
|
1 2 3 4 5 6 7 8 9 10 11 12 13 14 15 16 17 18 19 20 21 22 23 24 25 26 27 28 29 30 31 32 33 34 35 36 37 38 |
function classify_anemia(MCV, MCHC, HGB, RDW)
# First Step Classification of anemia type according to MVC if MCV < 80 Then cell_type = “Microcytic” elif MCV >= 80 and MCV <= 100 Then cell_type = “Normocytic” elif MCV > 100 Then cell_type = “Macrocytic” else cell_type = “Unknown” # Second Step Classification of anemia type according cell type and other parameters if cell_type == “Microcytic” Then if HGB < 10 Then return “ACD_Severe” else return “ACD_Moderate” elif cell_type == “Normocytic”Then if MCHC < 32 Then if HGB < 10 Then if RDW < 14.16 Then return “Severe_thalassemia” else do return “Severe_iron_deficiency anemia” else do if RDW < 14.16 Then return “Moderate_thalassemia” else do return “Moderate_iron_deficiency_anemia” else: return “Normocytic anemia (Unknown)” elif cell_type == “Macrocytic” Then if HGB < 10: return “Severe_aplastic_anemia” else do return “Moderate_aplastic_anemia” else do return “Unknown anemia type” |
3.4. Metrics
- Positive (P): the observation were positive (example: it is anemia)
- Negative (N): the observation were not positive (example: it is not anemia)
- True positive (TP): the model correctly predicted the positive class
- True negative (TN): the model correctly predicted the negative class
- False positive (FP), which is also known as a type 1 error, that is, the model incorrectly predicted the positive class when in reality it was negative.
- False negative (FN) is also known as a type 2 error, that is, the model incorrectly predicted the negative class when in practice it was positive.
- Accuracy was equal to the proportion of predictions that the model classified correctly.
- Precision is known as positive predictive value and corresponded to the proportion of relevant instances among the recovered instances.
- -
- Sensitivity corresponded to the hit rate or real positive rate, that is, it is the proportion of the number of instances that were recovered.
- Specificity is known as the true negative rate and measured the proportion of true negatives that were correctly identified; in other words, it was the opposite of sensitivity.
- -
- F1 Score is known as a measure of the accuracy of a test. It could have a maximum accuracy of 1 and a minimum of 0.
4. Results
Analysis of the Metrics for Random Forest
- -
- Class 1 (non-anemia)
- -
- Class 2 (microcytic anemia)
- -
- Class 3 (normocytic anemia)
- -
- Class 4 (macrocytic anemia)
- True positive (TP) = 162, which corresponds to correctly classified cases of class 1.
- True negatives (TN) = 37, which corresponds to correctly classified cases of class 2.
- False positives (FP) = 0, indicating that there were no instances of other classes incorrectly classified as Class 1.
- False negatives (FN) = 0, which means that all instances of Class 1 were correctly identified without omissions.
- Prediction bias: models can favor dominant classes.
- Reduced performance metrics, such as precision, recall, and F1 scores, for minority classes can be poor.
- Overfitting to common classes: models can have difficulty generalizing minority class patterns.
5. Discussion
6. Conclusions
Future Research Directions Include the Following
Author Contributions
Funding
Institutional Review Board Statement
Informed Consent Statement
Data Availability Statement
Acknowledgments
Conflicts of Interest
References
- Garcia-Casal, M.N.; Dary, O.; Jefferds, M.E.; Pasricha, S. Diagnosing anemia: Challenges selecting methods, addressing underlying causes, and implementing actions at the public health level. Ann. N. Y. Acad. Sci. 2023, 1524, 37–50. [Google Scholar] [CrossRef] [PubMed]
- Del Castillo, L.; Cardona-Castro, N.; Whelan, D.R.; Builes, J.P.; Serrano-Coll, H.; Arboleda, M.; Leon, J.S. Prevalence and risk factors of anemia in the mother–child population from a region of the Colombian Caribbean. BMC Public Health 2023, 23, 1533. [Google Scholar] [CrossRef] [PubMed]
- Pobreza Monetaria en Colombia Durante 2022: Efecto Compensado y sus Implicaciones en un Panorama Inflacionario|Programa De Las Naciones Unidas Para El Desarrollo. Available online: https://www.undp.org/es/colombia/discursos/pobreza-monetaria-colombia-efecto-compensado-implicaciones-panorama-inflacionario (accessed on 20 July 2024).
- Cappellini, M.D.; Motta, I. Anemia in Clinical Practice—Definition and Classification: Does Hemoglobin Change with Aging. Semin. Hematol. 2015, 52, 261–269. [Google Scholar] [CrossRef]
- Pineda, J.M. Predictive models in health based on machine learning. Rev. Medica Clin. Las Condes 2022, 33, 583–590. [Google Scholar] [CrossRef]
- Anaemia in Women and Children. Available online: https://www.who.int/data/gho/data/themes/topics/anaemia_in_women_and_children (accessed on 20 July 2024).
- Calle-Pesántez, S.E.; Pallo-Chiguano, J.M. Inteligencia Artificial en la comunicación científica. Espejo Monogr. Común. Soc. 2024, 23, 59–81. [Google Scholar] [CrossRef]
- Prajapati, J.; Uduthalapally, V.; Das, D.; Mahapatra, R.; Wasnik, P.N. XAIA: An Explainable AI Approach for Classification and Analysis of Blood Anemia. In Proceedings of the OCIT 2023-21st International Conference on Information Technology, Raipur, India, 13–15 December 2023; Institute of Electrical and Electronics Engineers Inc.: Piscataway, NJ, USA, 2023; pp. 88–93. [Google Scholar] [CrossRef]
- Rahman, M.; Mojumdar, M.U.; Shifa, H.A.; Chakraborty, N.R.; Stenin, N.P.; Hasan, A. Anemia Disease Prediction using Machine Learning Techniques and Performance Analysis. In Proceedings of the 2024 11th International Conference on Computing for Sustainable Global Development (INDIACom), New Delhi, India, 28 February–1 March 2024. [Google Scholar]
- Kasthuri, E.; Subbulakshmi, S.; Sreedharan, R. Insightful Clinical Assistance for Anemia Prediction with Data Analysis and Explainable AI. In Procedia Computer Science; Elsevier B.V.: Amsterdam, The Netherlands, 2024; pp. 45–55. [Google Scholar] [CrossRef]
- Trigka, M.; Dritsas, E.; Mylonas, P. A Multi-Class Classification Approach for Anemia Level Prediction with Machine Learning Models. In Proceedings of the 2023 8th South-East Europe Design Automation, Computer Engineering, Computer Networks and Social Media Conference, Piraeus, Greece, 10–12 November 2023; Institute of Electrical and Electronics Engineers Inc.: Piscataway, NJ, USA, 2023. [Google Scholar] [CrossRef]
- Tressa, N.; Asha, V.; Singh, S.K.; Subhash, J. Alpha Thalassemia Classifier Using Machine Learning Techniques Based on Genetic Mutations. In Proceedings of the 2023 3rd International Conference on Ubiquitous Computing and Intelligent Information Systems, ICUIS 2023, Gobichettipalayam, India, 1–2 September 2023; Institute of Electrical and Electronics Engineers Inc.: Piscataway, NJ, USA, 2023; pp. 118–122. [Google Scholar] [CrossRef]
- Ponnusamy, U.; Darshan, D.; Sampathila, N. Approaching Explainable Artificial Intelligence Methods in the Diagnosis of Iron Deficiency Anemia Using Blood Parameters. In Proceedings of the 2023 International Conference on Recent Advances in Information Technology for Sustainable Development, ICRAIS 2023-Proceedings, Dhaka, Bangladesh, 21–23 September 2023; Institute of Electrical and Electronics Engineers Inc.: Piscataway, NJ, USA, 2023; pp. 201–206. [Google Scholar] [CrossRef]
- Abdulhay, E.W.; Allow, A.G.; Al-Jalouly, M.E. Detection of Sickle Cell, Megaloblastic Anemia, Thalassemia and Malaria through Convolutional Neural Network. In Proceedings of the 2021 Global Congress on Electrical Engineering, GC-ElecEng 2021, Valencia, Spain, 10–12 December 2021; Institute of Electrical and Electronics Engineers Inc.: Piscataway, NJ, USA, 2021; pp. 21–25. [Google Scholar] [CrossRef]
- Shah, A.R.; Javed, I.; Shams, U.A.; Naveed, M.A.; Mehmood, M.Q. Disease estimation using robust AI methods. In Proceedings of the 2023 4th International Conference on Computing, Mathematics and Engineering Technologies: Sustainable Technologies for Socio-Economic Development, iCoMET 2023, Sukkur, Pakistan, 17–18 March 2023; Institute of Electrical and Electronics Engineers Inc.: Piscataway, NJ, USA, 2023. [Google Scholar] [CrossRef]
- Mugdha, A.G.; Pinki, F.T.; Talukdhar, S.K. Hemoglobin Estimation and Anemia Severity Prediction Using Machine Learning Algorithms. In Proceedings of the 2023 5th International Conference on Sustainable Technologies for Industry 5.0, STI 2023, Dhaka, Bangladesh, 9–10 December 2023; Institute of Electrical and Electronics Engineers Inc.: Piscataway, NJ, USA, 2023. [Google Scholar] [CrossRef]
- Sasikala, C.; Ashwin, R.M.; Dharanessh, D.M.; Dhanabalan, M. Curability Prediction Model for Anemia Using Machine Learning. In Proceedings of the 8th International Conference on Smart Structures and Systems, ICSSS 2022, Chennai, India, 21–22 April 2022; Institute of Electrical and Electronics Engineers Inc.: Piscataway, NJ, USA, 2022. [Google Scholar] [CrossRef]
- Sadiq, S.; Khalid, M.U.; Din, M.Z.; Ullah, S.; Aslam, W.; Mehmood, A.; Choi, G.S.; On, B.-W. Classification of β-Thalassemia Carriers from Red Blood Cell Indices Using Ensemble Classifier. IEEE Access 2021, 9, 45528–45538. [Google Scholar] [CrossRef]
- Yıldız, T.K.; Yurtay, N.; Öneç, B. Classifying anemia types using artificial learning methods. Eng. Sci. Technol. Int. J. 2021, 24, 50–70. [Google Scholar] [CrossRef]
- Shahzad, M.; Umar, A.I.; Shirazi, S.H.; Shaikh, I.A. Semantic Segmentation of Anaemic RBCs Using Multilevel Deep Convolutional Encoder-Decoder Network. IEEE Access 2021, 9, 161326–161341. [Google Scholar] [CrossRef]
- Sabatini, A. Anemia EDA: Max Accuracy & Features Selection. Kaggle. 2022. Available online: https://www.kaggle.com/code/antoniosabatini/anemia-eda-max-accuracy-features-selection (accessed on 10 February 2024).
- Green, R. Anemias beyond B12 and iron deficiency: The buzz about other B’s, elementary, and nonelementary problems. Hematol. Am. Soc. Hematol. Educ. Program 2012, 2012, 492–498. [Google Scholar] [CrossRef]
- Vujović, Ž. Classification model evaluation metrics. Int. J. Adv. Comput. Sci. Appl. 2021, 12, 599–606. [Google Scholar] [CrossRef]
- Sun, J.J.; Li, J.; Fujita, H. Multi-class imbalanced enterprise credit evaluation based on asymmetric bagging combined with light gradient boosting machine. Appl. Soft Comput. 2022, 130, 109637. [Google Scholar] [CrossRef]


| Study | Year | AI/ML Techniques Used | Accuracy |
|---|---|---|---|
| [8] | 2024 | XGBoost, SHAP | 96.95% |
| [9] | 2024 | Logistic regression, KNN, Decision Trees, Naive Bayes, Random Forest, SGD, XGBoost, Bagging Classifier | 95% |
| [10] | 2024 | LightGBM, Explainable AI (XAI) | 91% |
| [11] | 2023 | Logistic regression, SVM | 95.05% |
| [12] | 2024 | Decision Trees, RNA, Naive Bayes, SVM | 95% |
| [13] | 2024 | ML models, SHAP | N/A |
| [14] | 2024 | Convolutional Neural Networks (CNNs) | 93.4% |
| [15] | 2024 | YOLO | N/A |
| [16] | 2024 | Random Forest, Redes Neuronales | N/A |
| [17] | 2024 | Naive Bayes, LR, LASSO, ES | N/A |
| [18] | 2024 | SVM, Gradient Boosting, Random Forest | 93% |
| [19] | 2024 | Artificial Neural Networks, SVM, Naive Bayes, Decision Trees | 85.6% |
| [20] | 2021 | DCED-Net | 97.36% |
| [21] | 2022 | EDA, Random Forest | 100% |
| Current Study | Random Forest, Decision Trees, Linear Discriminant Analysis | 99.82% | |
| Variable | Abbreviation |
|---|---|
| Gender | Gender |
| Hemoglobin | Hemoglobin |
| Mean cell volume | MCV |
| Mean cell hemoglobin | MCH |
| Mean cell hemoglobin concentration | MCHC |
| Target type of anemia | Target |
| Type of Anemia | Ranges or Threshold |
|---|---|
| Microcytic | <80 |
| Normocytic | 80–100 |
| Macrocytic | >100 |
| Type of Anemia | Class |
|---|---|
| No anemia | 0 |
| Microcytic | 1 |
| Normocytic | 2 |
| Macrocytic | 3 |
| Score 1 | Score 2 | Score 3 | Score 4 | Score 5 | Mean | Std | |
|---|---|---|---|---|---|---|---|
| Random Forest | 1 | 1 | 1 | 0.99118943 | 1 | 0.99823789 | 0.00394021 |
| Linear Discriminant | 0.9122807 | 0.90350877 | 0.91189427 | 0.94273128 | 0.95594714 | 0.92527243 | 0.02273305 |
| Decision Tree | 1 | 1 | 1 | 0.98678414 | 1 | 0.99735683 | 0.00591031 |
| Metrics | Value |
|---|---|
| True Positives (TPs) | 162 |
| True Negatives (TNs) | 37 |
| False Positives (FPs) | 0 |
| False Negatives (FNs) | 0 |
| Class | Precision | Recall | F1-Score |
|---|---|---|---|
| 0 | 1.00 | 1.00 | 1.00 |
| 1 | 1.00 | 1.00 | 1.00 |
| 2 | 1.00 | 1.00 | 1.00 |
| 3 | 1.00 | 1.00 | 1.00 |
Disclaimer/Publisher’s Note: The statements, opinions and data contained in all publications are solely those of the individual author(s) and contributor(s) and not of MDPI and/or the editor(s). MDPI and/or the editor(s) disclaim responsibility for any injury to people or property resulting from any ideas, methods, instructions or products referred to in the content. |
© 2025 by the authors. Licensee MDPI, Basel, Switzerland. This article is an open access article distributed under the terms and conditions of the Creative Commons Attribution (CC BY) license (https://creativecommons.org/licenses/by/4.0/).
Share and Cite
Gómez, J.G.; Parra Urueta, C.; Álvarez, D.S.; Hernández Riaño, V.; Ramirez-Gonzalez, G. Anemia Classification System Using Machine Learning. Informatics 2025, 12, 19. https://doi.org/10.3390/informatics12010019
Gómez JG, Parra Urueta C, Álvarez DS, Hernández Riaño V, Ramirez-Gonzalez G. Anemia Classification System Using Machine Learning. Informatics. 2025; 12(1):19. https://doi.org/10.3390/informatics12010019
Chicago/Turabian StyleGómez, Jorge Gómez, Camilo Parra Urueta, Daniel Salas Álvarez, Velssy Hernández Riaño, and Gustavo Ramirez-Gonzalez. 2025. "Anemia Classification System Using Machine Learning" Informatics 12, no. 1: 19. https://doi.org/10.3390/informatics12010019
APA StyleGómez, J. G., Parra Urueta, C., Álvarez, D. S., Hernández Riaño, V., & Ramirez-Gonzalez, G. (2025). Anemia Classification System Using Machine Learning. Informatics, 12(1), 19. https://doi.org/10.3390/informatics12010019