Article

Analysis of Descriptors of Concept Drift and Their Impacts

Institute of Computing, Federal University of Amazonas, Av. Rodrigo Otávio, nº 6200, Coroado I, Campus Universitário Senador Arthur Virgílio Filho, Setor Norte, Manaus 69080-900, AM, Brazil
*
Author to whom correspondence should be addressed.
Informatics 2025, 12(1), 13; https://doi.org/10.3390/informatics12010013
Submission received: 13 December 2024 / Revised: 23 January 2025 / Accepted: 27 January 2025 / Published: 31 January 2025
(This article belongs to the Section Machine Learning)

Abstract

:
Concept drift, a phenomenon that can lead to degradation of classifier performance over time, is commonly addressed in the literature through detection and reaction strategies. However, these strategies often rely on complete classifier retraining without considering the properties of the drift, which can prove inadequate in many scenarios. Limited attention has been given to understanding the nature of drift and its characterization, which are crucial for designing effective reaction strategies. Drift descriptors provide a means to explain how new concepts replace existing ones, offering valuable insights into the nature of drift. In this context, this work examines the impact of four descriptors—severity, recurrence, frequency, and speed—on concept drift through extensive theoretical and experimental analysis. Experiments were conducted on five datasets with 32 descriptor variations, eight drift detectors, and a non-detection context, resulting in 1440 combinations. The findings reveal three key conclusions: (i) reaction strategies must be tailored to different types of drift; (ii) severity, recurrence, and frequency descriptors have the highest impact, whereas speed has minimal influence; and (iii) there is a need to incorporate mechanisms for describing concept drift into the strategies designed to address it.

1. Introduction

In Machine Learning, concept drift refers to the phenomenon of changing the distribution of instances of a specific problem over time [1]. The causes of this phenomenon are varied, ranging from low representativeness of the set of instances used in the classifier’s training to changes in the environment in which the classifier operates [2]. Several works present definitions for concept drift [3,4]. Among these, the definition proposed in [3], summarized in Equation (1), is widely accepted and stands out:
x : p t i ( x , y ) p t j ( x , y ) , t i < t j ,
where x is a feature vector ( x X ) that describes an instance and y represents a target variable. X represents the set of instances, while Y is the set of target variables. A drift occurs at time t j if the joint distribution ( p t j ) differs significantly from joint distribution ( p t i ) at time t i . In [5], it is stated that j tends to infinity ( j ) in the context of data stream.
The concept drift problem can be analyzed based on two components: probabilistic sources [3,6,7,8,9,10,11] and descriptors [5,12,13,14]. In the context of the probabilistic sources component, drifts are classified as virtual or real. In the first, the decision boundary between classes does not change. Consequently, there is no impact on the classifier’s performance. In the second, the decision boundary between classes changes, potentially impacting the classifier’s performance.
In terms of the second component, the descriptors of concept drift characterize the way a new concept replaces the current one. This characterization is based on properties such as the severity, influence zone, speed, frequency, recurrence, and predictability of the drift. According to the literature, this set of descriptors, detailed in Section 2, defines the nature of concept drift [13].
Taking into account that the occurrence of real concept drift can lead to degradation in classifier performance [6], it is necessary to implement a reaction strategy when a drift is detected. Even though there are various possible reaction strategies, a common one is to generate a new base classifier and a new detector based on the latest instances. However, this strategy is not always suitable or feasible. For example, consider the scenario where labeling is costly and there exists a significant difference between the new concept and the current one. In this scenario, adopting the common reaction strategy can result in error higher than before the reaction, since there may be not enough instances to correctly learn the new concept, besides the high cost of labeling.
In the literature of concept drift, the topic of drift detection is widely addressed, whether from a supervised [15,16,17,18] or unsupervised [7,19,20,21,22,23] perspective. However, the adequacy of a reaction strategy is often overlooked. The study of the nature of concept drift can provide the necessary knowledge to define an appropriate reaction strategy. Nevertheless, very few works handle concept drift from the perspective of its nature.
In this context, this paper aims to analyze the impact of descriptors on concept drift. For this purpose, a comprehensive theoretical and experimental investigation was conducted. Experiments were performed on five synthetic datasets. Each dataset was simulated with 32 different combinations of descriptors. Considering that nine different contexts were tested in each dataset, we performed a total of 1440 tests. The results were analyzed and compared using statistical tests.
In summary, the contributions of this paper are as follows:
  • Empirical identification of relations between concept drift descriptors: Descriptors characterizing the same phenomenon naturally establish interrelationships. The analysis of these relationships provides critical insights into the phenomenon. This study identifies seven distinct relationships among the descriptors and classifiers, resulting in three groups based on their influence on classifier performance, descriptor behavior, and drift predictability. This contribution highlights the role of the interactions among descriptors in shaping concept drift.
  • Identification of descriptors with high and low impact on concept drift: The results of this research demonstrate that the characteristics of a drift affect the classifier’s performance in distinct ways. Thus, identifying which characteristics have the highest impact enables prioritizing them in the design of an evidence-based reaction strategy.
The rest of the paper is structured as follows. Section 2 introduces concept drift descriptors; Section 3 discusses related work; and Section 4 describes the relationship between the descriptors identified in this paper. Then, Section 5 presents the experiments conducted and the results obtained. Finally, Section 6 concludes the paper and introduces future work.

2. Concept Drift Descriptors

A descriptor is an inherent property of concept drift that enables its characterization. Our literature review identified six descriptors: severity, influence zone, speed, frequency, recurrence, and predictability. These descriptors are categorized into two groups based on dimensions considered, except for predictability, which is dimension-independent: (i) Spatial dimension: severity and influence zone; or (ii) Temporal dimension: speed, frequency, and recurrence. A taxonomy of the descriptors is presented in Figure 1.
Severity categorizes the drift as high or low, while the influence zone defines it as global or local. Speed classifies drift as abrupt or gradual; frequency as periodic or non-periodic; and recurrence as recurrent or non-recurrent. Finally, predictability indicates whether the drift is predictable. These descriptors characterize concept drift by addressing six specific questions listed below: severity and influence zone correspond to questions one, two, and three, while frequency and recurrence address questions four and five. Lastly, predictability responds to question six [5,13,24].
  • Speed: What is the duration of the drift?
  • Severity: How does the drift occur?
  • Influence Zone: Where does the drift occur?
  • Frequency: How many times did the drift occur in a time interval?
  • Recurrence: Does drift have cyclical behavior?
  • Predictability: Is there any pattern in the occurrence of drift?
Therefore, characterizing concept drift by its descriptors is useful to understand its nature and defining the best strategy to deal with it [5,13,24]. Each descriptor is better detailed in the next subsections.

2.1. Severity

Severity is also known as magnitude in the literature [25]. It is related to measuring dissimilarities in the input space between the points in time i and j, where i belongs to the concept before the drift and j to the stable concept after the drift [5,13]. This descriptor is formalized by [5] and summarized in Equation (2).
Δ = δ ( p t i ( X , Y ) , p t j ( X , Y ) ) , i < j ,
where δ represents a function to measure the discrepancy between two data distributions, and t i and t j represent two distinct points over time. Usually, Δ is positive, and the higher its value, the higher the drift severity [5].
In [13], concept drift is classified according to its severity level into two types: (1) high (global) and (2) low (partial). The first refers to the complete replacement of the current concept by the new concept. The second refers to a partial replacement of the current concept by a new concept. In this case, drift affects only a part of the current concept. It is worth mentioning that the classification of severity levels is still an open issue in the literature [5].
Figure 2 shows examples of low- and high-severity drift in a binary classification problem, where instances are described by two features. On the left side, (a) and (b) represent the same input space before and after drift, respectively. The areas highlighted in yellow indicate the regions affected by drift. These regions are only a small part of the space, characterizing a low-severity drift. In this scenario, reacting to the drift by generating a new base classifier and a detector (the common strategy) means forgetting the entire input space and having to relearn all of it, including the regions unaffected by drift.
On the right side, (c) and (d) represent the same input space before and after drift, respectively. It is possible to observe that the regions affected by drift represent a significant portion of the space, characterizing a high severity drift. In this scenario, the common reaction strategy is likely the best option to react to this type of drift, since the entire green class was affected.
The analysis of this descriptor reinforces the fact that it is not indicated to pre-define a drift reaction strategy without prior knowledge of its severity level. If we take the common reaction strategy as an example, retraining requires labeled samples, which is a high-cost process and is often unfeasible depending on the prediction task dealt with. In this case, a recommended solution could be defining a severity level threshold to determine whether the reaction is necessary, rather than reacting to the drift regardless of the severity level.

2.2. Influence Zone

This descriptor is related to the regions of the input space that are affected by drift [13]. We can consider affected regions as regions of conflict between the current and the new concept, with p t i ( X , Y ) and p t j ( X , Y ) , i < j having a significant difference [5]. Figure 3 illustrates this descriptor in the context of a binary classification problem within a space also defined by two features, x 1 and x 2 . This figure shows in (a) that the decision boundary is defined by x 1 = 8 and x 2 = 8 . After drift, in (b), there is a shift of the decision boundary to x 1 = 9 e x 2 = 9 . This displacement results in a region of conflict between concepts delimited by 8 x 1 + x 2 < 9 , as shown in (c).
Depending on the region of the input space affected, drift is classified as local or global. Local drift is characterized by a limited region of input space that is affected by the drift. Global drift is characterized by the entire input space being affected. As a consequence, this type of drift is more easily detected because there is a significant difference between the concepts and there is no co-existence between them [13].
Similarly to severity, it is also important to take into account the influence zone to determine the best drift reaction strategy to maintain classifier performance and avoid unnecessary retraining. When the influence zone is global, probably affecting the entire input space and consequently generating a high-severity drift, the best reaction strategy is to retrain. On the other hand, when the influence zone is local, there are two possible scenarios. The first occurs when the input space affected by drift involves the decision boundary, as exemplified in Figure 3c. In this case, the reaction strategy choice should consider other descriptors. In the second scenario, the decision boundary is not affected by drift, characterizing a virtual concept drift, which does not affect the performance of the classifier [3,6,7,8,9,10,11]. In this case, retraining is strongly discouraged.

2.3. Speed

Speed is related to the duration of the transition between the current and new concepts. The drift speed is defined as the inverse of the time required for the current concept to be replaced by the new concept [12,26]. Equation (3) provided by [13] is used to measure it:
s d = 1 t d e t d s ,
where t d e and t d s represent the endpoint and start point of the transition between the concepts, respectively. From a numerical perspective, s d reaches its maximum value 1 when the interval between concepts is minimal, and tends toward 0 as this interval approaches its maximum.
Drift is categorized into two groups based on the speed descriptor: abrupt (Figure 4a) and gradual [5,12,13,26]. The second group is subdivided into incremental gradual (Figure 4b) and probability gradual (Figure 4c) [13]. Drift is abrupt when s d = 1 and incremental otherwise. However, this understanding is not a consensus in the literature. For example, the authors of [25] present different definitions for abrupt and gradual drifts.
Regarding the reaction strategy, high-speed drifts are more challenging because the transition period between concepts is short. Consequently, there are few instances available to adopt the common reaction strategy. In contrast, drifts with a longer transition period between concepts allow more instances to be stored for adopting the retraining reaction strategy. Therefore, describing the concept drift in terms of its speed is a key element to define the best reaction strategy.

2.4. Frequency

Frequency is defined as the inverse of the time between the start points of two consecutive drifts [12,13,25]. Figure 5a shows two examples of frequency, the first occurs in the transition between the yellow concept ( t i ) and the green concept ( t j ). The second occurs in the transition between the pink concept ( t k ) and the blue concept ( t l ). If the drifts occur with the same frequency, they are classified as periodic; otherwise, they are classified as non-periodic.
High-frequency drifts make it practically impossible to adopt a retraining-based reaction strategy as they would require constant reaction. Moreover, these drifts can have a slight effect on the decision boundary, needing no retraining of the base classifier nor even drift detection. In the scenario of drifts with low frequency, it allows more instances to be available, providing more knowledge to define the reaction strategy. Finally, when drifts are periodic, it is possible to know patterns of concepts of modifications. This knowledge is useful for determining the optimal time to retrain the base classifier and to update the drift detector.

2.5. Recurrence

Recurrence is a descriptor related to situations in which previously active concepts may reemerge [12,13,25,27]. Considering recurrence, drifts are divided into cyclical and acyclical [12,13,14]. The first is characterized by previous concepts that reemerge with constant periodicity, while in the second, previous concepts reemerge without constant periodicity. Figure 5b,c shows examples of recurrent cyclical (the frequency has the same values) and acyclical drifts (the frequency values are different), respectively.
It is also important to observe the recurrence of concepts when choosing a reaction strategy. For instance, a strategy based on completely forgetting the current concept in a recurrent environment will generate the need to relearn a concept already known, without the assurance that there will be enough instances to learn it correctly.

2.6. Predictability

Predictability is related to the presence of a pattern in drifts that can be predicted. Otherwise, the drift is completely random and cannot be predicted [13,14,25]. Several aspects of drifts can be more or less predictable, such as the endpoints and starting points of drifts and the regions affected, among others. There are two reasons to consider the predictability descriptor: (1) it is easier to understand the origin and effects of a predictable drift; and (2) there will be minimum delay and false detection rates when the drift is predictable, which are both desired characteristics of effective drift detectors [14].
Predictability is a key element to choose a reaction strategy. In a scenario where drift is completely random, no descriptor is able to define patterns to be predicted. In this case, drift detection is only possible when the classifier’s performance is already affected. Consequently, any reaction strategy can mitigate the performance loss.

3. Related Work

This section provides a summary of works that address concept drift descriptors. These works are grouped by descriptors.

3.1. Influence Zone

The approach proposed in [28] is based on the Kullback–Leibler divergence [29] to measure the difference between two windows of data. This approach quantitatively identifies the sub-regions of the input space with the highest changes, thereby locating the region of concept drift. In [30], the input space is decomposed into homogeneous sub-regions through a decision tree, using the ρ -value of a Kolmogorov–Smirnov test [31] as split criterion. The resulting decision tree is named a Kolmogorov-Tree [32].
The Competence-Based Discrepancy Density Estimator Method (CDDE) proposed in [33] identifies the sub-regions of the input space where drift occurs by mapping the discrepancies between two consecutive windows of data. In [34], the identification of regions occurs in a similar way as in [33]. These regions contain the oldest instances that should be forgotten. The method in [34] differs from [33] in the way they detect drift.
In [35], a comprehensive analysis of the impact of the locality (influence zone) of a drift on the performance of classifiers and detectors was conducted. This study also presented a new proposal for categorizing drift according to its location and the number of affected classes. They proposed four categories: (i) Single-Class Local Concept Drift: there is only one class that the drift affects, impacting at most 50% of its distribution; (ii) Single-Class Global Concept Drift: there is only one class that the drift affects, impacting at least 50% of its distribution; (iii) Multi-Class Local Concept Drift: more than one class is affected by the drift, impacting at most 50% of each class’s distribution; and (iv) Multi-Class Global Concept Drift: more than one class is affected by the drift, impacting at least 50% of each class’s distribution. The authors indicate that the location of the drift influences the classifier performance, so as that understanding where drift occurs is essential to define the appropriate reaction strategy, which does not necessarily involve retraining.
In [36], an analysis of locality in the context of concept drift is presented. However, this is performed considering unsupervised drift detection. The study provides a mathematical formalization for identifying regions in the data space affected by drift and highlights the importance of translating these changes into comprehensible descriptions for human operators. Several approaches are discussed, including kdq-tree methods, local neighborhood-based approaches (LDD-DIS [37]), and model-based approaches (MB-DL). Experiments with synthetic data demonstrate that MB-DL achieved higher accuracy, especially in high-dimensional scenarios, as long as appropriate preprocessing techniques were applied. Furthermore, the authors emphasize that explaining the changes is a critical step for improving interpretation and response in machine learning-based systems. In addition, they point out that research in this area remains limited and suggest future directions for methodological and practical advancements.

3.2. Severity

In [2], a method is proposed to describe concept drift through flows, characterizing the direction and magnitude of changes in the data distribution over time. The proposed method mathematically formalizes the problem and offers an initial solution based on linear models to enable explainable inspection of the features most affected by drift. Through experiments with synthetic and real-world data, the authors demonstrate the method’s usefulness in tasks such as transfer learning and change visualization. The research highlights the relevance of explainable approaches in monitoring technical systems and indicates RBF networks and clustering techniques for this task.

3.3. Frequency

The Disposition-Based Drift Detection Method (DBDDM) proposed in [38] uses an approach based on two windows: one fixed and one sliding. The fixed window stores examples of the current concept, while the sliding window stores the latest examples. The frequency is defined by an approximate random test that determines whether the two consecutive windows differ significantly. If the divergence exceeds a threshold, a counter is incremented, indicating the frequency.

3.4. Severity and Influence Zone

The Interpretable Drift Detector (IDD) proposed in [39] identifies the cause, affected regions, and severity of the drift. IDD uses a decision tree structure to analyze the accuracy of the nodes. Variations in accuracy serve as the basis for measuring drift severity, and the path between the root and the node indicates the regions affected by drift. IDD is a supervised method; therefore, there are restrictions on its application in real problems where obtaining true labels is limited.

3.5. Speed and Recurrence

The approach proposed in [4] identifies the speed and recurrence of the drift based on the output of a classical drift detector operating with two windows. The speed is computed as defined in [13] (Equation (3)). The frequency is computed as the historical ratio between the accuracy of the detector within each window. Similarly to the method proposed in [39], this approach is also supervised, which limits its application in real problems.

3.6. Speed and Severity

The Quadruple-Based Approach for Understanding Concept Drift in Data Streams (QuadCDD) proposed in [40] aims not only to detect drift, but also to provide valuable information to support the decision on reactions based on speed and severity. QuadCDD uses prior information about the starting and ending points of drift to define speed. It also uses the sample’s true labels to measure severity. Therefore, this approach is completely supervised, as there is a precondition that the start and end points of drift are known. It is important to emphasize that in this approach, severity is defined as the difference in classifier accuracy. This definition diverges from the one presented in Section 2.

3.7. A Brief Comparative Analysis of Related Work

Although several studies address concept drift detection, as reviewed in [1,8,24,41,42,43,44], there is a gap in the literature regarding studies focused on the nature of drift and, more importantly, on how understanding this nature can provide evidence to define the ideal reaction strategy. In this context of scarcity, the studies discussed in Section 3, and summarized in Table 1, are the most aligned with our work.
The related studies are divided into two groups based on their similarity with our work. Group 1 comprises studies that address concept drift detection, considering at least one descriptor. From this group, some observations can be made. First, spatial dimension-based descriptors are the most frequently addressed descriptors, with the influence zone being examined in [28,30,33,34], and severity in [2,39]. This suggests that there is a potentially better understanding of this dimension in the literature dealing with the drift phenomenon. A second observation is that these studies, except for [4], address only one descriptor, indicating that the combination of descriptors increases the complexity of the problem, which is consequently a less explored point in the literature. Finally, all works from this group do not provide an analysis of the nature of the drift and its potential impacts on classifier performance. Different from these works, our paper focuses on analyzing the impact of descriptors on classifier performance and identifying useful elements for the definition of a better reaction strategy. Moreover, our work is not restricted to spatial dimension-based descriptors, and takes into account the relationship between different descriptors, not only individual ones.
In turn, group 2 comprises studies that analyze the characteristics of drift and its potential impacts on classifier performance, and seek evidence to define an appropriate reaction strategy. These studies are the most similar to the approach presented in this work. However, while the works in this group are limited to the analysis of two descriptors [40] or a single descriptor [2,35,36], the present work stands out by analyzing four descriptors. Regarding the learning paradigm, in [2,35,40] only the supervised paradigm is analyzed, whereas [36] focuses exclusively on the unsupervised paradigm. To the best of our knowledge, this work is the first to analyze the supervised, semi-supervised, and unsupervised paradigms, distinguishing itself by offering a more comprehensive and integrative analysis of drift characteristics.

4. Relationship Between the Descriptors

When analyzing concept drift, the relationship between descriptors must be observed rather than considering isolated descriptors, as the joint analysis may provide a better understanding of the phenomenon. For this reason, we present in this section some relationships between drift descriptors, identified either empirically or based on the literature. An exhaustive list is not possible because there may be other relationships that have not yet been identified. These relationships are divided into three groups: (1) those that do not affect the performance of the classifier neither the detector; (2) relationships that affect the behavior of the descriptors among themselves; and (3) those that affect the predictability of drift. Note that only relationships between pairs of descriptors are analyzed.

4.1. Impact on the Performance of the Base Classifier and Detector

Figure 6a illustrates the relationship between severity and frequency considering different scenarios. The dissimilarity between two underlying concepts is observed to be low from t k to t l , leading to minimal impact on the decision boundary. However, in scenarios with low severity and high frequency drift, for instance from t i to t j , the accumulated dissimilarity can lead to a significant drift in the decision boundary, consequently degrading the performance of the classifier. It is important to observe that the relationship between severity and frequency should not be mistaken for incremental gradual drift, depicted in Figure 4b. Here, there are only stable concepts, whereas in incremental gradual drift there is an interval of unstable concepts in the transition between two stable concepts.
We also show in Figure 6b that there are four possible states resulting from the relationship between severity and frequency. In the first ( S 1 ), drift has low severity and low frequency. In this case, few variations occur and each new concept differs only slightly from the previous one, resulting in a low impact on the classifier’s performance. In S 2 , there is drift with low severity and high frequency. Although each new concept is very similar to the immediately previous one, many drifts occur in a short period. Therefore, the accumulated divergences between concepts over a short time strongly affect the classifier’s performance. S 3 is characterized by drift with high severity and high frequency. This scenario has the strongest impact on classifier’s performance, because concepts show significant divergence among themselves, and drifts occur in a short period. In this case, a more robust reaction strategy is constantly required. Finally, in S 4 , there are drifts with high divergence between concepts, since drift occurs over longer periods, creating a scenario with significant impact on classifier performance. In summary, the high impacts present in S 3 and S 4 are due to severity, while those in S 2 come from the relationship between severity and frequency.
As previously mentioned, influence zone and severity (Section 2) describe drifts regarding the spatial dimension. There are three ways in which they relate. The first is when the influence zone is global, affecting the entire input space, and consequently characterizing high severity drift. In the second, the influence zone is local, and the input space affected by drift involves the decision boundary. In this case, severity can vary, affecting the classifier`s performance and the detector. In the last one, the influence zone is local and the input space affected by drift does not involve the decision boundary. This is a virtual concept drift that does not affect the classifier’s performance nor the detector [3,6,7,8,9,10,11]. Therefore, there may be drifts with high severity located far from the decision boundary (influence zone), as well as drifts that occur in the decision boundary but with low severity. Table 2 summarizes the relationship between the descriptors of Group 1.
Regarding the impact on classifier performance, it is important to highlight that concept drift is associated with environmental changes, making it a problem independent of the type of model used. In this context, it cannot be stated a priori that deep learning models are immune to concept drift. Although these models demonstrate robustness and superior performance in various applications, the literature indicates that they also face challenges related to concept drift (as noted in [45,46,47]). Therefore, the analysis presented in this subsection is expected to be valid for deep learning models and shallow models. This reinforces the importance of characterizing concept drift through its descriptors, even in the context of more complex models.

4.2. Impact on the Behavior of Descriptors

In this group, two pairs of relationship can be identified: frequency vs speed, and frequency vs recurrence. In the first pair, high-frequency drifts are directly associated with high speed, since lower drift speeds result from lower frequencies. However, lower frequencies of drifts are not associated with low-speed drift. In terms of frequency and recurrence, in [12], it is stated that the majority of recurrent drifts are also periodic. Table 3 summarizes the relationships between the descriptors of Group 2.

4.3. Impact on the Predictability of Concept Drift

The relationship between predictability and speed, frequency, and recurrence is identified in [13]. If the drifts do not follow any patterns of speed, frequency, or recurrence, it is not possible to predict their occurrence. In this case, detecting drift is only possible after its occurrence, by observing the degradation of the classifier’s performance. Table 4 summarizes the relationships between the descriptors of Group 3.

4.4. A Brief Analysis of the Relationship Between Descriptors, Reaction Strategy, and Application Scenarios

The effectiveness of a reaction strategy to handle concept drift is significantly dependent on the interaction between drift descriptors and the specific characteristics of the application scenarios. While Section 4.1, Section 4.2 and Section 4.3 explore the relationships among the descriptors, this subsection briefly examines how these interactions can guide the selection of reaction strategies best suited to real-world contexts. We use some real applications as examples.
In adverse environments, such as in fraud detection, where fraudsters frequently evolve their patterns in short time intervals to attempt to validate fraudulent behaviors, any reaction strategy must consider the time required to restore the system before the next drift occurs. Additionally, instance labeling frequently requires human intervention, which can impact strategies such as in incremental learning [48,49], that rely on continuous labeling, often rendering them unfeasible.
In the healthcare sector, machine learning models are employed, for example, to predict disease behavior, analyze data from medical devices, or interpret medical imaging. In all of these cases, the environment evolves over time and is subject to concept drift. Recurrence and frequency descriptors play a critical role in defining the reaction strategy for handling seasonal disease data. Retraining the classifier completely after the end of a disease manifestation period (concept) can lead to unnecessary retraining costs when the disease reoccurs [50,51,52]. In situations of disease outbreaks, such as the COVID-19 pandemic, where there is an abrupt and significant increase in cases over a short period, drastic changes in behavior patterns, velocity, and severity descriptors play a crucial role in defining the reaction strategy [53].
This discussion is essential for solving real-world problems, especially in dynamic scenarios where adaptability and data-driven decision-making play critical roles. Exploring these issues more deeply in future work could significantly contribute to the development of more robust and effective approaches, benefiting areas such as healthcare, industry, economy, and security.

5. Experiments and Results

The experiments were conducted to analyze the influence of the descriptors on concept drift by varying the values of each descriptor. To achieve this aim, five synthetic datasets in nine distinct contexts were investigated. First, six different drift detectors widely known in the literature were considered: two supervised DDM [16] and EDDM [17]; two semi-supervised DSDD [23] and MD3-EGM [19]; and two unsupervised DDAL [54] and STUDD [55]. Moreover, oracle versions of the supervised detectors were incorporated in the experiment (DDM-O and EDDM-O) in an attempt to evaluate the descriptors in a perfect drift detection environment. An oracle detector is an ideal detector that knows in advance all the drift points without loss, false, or detection delay. Finally, the ninth context considers no detection (ND), which is investigated to show the impact of descriptors when detection is not performed.
In terms of descriptor values, 32 variations were tested, here referred to as scenarios. Therefore, considering the five datasets and the nine detectors studied, a total of 160 distinct scenarios were investigated. A decision tree was used as the base classifier in all scenarios, with a total of 1440 different combinations analyzed. Finally, all detectors were applied using the default values defined by their authors.
The experiments were divided into two series, as summarized in Figure 7. The first consisted of four stages and aimed to measure the performance of the classifier (C) in terms of prequential error, and the performance of the detector (D) regarding the percentage of false, missed, and detection delays. False detection was defined as a detection that occurs before a known drift; a missed detection occurred when a known drift was not detected; and a delayed detection was recorded when the detection occurred after a known drift, but was not characterized as a false detection. Then, the results from the first series were used as input for the second series of experiments. Two stages composed the second series, and the objective was to identify the combinations of descriptor values for concept drift that generated the best and the worst results considering the ranking of scenarios based on the median of prequential error. Both series were repeated for all nine contexts.
In the first stage of the first series of experiments, the performance metrics ( M i ) of the detector were calculated for each of the 32 scenarios in the five datasets used. Likewise, the median prequential error ( M D i ) of the base classifier was calculated for each scenario in the second stage. In the third, the average of M D i was calculated considering the medians of the prequential error for the same scenario i in each dataset. These averages formed a list of the classifier’s median performance in each scenario across each dataset. Finally, the list was sorted in ascending order. This list indicated in which scenarios the base classifier and the detector reached the best and the worst results.
The second series focused on statistical analysis of the results. The fifth stage divided the scenarios, ranked in the previous stage, by the values of the descriptors of each of the four analyzed descriptors. Then, in the sixth stage, the subgroups formed based on speed, severity, and recurrence were compared using the Mann–Whitney statistical test [56], and the subgroups formed based on frequency were compared using the Friedman statistical test [57]. In both tests, the significance level was set to 0.05 . In the end, the results indicated which value for each descriptor led to better or worse performance ( V d ), as detailed in Table 5.
The first column of Table 5 indicates the scenario identifier. The second presents the detail of the drift in terms of descriptors in the following order: Speed-Severity-Recurrence-Frequency. The values for each descriptor are represented by their initials and are detailed in the footnote. Columns 3, 4, and 5 show information about drift: number of existing drifts, speed, and frequency. The presence of only one value indicates a periodic drift, while non-periodic drifts are signaled by “Alt”, with drift interval values shown in the footnote. To better illustrate, consider scenario 1 where drift is defined as (A) Abrupt, (H) High, (R) Recurrent, and (PH) Periodical High, for the speed, severity, recurrence, and frequency descriptors, respectively. In this scenario, there are 39 drifts, all with a speed set to 1 and occurring every 250 instances. Note that, to reduce space, each line represents two scenarios. The results obtained in our two series of experiments are discussed in Section 5.3 and Section 5.4.

5.1. Datasets

Real-world datasets have significant limitations when it comes to concept drift, particularly due to the difficulty of accurately identifying the location of drifts or confirming their existence. Additionally, only a few well-known datasets include verified concept drifts [58,59]. Approaches such as injecting drifts into real-world datasets are often restricted to modifying the speed descriptor [60], which falls short of the objectives of this study, as it explores more complex descriptors such as speed, severity, frequency, and recurrence.
To overcome these limitations, synthetic datasets were employed in this paper because they allow the simulation of different types of drift by modifying instances, making it possible to understand how the descriptors impact drift. In this work, 32 variations were generated for each of the five synthetic datasets provided in [12]: Line, Hyperplane, SineH, SineV, and Circle. Each dataset represents a binary classification problem with 10,000 balanced instances, without noise, and with two features, except for the Hyperplane dataset, which contains three features.
The Line and Hyperplane datasets are defined by Σ i = 1 d a i x i a 0 , where d = 1 and d = 2 for Line and Hyperplane, respectively. In our experiments, we varied the a 0 values. SineH and SineV are defined by y = a s i n ( b x ) + c . We varied the value of b in SineH, affecting the horizontal axis, and the value of c in SineV, affecting the vertical axis. Finally, the Circle dataset is defined by ( x a ) 2 + ( y b ) 2 = r 2 , whose r values were varied. Table 5 summarizes the descriptors of the 32 generated scenarios for each dataset.
Additionally, for each synthetic dataset, specific parameters were adjusted to simulate different types of concept drift. For example, in the Line dataset, high-severity drifts were created by shifting the value of a 0 by 0.70 for each concept, while for low-severity drifts, the values were shifted by 0.15 . Similarly, in Circle, high-severity drifts were created by shifting the radius parameter (r) by 0.30 for each new concept, while for low-severity drifts, the value was shifted by 0.10 .
In all datasets, recurrence was simulated by repeating the concepts from the middle of the known drifts. The frequencies of concept drift were simulated by adjusting the intervals between their occurrences. For instance, in high-frequency scenarios, a drift occurs every 250 instances, whereas in low-frequency scenarios, they occur every 3000 instances. Lastly, abrupt drifts were simulated by replacing the current concept with a new one after a single instance, while gradual drifts were simulated by progressive replacement of concepts over 250 instances. Table A1 provides a detailed summary of parameter adjustments used to represent the descriptor variations in each dataset.

5.2. Drift Detectors

The analysis presented in this paper encompasses supervised, semi-supervised, and unsupervised environments, considering two detectors for each type of environment, which represents a distinction from [35], which is limited to the supervised setting. The detectors used are briefly discussed below.
In supervised environments, one of the most recognized drift detectors is the Drift Detection Method (DDM), introduced in [16]. This method monitors changes in the classifier’s error rate, following the Probably Approximately Correct (PAC) learning model, which suggests that a significant increase in error rate could signal concept drift. The authors highlight that DDM performs better in detecting abrupt drift. To enhance its effectiveness for gradual drift, the Early Drift Detection Method (EDDM) was proposed in [17], based on DDM. Rather than tracking error rate directly, EDDM monitors the interval between consecutive errors. A reduction in this interval may indicate concept drift, while a stable interval suggests a stationary environment.
In the semi-supervised environment, we employ the method proposed in [23], named Dynamic Selection Drift Detector (DSDD), which performs dynamic classifier selection from an initial ensemble of classifiers and uses a configurable auxiliary drift detector guided by a pseudo-error rate as metric to detect drifts. DSDD has three modules: (a) ensemble creation; (b) dynamic selection; and (c) drift detection. The first module creates an ensemble of high diversity classifiers, and the second selects the most competent classifier to label unknown instances. The third module monitors the pseudo-error to detect drifts, using detectors such as DDM and EDDM. In turn, MD3-EGM [19] uses an ensemble of classifiers to form a generic margin between classes, based on the disagreement between classifiers when labeling instances. This ensemble is created using random subspaces of the original feature space to train n classifiers. Drift detection occurs by monitoring the diversity among classifiers, indicating concept drift when there is an increase in disagreement in class assignments for unknown samples within the detection window.
Finally, in the unsupervised environment, we use the Drift Detection Method Based on Active Learning (DDAL) proposed in [54]. DDAL is based on the hypothesis that variations in the density of the most significant instances may signal drift. In this way, it is structured into two phases: the first phase generates a classifier using instances within a reference window, while the second phase is divided into three modules: drift detection, reaction, and classification. In this second phase, DDAL continuously monitors concept drift in each new batch of unlabeled data and, based on the drift detection results, triggers the reaction and classification modules as needed. The second unsupervised drift detection method used is the Student–Teacher approach for Unsupervised Drift Detection (STUDD), proposed in [55]. STUDD is structured in two phases. In the offline phase, a teacher model is trained, and its predictions are used to train a student model, which learns to mimic the teacher. In the online phase, the discrepancy between the student and teacher predictions serves as a drift detection metric, using a detector such as the Page-Hinkley test. When drift is detected, the model adapts through retraining with recent observations, allowing the student to adjust to the new concept.

5.3. First Series of Experiments

The results of the first series of experiments are summarized in Figure 8. It is worth noting that the DDM-O, EDDM-O, and ND scenarios are not represented in this figure due to the following reasons: detection is perfect (oracle) in the first two; and there is no detection in the last one.
When considering supervised detectors, DDM and EDDM provided the lowest delay rates. However, DDM reached lost detection rates mostly higher than 60 % , as well as a high percentage of false detections, with some exceptions. In terms of EDDM, the percentage of lost detection does not follow an explicit pattern and depends on the scenario, while the false detection rate is usually lower than 50 % . In the unsupervised scenarios, surprisingly, DDAL and STUDD did not detect drift. Consequently, the percentages of false and delayed detections were zero, while lost detection was maximum. The performance of unsupervised detectors was, therefore, similar to the no-detection scenario. Finally, the two semi-supervised methods showed divergent results when compared to each other. On the one hand, MD3-EGM and DSDD had opposite lost detection performances. On the other, MD3-EGM achieved a lower delay detection rate, while DSDD reached a lower false detection rate.
The direct comparison among the six detectors indicates an order relation between them. DDM and EDDM performed the best, followed by DSDD and MD3-EGM. The worst were the unsupervised methods, since they did not detect any drift. This poor performance may be due to the values of the models’ hyperparameters. The success of unsupervised methods typically depends on fine-tuning several hyperparameters. However, in our experiments, the default values of the methods were used, without fine-tuning.
When analyzing the medians of the base classifier prequencial error in each context, shown in Figure 9, DDM and MD3-EGM presented the worst performance, as indicated by their highest medians of prequential error in all datasets. Moreover, DDM-O also achieved a high error rate in the Circle dataset. The opposite results are observed for EDDM, which achieved the lowest median of error across all scenarios. This result is consistent with the false detection and delay rates obtained by EDDM (Figure 8).
It is also important to compare the supervised detectors to their oracle versions in terms of prequential error. DDM-O outperformed DDM, except for on the Circle dataset. In turn, surprisingly, EDDM provided better or equal performance compared to EDDM-O. Finally, considering the context without detection, its performance was similar to those of the other contexts. This suggests that the best way to react to drift is not always to retrain the models. This observation is reinforced when we consider unsupervised methods, whose performances are similar to those observed in scenarios with no drift detection.

5.4. Second Series of Experiments

The results of this series of experiments are summarized in Table 6 and Figure 10 and Figure 11. The aim is to compare the values of the descriptors to identify those with more influence on concept drift, considering all scenarios and datasets investigated. Figure 10 illustrates this comparison between supervised detectors and their oracle versions, while Figure 11 shows the other detectors.
Table 6 reports the prequential error median obtained when varying the values of the descriptors. Values in bold indicate the descriptor value that generated the best median of prequential error. Underlined values indicate significant statistical differences between prequential error medians obtained by different descriptors values according to a statistical test. The smaller the median of prequential error value obtained by a descriptor, the easier it is to handle concept drift in the scenario generated by that descriptor value. From this table, some observations can be made:
  • For the speed descriptor, the gradual value achieved the best performance in all contexts, except for EDDM. This exception may be associated with the fact that EDDM was proposed to handle abrupt drifts. However, there was no context with significant difference between abrupt or gradual, suggesting that speed has little impact on drift.
  • The severity descriptor showed opposite behavior, as low severity drifts generated better performances in all contexts. The statistical test pointed out significant differences in all contexts, except for EDDM. This result may be interpreted as a robust indication that severity has a strong impact on drift.
  • In terms of recurrence, non-recurrent scenarios provided better performances, except for DDM-O. The statistical test pointed out significant differences in four out of nine contexts, indicating that recurrence has a limited impact on drift, being relevant in specific situations.
  • A similar situation was observed considering frequency. In this case, better results were generally associated with scenarios of low frequency. The statistical test pointed out significant differences in five out of nine contexts. All significant differences were obtained in scenarios with low frequency, suggesting that drifts with low frequency generally have a positive impact on the detection performance. However, occasional influences from other descriptors may minimize the impact of the frequency descriptor.
Finally, based on the results presented in Table 6 and in Figure 10 and Figure 11, Table 7 summarizes the combinations of descriptor values that lead to the best performances, as well as those that lead to the worst performances when handling concept drift. For instance, among the nine contexts, the best results were obtained in eight contexts when the speed value was gradual.

6. Conclusions and Future Work

In this study we analyzed the impact of four concept drift descriptors on the performance of base classifiers and drift detectors, intending to identify the most relevant descriptors for the drift reaction process. The experiments were conducted on five different datasets with 32 variations in descriptor values, eight different detectors, and a context without detection, totaling 1440 different combinations tested. The results indicated that concept drifts characterized by low speed, low severity, non-recurrence, and low periodicity generated smaller impacts on classifier performance. On the other hand, drifts with high speed (abrupt), high severity, recurrence, and high periodicity generated a higher impact on classifier performance.
Our first conclusion is that the reaction to concept drift cannot be uniform for all types of drift. Instead, it must consider the specific characteristics of each drift and, in some cases, it may be argued that the best response is simply not to react. When detailing the results shown in Table 7, it was observed that speed, severity and recurrence presented well-defined values for the scenarios with better and worse performances, while frequency showed much less defined behavior. This suggests that the first three descriptors have the strongest influence on drift. However, by combining these results with those in Table 6, it is observed that only the results of severity predominantly show significant differences, followed by frequency and recurrence.
The second conclusion is that severity, recurrence, and frequency provide, respectively, and in descending order, the strongest impacts on concept drift. It is worth noting that the isolated impact of severity appears to be higher than that of the other descriptors. Speed does not appear to have an impact on drift. Therefore, any reaction strategy must consider the descriptors with the strongest impact. Finally, our third conclusion is that there is a need to incorporate mechanisms allowing describing concept drift into the process designed to handle such a phenomenon. This mechanism can be executed concurrently with the detection process. Moreover, the properties provided by the description mechanism should be used to determine the more effective reaction strategy to be used.
Based on the aforementioned conclusions, we suggest that future research should address the analysis of the mutual impact of descriptors on concept drift, as well as delve deeper into the analysis of relationships between descriptors, develop mechanisms to characterize drift in terms of these descriptors, analyze the impacts of concept drift on deep learning models, and investigate how and if these impacts differ from those observed in shallow models. We also intend to investigate how the specific characteristics of real-world problems can impact the influence of descriptors on reaction strategies, and design detectors that consider the characteristics of drift.

Author Contributions

Conceptualization, A.C., R.G. and E.M.d.S.; Methodologies, A.C., R.G. and E.M.d.S., Formal analysis, A.C.; Investigation, A.C.; Software, A.C.; Writin—Original Draft, A.C., Writing—Review and Editing, A.C., R.G. and E.M.d.S.; Visualization, A.C., R.G. and E.M.d.S. All authors have read and agreed to the published version of the manuscript.

Funding

This study was financed in part by the Coordenação de Aperfeiçoamento de Pessoal de Nível Superior—Brasil (CAPES-PROEX)—Finance Code 001. This work was partially supported by Amazonas State Research Support Foundation—FAPEAM—through the POSGRAD project 2024/2025.

Institutional Review Board Statement

Not applicable.

Informed Consent Statement

Not applicable.

Data Availability Statement

The original data presented in the study are openly available at https://github.com/albertfrancajosuacosta/Dataset---Analysis-of-descriptors-of-concept-drift-and-their-impacts, accessed on 29 January 2025.

Conflicts of Interest

The authors declare no conflicts of interest.

Appendix A. Values of Parameters in Datasets

Table A1. Values of parameters in Line, Hyperplane, Circle, SineH, and Sine datasets by scenario.
ScenarioLine Hyperplane Circle
a 1 a 0 a 1 a 2 a 0 abr
StartEndStep StartEndStep StartEndStep
1 | 17 0.10 0.10 13.40 0.70 0.10 0.10 0.70 71.00 3.70 0.50 0.50 0.20 5.90 0.30
2 | 18 0.10 0.10 2.90 0.70 0.10 0.10 0.70 15.50 3.70 0.50 0.50 0.20 1.40 0.30
3 | 19 0.10 0.10 0.80 0.70 0.10 0.10 0.70 11.80 3.70 0.50 0.50 0.20 0.50 0.30
4 | 20 0.10 0.10 2.90 0.70 0.10 0.10 0.70 15.50 3.70 0.50 0.50 0.20 1.40 0.30
5 | 21 0.10 0.10 27.40 0.70 0.10 0.10 0.70 145.00 3.70 0.50 0.50 0.20 11.90 0.30
6 | 22 0.10 0.10 6.40 0.70 0.10 0.10 0.70 34.00 3.70 0.50 0.50 0.20 2.90 0.30
7 | 23 0.10 0.10 2.20 0.70 0.10 0.10 0.70 11.80 3.70 0.50 0.50 0.20 1.10 0.30
8 | 24 0.10 0.10 6.40 0.70 0.10 0.10 0.70 34.00 3.70 0.50 0.50 0.20 2.90 0.30
9 | 25 0.10 0.10 3.25 0.15 0.10 0.10 2.00 15.30 0.70 0.50 0.50 0.20 2.10 0.10
10 | 26 0.10 0.40 1.0 0.15 0.10 0.10 2.00 4.80 0.70 0.50 0.50 0.20 0.60 0.10
11 | 27 0.10 0.40 0.55 0.15 0.10 0.10 2.00 2.70 0.70 0.50 0.50 0.20 0.30 0.10
12 | 28 0.10 0.10 2.00 4.80 0.10 0.10 2.00 4.80 0.70 0.50 0.50 0.20 0.60 0.10
13 | 29 0.10 0.40 6.25 0.15 0.10 0.10 2.00 29.30 0.70 0.50 0.50 0.20 4.10 0.10
14 | 30 0.10 0.10 2.00 8.30 0.10 0.10 2.00 8.30 0.70 0.50 0.50 0.20 1.10 0.10
15 | 31 0.10 0.10 2.00 4.10 0.10 0.10 2.00 4.10 0.70 0.50 0.50 0.20 1.10 0.10
16 | 32 0.10 0.40 1.75 0.15 0.10 0.10 2.00 8.30 0.70 0.50 0.50 0.20 0.50 0.10
ScenarioSineH SineV
acb abc
StartEndStep StartEndStep
1 | 17 5.00 5.00 0.00 59.66 3.14 1.00 1.00 8.00 277.0 15.00
2 | 18 5.00 5.00 0.00 12.56 3.14 1.00 1.00 8.00 52.00 15.00
3 | 19 5.00 5.00 0.00 3.14 3.14 1.00 1.00 8.00 7.00 15.00
4 | 20 5.00 5.00 0.00 12.56 3.14 1.00 1.00 8.00 52.00 15.00
5 | 21 5.00 5.00 0.00 122.46 3.14 1.00 1.00 8.00 577.00 15.00
6 | 22 5.00 5.00 0.00 28.26 3.14 1.00 1.00 8.00 127.00 15.00
7 | 23 5.00 5.00 0.00 9.42 3.14 1.00 1.00 8.00 37.00 15.00
8 | 24 5.00 5.00 0.00 28.26 3.14 1.00 1.00 8.00 127.00 15.00
9 | 25 5.00 5.00 0.00 14.82 0.78 1.00 1.00 2.00 55.00 3.00
10 | 26 5.00 5.00 0.00 3.12 0.78 1.00 1.00 2.00 10.00 3.00
11 | 27 5.00 5.00 0.00 0.78 0.78 1.00 1.00 2.00 1.00 3.00
12 | 28 5.00 5.00 0.00 0.78 3.14 1.00 1.00 2.00 10.00 3.00
13 | 29 5.00 5.00 0.00 30.42 0.78 1.00 1.00 2.00 115.00 3.00
14 | 30 5.00 5.00 0.00 7.02 0.78 1.00 1.00 2.00 25.00 3.00
15 | 31 5.00 5.00 0.00 2.34 0.78 1.00 1.00 2.00 7.00 3.00
16 | 32 5.00 5.00 0.00 7.02 0.78 1.00 1.00 2.00 25.00 3.00

References

  1. Gemaque, R.N.; Costa, A.F.J.; Giusti, R.; dos Santos, E.M. An overview of unsupervised drift detection methods. WIREs Data Min. Knowl. Discov. 2020, 10, e1381. [Google Scholar] [CrossRef]
  2. Hinder, F.; Kummert, J.; Hammer, B. Explaining Concept Drift by Mean of Direction. In Proceedings of the Artificial Neural Networks and Machine Learning—ICANN, Bratislava, Slovakia, 15–18 September 2020; Farkaš, I., Masulli, P., Wermter, S., Eds.; Springer: Cham, Switzerland, 2020; pp. 379–390. [Google Scholar]
  3. Gama, J.; Žliobaitė, I.; Bifet, A.; Pechenizkiy, M.; Bouchachia, A. A Survey on Concept Drift Adaptation. ACM Comput. Surv. 2014, 46, 1–37. [Google Scholar] [CrossRef]
  4. Guo, H.; Li, H.; Ren, Q.; Wang, W. Concept drift type identification based on multi-sliding windows. Inf. Sci. 2022, 585, 1–23. [Google Scholar] [CrossRef]
  5. Lu, J.; Liu, A.; Dong, F.; Gu, F.; Gama, J.; Zhang, G. Learning under Concept Drift: A Review. IEEE Trans. Knowl. Data Eng. 2019, 31, 2346–2363. [Google Scholar] [CrossRef]
  6. Bayram, F.; Ahmed, B.S.; Kassler, A. From concept drift to model degradation: An overview on performance-aware drift detectors. Knowl.-Based Syst. 2022, 245, 108632. [Google Scholar] [CrossRef]
  7. Castellani, A.; Schmitt, S.; Hammer, B. Task-Sensitive Concept Drift Detector with Constraint Embedding. In Proceedings of the 2021 IEEE Symposium Series on Computational Intelligence (SSCI), Virtual, 5–7 December 2021; pp. 1–8. [Google Scholar] [CrossRef]
  8. Iwashita, A.S.; Papa, J.P. An Overview on Concept Drift Learning. IEEE Access 2019, 7, 1532–1547. [Google Scholar] [CrossRef]
  9. Yan, M.M.W. Accurate detecting concept drift in evolving data streams. ICT Express 2020, 6, 332–338. [Google Scholar] [CrossRef]
  10. Fahy, C.; Yang, S.; Gongora, M. Scarcity of Labels in Non-Stationary Data Streams: A Survey. ACM Comput. Surv. (CSUR) 2022, 55, 1–39. [Google Scholar] [CrossRef]
  11. Tan, C.H.; Lee, V.C.; Salehi, M. Information resources estimation for accurate distribution-based concept drift detection. Inf. Process. e Manag. 2022, 59, 102911. [Google Scholar] [CrossRef]
  12. Minku, L.L.; White, A.P.; Yao, X. The Impact of Diversity on Online Ensemble Learning in the Presence of Concept Drift. IEEE Trans. Knowl. Data Eng. 2010, 22, 730–742. [Google Scholar] [CrossRef]
  13. Sayed Mouchaweh, M. Learning from Data Streams in Dynamic Environments; SpringerBriefs in applied sciences and technology; Springer International Publishing: Cham, Switzerland, 2016. [Google Scholar] [CrossRef]
  14. Khamassi, I.; Sayed-Mouchaweh, M.; Hammami, M.; Ghédira, K. Discussion and review on evolving data streams and concept drift adapting. Evol. Syst. 2018, 9, 1–23. [Google Scholar] [CrossRef]
  15. Widmer, G.; Kubat, M. Learning in the presence of concept drift and hidden contexts. Mach. Learn. 1996, 23, 69–101. [Google Scholar] [CrossRef]
  16. Gama, J.; Medas, P.; Castillo, G.; Rodrigues, P. Learning with Drift Detection. In Proceedings of the Advances in Artificial Intelligence–SBIA, Sao Luis, Maranhao, Brazil, 29 September–1 October 2004; Bazzan, A.L.C., Labidi, S., Eds.; Springer: Berlin/Heidelberg, Germany, 2004; pp. 286–295. [Google Scholar]
  17. Baena-García, M.; Campo-Ávila, J.; Fidalgo-Merino, R.; Bifet, A.; Gavald, R.; Morales-Bueno, R. Early Drift Detection Method 2006. In Proceedings of the ECML PKDD 2006 Workshop on Knowledge Discovery from Data Streams, Philadelphia, PA, USA, 20 August 2006; pp. 77–86. [Google Scholar]
  18. Bifet, A.; Gavaldà, R. Learning from Time-Changing Data with Adaptive Windowing. In Proceedings of the 2007 SIAM International Conference on Data Mining, Minneapolis, MN, USA, 26–28 April 2007; Volume 7. [Google Scholar] [CrossRef]
  19. Sethi, T.S.; Kantardzic, M. On the Reliable Detection of Concept Drift from Streaming Unlabeled Data. Expert Syst. Appl. 2017, 82, 77–99. [Google Scholar] [CrossRef]
  20. dos Reis, D.M.; Flach, P.; Matwin, S.; Batista, G. Fast Unsupervised Online Drift Detection Using Incremental Kolmogorov-Smirnov Test. In Proceedings of the 22nd ACM SIGKDD International Conference on Knowledge Discovery and Data Mining, KDD ’16, New York, NY, USA, 13–17 August 2016; pp. 1545–1554. [Google Scholar] [CrossRef]
  21. de Mello, R.F.; Vaz, Y.; Grossi, C.H.; Bifet, A. On learning guarantees to unsupervised concept drift detection on data streams. Expert Syst. Appl. 2019, 117, 90–102. [Google Scholar] [CrossRef]
  22. Sethi, T.S.; Kantardzic, M. Don’t Pay for Validation: Detecting Drifts from Unlabeled data Using Margin Density. Procedia Comput. Sci. 2015, 53, 103–112. [Google Scholar] [CrossRef]
  23. Pinagé, F.; dos Santos, E.M.; Gama, J. A drift detection method based on dynamic classifier selection. Data Min. Knowl. Discov. 2020, 34, 50–74. [Google Scholar] [CrossRef]
  24. Hinder, F.; Vaquet, V.; Hammer, B. One or two things we know about concept drift—A survey on monitoring in evolving environments. Part A: Detecting concept drift. Front. Artif. Intell. 2024, 7, 1330257. [Google Scholar] [CrossRef] [PubMed]
  25. Webb, G.I.; Hyde, R.; Cao, H.; Nguyen, H.L.; Petitjean, F. Characterizing concept drift. Data Min. Knowl. Discov. 2016, 30, 964–994. [Google Scholar] [CrossRef]
  26. Korycki, L.; Krawczyk, B. Concept Drift Detection from Multi-Class Imbalanced Data Streams. In Proceedings of the 2021 IEEE 37th International Conference on Data Engineering (ICDE), Chania, Greece, 19–22 April 2021; pp. 1068–1079. [Google Scholar] [CrossRef]
  27. Narasimhamurthy, A.; Kuncheva, L.I. A Framework for Generating Data to Simulate Changing Environments. In Proceedings of the 25th Conference on IASTED International Multi-Conference, AIAP’07, Artificial Intelligence and Applications, Innsbruck, Austria, 12–14 February 2007; pp. 384–389. [Google Scholar]
  28. Dasu, T.; Krishnan, S.; Venkatasubramanian, S.; Yi, K. An information-theoretic approach to detecting changes in multi-dimensional data streams. In Proceedings of the Symposium on the Interface of Statistics, Computing Science, and Applications, Pasadena, CA, USA, 24–27 May 2006. [Google Scholar]
  29. Kullback, S.; Leibler, R.A. On Information and Sufficiency. Ann. Math. Stat. 1951, 22, 79–86. [Google Scholar] [CrossRef]
  30. Hinder, F.; Hammer, B. Concept Drift Segmentation via Kolmogorov-Trees. In Proceedings of the 29th European Symposium on Artificial Neural Networks, Computational Intelligence and Machine Learning, ESANN 2021, Online Event, Bruges, Belgium, 6–8 October 2021. [Google Scholar] [CrossRef]
  31. Lopes, R.H.C. Kolmogorov-Smirnov Test. In International Encyclopedia of Statistical Science; Springer: Berlin/Heidelberg, Germany, 2011; pp. 718–720. [Google Scholar]
  32. Mballo, C.; Diday, E. Kolmogorov-Smirnov for Decision Trees on Interval and Histogram Variables. In Proceedings of the Classification, Clustering, and Data Mining Applications, Chicago, IL, USA, 15–18 July 2004; Banks, D., McMorris, F.R., Arabie, P., Gaul, W., Eds.; Springer: Berlin/Heidelberg, Germany, 2004; pp. 341–350. [Google Scholar]
  33. Dong, F.; Lu, J.; Li, K.; Zhang, G. Concept drift region identification via competence-based discrepancy distribution estimation. In Proceedings of the 2017 12th International Conference on Intelligent Systems and Knowledge Engineering (ISKE), Nanjing, China, 24–26 November 2017; pp. 1–7. [Google Scholar] [CrossRef]
  34. Dong, F.; Lu, J.; Song, Y.; Liu, F.; Zhang, G. A Drift Region-Based Data Sample Filtering Method. IEEE Trans. Cybern. 2021, 52, 9377–9390. [Google Scholar] [CrossRef]
  35. Aguiar, G.J.; Cano, A. A comprehensive analysis of concept drift locality in data streams. Knowl.-Based Syst. 2024, 289, 111535. [Google Scholar] [CrossRef]
  36. Hammer, B.; Vaquet, V.; Hinder, F. One or two things we know about concept drift—A survey on monitoring in evolving environments. Part B: Locating and explaining concept drift. Front. Artif. Intell. 2024, 7, 1330258. [Google Scholar] [CrossRef]
  37. Liu, A.; Song, Y.; Zhang, G.; Lu, J. Regional Concept Drift Detection and Density Synchronized Drift Adaptation. In Proceedings of the Twenty-Sixth International Joint Conference on Artificial Intelligence, IJCAI-17, Melbourne, Australia, 19–25 August 2017; pp. 2280–2286. [Google Scholar] [CrossRef]
  38. Agrahari, S.; Singh, A.K. Disposition-Based Concept Drift Detection and Adaptation in Data Stream. Arab. J. Sci. Eng. 2022, 47, 10605–10621. [Google Scholar] [CrossRef]
  39. Mattos, J.G.; Silva, T.; Lopes, H.; Bordignon, A.L. Interpretable Concept Drift. In Proceedings of the Progress in Pattern Recognition, Image Analysis, Computer Vision, and Applications, Porto, Portugal, 10–13 May 2021; Tavares, J.M.R.S., Papa, J.P., González Hidalgo, M., Eds.; Springer: Cham, Switzerland, 2021; pp. 271–280. [Google Scholar]
  40. Wang, P.; Yu, H.; Jin, N.; Davies, D.; Woo, W.L. QuadCDD: A Quadruple-based Approach for Understanding Concept Drift in Data Streams. Expert Syst. Appl. 2024, 238, 122114. [Google Scholar] [CrossRef]
  41. Hovakimyan, G.; Bravo, J.M. Evolving Strategies in Machine Learning: A Systematic Review of Concept Drift Detection. Information 2024, 15, 786. [Google Scholar] [CrossRef]
  42. Agrahari, S.; Singh, A.K. Concept Drift Detection in Data Stream Mining: A literature review. J. King Saud-Univ. -Comput. Inf. Sci. 2022, 34, 9523–9540. [Google Scholar] [CrossRef]
  43. Suárez-Cetrulo, A.L.; Quintana, D.; Cervantes, A. A survey on machine learning for recurring concept drifting data streams. Expert Syst. Appl. 2023, 213, 118934. [Google Scholar] [CrossRef]
  44. Klaiber, M.; Rössle, M.; Theissler, A. The 10 most popular Concept Drift Algorithms: An overview and optimization potentials. Procedia Comput. Sci. 2023, 225, 1261–1271. [Google Scholar] [CrossRef]
  45. Xiang, Q.; Zi, L.; Cong, X.; Wang, Y. Concept Drift Adaptation Methods under the Deep Learning Framework: A Literature Review. Appl. Sci. 2023, 13, 6515. [Google Scholar] [CrossRef]
  46. Jourdan, N.; Bayer, T.; Biegel, T.; Metternich, J. Handling concept drift in deep learning applications for process monitoring. Procedia CIRP 2023, 120, 33–38. [Google Scholar] [CrossRef]
  47. Priya, S.; Uthra, R.A. Deep learning framework for handling concept drift and class imbalanced complex decision-making on streaming data. Complex Intell. Syst. 2023, 9, 3499–3515. [Google Scholar] [CrossRef]
  48. Farrugia, D.; Zerafa, C.; Cini, T.; Kuasney, B.; Livori, K. A Real-Time Prescriptive Solution for Explainable Cyber-Fraud Detection Within the iGaming Industry. SN Comput. Sci. 2021, 2, 215. [Google Scholar] [CrossRef] [PubMed]
  49. Shamitha, S.K.; Ilango, V. Importance of Self-Learning Algorithms for Fraud Detection Under Concept Drift. In Proceedings of the International Conference on Artificial Intelligence and Sustainable Engineering; Sanyal, G., Travieso-González, C.M., Awasthi, S., Pinto, C.M., Purushothama, B.R., Eds.; Springer: Singapore, 2022; pp. 343–354. [Google Scholar]
  50. Rotalinti, Y.; Tucker, A.; Lonergan, M.; Myles, P.; Branson, R. Detecting Drift in Healthcare AI Models Based on Data Availability. In Proceedings of the Machine Learning and Principles and Practice of Knowledge Discovery in Databases, Grenoble, France, 19–23 September 2022; Koprinska, I., Mignone, P., Guidotti, R., Jaroszewicz, S., Fröning, H., Gullo, F., Ferreira, P.M., Roqueiro, D., Ceddia, G., Nowaczyk, S., et al., Eds.; Springer: Cham, Switzerland, 2023; pp. 243–258. [Google Scholar]
  51. Rios, R.A.; Rios, T.N.; Melo, R.; de Santana, E.S.; Carneiro, T.M.S.; Junior, A.D.O. Applying Concept Drift to Understand Hepatitis Evolution in Brazil. Cybern. Syst. 2020, 51, 631–645. [Google Scholar] [CrossRef]
  52. Kore, A.; Abbasi Bavil, E.; Subasri, V.; Abdalla, M.; Fine, B.; Dolatabadi, E.; Abdalla, M. Empirical data drift detection experiments on real-world medical imaging data. Nat. Commun. 2024, 15, 1887. [Google Scholar] [CrossRef]
  53. Susnjak, T.; Maddigan, P. Forecasting patient flows with pandemic induced concept drift using explainable machine learning. EPJ Data Sci. 2023, 12, 11. [Google Scholar] [CrossRef] [PubMed]
  54. Costa, A.F.J.; Albuquerque, R.A.S.; Santos, E.M.d. A Drift Detection Method Based on Active Learning. In Proceedings of the 2018 International Joint Conference on Neural Networks (IJCNN), Rio de Janeiro, Brazil, 8–13 July 2018; pp. 1–8. [Google Scholar] [CrossRef]
  55. Cerqueira, V.; Gomes, H.M.; Bifet, A.; Torgo, L. STUDD: A student–teacher method for unsupervised concept drift detection. Mach. Learn. 2022, 112, 4351–4378. [Google Scholar] [CrossRef]
  56. Mann, H.B.; Whitney, D.R. On a Test of Whether one of Two Random Variables is Stochastically Larger than the Other. Ann. Math. Stat. 1947, 18, 50–60. [Google Scholar] [CrossRef]
  57. Friedman, M. The Use of Ranks to Avoid the Assumption of Normality Implicit in the Analysis of Variance. J. Am. Stat. Assoc. 1937, 32, 675–701. [Google Scholar] [CrossRef]
  58. Souza, V.M.A.; dos Reis, D.M.; Maletzke, A.G.; Batista, G.E.A.P.A. Challenges in benchmarking stream learning algorithms with real-world data. Data Min. Knowl. Discov. 2020, 34, 1805–1858. [Google Scholar] [CrossRef]
  59. Komorniczak, J.; Ksieniewicz, P. On metafeatures’ ability of implicit concept identification. Mach. Learn. 2024, 113, 7931–7966. [Google Scholar] [CrossRef]
  60. Stevanoski, B.; Kostovska, A.; Panov, P.; Džeroski, S. Change detection and adaptation in multi-target regression on data streams. Mach. Learn. 2024, 113, 8585–8622. [Google Scholar] [CrossRef]
Figure 1. Taxonomy of concept drift in the perspective of its descriptors.
Informatics 12 00013 g001
Figure 2. 
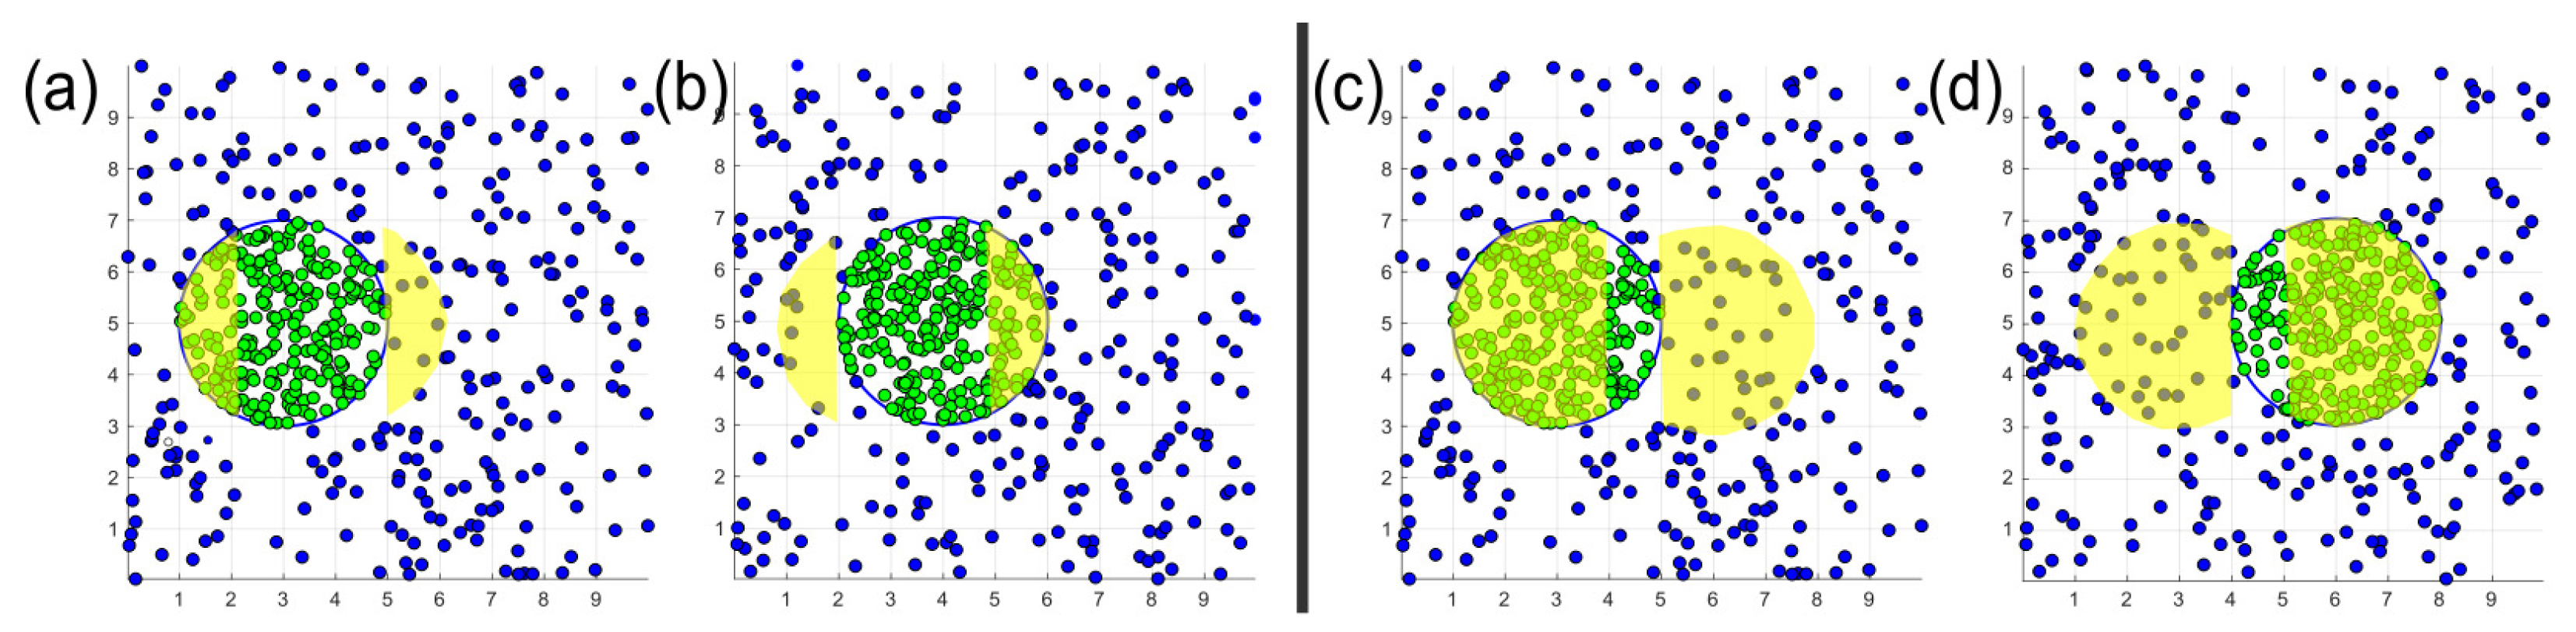
The left side represents a low-severity concept drift: yellow areas in (a,b) indicate regions that should be forgotten and learned, respectively, after the drift. The right side represents a high-severity concept drift: yellow areas in (c,d) indicate regions that should be forgotten and learned, respectively, after the drift.
Informatics 12 00013 g002
Figure 3. Example of the influence zone descriptor: (a) the decision boundary is defined by x 1 = 8 and x 2 = 8 . (b) After the drift, the decision boundary is shifted to x 1 = 9 and x 2 = 9 . (c) The displacement of the decision boundary results in a region of conflict between concepts delimited by 8 x 1 + x 2 < 9 .
Informatics 12 00013 g003
Figure 4. 
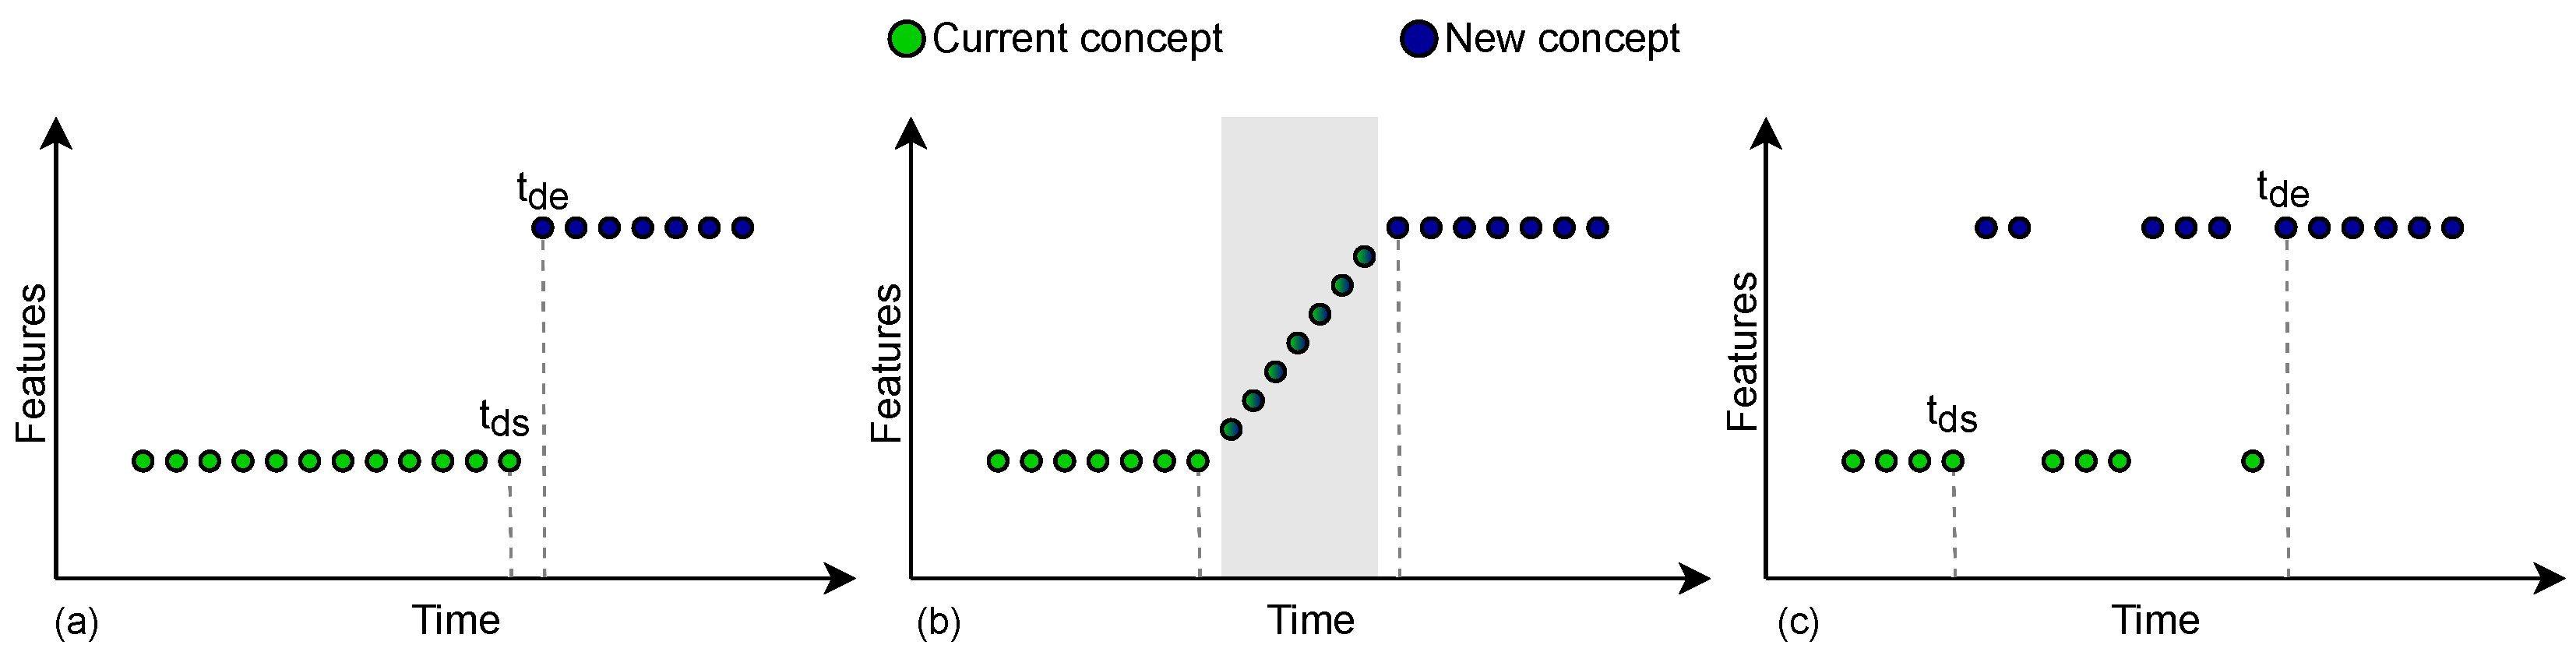
(a) An abrupt drift occurs when the current concept C i , which ends at t d s , is replaced by a new concept C j . (b) An incremental gradual drift is a slow transformation of the current concept into the new concept, with a transition period of length n, during which instances of both concepts no longer coexist, producing n intermediary concepts. (c) A probability gradual drift is a slow transformation between concepts where instances of both concepts coexist; the probability of the current concept gradually decreases to 0, while the probability of the new concept concurrently increases to 1.
Informatics 12 00013 g004
Figure 5. (a) Two examples of drift with non-periodic frequency. The first, between the yellow and green concepts, has frequency 1 4 . The second drift has 1 5 of frequency (green and pink concepts), where i < j < k < l . (b) Recurrent cyclical drift, where f 1 and f 2 represent the frequencies of concepts 1 and 2, respectively. (c) Recurrent acyclic drift, where f 1 and f 2 represent the frequencies of concepts 1 and 2, respectively.
Informatics 12 00013 g005
Figure 6. (a) Relationship between severity and frequency with dissimilarity between concepts in time tuples ( t i ; t j ) and ( t k ; t l ). (b) Four states result from the relationship between these descriptors.
Informatics 12 00013 g006
Figure 7. Experiment overview.
Informatics 12 00013 g007
Figure 8. Performance metrics of drift detectors in scenarios by context. The horizontal axis of each heatmap represents the scenarios. The vertical axis represents the datasets Circle (C), Line (L), Hyperplane (H), SineV (SV), and SineH (SH).
Informatics 12 00013 g008
Figure 9. Values of the medians of prequential error across all datasets.
Informatics 12 00013 g009
Figure 10. Variation in prequential error median on all scenarios investigated by varying the value of each descriptor considering supervised detectors. Speed: (A) Abrupt; (G) Gradual. Severity: (H) High; (L) Low. Recurrence: (R) Recurrent; (NR) Not Recurrent. Frequency: (PH) Periodical High; (PM) Periodical Middle; (PL) Periodical Low; (NP) Not Periodical.
Informatics 12 00013 g010
Figure 11. Variation in prequential error median on scenarios investigated by varying the value of each descriptor considering the semi-supervised and unsupervised detectors. Speed: (A) Abrupt; (G) Gradual. Severity: (H) High; (L) Low. Recurrence: (R) Recurrent; (NR) Not Recurrent. Frequency: (PH) Periodical High; (PM) Periodical Middle; (PL) Periodical Low; (NP) Not Periodical.
Informatics 12 00013 g011
Table 1. A comparison of related work in terms of evaluated descriptors.
WorkDescriptorsGroup
SPSVIZFQRRPD
Guo et al. (2022) [4] 1
Dasu et al. (2006) [28]
Hinder and Hammer (2021) [30]
Dong et al. (2017) [33]
Dong et al. (2021) [34]
Agrahari and Singh (2022) [38]
Mattos et al. (2021) [39]
Hinder et al. (2020) [2] 2
Aguiar and Cano (2024) [35]
Hammer et al. (2024) [36]
Wang et al. (2024) [40]
This work
Table 2. Summary of the relationships between descriptors that affect base classifier and detector performance.
Group 1 Impact on the performance of the base classifier and the detector
DescriptorDescriptorImpact
SeverityFrequency
HighLowHigh
HighHighHigh
LowHighHigh
LowLowLow
SeverityInfluence ZoneImpact
HighGlobalHigh
HighLocalHigh 1/Low 2
LowLocalLow
1 If concept drift affects the decision boundary. 2 If concept drift does not affect the decision boundary.
Table 3. Summary of relationships between descriptors that affect the behavior of descriptors.
Group 2 Impact on the behavior of descriptors
DescriptorDescriptor
FrequencySpeed
↑ (Increases)↑ (Increases)
↓ (Decreases)↓ (Decreases)
RecurrenceFrequency
YesMajority 1
1 The majority parts of recurrent drifts are also periodic [12].
Table 4. Summary of relationships between descriptors that affect the predictability of concept drift.
Group 3 Impact on the predictability of concept drift
DescriptorPatternDescriptorPredictable
SpeedYesPredictabilityYes
FrequencyYesPredictabilityYes
RecurrenceYesPredictabilityYes
Table 5. Values of descriptors by scenarios.
ScenarioDescription 1#DriftSpeedFrequencyScenarioDescription 1#DriftSpeedFrequency
1A-H-R-PH39125017G-H-R-PH39250250
2A-H-R-PM91100018G-H-R-PM92501000
3A-H-R-PL31300019G-H-R-PL32503000
4A-H-R-NP91Alt 220G-H-R-NP9250Alt 2
5A-H-NR-PH39125021G-H-NR-PH39250250
6A-H-NR-PM91100022G-H-NR-PM92501000
7A-H-NR-PL31300023G-H-NR-PL32503000
8A-H-NR-NP91Alt 224G-H-NR-NP9250Alt 2
9A-L-R-PH39125025G-L-R-PH39250250
10A-L-R-PM91100026G-L-R-PM92501000
11A-L-R-PL31300027G-L-R-PL32503000
12A-L-R-NP91Alt 228G-L-R-NP9250Alt 2
13A-L-NR-PH39125029G-L-NR-PH39250250
14A-L-NR-PM91100030G-L-NR-PM92501000
15A-L-NR-PL31300031G-L-NR-PL32503000
16A-L-NR-NP91Alt 232G-L-NR-NP9250Alt 2
1 Pattern of Description: Speed-Severity-Recurrence-Frequency. 1 Speed: (A) Abrupt; (G) Gradual. 1 Severity: (H) High; (L) Low. 1 Recurrence: (R) Recurrent; (NR) Not Recurrent. 1 Frequency: (PH) Periodical High; (PM) Periodical Middle; (PL) Periodical Low; (NP) Not Periodical. 2 Alt = [1000 4000 4250 4500 4750 5000 8000 9000 9250].
Table 6. Comparing descriptors in each context using statistical tests.
ContextSpeedSeverityRecurrencyFrequency
AGp-ValueHLp-ValueRNRp-ValuePHPMPLNPp-Value
DDM 16.9 16.6 0.98 18.3 14.5<0.05 17.5 16.0 0.34 14.2 17.1 17.8 17.2 0.89
EDDM16.2 17.0 0.78 19.8 15.1 0.19 20.4 12.7<0.05 22.1 20.2 9.4 14.3 <0.05
DDM-O 19.3 15.4 0.13 19.2 14.9<0.0514.3 19.0 <0.05 18.7 18.4 9.2 16.5 <0.05
EDDM-O 17.6 15.8 0.11 19.5 13.6<0.05 18.5 14.5<0.05 17.0 15.4 16.7 15.7 0.61
DDAL 15.9 14.5 0.58 19.5 12.2<0.05 16.5 15.1 0.28 23.9 16.8 10.2 13.3 <0.05
STUDD 16.7 14.9 0.68 20.2 12.1<0.05 17.5 13.8 0.20 23.6 18.0 10.0 11.8 <0.05
MD3-EGM 16.8 16.9 0.89 18.5 14.8<0.05 17.5 15.9 0.32 14.4 17.5 17.9 17.2 0.78
DSDD 17.6 15.8 0.11 19.5 13.6<0.05 18.5 14.5<0.05 17.0 15.4 16.7 15.7 0.61
ND 15.9 14.7 0.49 19.8 12.0<0.05 16.6 14.8 0.23 23.2 16.9 10.0 13.0 <0.05
Values in bold indicate the lowest median prequential error of scenarios in the first series of experiments. Underlined values indicate significant statistical difference according to the statistical tests for all descriptors. Tests with significance level at 0.05 .
Table 7. Values of descriptors for the best and the worst results.
Results Speed Severity Recurrency Frequency
AG HL RNR PHPMPLNP
Best 1 / 9 8/9 0 / 9 9/9 1 / 9 8/9 2 / 9 2 / 9 5/9 0 / 9
Worst 8/9 1 / 9 9/9 0 / 9 8/9 1 / 9 7/9 0 / 9 2 / 9 0 / 9
Values in bold indicate the highest frequency of values by descriptor. The fraction denotes the frequency with which the descriptor attained the specified value under the optimal and suboptimal performance scenarios across the various contexts analyzed.
Disclaimer/Publisher’s Note: The statements, opinions and data contained in all publications are solely those of the individual author(s) and contributor(s) and not of MDPI and/or the editor(s). MDPI and/or the editor(s) disclaim responsibility for any injury to people or property resulting from any ideas, methods, instructions or products referred to in the content.

