Article

Governors in the Digital Era: Analyzing and Predicting Social Media Engagement Using Machine Learning during the COVID-19 Pandemic in Japan

Center for Computational Social Science, Kobe University, Kobe 657-8501, Japan
*
Author to whom correspondence should be addressed.
Informatics 2024, 11(2), 17; https://doi.org/10.3390/informatics11020017
Submission received: 25 February 2024 / Revised: 22 March 2024 / Accepted: 4 April 2024 / Published: 7 April 2024
(This article belongs to the Section Social Informatics and Digital Humanities)

Abstract

:
This paper presents a comprehensive analysis of the social media posts of prefectural governors in Japan during the COVID-19 pandemic. It investigates the correlation between social media activity levels, governors’ characteristics, and engagement metrics. To predict citizen engagement of a specific tweet, machine learning models (MLMs) are trained using three feature sets. The first set includes variables representing profile- and tweet-related features. The second set incorporates word embeddings from three popular models, while the third set combines the first set with one of the embeddings. Additionally, seven classifiers are employed. The best-performing model utilizes the first feature set with FastText embedding and the XGBoost classifier. This study aims to collect governors’ COVID-19-related tweets, analyze engagement metrics, investigate correlations with governors’ characteristics, examine tweet-related features, and train MLMs for prediction. This paper’s main contributions are twofold. Firstly, it offers an analysis of social media engagement by prefectural governors during the COVID-19 pandemic, shedding light on their communication strategies and citizen engagement outcomes. Secondly, it explores the effectiveness of MLMs and word embeddings in predicting tweet engagement, providing practical implications for policymakers in crisis communication. The findings emphasize the importance of social media engagement for effective governance and provide insights into factors influencing citizen engagement.

1. Introduction

The COVID-19 pandemic has had significant implications for societies and economies worldwide, with Japan being no exception. As of May 2023, over 33.8 million cases and 74,690 deaths had been reported in Japan due to COVID-19 [1]. The pandemic has impacted various aspects of Japanese society, including healthcare, the economy, and daily life. To contain the spread of the virus, the Japanese government has implemented several countermeasures, such as school closures, travel restrictions, mandatory masking, and vaccination campaigns [2]. The consequences of the COVID-19 pandemic remain widespread and emphasize the necessity of effective public health policies and strategies to combat infectious diseases.
During the pandemic, social media such as Twitter (rebranded as X) and Facebook have played a substantial global role in disseminating information, social networking, and knowledge acquisition. It has been used successfully to keep people connected, share news, and provide support during lockdowns and social distancing. Despite its potential benefits, social media has also been a significant contributor to the dissemination of misinformation, rumors, and conspiracy theories, which have been detrimental to the public trust in vaccines and public health efforts [3]. Consequently, governments globally have employed social media platforms to provide reliable information about the pandemic, refute false information, and identify potential hotspots. This approach has enabled governments to reach a broader audience and interact with their citizens in a more direct and interactive manner, ultimately making it easier to control the spread of the virus and mitigate its adverse public health consequences.
Regarding the social media analytics of COVID-19-related posts, the current body of literature mainly focuses on the analysis of public posts and tweets related to COVID-19, exploring public perceptions, mental health, vaccination acceptance, predicting COVID-19 cases, and infodemics [4]. However, there is a noticeable gap concerning the analysis of government tweets. This gap limits our understanding of the valuable insights that can be derived from government tweets, including official messaging, policy communication, and public engagement. In addition, analyzing official social media posts helps identify the best strategies for increasing citizen engagement and, in turn, helps make their message reach a larger audience and have a greater impact. Therefore, this study aims to address these limitations by investigating the following research questions, focusing on the case of Japan:
  • RQ1: How do the profile characteristics of Japanese prefectural governors correlate with their level of activity on social media during the COVID-19 pandemic?
  • RQ2: Is there a relationship between the social media activity level of Japanese prefectural governors and citizen engagement, and which governors demonstrate the highest influence?
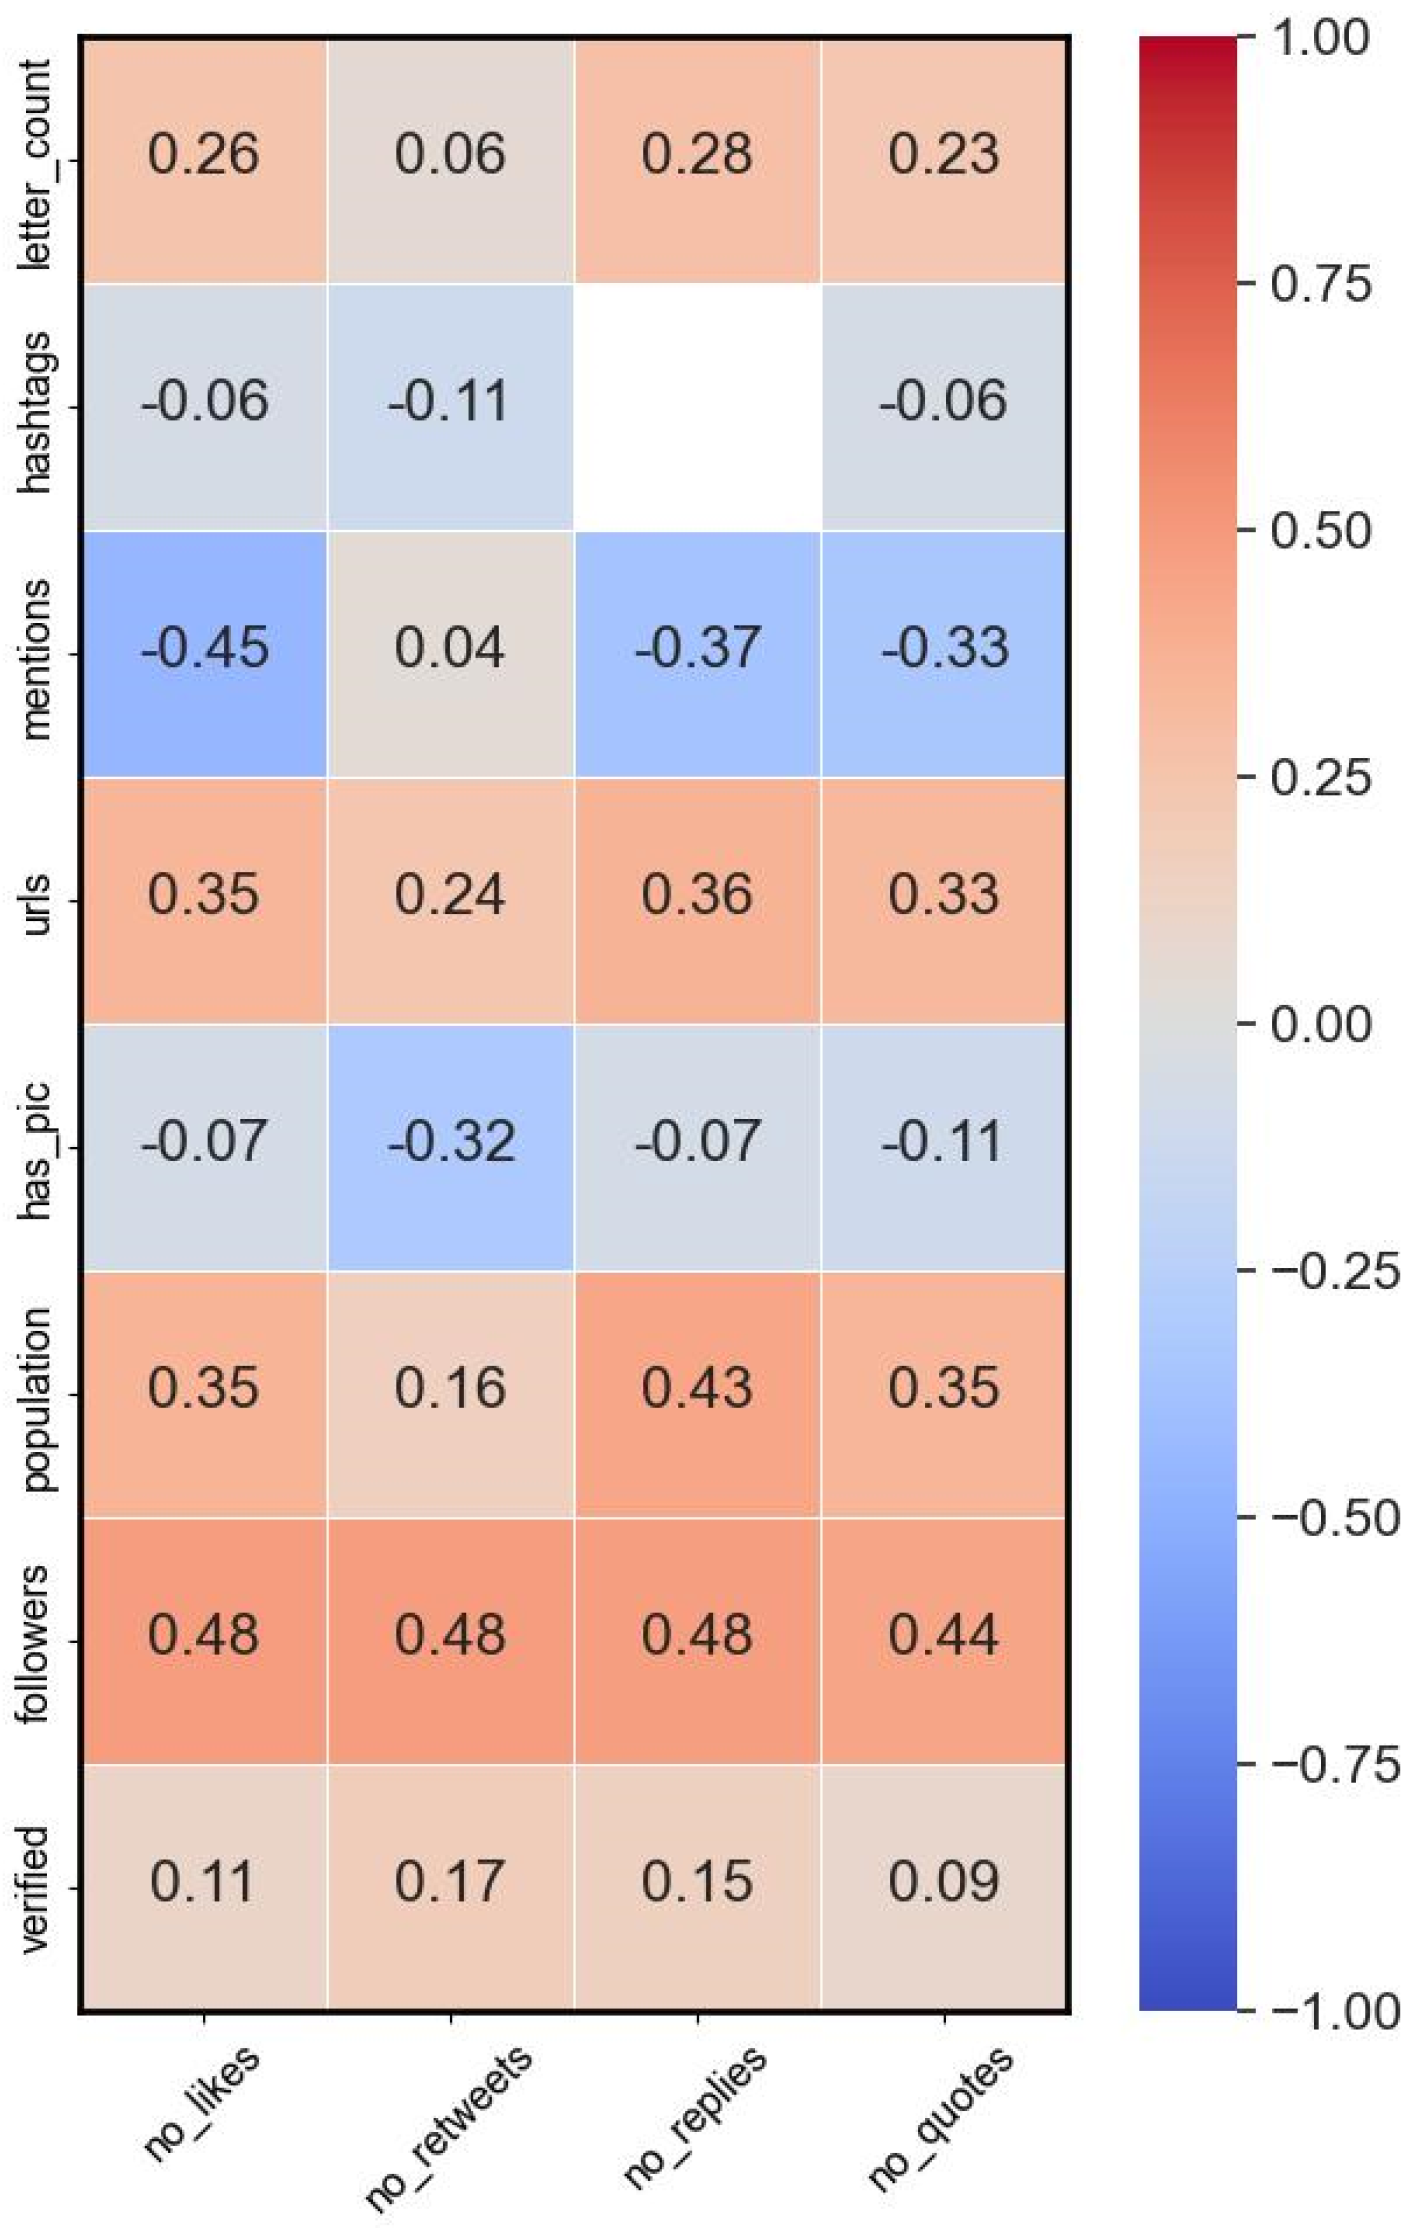
  • RQ3: What is the impact of profile- and tweet-related features, such as hashtags, mentions, timing, number of friends or followers, language used, and posting timing, on citizen engagement, and which features hold the greatest significance?
  • RQ4: Can machine learning models accurately predict citizen engagement using various sets of profile and tweet features, as well as embeddings, and which models demonstrate the highest prediction accuracy?
In order to address these research questions, this paper has the following research objectives:
  • Conducting an analysis of the profile- and tweet-related factors that influence citizen engagement with government tweets related to COVID-19.
  • Estimating the correlation between the activity level of governors and public engagement and ranking them based on their social media impact.
  • Identifying the most significant features that impact citizen engagement with specific tweets.
  • Evaluating the accuracy of machine learning (ML) models in predicting tweet engagement using various sets of profile and tweet features, as well as embeddings. Additionally, developing an assisting tool for decision makers to predict the citizen engagement rate of a given tweet.
The structure of this paper is organized as follows. Section 2 provides background and a review of recent studies on the analysis of social media posts in the context of the COVID-19 pandemic. Section 3 offers a detailed description of the research framework, including information on data collection and pre-processing steps. Furthermore, the adopted analysis methods are explained in this section. Section 4 presents the results and discussion derived from the analysis conducted. Finally, Section 5 concludes this paper and provides insights into future work.

2. Related Work

Crisis communication entails the exchange of information among individuals and institutions, aiming to enhance understanding and effectively manage crises. Social media has played a pivotal role in reshaping crisis communication by facilitating rapid information dissemination to the public, fostering increased public cooperation, and enhancing risk management efficiency [5]. Notably, Twitter witnessed an unprecedented surge in daily users globally during the pandemic, with a 24% year-over-year growth in the first three months of 2020. Moreover, Twitter has emerged as a valuable platform for advancing COVID-19-related research, offering an academic API that empowers researchers to collect original data, including user information, content, posting time, and more, by employing specific keywords [6]. In the context of COVID-19, social media analytics has become a valuable tool for researchers, policymakers, and public health agencies to gain invaluable insights into public behaviors, sentiments, and emerging trends. With the abundance of user-generated content, social media analytics enables the detection of misinformation and facilitates the identification of emerging trends, ultimately guiding more informed decisions and the development of effective crisis management strategies [7].
In their comprehensive review, Huang et al. [3] examined the extensive body of research on social media mining in relation to the COVID-19 crisis. Their study focused on several key aspects, including the analysis of publicly available data archives, an assessment of challenges encountered in social media mining, the potential impact of these challenges on derived findings, and an exploration of future directions for social-media-based COVID-19 and public health investigations. According to their findings, social media data mining research in the context of COVID-19 can be classified into six primary domains, namely early warning and detection, human mobility monitoring, communication and information dissemination, public attitudes and emotions, infodemic and misinformation, and hatred and violence. Wang and Lo [8] conducted a review focusing on resources that facilitate text mining applications within the realm of the COVID-19 literature. Their review encompassed a comprehensive examination of various resources, including public corpora, modeling resources, systems, and shared tasks. The evaluation of these systems encompassed an assessment of their performance, data, user interfaces, and modeling decisions. In the same context, an analysis of 81 studies focusing on COVID-19 and social media platforms is presented in [4]. The authors identified five key public health themes that highlight the role of social media platforms in the context of the pandemic. These themes encompass surveying public attitudes, identifying infodemics, assessing mental health, detecting or predicting COVID-19 cases, analyzing government responses to the pandemic, and evaluating the quality of health information in prevention education videos. They also emphasized the crucial importance of developing enhanced government communication strategies specifically tailored to engage a broader spectrum of social media users. Such strategies play a vital role in combating the spread of infodemics, which have proven detrimental to public health endeavors [9].
Text mining techniques play a crucial role in pre-processing, cleaning, and transforming raw textual data into structured representations that can be effectively analyzed. On the other hand, machine learning algorithms, particularly classification algorithms, provide a powerful solution for automating the process of assigning categories or labels to the text based on extracted patterns and features [10]. In the domain of COVID-19 social media analyses, the integration of these techniques enables the development of robust models capable of automatically detecting and classifying COVID-19-related information into relevant categories. These categories encompass various aspects such as a sentiment analysis [11], vaccination hesitancy [6], misinformation detection [12], topic classification [13], and event detection [14], allowing for a comprehensive understanding of the dynamics surrounding the pandemic on social media platforms.
Previous studies have predominantly focused on analyzing public posts and tweets to investigate public perceptions, emotions, vaccination acceptance, and the dissemination of misinformation during the COVID-19 pandemic. However, limited attention has been given to the analysis of social media accounts belonging to government and public health agencies, and their impact on the public [4]. Rufai and Bunce [15] conducted an analysis of COVID-19-related tweets posted by the Group of Seven (G7) world leaders. Their findings indicated that the majority of viral tweets fell into the “Informative” category, frequently incorporating web links that directed users to official government-based sources. This study underscores the significant potential of Twitter as a powerful communication tool for world leaders to effectively engage with their citizens during times of public health crises. Slavik et al. [16] conducted an analysis of COVID-19-related tweets from Canadian public health agencies and decision makers with the aim of enhancing crisis communication and engagement. The study, which examined 32,737 tweets, revealed that medical health officers had the highest percentage of COVID-19 tweets and received the highest retweet rate. Furthermore, public health agencies exhibited the highest frequency of daily COVID-19 tweets. The scholars in [17] examined COVID-19-related tweets from public health agencies in Texas and their impact on public engagement. The analysis of 7269 tweets found that information sharing was the most prominent function, followed by action and community engagement. The findings suggest that public health agencies should utilize Twitter to disseminate information, promote action, and build communities, while improving their messaging strategies related to the benefits of disease prevention and audience self-efficacy. Chen et al. [18] aimed to identify the factors influencing citizen engagement with the TikTok account of the National Health Commission of China during the COVID-19 pandemic. Through the analysis of 355 videos, it was found that the video length, titles, dialogic loop, and content type significantly influenced citizen engagement. Positive titles and longer videos were associated with higher likes, comments, and shares, while information about the government’s handling and guidelines received more shares compared to appreciative information. In the same context, Gong and Ye [19] analyzed the Twitter usage patterns of U.S. state governors during the COVID-19 pandemic to understand their crisis communication strategies. The findings revealed important patterns, such as the correlation between tweet quantities and pandemic severity, the early mention of COVID-19 by governors, the use of hashtags for organizing information, and networking among governors for crisis communication. The findings suggest actionable approaches for governors to enhance crisis communication.
The existing literature examining government and public health agencies’ accounts during the COVID-19 pandemic and their impact on public engagement exhibits certain limitations, including
  • The majority of the studies focus primarily on the analysis of English tweets, overlooking potential insights provided by other languages.
  • Profiles of governors are not analyzed to explore the correlation between their characteristics and social media activity levels.
  • A limited utilization of word embedding techniques to identify important features exists.
  • The performance of different classification algorithms in predicting tweet engagement has not been sufficiently explored.
  • The potential of using ML models as assisting tools for decision makers to predict tweet engagement and enhance the influence of their messages to the public has not been explored.
In order to address these challenges, this paper extends the existing literature in four key aspects. Firstly, it conducts an analysis of tweets posted by Japanese governors related to COVID-19. Secondly, it investigates the correlation between the activity level of governors and their profile characteristics, as well as the correlation between the activity level and various citizen engagement metrics. Additionally, it examines the impact of different profile- and tweet-related features on the public engagement rate and identifies the most significant features. Thirdly, this paper conducts several experiments by integrating four popular word embeddings with seven classification algorithms to predict the engagement levels of tweets and evaluates their performance. Lastly, this paper analyzes the most important features in the top three ML models.

3. Methods

3.1. Research Framework

To investigate the citizen engagement of Japanese prefecture governors during the COVID-19 pandemic using Twitter, this research paper proposes the following framework:
  • Data Collection:
    • Identify the Twitter accounts of the prefecture governors.
    • Collect profile-related information such as age, number of terms in power, verification status, etc.
    • Gather COVID-19-related tweets and their metadata from the identified Twitter accounts.
  • Data Pre-processing:
    • Translate the Japanese text into English.
    • Clean and pre-process the collected information.
  • Activity Level Analysis:
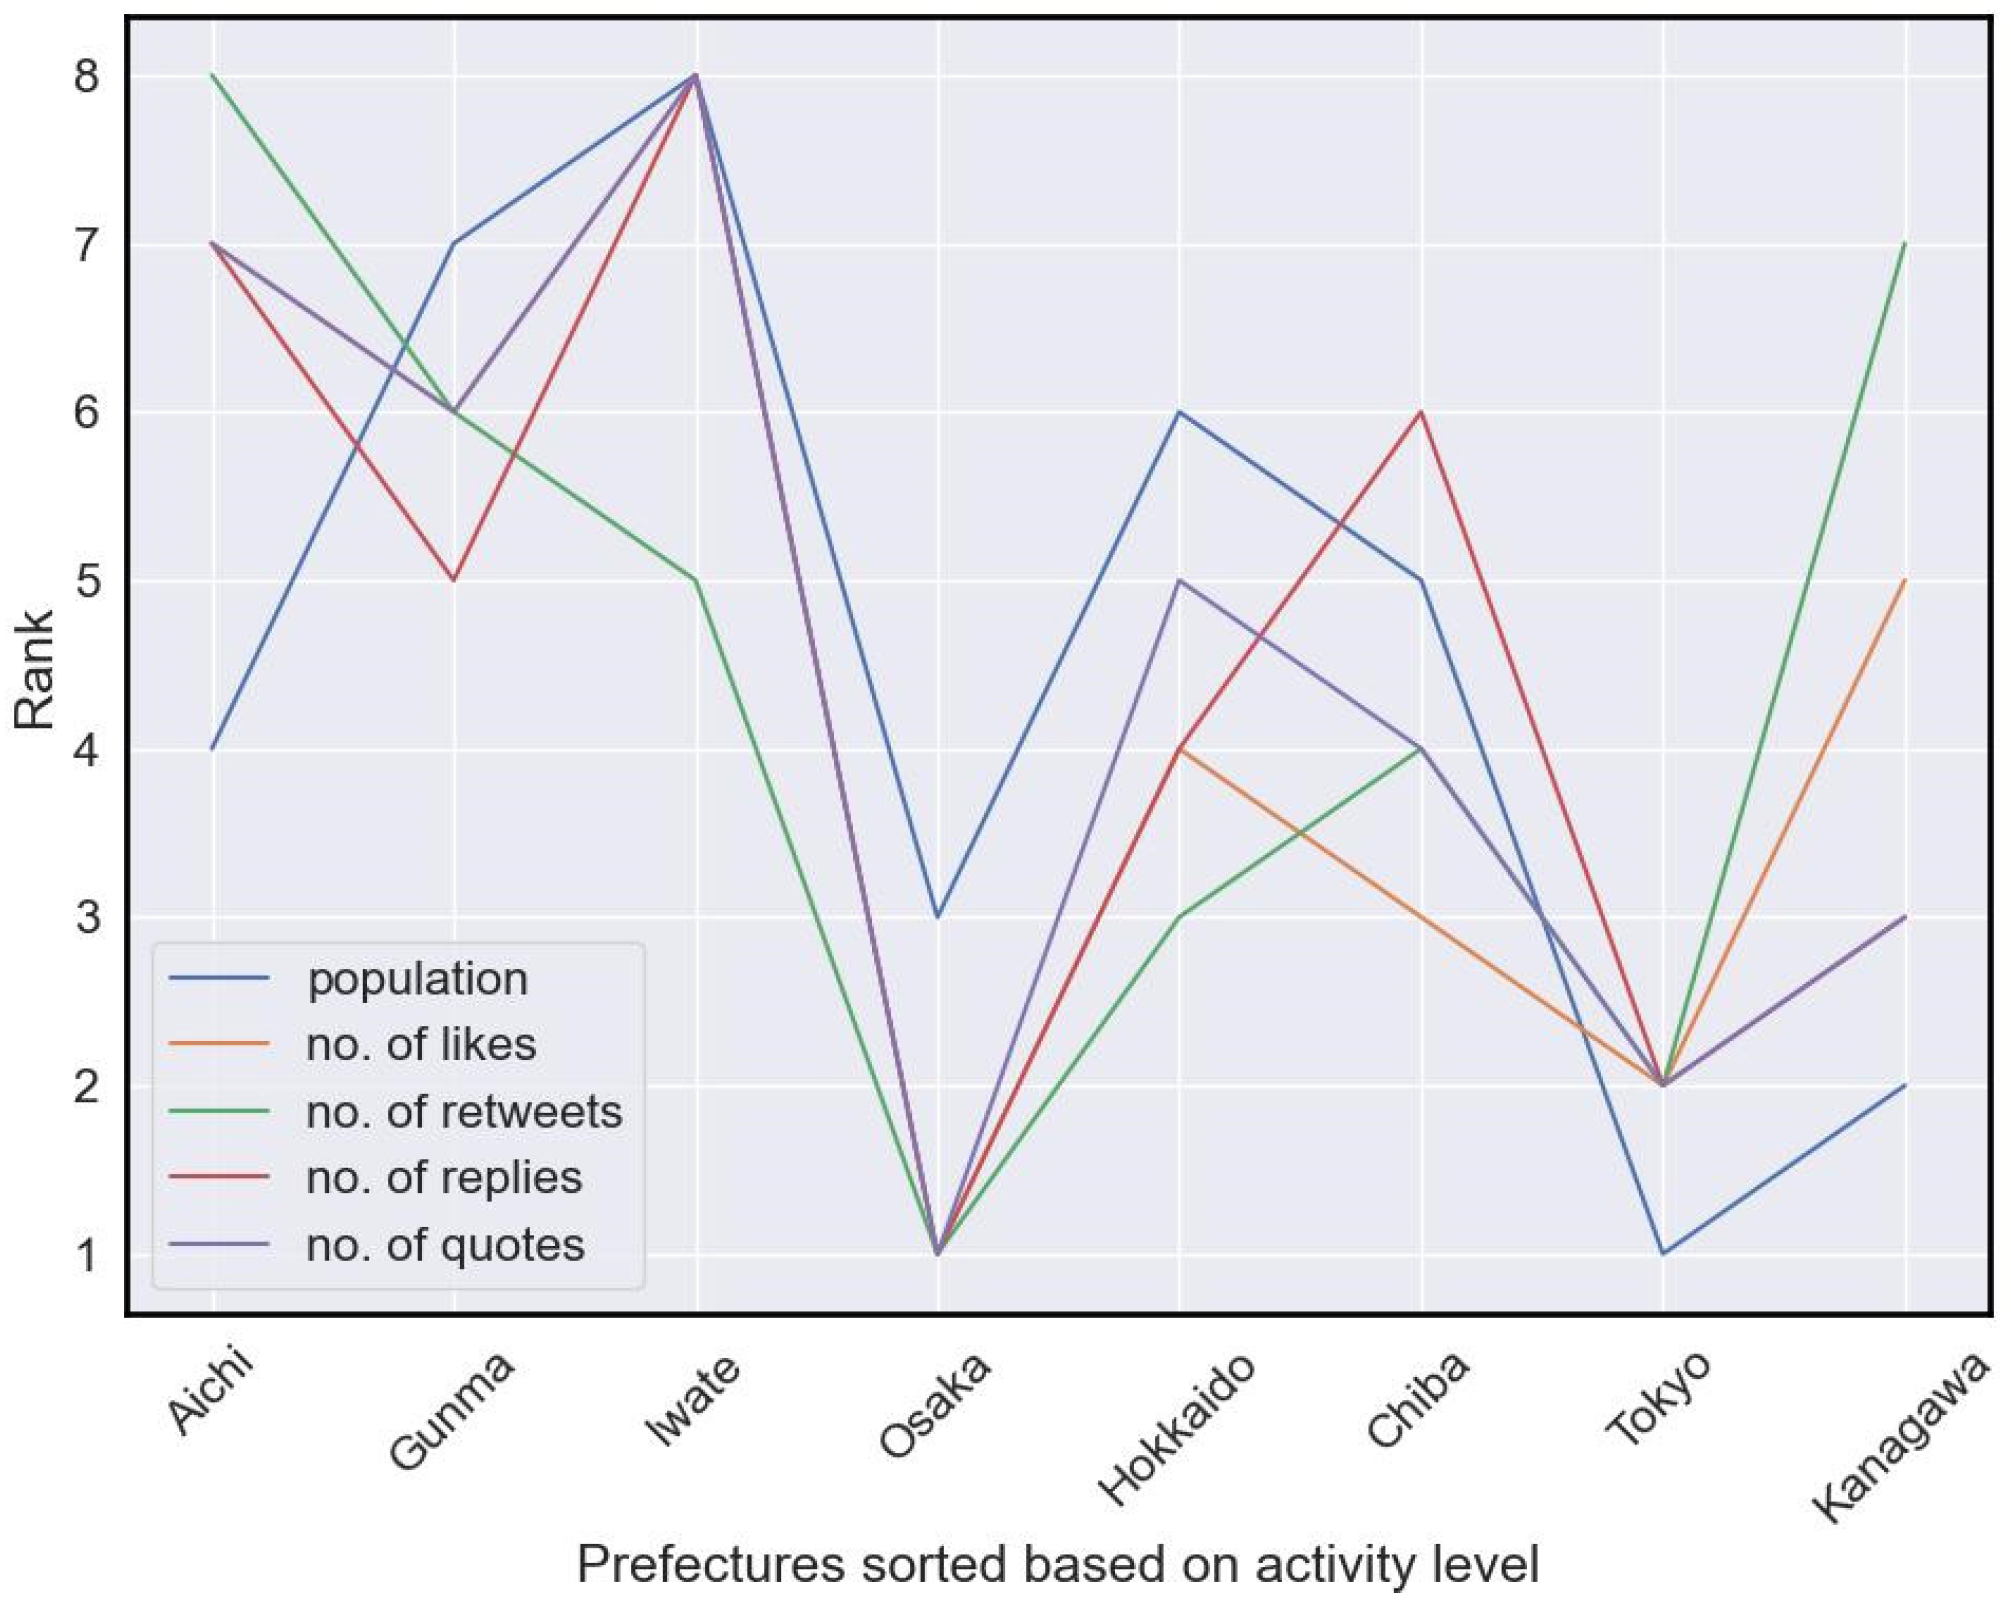
    • Rank the accounts based on their activity level during the pandemic, considering factors such as frequency of tweeting and overall engagement.
  • Correlation Analysis:
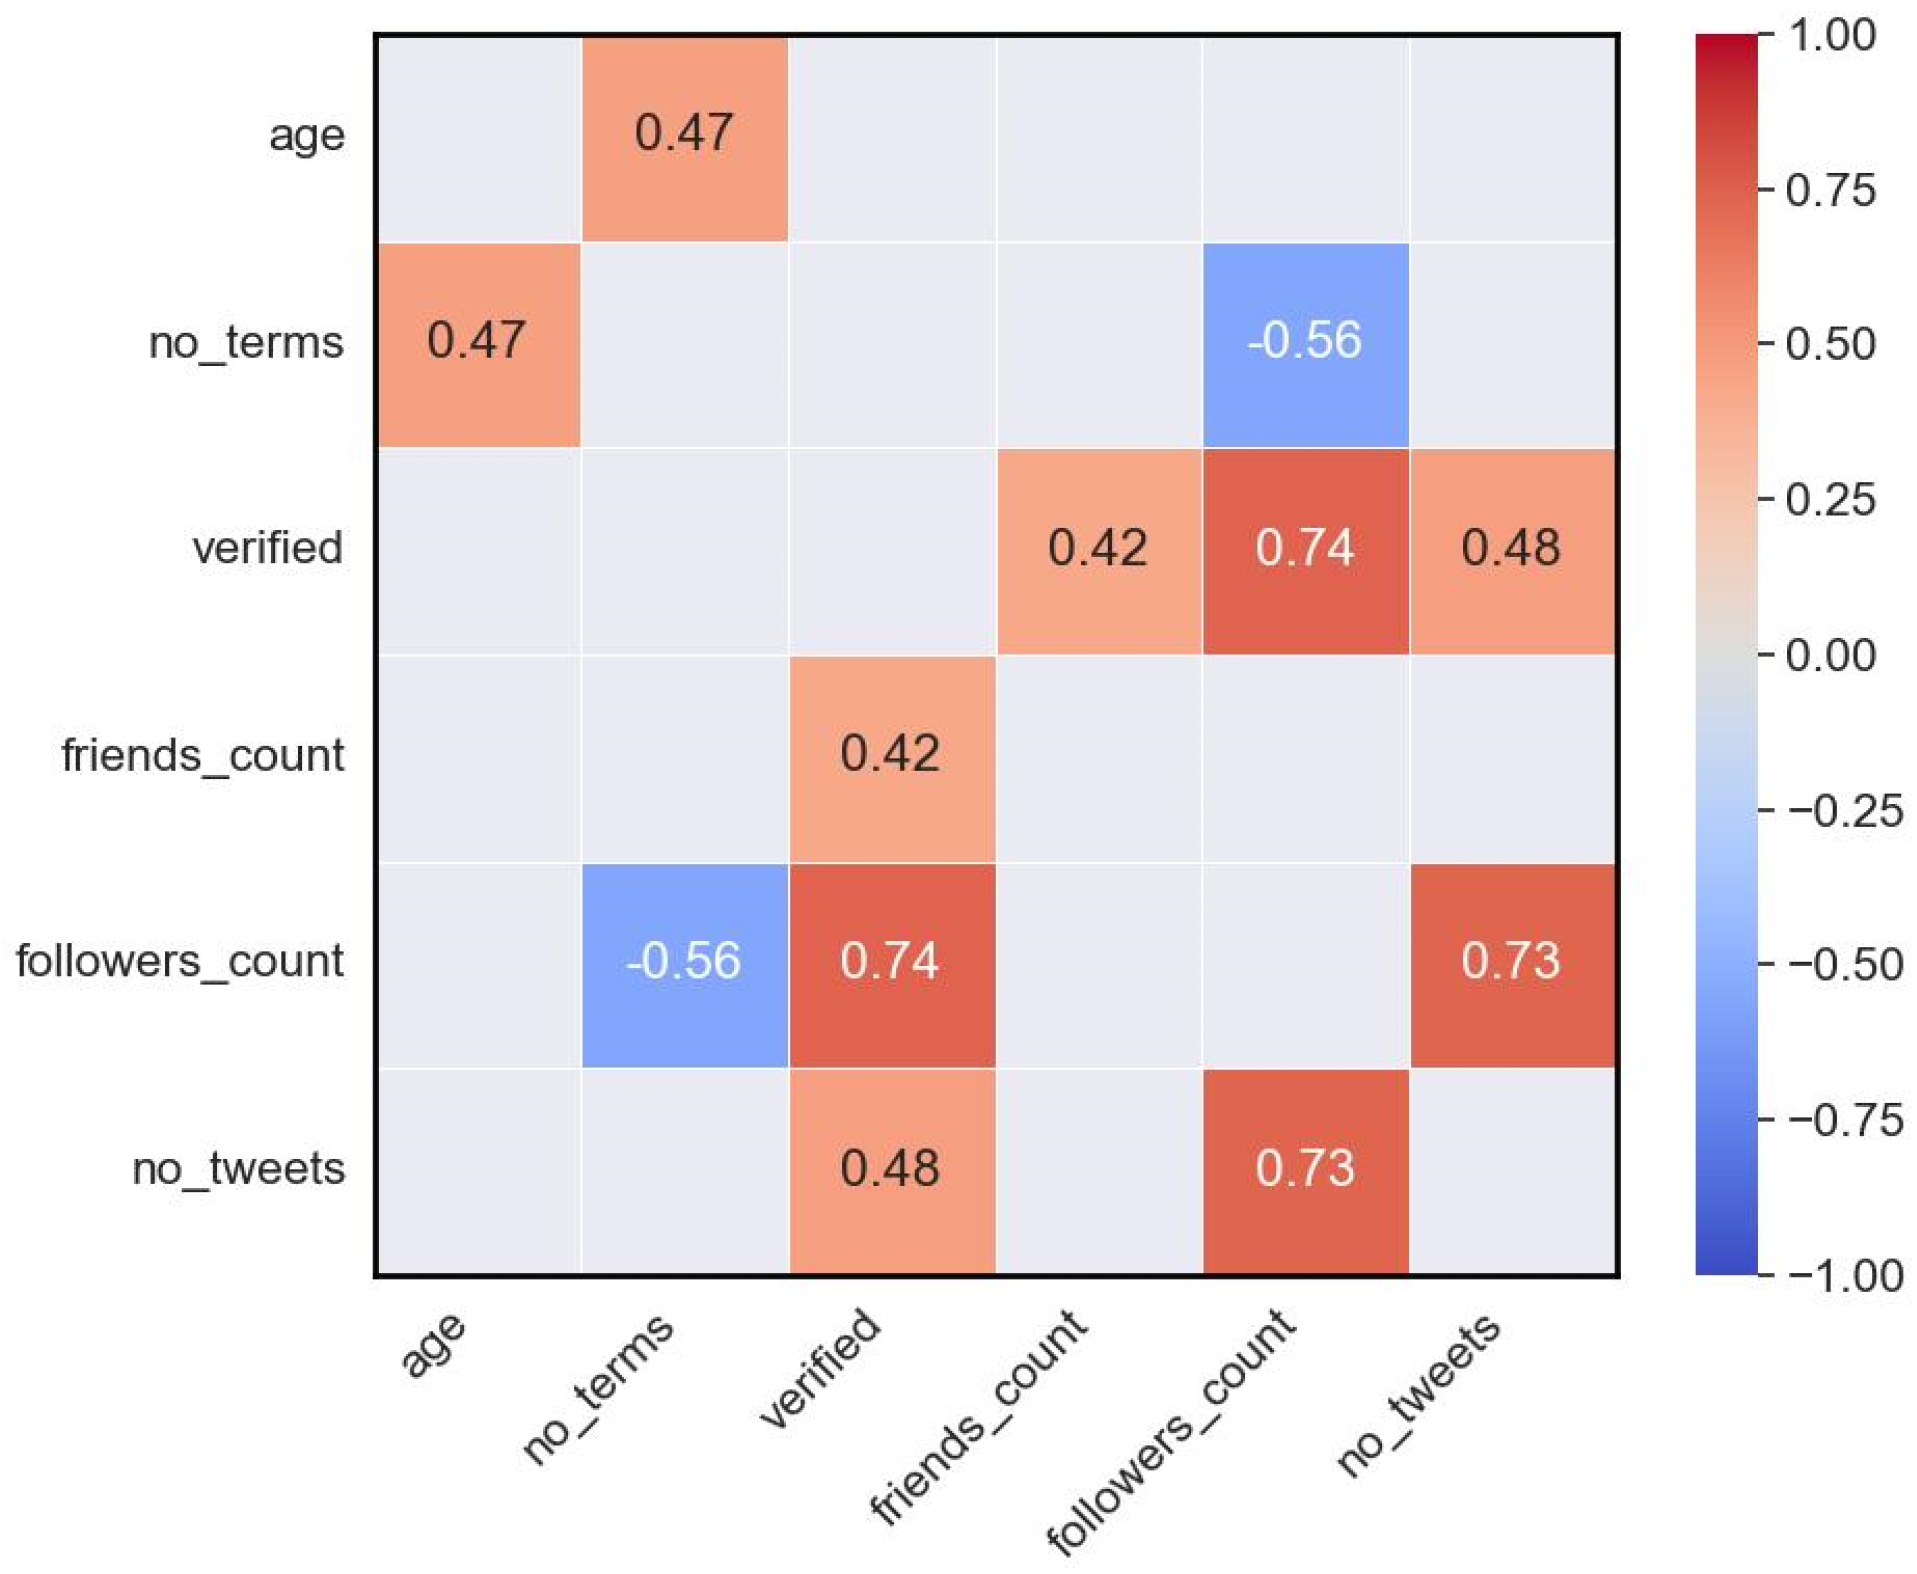
    • Estimate the correlation between the activity level of governors and their profile characteristics.
    • Measure the correlation between the four engagement metrics.
    • Investigate the correlation between the activity level and citizen engagement.
  • Feature Analysis:
    • Estimate the effect of profile- and tweet-related features on public engagement.
    • Identify the most significant features that influence public engagement.
    • Identify the optimal times for high engagement.
  • Machine Learning Model Development:
    • Train 63 ML models using various feature sets (with/without word embeddings) to predict the expected engagement a tweet might receive.
  • Model Evaluation and Selection:
    • Assess the performance of the trained models, considering metrics such as the accuracy, weighted average precision, recall, and F1-score.
    • Identify the top three models based on their predictive accuracy.
By following this research framework, this study aims to gain insights into the social media engagement strategies of prefecture governors during the COVID-19 pandemic and identify effective factors that influence public engagement.

3.2. Data Collection and Pre-Processing

After conducting a manual investigation of the Twitter accounts belonging to Japanese prefectural governors, it was determined that 23 out of the 47 governors had active Twitter accounts. Subsequently, Twitter’s academic API was utilized to collect profile-related information and COVID-19-related tweets from these identified accounts between 1 January 2020 and 1 March 2023, using a curated list of Japanese keywords. The data collection process involved using a curated set of Japanese keywords associated with COVID-19. For clarity, we provide the English translation of these keywords: [(新型肺炎, novel coronavirus), (PCR, PCR), (新型コロナウイルス, novel coronavirus), (コロナ禍, COVID-19 pandemic), (PCR検査, PCR test), (オミクロン株, Omicron variant), (ソーシャルディスタンス, social distancing), (社会距離戦略, social distancing strategy), (マスク着用, mask-wearing), (検疫, quarantine), (追加接種, booster shot), (ワクチン接種, vaccine administration), (接種券, vaccination certificate), (ワクチン接種証明, vaccination proof), (1回目接種, first dose), (2回目接種, second dose), (3回目接種, third dose), (ワクチン種類, vaccine type), (陽性, positive), (陰性, negative), (COVID, COVID), (検査, testing), (コロナ, corona), (マスク, mask)]. The profile-related information encompasses the governor’s age, number of terms served in office, verification status, count of COVID-19 tweets posted, number of followers, and number of friends. Furthermore, the collected tweet information includes the tweet ID, tweet text, timestamp, hashtags, mentions, URLs, type of media attached, language, and location data (when available).
Since all collected tweets are in Japanese, the Google Cloud Translation API was used to translate them into English. The accuracy of the translations was confirmed through manual verification of a sample of randomly selected tweets. Several features were generated as part of the pre-processing phase. First, the “character count” feature was created to represent the number of characters per tweet before translation. Then, “hashtags”, “mentions”, and “URLs” were encoded as binary variables, taking the value 1 if the corresponding feature existed in the tweet body, and 0 otherwise. Considering that only pictures were attached as media, a new column labeled “has_pic” was introduced as a binary feature, taking the value 1 if a picture was attached to the tweet and 0 otherwise. The verification status of each governor’s account was encoded as a binary variable, denoted as “verified”, which took the value 1 if the account was verified and 0 otherwise. Finally, the translated tweet texts were converted to lowercase, and numbers, punctuation, and stop words were removed. Each tweet was then transformed into a set of tokens, for a further analysis. It is important to note that the data collection process encountered some limitations. We relied on a subset of keywords (the most frequent COVID-19-related words) in selecting COVID-19-related tweets; however, some tweets might be related to COVID-19 but include other keywords that were not included in our selection. Additionally, some tweets might only include multimedia content (such as pictures or videos) without accompanying text, and thus these tweets were also excluded from our analysis.

3.3. Data Analysis Methods

A total of 18,608 tweets, along with their metadata, were collected from the 23 identified Twitter accounts belonging to the governors. The accounts of the governors were ranked based on their activity levels during the COVID-19 pandemic. The account with the highest number of tweets was ranked first, and the rest were ranked in descending order. Various profile-related features were examined to identify the governors with the highest and lowest number of followers and friends (following). Furthermore, the creation dates of these accounts were examined to determine whether there was a notable increase in the number of governors on social media due to COVID-19. Moreover, the first mention dates of COVID-19 by each governor in their accounts were determined and compared with the date of the first confirmed case in Japan. This analysis allowed us to identify the top five governors with the quickest and slowest reactions on social media.
To assess the use of citizen engagement strategies in the governors’ tweets, the percentage of tweets containing hashtags, mentions, URLs, and pictures was estimated. We then utilized the Spearman correlation coefficient to identify the most influential factors on the activity of governors on social media. This coefficient was employed to estimate the correlation between the governor’s activity level on Twitter and several profile-related characteristics, including their age, number of terms in power, verification status of their account, and number of friends and followers they have.
This study also considered Twitter’s four engagement metrics, namely the number of likes, retweets, replies, and quotes. The initial analysis aimed to investigate the correlation between these four metrics and assess how they influenced each other within the context of COVID-19. Furthermore, the top eight governors with the highest number of likes, retweets, replies, and quotes were determined and compared to the top governors in terms of the activity level and population size. The objective was to examine the hypothesis that being very active on Twitter or being a governor of a prefecture with a large population guarantees high citizen engagement. Additionally, the Spearman correlation coefficient is utilized to estimate the correlation between the four engagement metrics and various profile- and tweet-related features. These features include the number of characters and the inclusion of hashtags, mentions, URLs, and pictures, as well as the number of citizens (population), followers, and verification status. Finally, the tweets are sorted based on the values of the four engagement metrics and their posting timing is analyzed in order to obtain some insights into the preferred hours, days, weekdays, and months for maximizing engagement on tweets.

3.4. Machine Learning Modeling

For developing ML models capable of predicting citizen engagement of COVID-19-related tweets, a numerical value is assigned to each tweet based on four engagement metrics, representing the engagement score (class). The tweets are first sorted based on the number of likes they receive. If a tweet falls within the lowest range of 0–40% of all likes in the dataset, it is assigned a value of 0. If it falls within the range of 40–70%, it is assigned a value of 1. If it falls within the highest range of 70–100%, it is assigned a value of 2. This sorting and assignment process is also applied to the other three metrics. The assigned values for each tweet across the four metrics are summed, and if this sum is less than 3, the tweet is assigned an engagement score of 0 (low). If the sum falls between 3 and 5, the tweet is assigned an engagement score of 1 (medium). Otherwise, the tweet is assigned an engagement score of 2 (high). Consequently, 6650 tweets are labeled as low engaging, 6444 tweets are labeled as medium engaging, and 5514 tweets are labeled as highly engaging.
To evaluate the ability of ML models in predicting the engagement score of COVID-19-related tweets, several ML models are trained using three sets of features. The first set comprises 93 variables representing profile- and tweet-related features without considering semantic relationships and word meanings. These encoded features represent 24 aspects, including ‘letter_count’, ‘hashtags’, ‘mentions’, ‘URLs’, ‘has_pic’, ‘hour’, ‘day’, ‘month’, ‘weekday’, ‘population’, ‘no_friends’, ‘verified’, ‘sentiment_score’, ‘subjectivity_score’, ‘fear’, ‘anger’, ‘trust’, ‘surprise’, ‘positive’, ‘negative’, ‘sadness’, ‘disgust’, ‘joy’, and ‘anticipation’. The sentiment score of a specific tweet is determined using the TextBlob Python library, with scores ranging from −1 to 1. A score of −1 represents highly negative sentiment, 0 represents neutral sentiment, and 1 represents highly positive sentiment. The subjectivity score ranges from 0 to 1, with 0 indicating highly objective text (factual information) and 1 indicating highly subjective text (personal opinions). In addition, the last 10 features indicate the emotions conveyed in each tweet using the NRCLex Python library. The rationale for selecting these features is as follows: The first five features are tweet-related features noted in previous studies to have a tangible impact on affecting the reachability of a given tweet and thus citizen engagement. Additionally, the population size of a given prefecture, the tweeting time, and the number of friends, as well as the verification status of the governor’s account, are expected to have some impact on the number of people who are likely to see and interact with a specific tweet. Finally, the sentiments and tone (the last 12 features) presented in the tweets are expected to influence the readers’ (citizens) interaction with this tweet and were therefore included in our analysis.
The second set incorporates word embeddings from popular models such as Word2Vec (300 embedded features), GloVe (200 embedded features), FastText (300 embedded features), and BERT (768 embedded features). The third set combines the first set of features with one of the embeddings used in the second set. Consequently, seven classifiers, including logistic regression (Log. reg.), a decision tree (Dec. tree), a random forest (Rand. forest), a Support Vector Machine (SVM), K-Nearest Neighbors (KNN), naive bayes, and XGBoost, are employed and evaluated with each feature set. As a result, 63 experiments (7 classifiers × (1 set + 4 embeddings + 4 combined features)) are conducted. The dataset is then divided into three sets: 80% for training, 10% for testing, and 10% for validation. Finally, the performance of these models is evaluated using metrics such as the training accuracy, testing accuracy, validation accuracy, weighted average precision, weighted average recall, and weighted average F1-score. The top three performing models are identified and analyzed. It is important to note that the machine learning models developed in this study are employed to analyze publicly accessible tweets authored by officials, which are intended for their prefecture citizens to disseminate information concerning a public concern (COVID-19). Consequently, these models do not violate privacy considerations. Furthermore, it is important to emphasize that the results described in the next section relate only to the dataset analyzed and should not be extrapolated to alternative contexts.

4. Results and Discussion

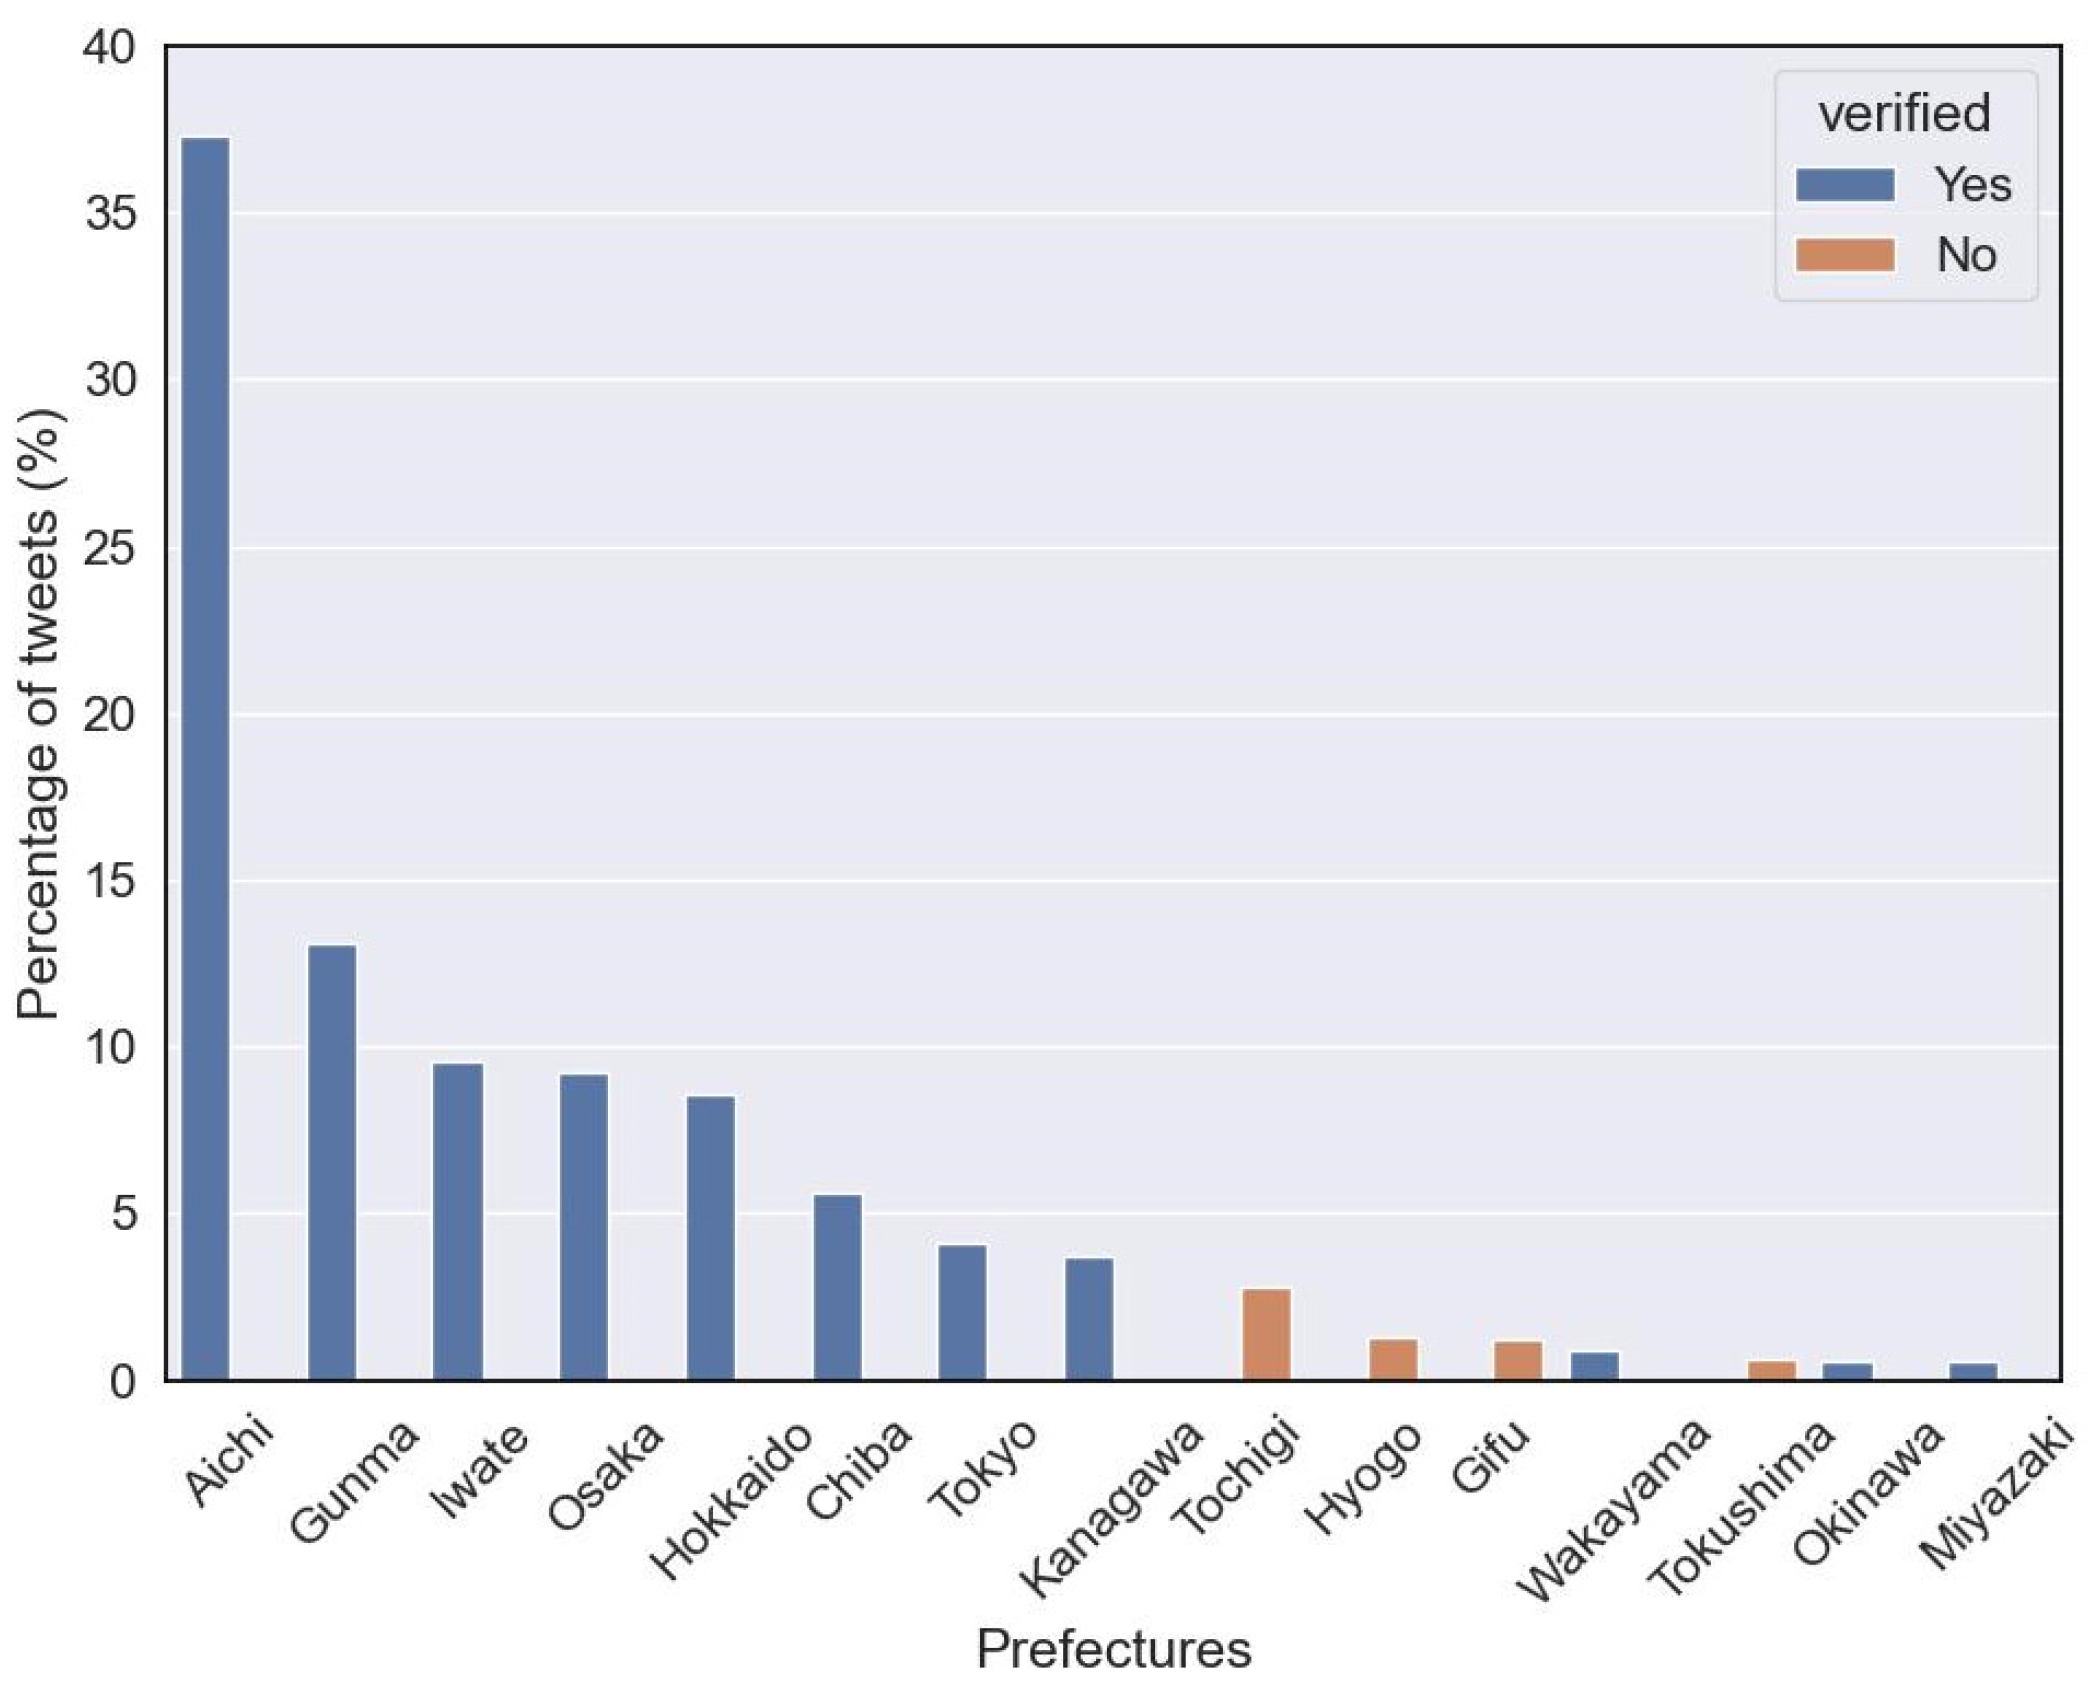
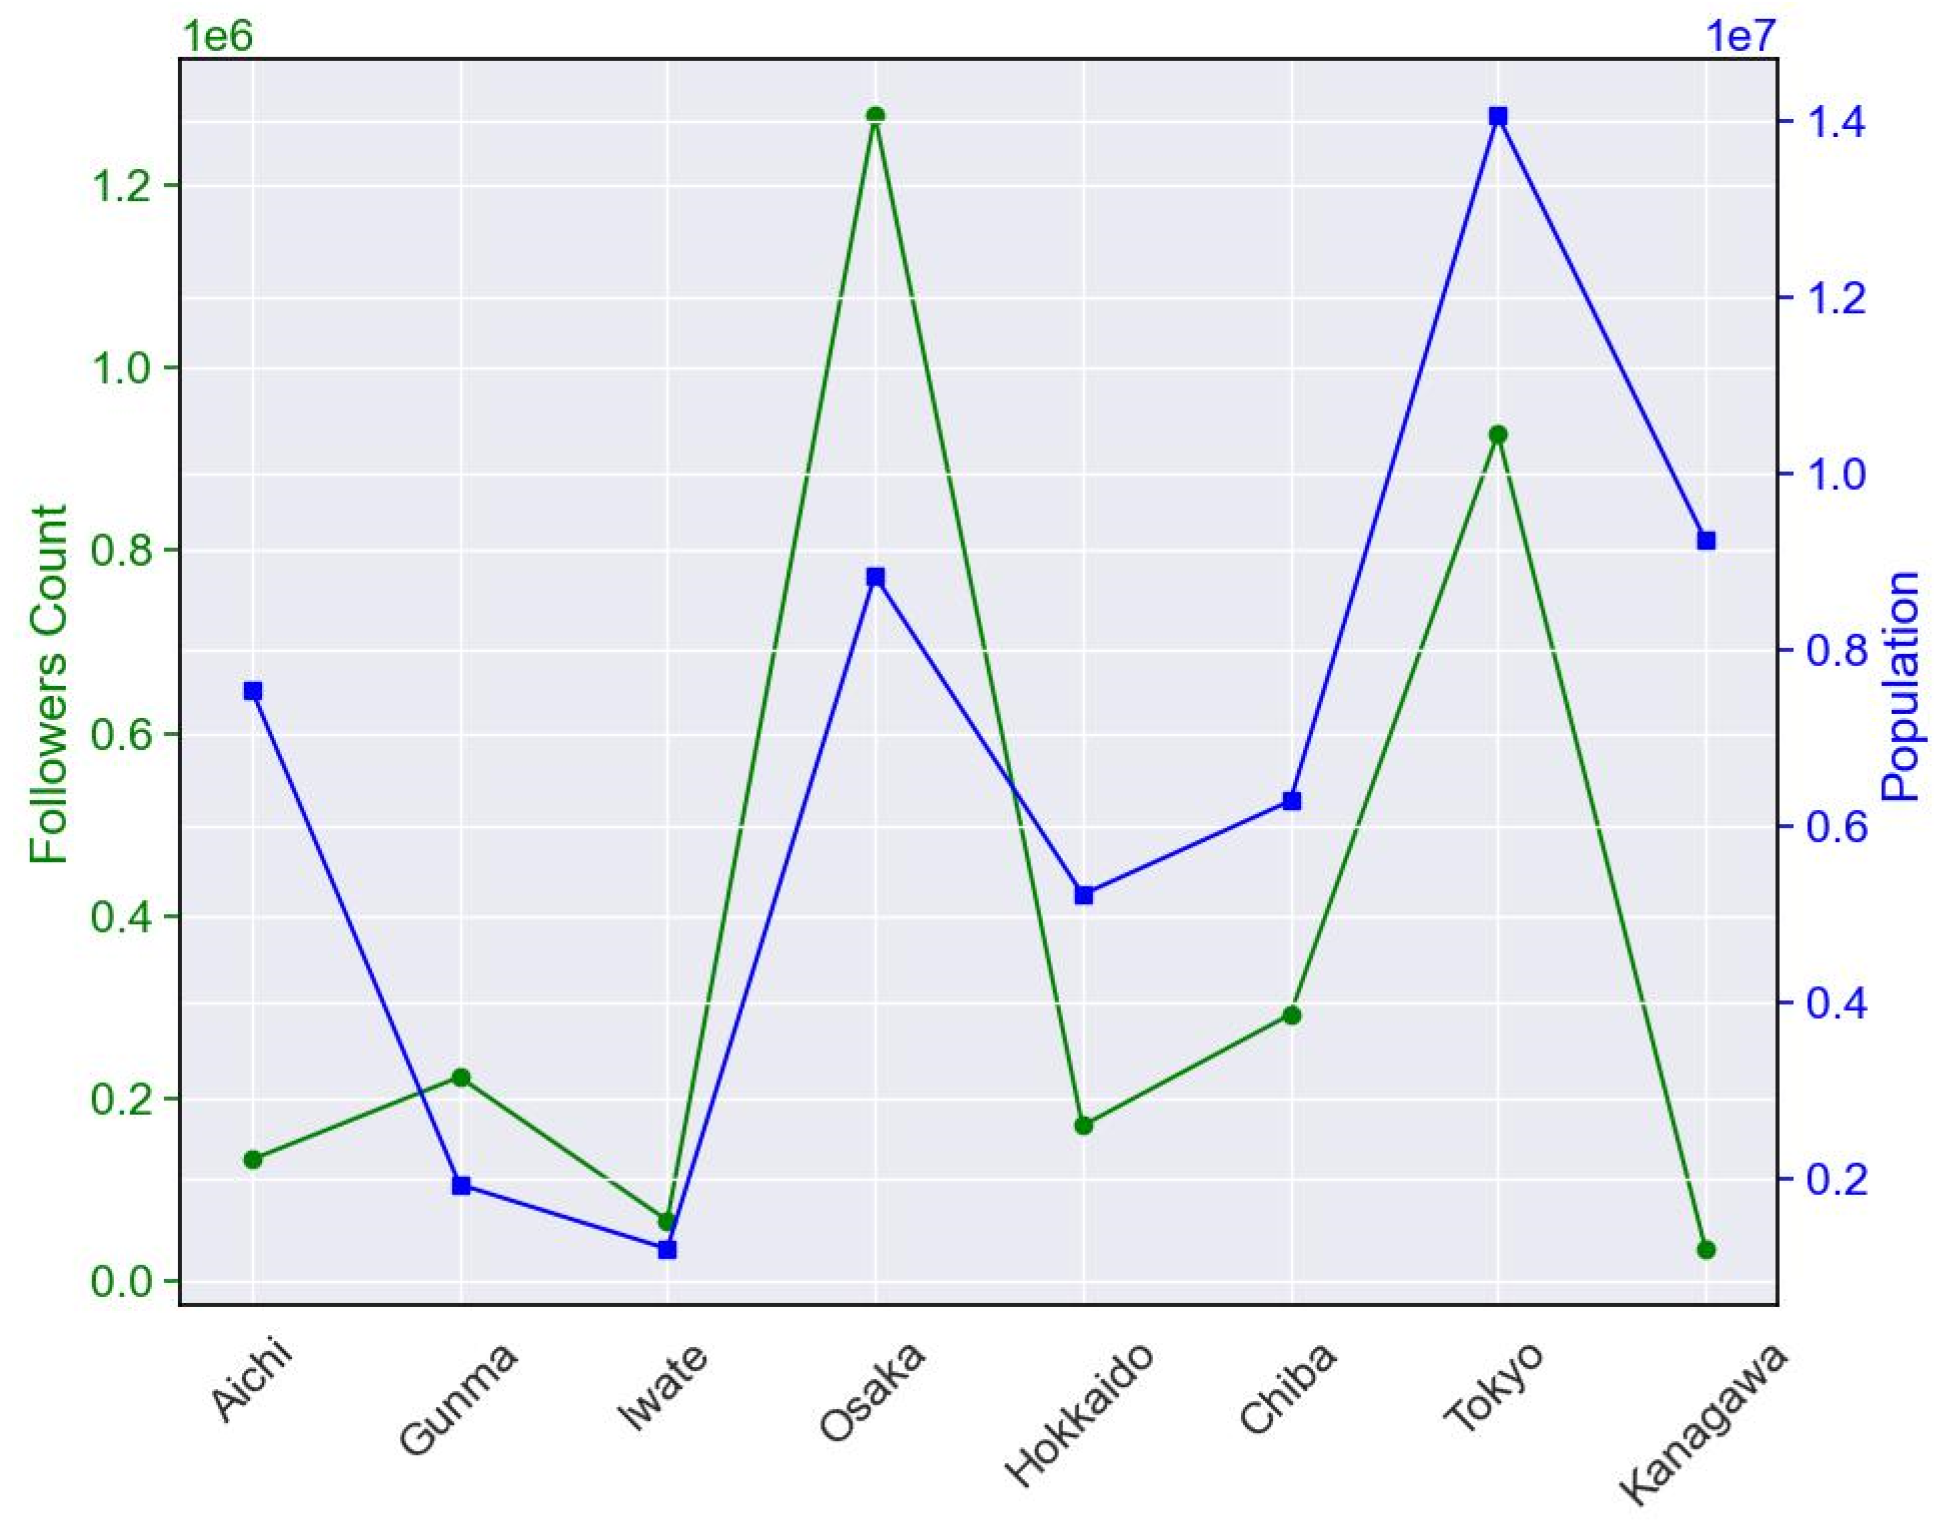
4.1. Governors’ Social Media Influence: Unraveling the Relationship between Activity Level, Verification Status, and Follower Counts during COVID-19

The 23 Twitter accounts belonging to the governors were ranked based on the total number of tweets they contributed to the dataset, serving as a measure of their activity level on Twitter during the COVID-19 pandemic. Figure 1 displays the top 15 prefectures, along with the percentage of their tweets in the entire dataset. Verified accounts are indicated by blue bars, while non-verified accounts are represented by orange bars. The analysis revealed that the governor of Aichi prefecture had the highest number of tweets, accounting for approximately 37.34% of all tweets. Conversely, the governors of Niigata and Ehime had only one tweet related to COVID-19. Moreover, the combined tweets of the top eight governors constituted approximately 91.17% of the total tweets, making them the focus of further investigation. Notably, a correlation appears to exist between the level of social media activity and the verification status of the accounts. Among the 15 most active governors, 11 had verified accounts, and interestingly, all of the top 8 governors were verified. These findings shed light on the variations in Twitter activity among governors and the association between the activity level and account verification status.
The social media presence of each governor was assessed by analyzing their number of followers and friends (following) to evaluate their level of influence and engagement. This analysis aimed to identify governors with the highest and lowest number of connections and audiences (followers) on Twitter. The findings revealed that the governor of Osaka had the most substantial following, amassing an impressive count of approximately 1,275,482 followers. In contrast, the governor of Ehime prefecture had the fewest followers, with only 224 individuals following their account. When considering social network connections, the governor of Chiba prefecture stood out with the highest number of friends on Twitter, approximately 11,021 friends. Notably, the governors of Hyogo and Tokushima did not follow any accounts on the platform. To explore the potential influence of population size on follower count, Figure 2 provides a visual representation of the number of followers for the top eight most active governors, considering the population census of their respective prefectures as of 1 October 2020.
Remarkably, despite being the most active during the COVID-19 pandemic, the governor of Aichi exhibits a lower number of followers compared to other prefectures, excluding Iwate and Kanagawa. Conversely, Osaka, despite having a smaller population than Tokyo, demonstrated a greater number of followers. On the other hand, the governor of Kanagawa, despite governing a relatively larger population, had the lowest number of followers among the top eight prefectures. These findings suggest that the governor’s level of social media activity and population size may contribute to variations in follower counts; however, it is crucial to consider other factors such as engagement strategies and the quality of content, as they likely play a significant role as well. These findings are consistent with the results shown in [18].

4.2. Governors’ Twitter Adoption Temporal Patterns and COVID-19 Responsiveness, and the Correlation between Their Profile Factors and Activity Levels

The creation dates of the 23 governor accounts were analyzed to gain insights into the temporal patterns of their adoption of Twitter as a communication platform. The accounts were categorized into distinct time periods based on the dates they were created. The findings indicate that a significant number of governor accounts (12 out of 23) were established between July 2009 and January 2012, representing an initial surge in adoption during this period. Subsequently, there was a deceleration in the rate of adoption, with only four governor accounts created between January 2012 and July 2019. However, a noteworthy increase in account creation occurred between July 2019 and January 2022, with eight governor accounts being established during this interval. The temporal distribution of creation dates underscores the evolving understanding and utilization of Twitter by governors, underscoring their recognition of the platform’s value for engaging with the public and disseminating critical information during times of crisis. A similar pattern was revealed on the number of tweets in [16].
The initial dates on which governors mentioned COVID-19 in their Twitter accounts were examined and compared with the date of the first confirmed COVID-19 case in Japan. The analysis identified the top five governors who were most responsive on social media in addressing the pandemic. These governors, namely Yamanashi, Chiba, Wakayama, Osaka, and Tokyo, initiated discussions about COVID-19 in their tweets approximately 1, 8, 10, 14, and 14 days, respectively, prior to the first confirmed case in Japan on 16 January 2020. Similar findings were observed in [19], where the authors reported that most U.S. state governors started to mention COVID-19 in their tweets weeks before the first reported case in their states. On the other hand, the governors with the longest time intervals between their first COVID-19 tweet and the first confirmed case were Ehime, Niigata, Ishikawa, Tokushima, and Hyogo, with delays of about 1022, 858, 736, 590, and 468 days, respectively. However, it is important to note that this study focuses on Twitter as the chosen social media platform. Therefore, it is possible that other governors responded promptly to the COVID-19 situation using alternative social media platforms or other means of communication with the public. The findings highlight the varying degrees of responsiveness among governors on Twitter but should be interpreted within the context of the specific platform analyzed.
The analysis focused on the adoption of citizen engagement strategies in the COVID-19-related tweets posted by the governors. The findings indicate that a considerable proportion of the tweets incorporated various strategies. Specifically, 15.09% of the tweets included hashtags, allowing for better categorization and discoverability of the content. Similar patterns were reported in [19], where hashtags were used in more than half of the COVID-19-related tweets of the U.S. state governors. Furthermore, 24.62% of the tweets included at least one mention, facilitating direct communication and interaction with specific individuals or organizations. A high percentage of mentioning was reported in [19], where 54 percent of the U.S. state governors’ tweets included mentions. Moreover, 34.01% of the tweets included URLs, enabling the dissemination of additional information and resources through external websites. Lastly, 37.8% of the tweets included images, providing visual content to enhance engagement and improve the overall quality of the information shared. These findings underscore the notable adoption of engagement strategies by the governors, particularly the utilization of hashtags, mentions, URLs, and images. By incorporating these elements into their tweets, the governors aimed to enhance citizen interaction and improve the quality of the information provided.
To investigate the factors affecting the activity of governors on Twitter during the COVID-19 pandemic, we used the Spearman correlation coefficient. The outcomes of this analysis, illustrated in Figure 3, present correlations between variables. It is worth noting that any cells with p-values exceeding 0.05 were intentionally left empty. We observed a moderate positive correlation coefficient of 0.42 between the verified status of governor accounts and the number of friends they maintained. This suggests that verified accounts tend to cultivate a more extensive network of social connections. Additionally, we discovered a strong positive correlation coefficient of 0.74 between the verification status and follower count. In contrast, we noted a moderate negative correlation coefficient of −0.56 between the number of terms in office and the number of followers. This suggests that governors with lengthier tenures in office tend to accumulate a relatively smaller number of followers. Additionally, we observed a moderate positive correlation coefficient of 0.47 between the age of governors and the duration of their terms in office, indicating a tendency for older governors to serve longer tenures.

4.3. Citizen Engagement with Governors’ COVID-19 Tweets: Correlation Analysis of Engagement Metrics, and Optimal Tweet Scheduling

We examined the correlation between four engagement metrics by utilizing the Spearman correlation coefficient on our dataset of collected tweets. The results revealed robust positive correlations, with the number of likes showing a correlation of 0.9 with replies and 0.87 with quotes. Similarly, we found moderate positive correlations, with retweets exhibiting a correlation of 0.58 with likes, 0.62 with quotes, and 0.51 with replies. Additionally, replies and quotes displayed a correlation of 0.86. However, it is important to highlight that achieving a high value in one metric does not guarantee the same level of achievement in the other metrics, and vice versa. Each metric captures a distinct facet of engagement, influenced by different factors. Therefore, it is vital to assess and analyze each metric independently when evaluating tweet engagement, as recommended by [19].
To investigate the hypothesis that high citizen engagement on Twitter during the COVID-19 pandemic is guaranteed by being highly active on the platform or being a governor of a prefecture with a large population, we examined the top eight governors with the highest number of likes, retweets, replies, and quotes. These governors were compared in terms of their activity level and population size, as shown in Figure 4. Ranks were assigned to the governors based on their performance in each engagement metric, with a lower rank indicating a higher value compared to other governors and vice versa. The governor of Osaka prefecture demonstrated the highest engagement metrics, receiving the highest number of likes, retweets, replies, and quotes, indicating a strong level of engagement from Twitter users. Similarly, the governor of Tokyo prefecture obtained significant engagement across multiple metrics, despite not topping the list in terms of Twitter activity.
While the governors of Iwate and Gunma prefectures ranked second and third in terms of the activity level, they displayed low engagement values. Chiba and Hokkaido prefectures showed moderate levels of Twitter activity and engagement, with their governors consistently appearing in the rankings for various engagement metrics. Notably, the governor of Kanagawa prefecture demonstrated significant engagement, particularly in terms of replies and quotes, despite having the lowest Twitter activity level compared to other prefectures. Contrary to expectations, our findings suggest that being highly active on social media does not guarantee a high influence on citizens. Other factors need to be considered, which will be investigated in our next analysis.
Considering the impact of population size on citizen engagement, we observed variations across prefectures. Despite Tokyo having a larger population compared to Osaka, the total mean engagement values for Osaka’s tweets were significantly higher. Additionally, Aichi prefecture exhibited low citizen engagement rates despite its large population size and high activity level on Twitter. Both Gunma and Iwate prefectures, with their small population sizes, displayed lower engagement values. Kanagawa prefecture, despite its large population, showed very low levels of citizen engagement, which may be attributed to its low activity level on social media. Hokkaido and Chiba prefectures, with similar population sizes, showed moderate engagement values.
We examined the correlation between profile- and tweet-related features and the four engagement values derived from the dataset of COVID-19 tweets. The findings, presented in Figure 5, indicate a weak positive correlation between the letter count of tweets and the number of likes, replies, and quotes. This suggests that users are more likely to engage with detailed messages. Interestingly, a very weak negative correlation was found between the use of hashtags and the number of retweets, possibly due to competition or specific hashtag types. Furthermore, a moderate negative correlation was observed between the number of mentions in tweets and the number of likes, replies, and quotes. This could be attributed to tweets with many mentions having a narrower target audience, resulting in lower engagement from the wider Twitter community. Conversely, including URLs in tweets showed a weak positive correlation with higher engagement metrics, aligning with previous research. Surprisingly, the presence of pictures in tweets exhibited a weak negative correlation with the number of retweets, suggesting that picture quality or relevance may play a role. A moderate positive correlation was revealed between the population of the governed prefecture and engagement metrics, indicating higher engagement for governors in larger populations. In addition, the number of followers and verification status of governors’ accounts showed positive correlations with engagement, suggesting the influence of credibility and authenticity. It is important to note that these correlations provide valuable insights and an analysis is necessary to understand the underlying causes. A comprehensive understanding of these correlations requires interpretation and exploration beyond individual factors, considering complex relationships and potential cross-correlations among variables.
The analysis involved sorting the tweets based on their average sum of the four engagement metrics and examining the corresponding publishing times. These findings provide valuable insights into the optimal hours, days, weekdays, and months for maximizing engagement with governors’ tweets. The analysis revealed that tweets posted at 9 a.m., 11 a.m., and 8 a.m. received the highest cumulative engagement, suggesting the significance of these time slots in capturing citizen interaction. Furthermore, specific days were found to play a crucial role in engagement. The 1st, 22nd, and 14th of each month stood out as the top three days associated with the highest engagement levels. This highlights the importance of strategic tweet scheduling on these specific days to enhance cumulative engagement.
When it comes to weekdays, Wednesdays, Tuesdays, and Fridays emerged as the most favorable for achieving higher engagement. Carefully selecting these weekdays for tweet posting can lead to increased audience interaction and participation. In a similar study [19], the authors reported that more tweets by U.S. state governors were posted during weekdays compared to weekends and on days when the number of cases increases quickly. Regarding monthly engagement, April, May, and June were identified as the months with the highest levels of engagement. This suggests that there might be specific events during these months that attract more attention and engagement from Japanese citizens. It is crucial to note that these findings are based on the specific dataset analyzed and may not necessarily apply universally across different contexts. Additionally, the observed increased engagement during certain months and days could be influenced by notable COVID-19-related events. Exploring the impact of these events falls outside the scope of this study and is left for future research.

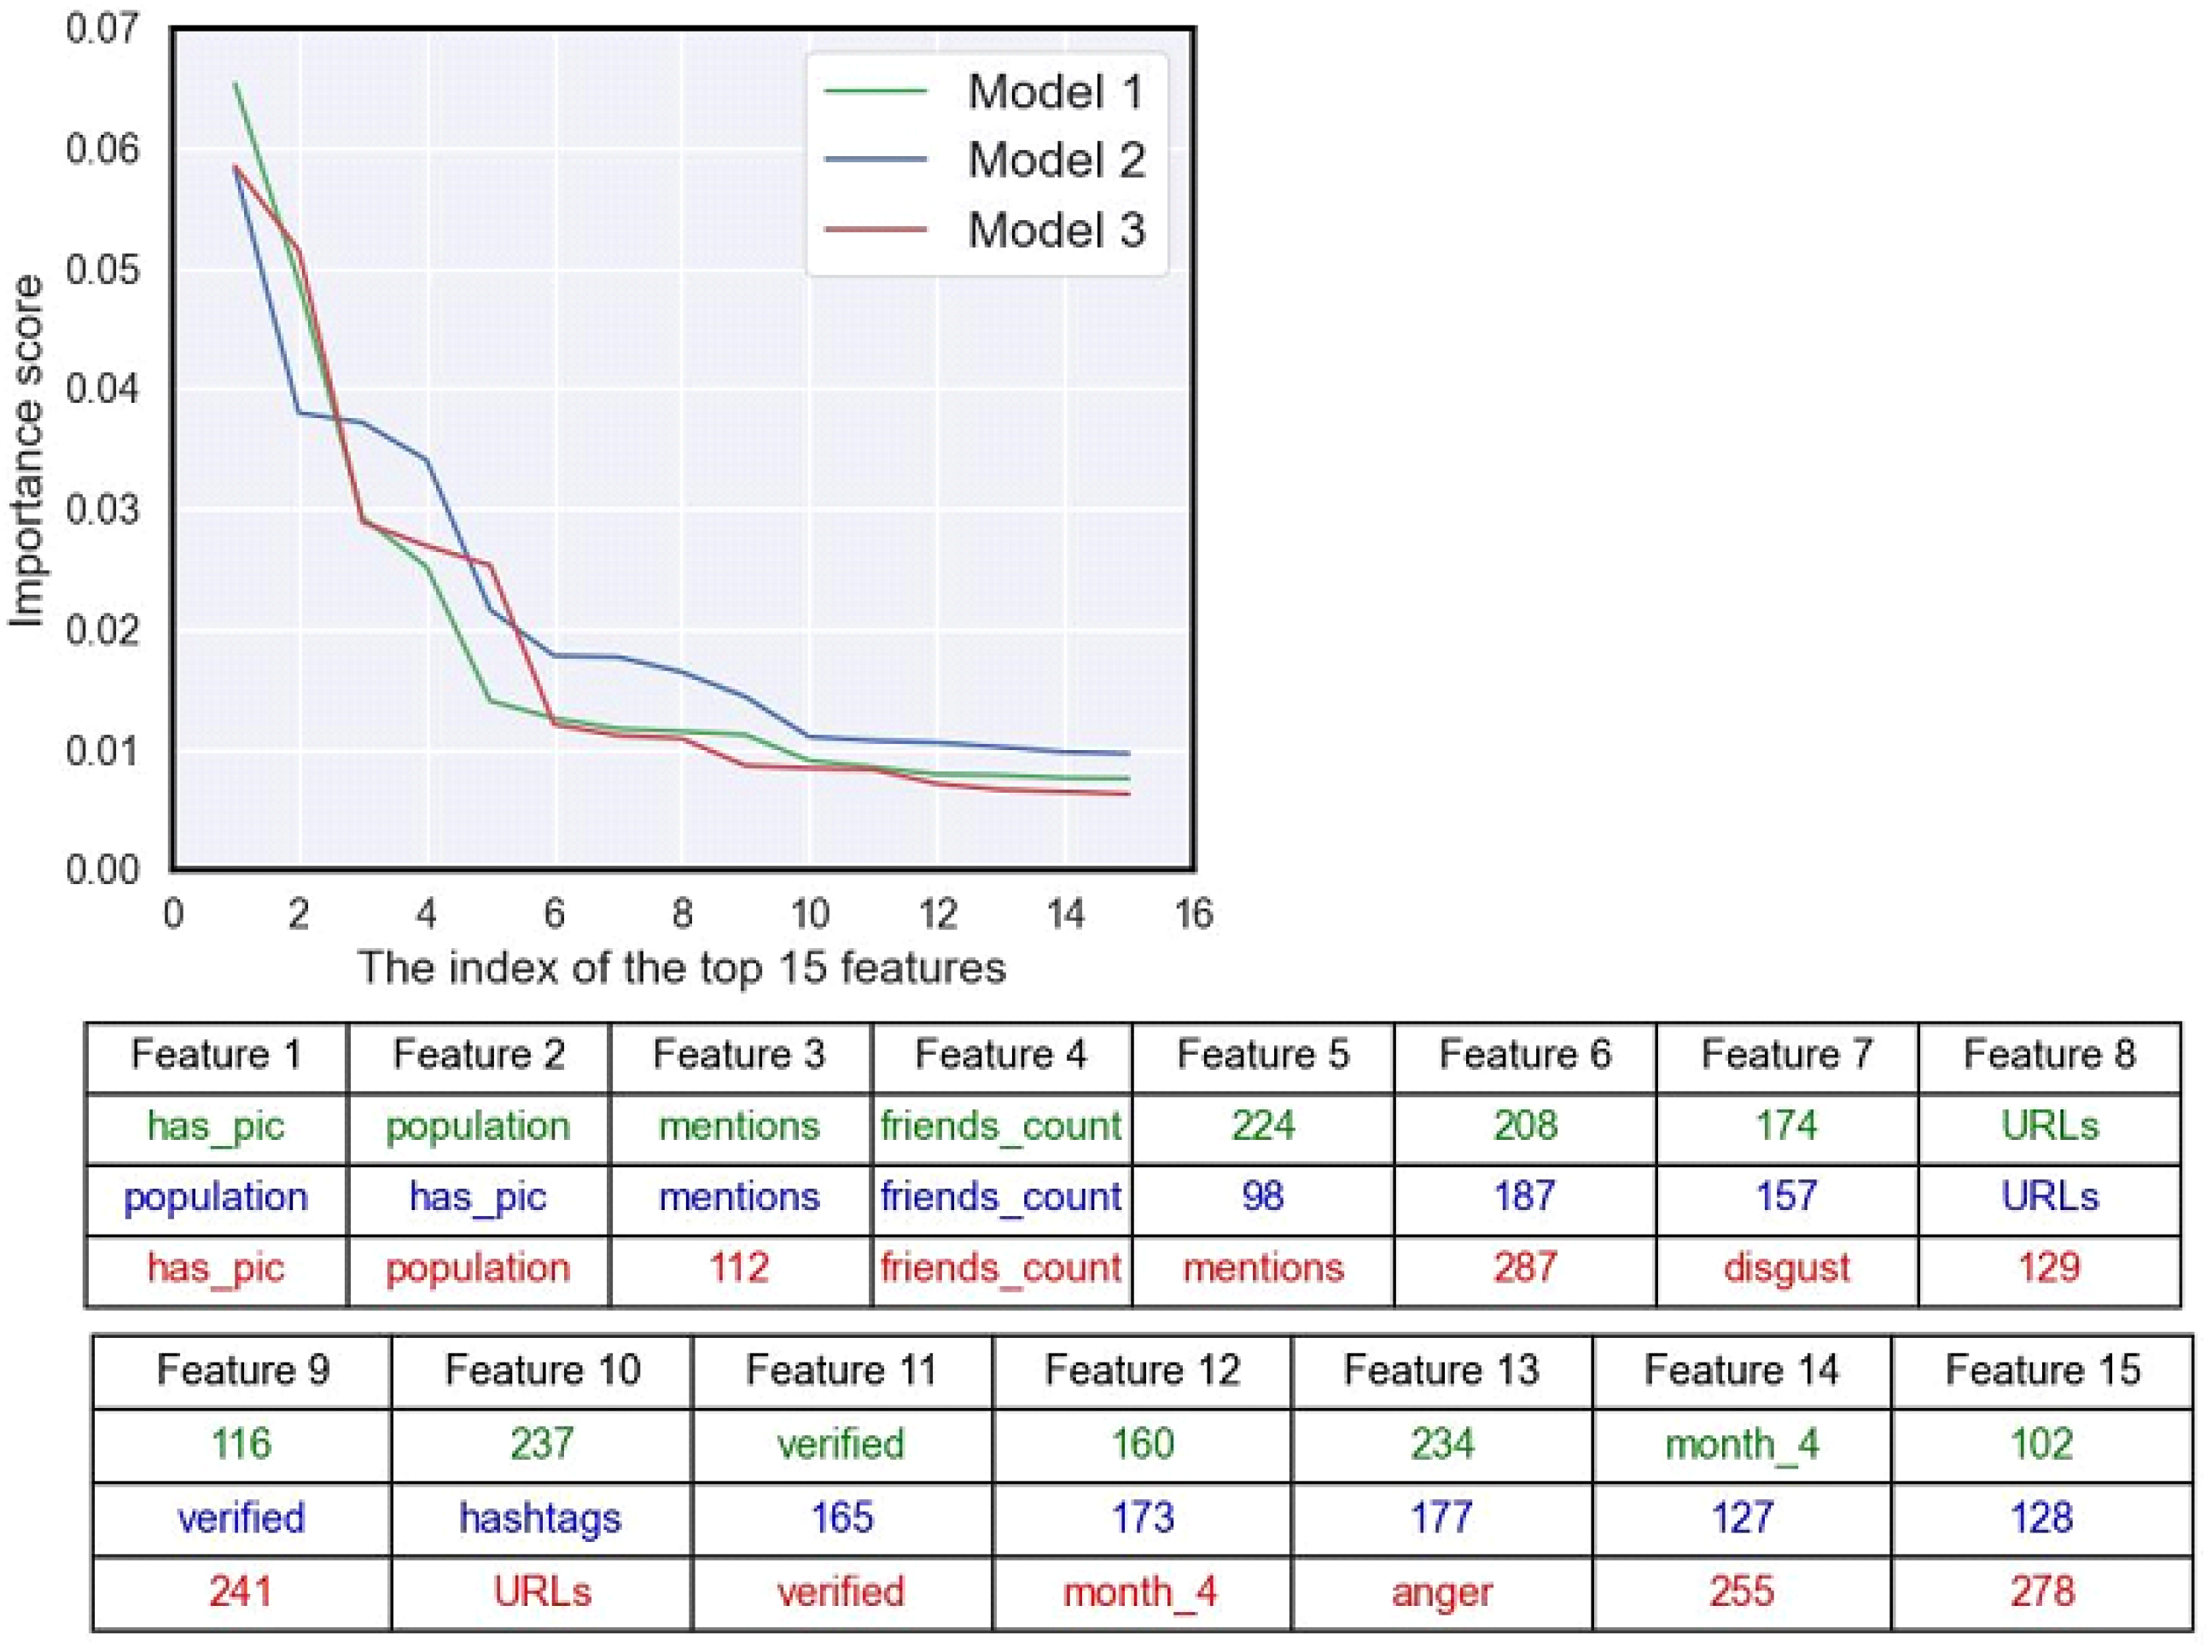
4.4. Predicting Citizen Engagement of COVID-19 Tweets: ML Models and Feature Analysis

To develop ML models capable of predicting citizen engagement of COVID-19-related tweets, each tweet was assigned a numerical value based on four engagement metrics, representing the engagement score (class). The dataset consisted of 6650 tweets labeled as low engaging, 6444 tweets labeled as medium engaging, and 5514 tweets labeled as highly engaging. Three feature sets were used to train the ML models:
  • Profile- and tweet-related features (feature set 1).
  • Word embeddings from models including Word2Vec [20], Glove [21], FastText [22], and BERT [23].
  • A combination of the first set with one of the embeddings.
Seven classifiers were employed, resulting in a total of 63 experiments. The performance of the models was evaluated using the accuracy, precision, recall, and F1-score, as summarized in Table 1. Logistic regression and naive bayes models consistently exhibited lower training and testing accuracies compared to other classifiers across various feature sets. This suggests that the assumption of feature independence, made by naive bayes, may not hold well for predicting citizen engagement with COVID-19-related tweets. Additionally, logistic regression models might suffer from underfitting the data. In contrast, decision tree, random forest, and XGBoost classifiers consistently demonstrated impressive performance across different feature sets, achieving high accuracy in the training, testing, validation, weighted average (Weig. avg.) precision, weighted average recall, and weighted average F1-score, as depicted in Table 1. Moreover, the KNN classifier demonstrated competitive performance in terms of accuracy measures.
Regarding word embeddings, Word2Vec consistently outperformed Glove, FastText, and BERT in terms of training accuracy, testing accuracy, and validation accuracy. This indicates that Word2Vec embeddings provided more meaningful representations for the machine learning models to learn from. However, the introduction of profile features to the word embeddings resulted in a significant reduction in performance when logistic regression and SVM classifiers were employed. Conversely, it improved the performance when used with other classifiers. Furthermore, XGBoost consistently achieved high training accuracy while maintaining good testing and validation accuracies across all feature sets, suggesting its effectiveness in capturing the engagement patterns within the data and predicting citizen engagement. Finally, decision tree, random forest, and XGBoost classifiers consistently demonstrated robust performance across multiple feature sets. Logistic regression, naive bayes, and SVM classifiers showed lower accuracy and less consistent performance compared to other classifiers. The incorporation of feature set 1 with word embeddings generally enhanced model performance, as evidenced by a higher accuracy, precision, recall, and F1-score compared to using feature set 1 or word embeddings alone. The combination of profile features with word embeddings and the use of XGBoost classifiers consistently yielded powerful performance, characterized by high accuracy and improved generalization compared to other classifiers, as indicated in Table 1.
The top three models for predicting citizen engagement scores, highlighted in bold in Table 1, based on governors’ COVID-19-related tweets are as follows:
  • Model 1: This model utilized feature set 1 with FastText embeddings and an XGBoost classifier. It achieved a training accuracy of 0.98, testing accuracy of 0.8, and validation accuracy of 0.8.
  • Model 2: This model utilized feature set 1 with Glove embeddings and an XGBoost classifier. It achieved a training accuracy of 0.98, testing accuracy of 0.79, and validation accuracy of 0.81.
  • Model 3: This model utilized feature set 1 with Word2Vec embeddings and an XGBoost classifier. It achieved a training accuracy of 0.98, testing accuracy of 0.79, and validation accuracy of 0.79.
Models 1 and 3 utilized a total of 393 features to predict citizen engagement, while Model 2 used 293 features. Among these features, the top 15 were identified and their weights are plotted in Figure 6. The accompanying table below the figure displays the weights for each feature, with features from Model 1 highlighted in green, features from Model 2 in blue, and features from Model 3 in red.
It is evident that feature set 1 plays a crucial role in predicting the engagement score, such as the population size; inclusion of pictures, mentions, and URLs; number of friends; and verification status. Furthermore, the numbers represented as features in these tables correspond to specific characteristics within the embedding’s representation of the tweets. Each feature in a given embedding signifies a unique aspect or trait of the text, and the numbers indicate the assigned indices within the embedding space. For instance, in Model 1, the number 224 (Feature 5) represents the index 224 in the TextFast embedding, while in Model 2, the number 98 (Feature 5) represents the index 98 in the Glove embedding. These findings underscore the significance of integrating embedding representations with feature set 1. Additionally, the tone of the language used in the tweets exerts a substantial influence on engagement. This is evident from the presence of disgust and anger values among the top 15 features of Model 3. These discoveries hold potential to guide future research and inform the development of more accurate prediction models, not only for COVID-19-related tweets but also for other domains related to crisis communication.

5. Conclusions and Future Work

This study examined the Twitter activity and citizen engagement strategies of governors during the COVID-19 pandemic. We analyzed 18,608 tweets from 23 governor accounts, focusing on engagement metrics, profile characteristics, and temporal patterns. The findings demonstrated significant variations in Twitter activity among governors, with the governor of Aichi prefecture displaying the highest level of activity. Verified accounts were more likely to exhibit higher levels of activity, indicating a strong association between activity and verification status. The number of followers and friends varied among governors, with the governor of Osaka having the highest follower count and the governor of Chiba having the most friends. While population size seemed to influence follower count to some extent, other factors such as engagement strategies and content quality likely played a significant role. The temporal analysis revealed a notable increase in governor account creation during the pandemic, highlighting the growing recognition of social media as a communication platform.
The responsiveness of governors in addressing COVID-19 on Twitter varied. The top five governors with the quickest reactions on Twitter were identified, while others had significant delays in mentioning COVID-19. However, it is important to consider that governors might have used other communication channels as well. Governors widely adopted citizen engagement strategies, with the frequent inclusion of hashtags, mentions, URLs, and images in their tweets. These strategies aimed to enhance interaction and improve the quality of information shared. The correlation analysis revealed positive associations between verified accounts and the number of friends, followers, and tweets. Active social media involvement was linked to larger follower counts. A positive correlation was also observed between the number of friends, number of followers, and number of tweets, emphasizing the importance of maintaining a social network and consistent communication.
In the development of ML models for predicting citizen engagement of COVID-19-related tweets, three sets of features were utilized: profile- and tweet-related features, word embeddings from popular models, and a combination of the two. We trained and evaluated seven classifiers, identifying the top-performing three models and providing insights into the potential for predicting engagement levels. Overall, this research provides valuable insights into the engagement patterns and strategies employed by Japanese governors on Twitter during the COVID-19 pandemic. The findings have the potential to inform policymakers about effective social media practices and ML models that can enhance citizen engagement during times of crisis. Future research directions could focus on analyzing the context of tweets, conducting word analyses and topic modeling, exploring network analyses, and examining the correlation between the number of COVID-19 cases and governors’ activity on Twitter or citizen engagement metrics. One limitation of this work is that the accuracy of our models may have been affected by using the Google Translate API, which can introduce translation errors for certain Japanese tokens. Nevertheless, the manual examination of translated text demonstrated relatively high performance. Future research may explore more robust translation techniques for improved validity and accuracy. Finally, one possible future research direction is to adapt the proposed approach in analyzing citizen engagement for COVID-19-related tweets across different settings, languages, geographical locations, and cultures.

Author Contributions

Conceptualization, S.S. and V.P.S.; methodology, S.S. and V.P.S.; validation, V.P.S. and T.K.; data collection, V.P.S. and S.S.; writing—original draft preparation, S.S.; writing—review and editing, V.P.S. and T.K.; supervision, T.K.; project administration, T.K.; funding acquisition, T.K. All authors have read and agreed to the published version of the manuscript.

Funding

This work was supported by the Japan Society for the Promotion of Science (JSPS) through the KAKENHI Grant Number 20H05633.

Data Availability Statement

The data that support the findings of this study are available from the corresponding author upon reasonable request.

Conflicts of Interest

The authors declare no conflicts of interest.

References

  1. Situation Report. Available online: https://www.mhlw.go.jp/stf/covid-19/kokunainohasseijoukyou_00006.html (accessed on 3 June 2023).
  2. Lee, H.; Noh, E.B.; Choi, S.H.; Zhao, B.; Nam, E.W. Determining Public Opinion of the COVID-19 Pandemic in South Korea and Japan: Social Network Mining on Twitter. Healthc. Inform. Res. 2020, 26, 335–343. [Google Scholar] [CrossRef] [PubMed]
  3. Huang, X.; Wang, S.; Zhang, M.; Hu, T.; Hohl, A.; She, B.; Gong, X.; Li, J.; Liu, X.; Gruebner, O.; et al. Social Media Mining under the COVID-19 Context: Progress, Challenges, and Opportunities. Int. J. Appl. Earth Obs. Geoinf. 2022, 113, 102967. [Google Scholar] [CrossRef] [PubMed]
  4. Tsao, S.-F.; Chen, H.; Tisseverasinghe, T.; Yang, Y.; Li, L.; Butt, Z.A. What Social Media Told Us in the Time of COVID-19: A Scoping Review. Lancet Digit. Health 2021, 3, e175–e194. [Google Scholar] [CrossRef] [PubMed]
  5. Lin, X.; Spence, P.R.; Sellnow, T.L.; Lachlan, K.A. Crisis Communication, Learning and Responding: Best Practices in Social Media. Comput. Hum. Behav. 2016, 65, 601–605. [Google Scholar] [CrossRef]
  6. Qorib, M.; Oladunni, T.; Denis, M.; Ososanya, E.; Cotae, P. COVID-19 Vaccine Hesitancy: Text Mining, Sentiment Analysis and Machine Learning on COVID-19 Vaccination Twitter Dataset. Expert Syst. Appl. 2023, 212, 118715. [Google Scholar] [CrossRef] [PubMed]
  7. Chon, M.-G.; Kim, S. Dealing with the COVID-19 Crisis: Theoretical Application of Social Media Analytics in Government Crisis Management. Public Relat. Rev. 2022, 48, 102201. [Google Scholar] [CrossRef] [PubMed]
  8. Wang, L.L.; Lo, K. Text Mining Approaches for Dealing with the Rapidly Expanding Literature on COVID-19. Brief. Bioinform. 2021, 22, 781–799. [Google Scholar] [CrossRef] [PubMed]
  9. Moffitt, J.D.; King, C.; Carley, K.M. Hunting Conspiracy Theories during the COVID-19 Pandemic. Soc. Media + Soc. 2021, 7, 20563051211043212. [Google Scholar] [CrossRef]
  10. Duan, H.K.; Vasarhelyi, M.A.; Codesso, M.; Alzamil, Z. Enhancing the Government Accounting Information Systems Using Social Media Information: An Application of Text Mining and Machine Learning. Int. J. Account. Inf. Syst. 2023, 48, 100600. [Google Scholar] [CrossRef]
  11. Lyu, H.; Wang, J.; Wu, W.; Duong, V.; Zhang, X.; Dye, T.D.; Luo, J. Social Media Study of Public Opinions on Potential COVID-19 Vaccines: Informing Dissent, Disparities, and Dissemination. Intell. Med. 2022, 2, 1–12. [Google Scholar] [CrossRef]
  12. Biradar, S.; Saumya, S.; Chauhan, A. Combating the Infodemic: COVID-19 Induced Fake News Recognition in Social Media Networks. Complex Intell. Syst. 2023, 9, 2879–2891. [Google Scholar] [CrossRef]
  13. John, S.A.; Keikhosrokiani, P. Chapter 17—COVID-19 Fake News Analytics from Social Media Using Topic Modeling and Clustering. In Big Data Analytics for Healthcare; Keikhosrokiani, P., Ed.; Academic Press: Cambridge, MA, USA, 2022; pp. 221–232. ISBN 978-0-323-91907-4. [Google Scholar]
  14. Boghiu, Ș.; Gîfu, D. A Spatial-Temporal Model for Event Detection in Social Media. Procedia Comput. Sci. 2020, 176, 541–550. [Google Scholar] [CrossRef] [PubMed]
  15. Rufai, S.R.; Bunce, C. World Leaders’ Usage of Twitter in Response to the COVID-19 Pandemic: A Content Analysis. J. Public Health 2020, 42, 510–516. [Google Scholar] [CrossRef] [PubMed]
  16. Slavik, C.E.; Buttle, C.; Sturrock, S.L.; Darlington, J.C.; Yiannakoulias, N. Examining Tweet Content and Engagement of Canadian Public Health Agencies and Decision Makers During COVID-19: Mixed Methods Analysis. J. Med. Internet Res. 2021, 23, e24883. [Google Scholar] [CrossRef] [PubMed]
  17. Tang, L.; Liu, W.; Thomas, B.; Tran, H.T.N.; Zou, W.; Zhang, X.; Zhi, D. Texas Public Agencies’ Tweets and Public Engagement During the COVID-19 Pandemic: Natural Language Processing Approach. JMIR Public Health Surveill. 2021, 7, e26720. [Google Scholar] [CrossRef] [PubMed]
  18. Chen, Q.; Min, C.; Zhang, W.; Ma, X.; Evans, R. Factors Driving Citizen Engagement with Government TikTok Accounts During the COVID-19 Pandemic: Model Development and Analysis. J. Med. Internet Res. 2021, 23, e21463. [Google Scholar] [CrossRef] [PubMed]
  19. Gong, X.; Ye, X. Governors Fighting Crisis: Responses to the COVID-19 Pandemic across U.S. States on Twitter. Prof. Geogr. 2021, 73, 683–701. [Google Scholar] [CrossRef]
  20. Mikolov, T.; Chen, K.; Corrado, G.; Dean, J. Efficient Estimation of Word Representations in Vector Space. arXiv 2013, arXiv:1301.3781. [Google Scholar]
  21. Pennington, J.; Socher, R.; Manning, C.D. Glove: Global Vectors for Word Representation. In Proceedings of the 2014 Conference on Empirical Methods in Natural Language Processing (EMNLP), Doha, Qatar, 25–29 October 2014; pp. 1532–1543. [Google Scholar]
  22. Bojanowski, P.; Grave, E.; Joulin, A.; Mikolov, T. Enriching Word Vectors with Subword Information. Trans. Assoc. Comput. Linguist. 2017, 5, 135–146. [Google Scholar] [CrossRef]
  23. Devlin, J.; Chang, M.-W.; Lee, K.; Toutanova, K. BERT: Pre-Training of Deep Bidirectional Transformers for Language Understanding. arXiv 2019, arXiv:1810.04805. [Google Scholar]
Figure 1. Governors’ twitter activity: top 15 prefectures and verification status.
Informatics 11 00017 g001
Figure 2. The number of followers compared to population size for the top eight most active governors.
Informatics 11 00017 g002
Figure 3. Correlation results between governors’ profile features and activity level during the COVID-19 pandemic.
Informatics 11 00017 g003
Figure 4. Citizen engagement of top eight governors: examining activity and population impact during COVID-19.
Informatics 11 00017 g004
Figure 5. The correlation analysis of profile and tweet features with the four engagement metrics.
Informatics 11 00017 g005
Figure 6. Feature weights analysis of the top 15 features in the top three models.
Informatics 11 00017 g006
Table 1. Performance evaluation of ML models for predicting citizen engagement.
FeaturesClassifierTraining AccuracyTesting
Accuracy
Validation AccuracyWeig. Avg. PrecisionWeig. Avg. RecallWeig. Avg. F1-Score
Feature Set 1Log. reg.0.4750.4720.4850.310.4720.374
Dec. tree10.750.7480.7510.750.75
Rand. forest10.7750.7770.7770.7750.774
SVM0.5980.580.5960.5960.580.557
KNN0.8180.7220.7310.7270.7220.723
Naive bayes0.5690.560.580.5780.560.564
XGBoost0.9460.7920.7880.7940.7920.792
Word2VecLog. reg.0.6810.6570.6620.6570.6570.656
Dec. tree0.960.5980.6130.5980.5980.597
Rand. forest0.960.6840.7070.6830.6840.683
SVM0.7650.7130.7210.7130.7130.712
KNN0.7890.6930.7070.6940.6930.692
Naive bayes0.5560.5210.5340.530.5210.52
XGBoost0.9590.7070.7220.7060.7070.705
GloveLog. reg.0.6670.6630.6530.6620.6630.662
Dec. tree0.960.6270.6170.6260.6270.626
Rand. forest0.960.6780.6960.6770.6780.677
SVM0.7050.6790.6910.6770.6790.676
KNN0.7790.6750.6890.6760.6750.674
Naive bayes0.5620.5340.550.5440.5340.534
XGBoost0.960.7020.710.7010.7020.701
FastTextLog. reg.0.6740.6520.6630.6510.6520.649
Dec. tree0.960.6180.6160.6180.6180.618
Rand. forest0.960.680.6970.6790.680.679
SVM0.7160.6820.7010.6830.6820.681
KNN0.7870.6950.7040.6950.6950.695
Naive bayes0.5650.5230.5580.5340.5230.522
XGBoost0.960.690.7250.690.690.69
BERTLog. reg.0.670.6410.6560.6410.6410.639
Dec. tree0.9620.6020.6070.6020.6020.602
Rand. forest0.9620.680.6820.680.680.678
SVM0.6360.6060.6290.6170.6060.603
KNN0.7650.6570.6790.6580.6570.656
Naive bayes0.4740.4680.4830.4850.4680.412
XGBoost0.9610.7050.6980.7040.7050.704
Feature Set 1 + Word2VecLog. reg.0.4750.4720.4850.310.4720.374
Dec. tree10.7330.7380.7350.7330.734
Rand. forest10.7570.7660.7570.7570.755
SVM0.5980.580.5960.5960.580.557
KNN0.8240.7270.7420.7320.7270.727
Naive bayes0.5690.560.580.5780.560.564
XGBoost0.9820.790.7920.7920.790.79
Feature Set 1 + GloveLog. reg.0.4750.4720.4850.310.4720.374
Dec. tree10.7080.7250.7070.7080.707
Rand. forest10.7570.7750.7570.7570.754
SVM0.5980.580.5960.5960.580.557
KNN0.8320.7440.7580.7480.7440.745
Naive bayes0.5690.560.580.5780.560.564
XGBoost0.9840.7940.8090.7950.7940.793
Feature Set 1+ FastTextLog. reg.0.4750.4720.4850.310.4720.374
Dec. tree10.7080.7250.7070.7080.707
Rand. forest10.7570.7750.7570.7570.754
SVM0.5980.580.5960.5960.580.557
KNN0.8320.7440.7580.7480.7440.745
Naive bayes0.5690.560.580.5780.560.564
XGBoost0.9840.7950.80.7950.7950.794
Feature Set 1 + BERTLog. reg.0.4750.4720.4850.310.4720.374
Dec. tree10.6930.7140.7040.7040.704
Rand. forest10.7310.7290.7190.7180.715
SVM0.5980.580.5960.5960.580.557
KNN0.8280.7430.7490.7470.7430.743
Naive bayes0.5690.560.580.5780.560.564
XGBoost0.9830.7830.7820.7840.7830.783
KNNs: K-Nearest Neighbors.
Disclaimer/Publisher’s Note: The statements, opinions and data contained in all publications are solely those of the individual author(s) and contributor(s) and not of MDPI and/or the editor(s). MDPI and/or the editor(s) disclaim responsibility for any injury to people or property resulting from any ideas, methods, instructions or products referred to in the content.

