Article

Analyzing Spatiotemporal Anomalies through Interactive Visualization

1
Department of Computer Science, Central Michigan University, Mount Pleasant, MI 48859, USA
2
State Key Laboratory of Computer Science, Institute of Software, Chinese Academy of Sciences, Beijing, 100190, China
3
IBM Research, Beijing, 100193, China
*
Author to whom correspondence should be addressed.
Informatics 2014, 1(1), 100-125; https://doi.org/10.3390/informatics1010100
Submission received: 24 February 2014 / Revised: 23 April 2014 / Accepted: 21 May 2014 / Published: 3 June 2014
(This article belongs to the Special Issue Interactive Visualizations: Design, Technologies, and Applications)

Abstract

:
As we move into the big data era, data grows not just in size, but also in complexity, containing a rich set of attributes, including location and time information, such as data from mobile devices (e.g., smart phones), natural disasters (e.g., earthquake and hurricane), epidemic spread, etc. We are motivated by the rising challenge and build a visualization tool for exploring generic spatiotemporal data, i.e., records containing time location information and numeric attribute values. Since the values often evolve over time and across geographic regions, we are particularly interested in detecting and analyzing the anomalous changes over time/space. Our analytic tool is based on geographic information system and is combined with spatiotemporal data mining algorithms, as well as various data visualization techniques, such as anomaly grids and anomaly bars superimposed on the map. We study how effective the tool may guide users to find potential anomalies through demonstrating and evaluating over publicly available spatiotemporal datasets. The tool for spatiotemporal anomaly analysis and visualization is useful in many domains, such as security investigation and monitoring, situation awareness, etc.

1. Introduction

Data that contains location and time information exists everywhere. As we move to the internet of things (IoT), many devices (smart phones and sensors) may report data back with the most recent value at a specific location and time. Stationary spots (such as weather station) record multidimensional data at a time interval. Others, like computer servers and data centers, may log their performance data (e.g., number of traffic flows, system load, intrusion alerts, etc.) with time/location information. Even more challenging, the locations may change over time. For example, natural disasters, like hurricane, tornado and earthquake, may move along a path, while diseases may spread across regions over time carried by the movement of water, air and people.
Monitoring and understanding spatiotemporal data is nevertheless challenging, because the data not only grows quickly in size, but also becomes more complex in nature. This is further complicated by the fact that the data values are usually very dynamic, meaning they usually change not only across regions, but over time, as well. It is difficult for humans to understand the dynamics and correlation of events between time and space.
While data mining and machine learning approaches on spatiotemporal data [1,2,3,4,5,6,7] are useful, there is a gap between the data mining results and the interpretation of results, particularly in the domain of anomaly detection and situation awareness, where users usually want a more intuitive interface to view these relationships. In addition, the possible combinations of attributes grow exponentially, thus the computational complexity for the data mining approach may become infeasible to examine large and complex datasets. Having a visual interface may help to greatly reduce the computation space and allow human operators to make a decision in a shorter time.
Analyzing spatial data, such as geographic visualization [8], is a good starting point. However, visualizing the spatial information alone does not take into consideration the causal relationships among events. Spatiotemporal visualization [9,10,11,12,13] has been proven useful in analyzing such data. Nevertheless, some spatiotemporal visualization is quite complex and requires a fairly steep learning curve. Some visual designs only work on specific types of data. Many visualizations focus on aesthetics rather than being geared towards analyzing the anomalies and simplicity. Since investigators under situation awareness scenarios are most interested in detecting the areas where changes of values are abnormal compared to the past and their neighbors, existing solutions are less effective to complete the task.
To that end, we developed a general visualization tool to analyze the spatiotemporal anomalies. This work is motivated by a simple task, i.e., given only a longitude/latitude (or x/y) location and a timestamped value at that location, can we find which location is abnormal without much a priori knowledge? To make it more challenging, there could be multiple attributes, or vectors, of values. How can we relate the value at each location to its neighbor’s value (spatial), and how does the value change over time (temporal)?
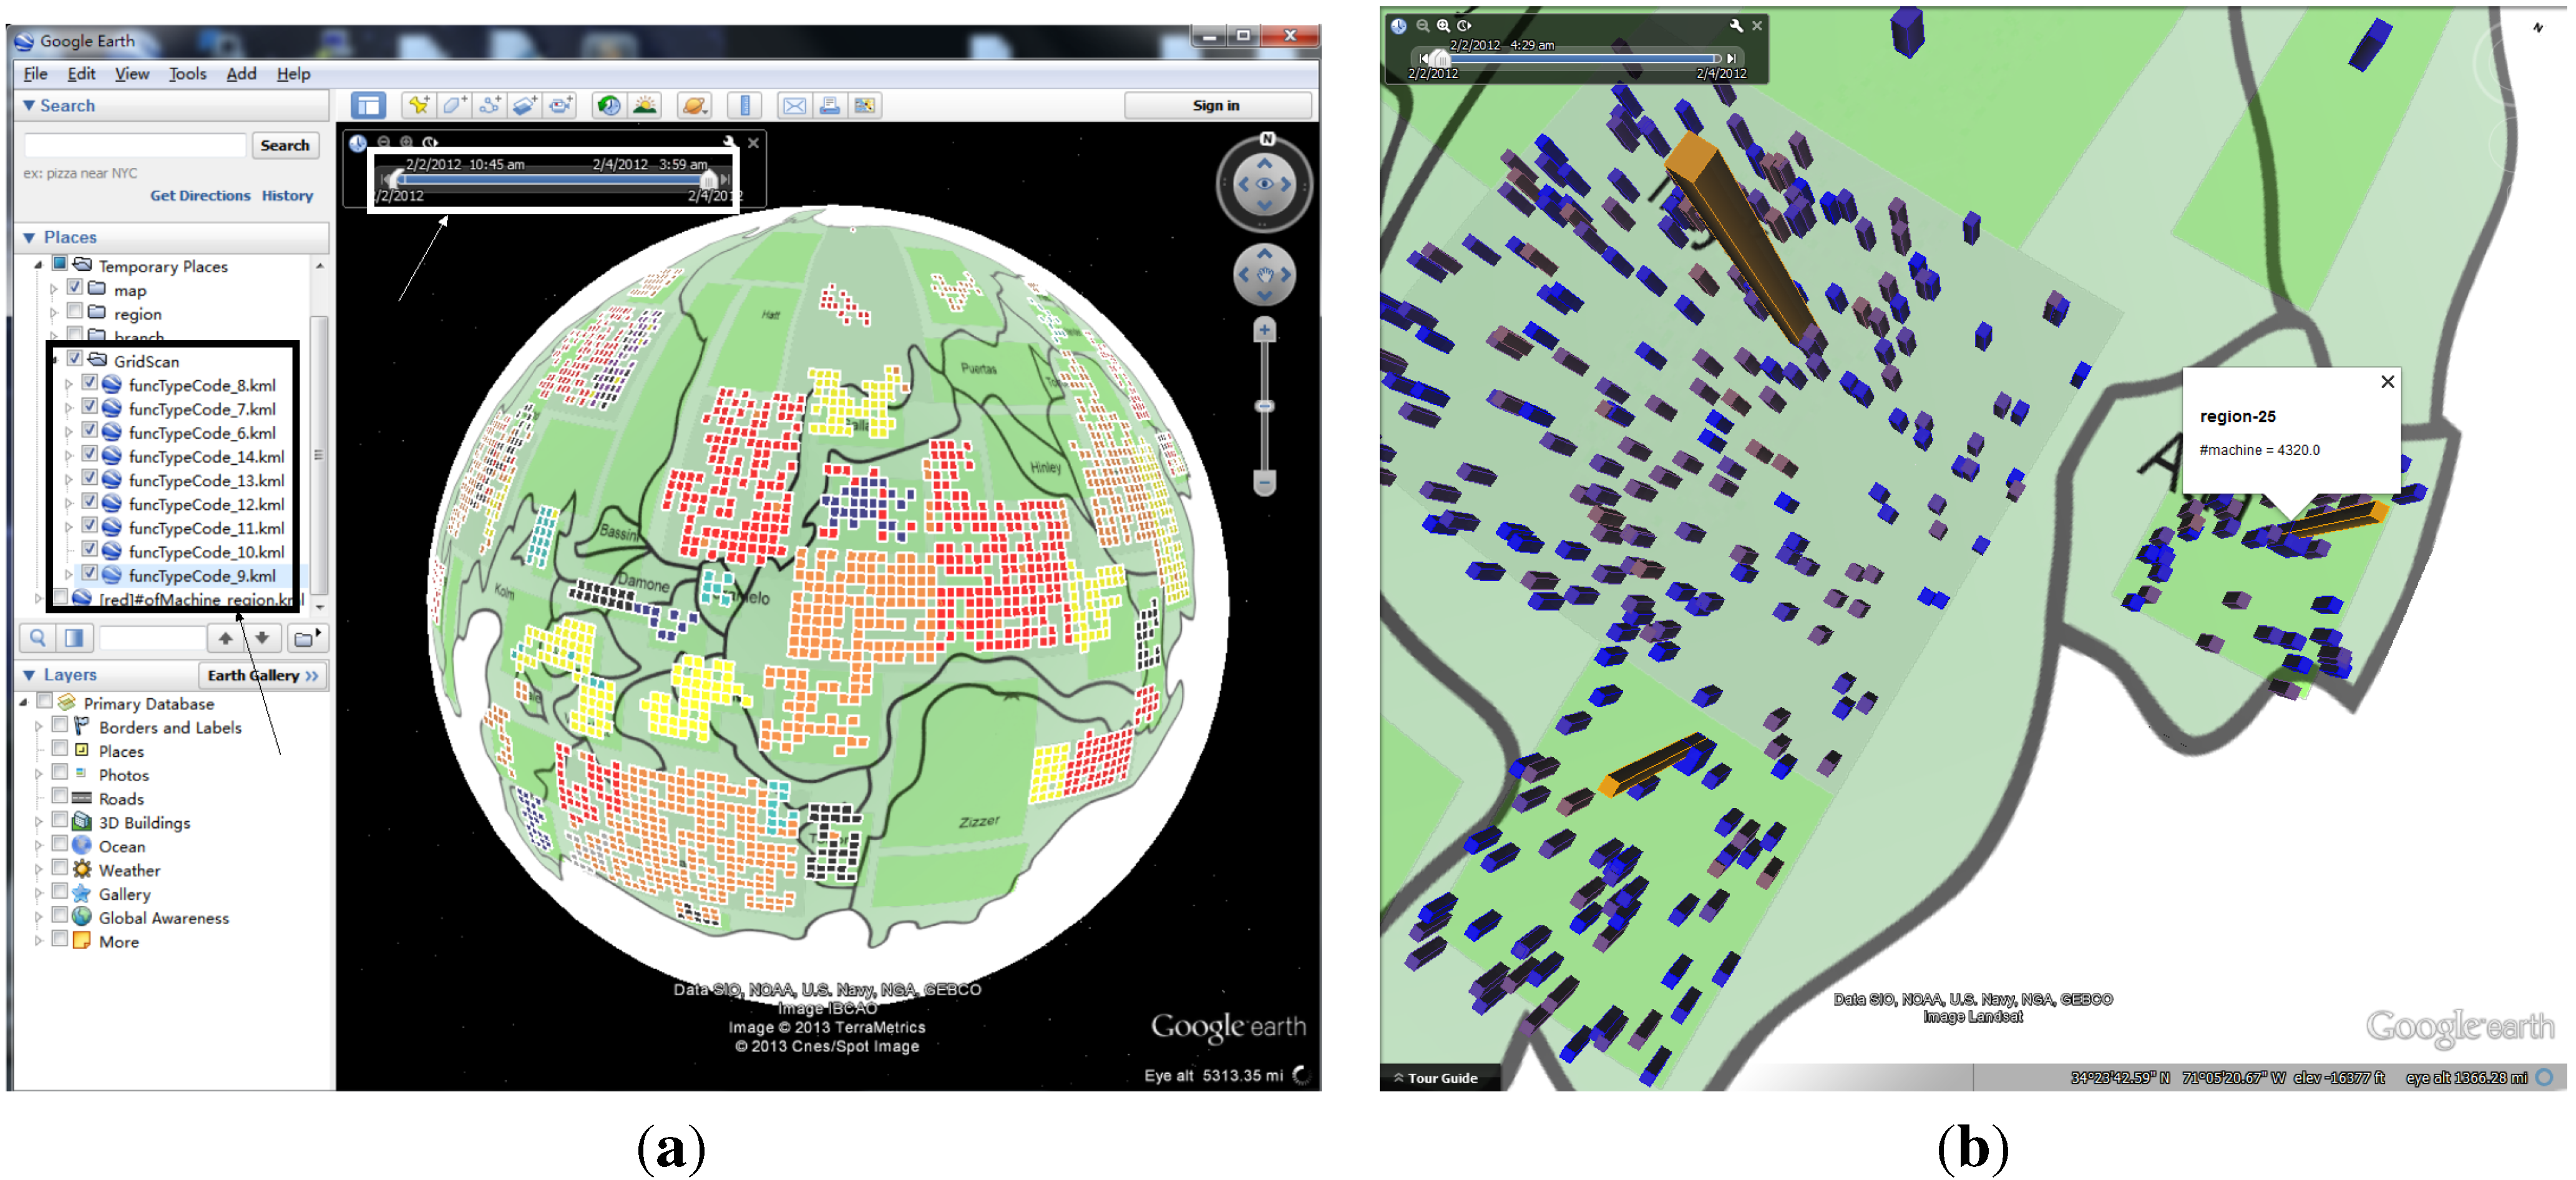
While the design principle of the tool is to make it general enough for many types of spatiotemporal data, one particular scenario of the possible application of the tool is network management. A network manager or system administrator can use the tool to gain a quick look at the current network health and find any place (data centers, servers, routers, hosts, etc.) exhibiting abnormal usage patterns, possibly due to malicious attacks, misconfiguration or hardware fault. Besides security investigation, the tool may also be useful for troubleshooting and debugging purposes. The visual analytic tool (Figure 1) allows investigators to interactively explore spatiotemporal datasets and analyze their anomalous changes. The system is built on top of a popular geographic information system (GIS), i.e., Google Earth (GE), and utilizes a generic data format, i.e., Keyhole Markup Language (KML).
Figure 1. An overview of the spatiotemporal anomaly analytic tool. The filter (black box) and time slider (white box) allow interactive exploration of the evolution of multi-dimensional attributes. The map supports drag, spin, zoom and pan. Anomalous activities can be visually canalized through 2D grids (a) and 3D bars (b). (a) The main visualization on spatiotemporal anomalous analysis; (b) zoomed-in view with anomaly bars in regions.
Informatics 01 00100 g001
Our contribution lies in spatiotemporal anomaly detection by studying the effectiveness of various combinations of 2D/3D visual objects and spatiotemporal data analysis (clustering) using an interactive system. Unlike traditional geographic visualization, we introduce visual cues that can help users understand the correlation of anomalous events. In particular, we adopt visual schemes, such as 3D anomaly bars of different color and size, for representing the value dynamics at different locations. Bars are intuitive to users and can effectively utilize the unused space above the map. Depending on the ways to construct the bars, one can calculate the anomalous scores that can be used to encode the properties of bars. Colors of bars may represent different attributes/dimensions of data. Users can drag, spin, zoom and pan, click for queries or adjust time sliders to investigate events within a particular time window.
In addition, in order to bring some level of automation into visual analysis, we allow the tool to take outputs from spatiotemporal data mining techniques, in particular detecting significant spatiotemporal changing patterns (over-density and/or under-density clusters) through GridScan [14]. The irregularly-shaped clusters are encoded as 2D anomaly grids superimposed on the cartographic layer of the map to guide users to interesting areas that can potentially be anomalous. Such anomaly grids and bars can be used together for better understanding of spatiotemporal anomalies. The interactive nature of the tool allows users to work on different levels of granularity during the investigation process. Through case studies on publicly available dataset of a large enterprise network and Air Quality Index data, we demonstrate the potential usefulness of the visualization tool. Due to its generality, the proposed spatiotemporal anomaly analytic system may be applied to other domains related to situation awareness.
The rest of this paper is organized as follows. Section 2 discusses the related work. Section 3 describes the architecture of the system, data processing, analysis and visualization design. Specifically, algorithms for encoding and analyzing anomalies are discussed. Section 4 evaluates the proposed visualization over publicly available datasets. Finally, Section 5 concludes our work.

2. Related Work

Visual analytics [15] has been valuable in exploring and analyzing general data. Many complex datasets contain spatial information, as pointed out by [16], which stresses the need for the closer integration of three largely disparate technologies: geographic visualization, knowledge discovery and geo-computation. Part of this work is related to geographic visualization [8], which focuses on the visualization on spatial data. Many real-world spatial data also have time attributes associated with them, i.e., spatiotemporal data. We try to create an interactive environment for users to analyze anomalies in spatiotemporal data.
Spatial-temporal data has become increasingly popular and challenging to understand and analyze. Spatiotemporal visualization [9,10,11,12,13] is becoming an important research topic. Among them, Whisper [11] examines information diffusion in social media and microblogging for spatiotemporal patterns through the structure of a sunflower. GeoSTAT [10] is a web-based tool for visual analysis of spatiotemporal data over a map layer. In addition, spatio-temporal visualization can be achieved through time wheels, a space-time cube or a time-series graph linked to a map [9]. As in a survey [17] on the techniques and tools for visual exploratory analysis of spatiotemporal data, spatiotemporal data can be categorized according to the types of changes over time, e.g., existential (appearance/disappearance), spatial properties (locations) and the values of attributes (increase/decrease). A hybrid particle and texture-based approach [18] was proposed for the visualization of time-dependent vector fields. In addition, a web-based cartographic system [19] was designed for the interactive spatial analysis of social data using the potential smoothing method. Visual analysis on spatiotemporal data has been applied to social media content [20]. Visualization for analyzing movement and trajectory data has been proposed by using clustering and classification [21] and stacking trajectory bands [22]. Parallel coordinates were applied in geographic context to visualize categoric spatiotemporal data [1].
Many visualization techniques for complex event analysis are restricted to one single dimension, e.g., time, geography or network connectivity. To counter that, GeoTime [23] visualizes the spatial inter-connectedness over time and geography in an interactive 3D view with 3D timelines imposed on the geographic map. While well-designed 2D displays may be sufficient to present an extra dimension of information [24], benefits have been proposed for moving from 2D to 3D geographical visualization [25], e.g., using 3D arc maps [26] and 3D heat maps [27]. The benefits include additional display space, data variables and a familiar view of the world. When a flat 3D map and spinning/interaction are possible, 3D can perform better than 2D with a space time cube [28]. 3D pencil and helix icons [13] over maps have been adopted for visualizing spatio-temporal data, in which the icons are used to show the temporal attributes of data. Furthermore, stacking dots and lines in 3D [12] have shown usefulness in adjunct to 2D visualization. In exploring possible visual solution to the IEEE Conference on Visual Analytics Science and Technology (VAST 2012) challenge, M-Sieve [29] combines a map view, attribute explorer and treemap views. While a spatially ordered treemap layout [30] may be used to visualize the spatiotemporal data, the treemap view may be less intuitive for geographic data. This work is based on our previous VAST challenge work [31] by studying the effect of combining 2D spatiotemporal anomaly grids in addition to 3D anomaly bars.
There has been research on data mining on spatial, temporal and spatial-temporal data [2]. Spatiotemporal datasets capture changing values of spatial and thematic attributes over a period of time. An event is usually defined as a spatial and temporal phenomenon that happens at a certain time and a certain location, e.g., an earthquake, hurricane or disease outbreak, etc. Spatiotemporal data mining [3] may involve analyzing spatiotemporal topological relationship patterns, neighborhood, association rules, clustering, movement patterns and outlier analysis. One way to mine spatiotemporal patterns is to find the most frequently occurred sequences of events [4] and to use a depth-first-search-like approach for the fast discovery of long sequential patterns in spatiotemporal datasets. In addition, association rule mining [6] may be applied to spatio-temporal data.
In particular, Compieta et al. [7] analyzed the large spatiotemporal data using spatial association rules based on a priori algorithms and then displayed the mining outcomes combined with a Google Earth map. Their main objective was to predict hurricane Isabel (IEEE Visualization 2004 contest). Algorithms have been developed for discovering moving clusters in spatiotemporal trajectory data [21,32,33,34]. Some objects’ movement obeys periodic patterns over regular time intervals. Spatiotemporal periodic pattern mining [5] is used to retrieve maximal periodic patterns using a specialized index structure for pruning purposes. Therefore, time range queries can be answered efficiently. Spatiotemporal clustering methods, such as SaTScan [35] and GridScan [14], have also been developed to analyze such data. A discretized spatiotemporal scan [36] considers anomalous spatiotemporal windows as a set of contiguous spatial points across various temporal points that are unusual. In spatiotemporal scan statistics [37], the window shape is cylindrical.

3. Spatiotemporal Data Analysis and Visualization

In this section, we begin by describing our visual analytic system, and then, we discuss how data is normalized and analyzed using anomaly bars and different construction methods of bars. We illustrate how spatiotemporal clustering algorithms may be integrated to make the anomaly analysis process more efficient. Particularly, how color function is defined based on user selection of time window is presented. Finally, a user interaction work flow is summarized for the general spatiotemporal anomaly detection.

3.1. System Overview

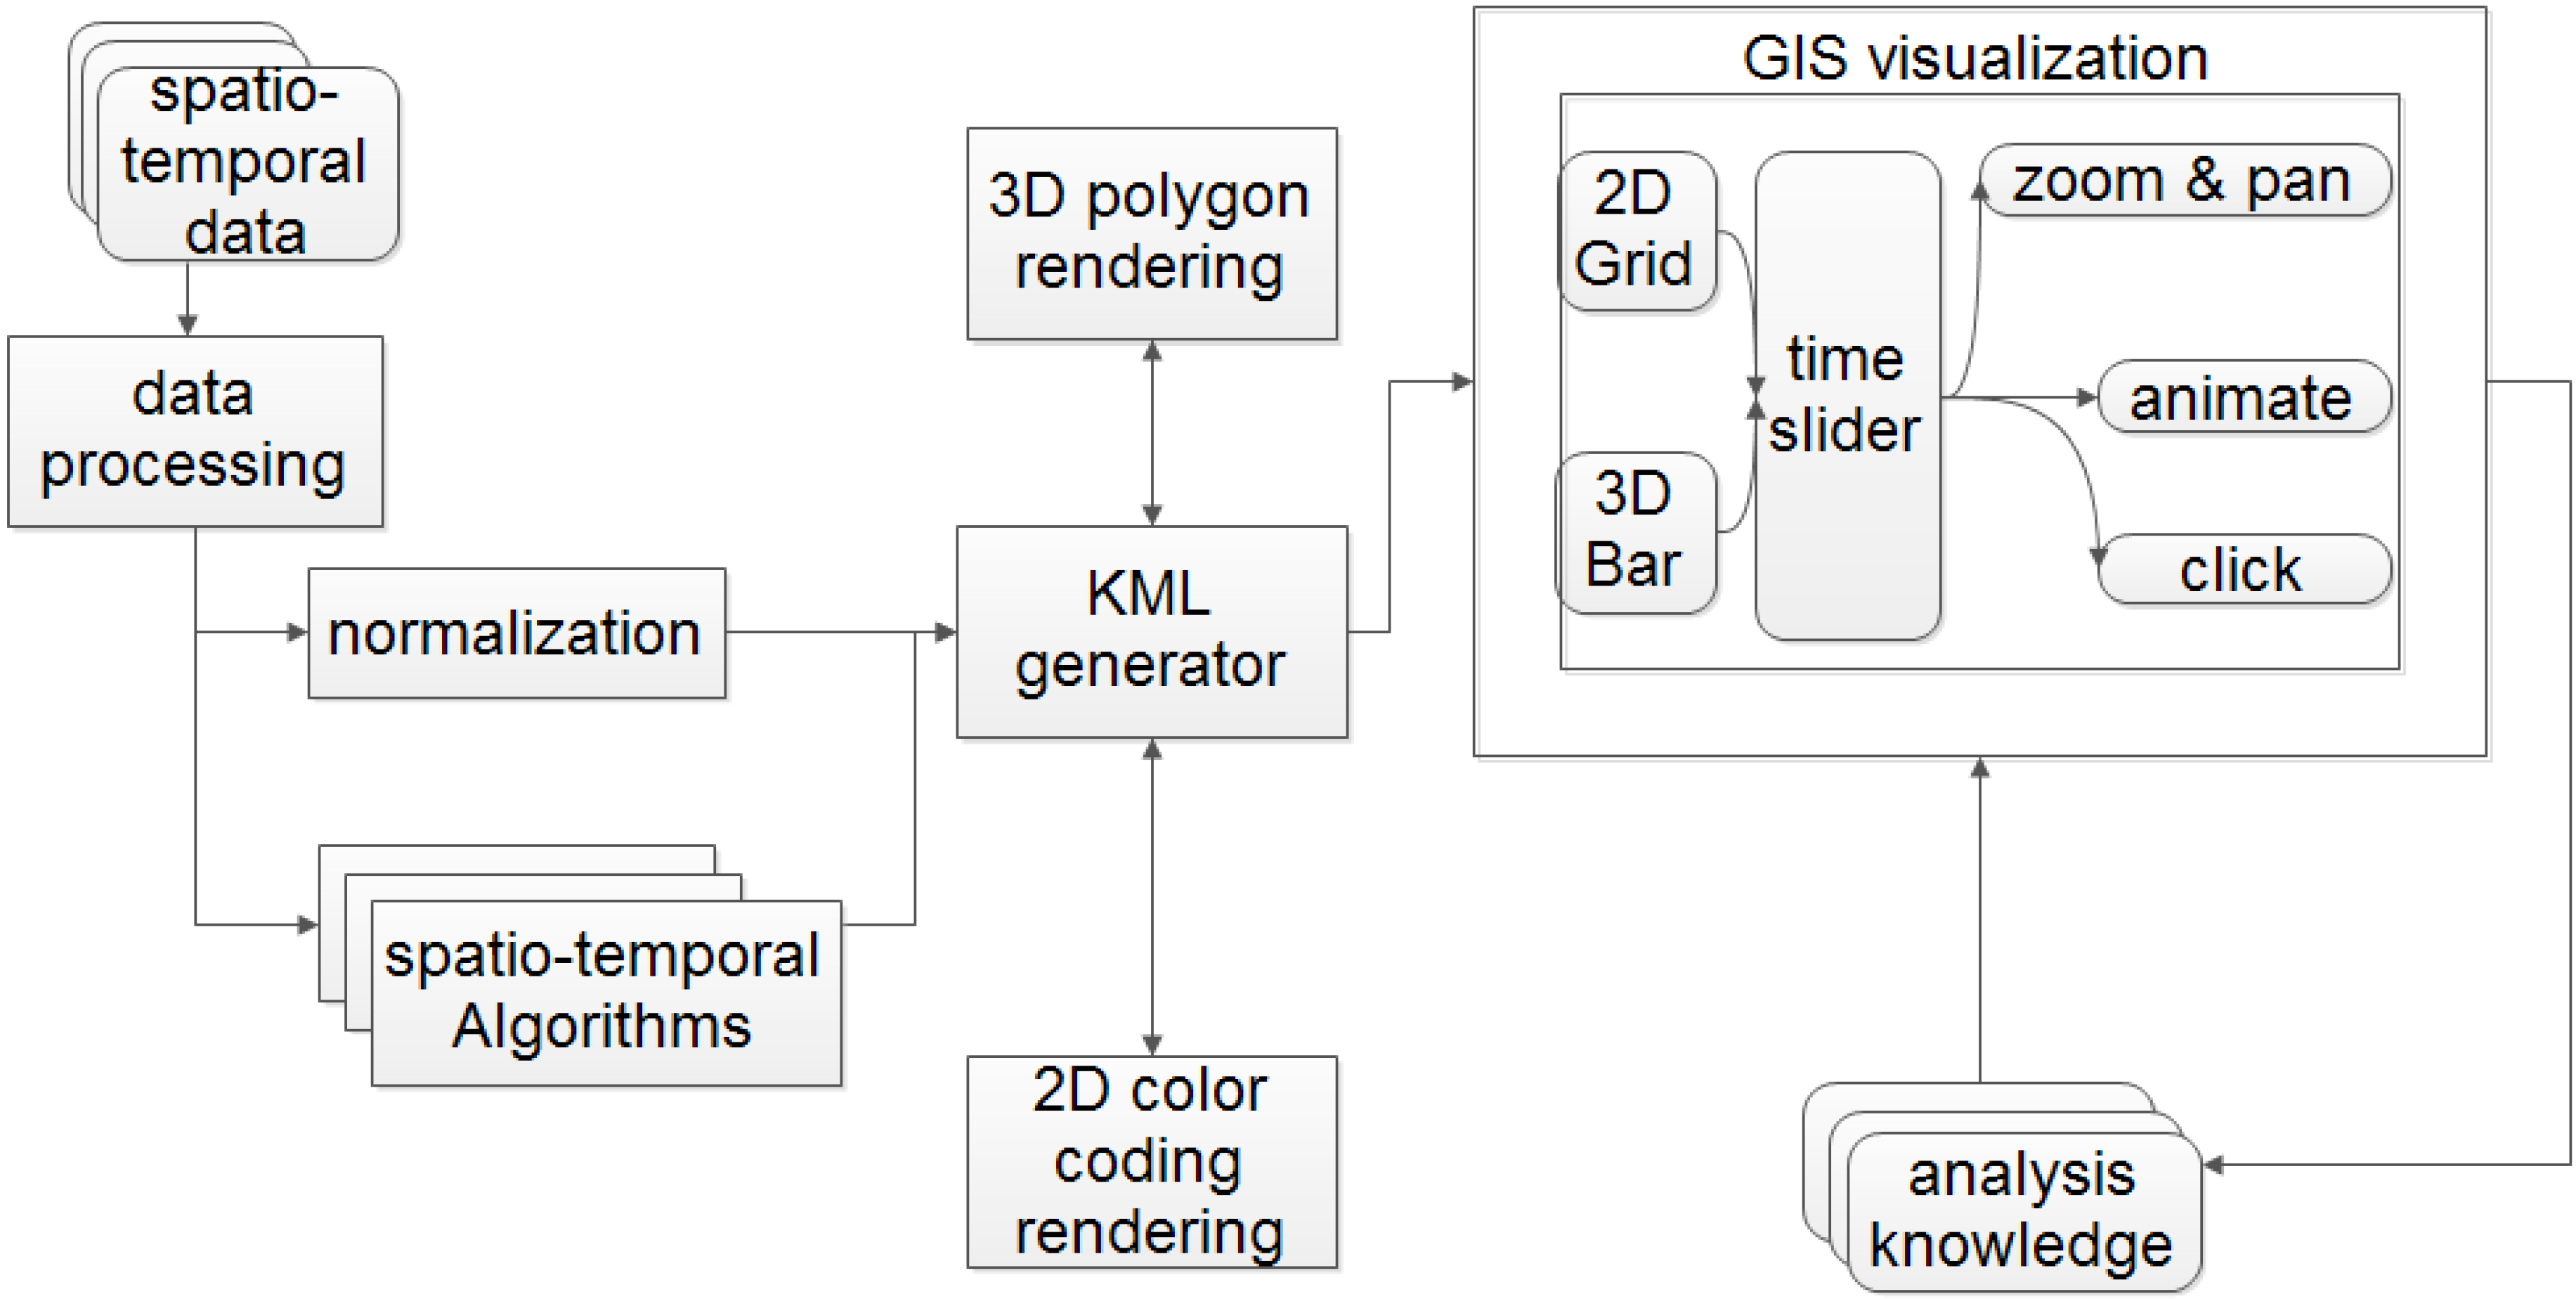
An overview of the data processing, analyzing and visualization modules in the system is illustrated in Figure 2. Data is handled with various processing methods, such as scanning, aggregation and normalization. The result will be parsed by a KML generator, which writes all parsed data into files with a KML format. 2D and 3D rendering solution will be used separately to deal with grids and bar information results together with attached timestamp. The processed KML files will then be read by a GIS, such as Google Earth, for visualization.
Figure 2. System architecture of spatiotemporal data process, analysis and visualization.
Informatics 01 00100 g002

3.2. Anomaly Bars Visualization

We simplify visual representations of situation/status data through bars, which are well understood, robust and, thus, have a less steep learning curve for ordinary users. Since most maps are 2D and, therefore, the third dimension is not well utilized, we adopt 3D bars to take advantage of both geographic locations and extra dimensions of attribute values. Data measurements could be seen directly and accurately on their geographic positions. We note that since many geographic systems, such as Google Earth, are interactive, i.e., users can drag and move the map from any arbitrary angles, and the system can perform zoom-and-pan operations, the visual complexity associated with 3D objects is likely to be alleviated due to the spinning/interactive nature of the visualization system.
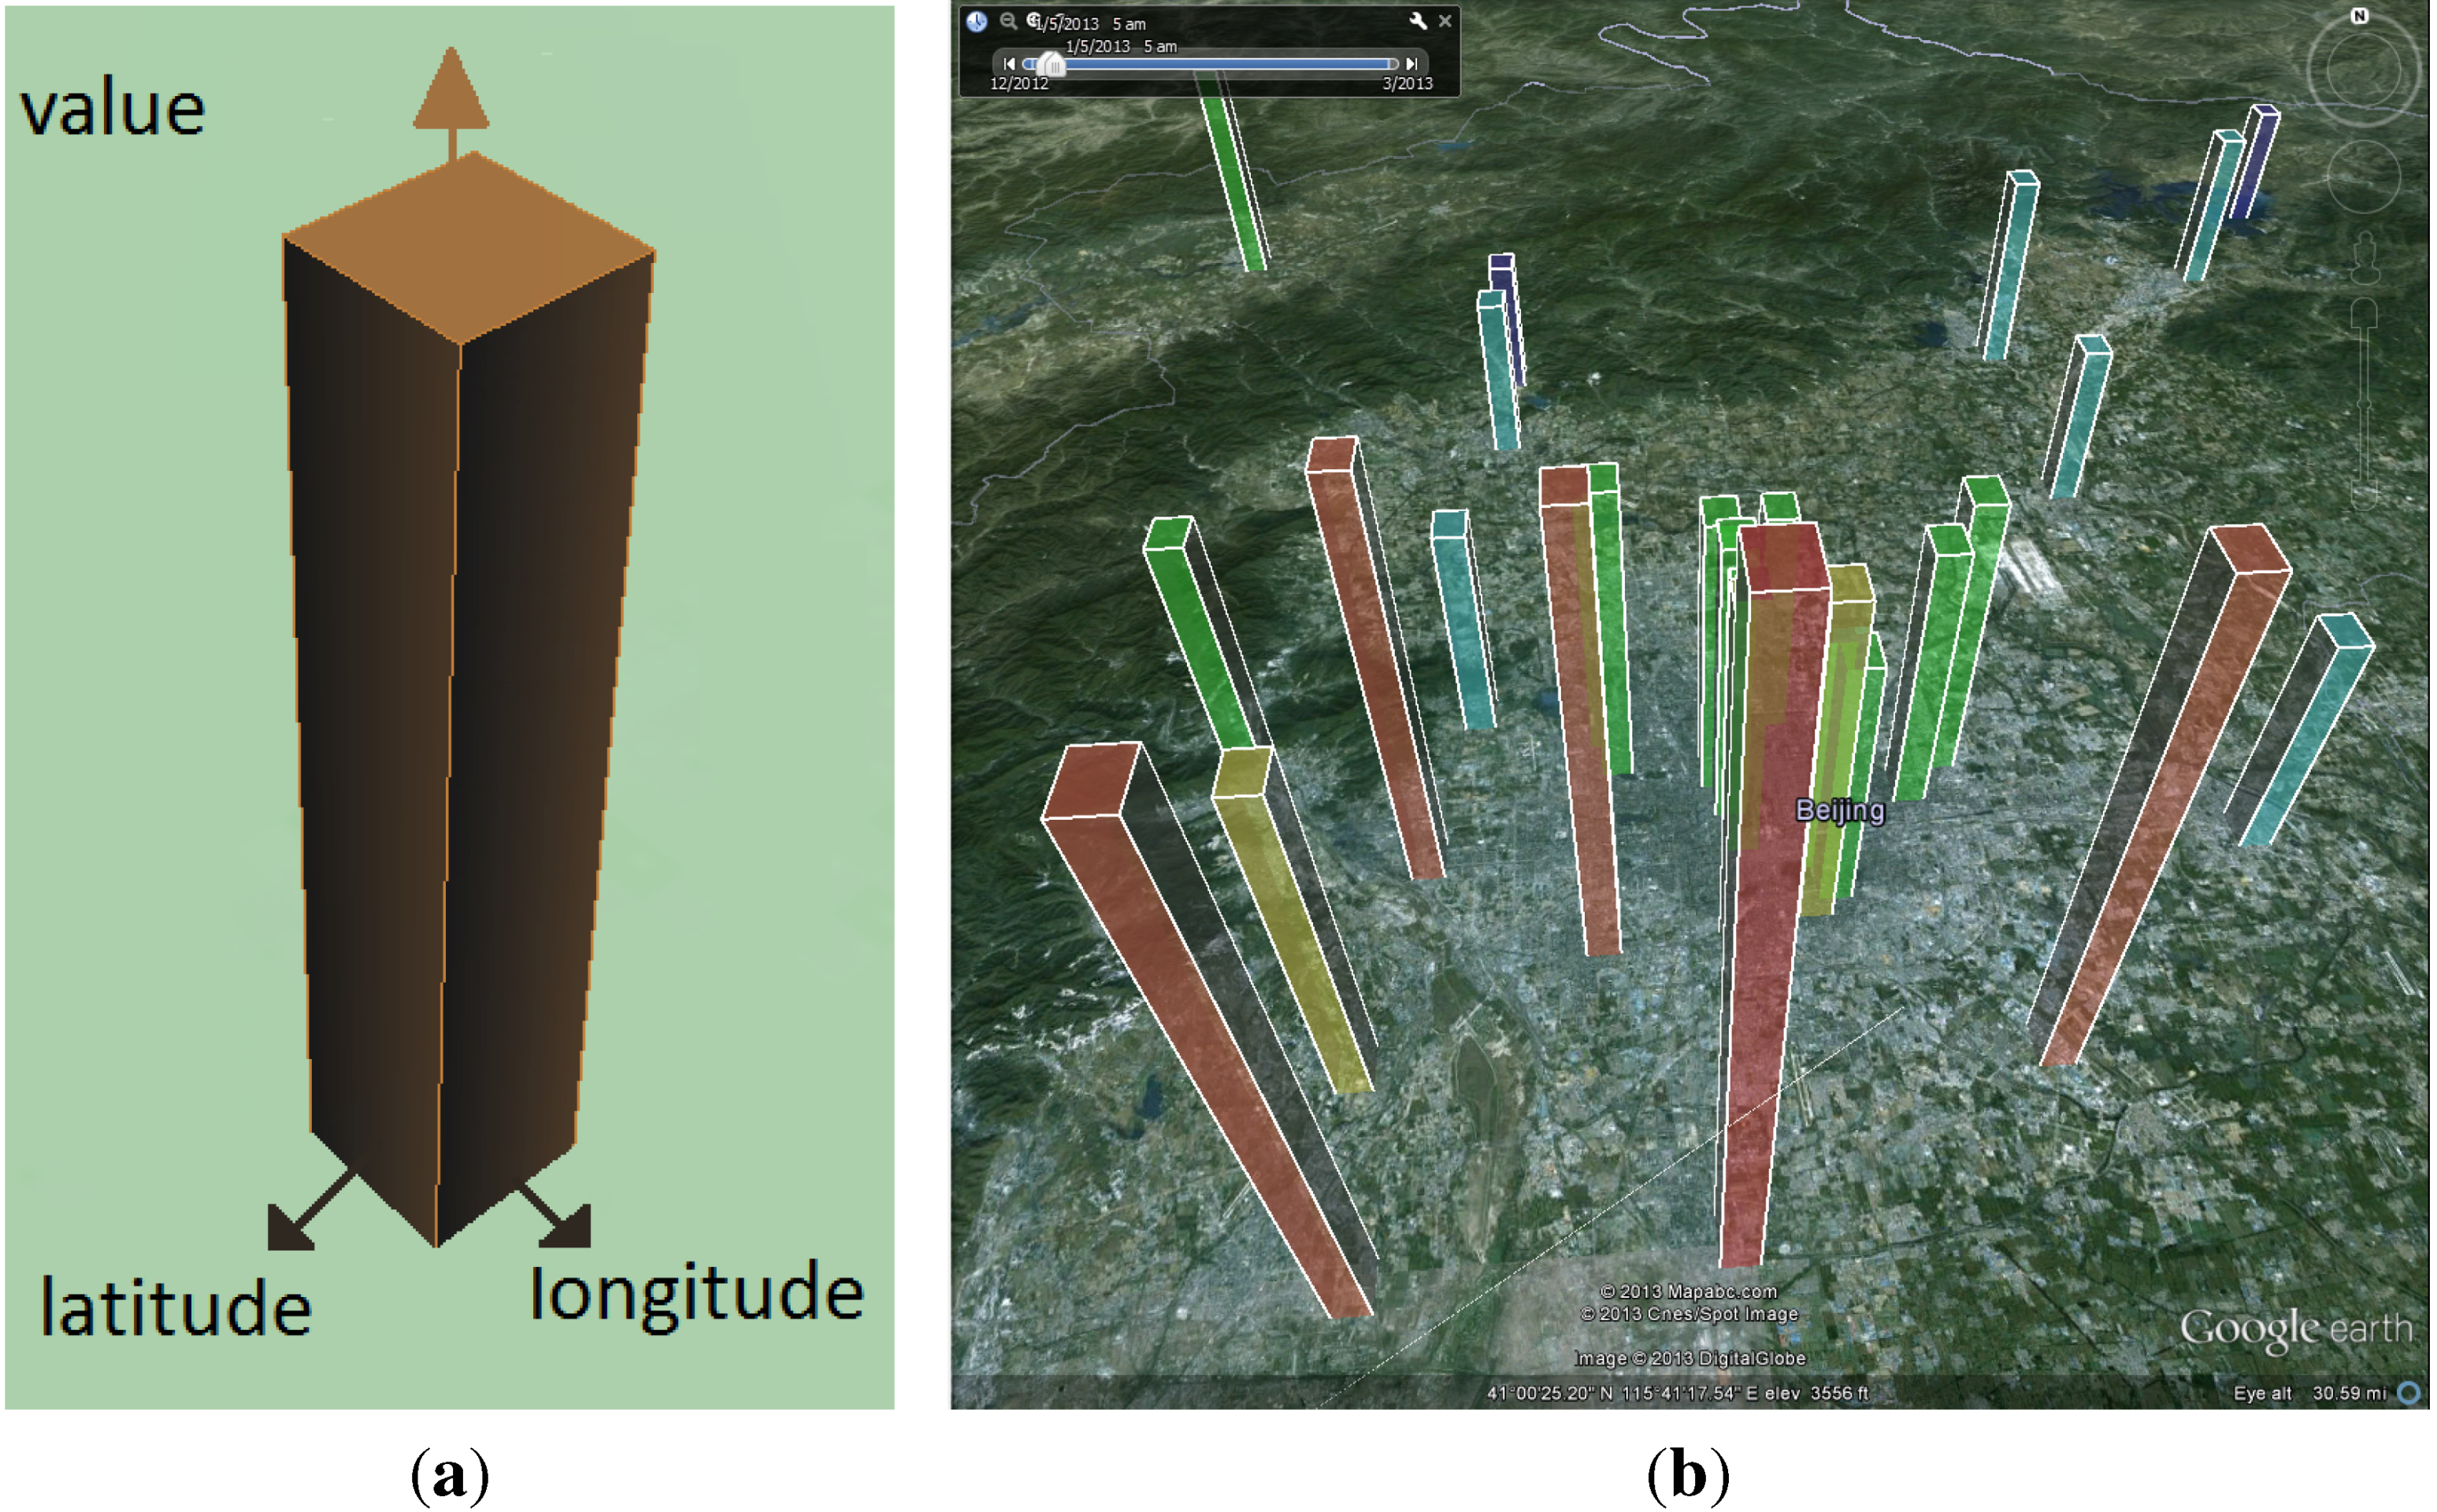
There can be multiple ways to construct and interpret 3D bars, as illustrated in Figure 3. Bars indicate visualized items’ three main dimensions: longitude, latitude and altitude (height). The surface polygon is a square with equal length and width. The center of the square is the latitude and longitude (x,y)-based location of each data point. The model has flexibility in terms of what and how to construct anomaly bars. The heights of bars, i.e., the altitudes of 3D polygons, can be directly derived from the actual values of the attributes or dimensions of spatiotemporal data. These actual values may further be normalized to limit the height of each individual bar. Besides actual values, summary statistical values may also be included to encode the bar heights, such as summation, min/max, average, etc. Particularly interesting, the temporal changes of attribute values, or Δ, may be used as bar heights to allow users to quickly see how many changes their systems have evolved from a previous timestamp.
Besides the heights of bars, the sizes may be used to denote the granularity levels of interactive visualization. For example, when zoomed into the most detailed level on a map, the smallest bars represent values of each individual data point. When zoomed out, the larger bars may represent aggregate values of multiple data points in a region.
Figure 3. Utilizing the upper space of a 2D map to encode additional attribute dimensions of spatiotemporal data. The center of the square surface is the latitude and longitude (x,y)-based location of each data point. The altitude or height of the 3D polygon represents the attribute value. Colors may represent the severity of anomalies in a region. (a) 3D bar model; (b) bars representing data dimensions.
Informatics 01 00100 g003
Colors may be used to reinforce the severity (or abnormality) level of a region. The color mappings follow the cold/warm color spectrum, i.e., cold (e.g., blue) means good, while warm (e.g., orange) means bad. The color spectrum function is illustrated in Equation (1). For example, we can let n = 10 if we want to equally divide the values into 10 bins, where each bin contains the same number of values. Notice that the value range of each bin is not fixed, but dynamically decided based on the actual value distribution. Performing the simple k-means clustering will achieve a similar result as the binning process. The benefit of this method is that we do not need to have a priori domain knowledge on the value range of each bin, except to decide the number of bins. We use this method in the Case I study.
Alternatively, we can also discretize the values into several predefined categories, each of which is mapped to one unique color. The category method is intuitive in many domains. For example, in network and system administration, depending on the syslog urgency levels, if the system load is above 80%, show red (critical); if it is between 50% and 80%, show yellow (warning); else, show green (normal). In environmental protection, depending on the air quality index, if above 250, show red (hazardous); if above 150, show yellow (unhealthy); if below 50, show green (good), etc. We use this method in the Case II study. Generally speaking, the higher and warmer the bars, the more anomalous is a region.

3.3. Normalization of Bar Heights

There are primarily two motivations for the normalization of bar heights. The first one is the suitability for the investigator to observe. For example, when some values of an attribute are extremely small and we use a non-normalized bar height, it is possible for the investigator to miss the bar at the overview level. Another reason is for robustness. The non-normalized values could be, to an extent, too large for an underlying GIS system to create a 3D module. Thereby, normalization is used to control the bar heights at controllable level.
We modify a min-max normalization method for a bars’ height generating solution, which is shown in Algorithm 1. The return value of the normalized bar height can be either positive or negative. While the absolute values are used to construct bars, signs can be utilized for additional visualization. For example, negative bars may be encoded with red color and positive bars may be encoded with green color to distinguish them.
Algorithm 1 Bar height normalization using min-max (L).
Require: L = { l i } : list of raw data records; includes longitudes, latitudes and values
Ensure: N = { n i } : list of normalized bar heights.
   
N L
( m a x , m i n ) F i n d M i n M a x (L)
for l i L do
  if l i . v a l u e 0 then
    n i . h e i g h t ( l i . v a l u e / m i n ) × M a x H e i g h t
  else
    n i . h e i g h t ( l i . v a l u e / m a x ) × M a x H e i g h t
  end if
end for
return N

3.4. GridScan

Direct visualization of spatiotemporal data may fall short sometimes. One limitation for understanding large-scale spatiotemporal data with solely 3D bars lies in the degree of human perception, which is usually challenged by observing a large amount of information concurrently. In order to detect and analyze interesting areas, there must be a starting place for a human to look. To bring intelligence into the visualization, we consider using spatiotemporal data mining in a way that is as general as possible. While there have been space-time clustering algorithms, e.g., SaTScan [35], often, they are not geared towards the anomaly detection or have incompatible data format requirements. For example, while SaTScan has wide applications in health and epidemic domains, it may require strictly integers for total populations and control groups, which is not general enough for all applications. An alternative method may be needed for detecting temporal anomalies in general (x,y,z,t) data records, where x,y are geographic locations, z is the floating point dimension value and t is time.
We need a clustering method that serves the purpose well for detecting areas where values change significantly over time, as well as over neighbors. GridScan [14] is an alternative spatiotemporal cluster detection algorithm recently proposed in the data mining field. Given baseline information, it can be applied for detecting two types of clusters indicating anomalies, i.e., under-density and over-density. Specifically, an under-density cluster indicates that an observation of the data count in an area is significantly lower than expected considering the baseline. On the other hand, an over-density cluster indicates that an observation of data count in an area is significantly larger than expected. The mentioned area’s boundary defines the location and the extent of a cluster. In addition to locating potential anomalies, GridScan also gives statistical evidence of the detected anomalies by their p-values. If the p-value of a detected cluster is smaller than a statistical level, say, 0.05, then the cluster is regarded as statistically significant, which means that the anomaly observed is an unusual event that can barely happen. An important feature of GridScan is that, as a grid-based approach, it is capable of detecting irregularly-shaped clusters while having a time complexity linear to the number of grids. When applied to spatiotemporal datasets, GridScan can be used for detecting data changes over time. By comparing two adjacent temporally aggregated data slices, D t and D t + 1 , and treating D t as the baseline, GridScan can detect clusters in D t + 1 , which reflects the significant change between time t and t + 1 .
The main steps of GridScan are as follows. As a first step, GridScan aggregates all the spatiotemporal data into regular grids of a given scale. Then, aiming at maximizing an objective function, the algorithm employs a greedy search to grow and determine the boundary of a potential cluster. The effect of baseline data is considered in the objective function, so that the over-density and/or under-density are defined. To obtain the p-value of a potential cluster, Monte Carlo simulation is adopted. Finally, those significant clusters with a p-value smaller than a given statistical level are outputted. Because a cluster is represented by a set of grids, it can approximate any irregular shape at the given spatial granularity. By integrating GridScan results into the visualization tool, we can make the task of analyzing spatiotemporal anomalies more time effective.

3.5. Anomaly Grids Visualization

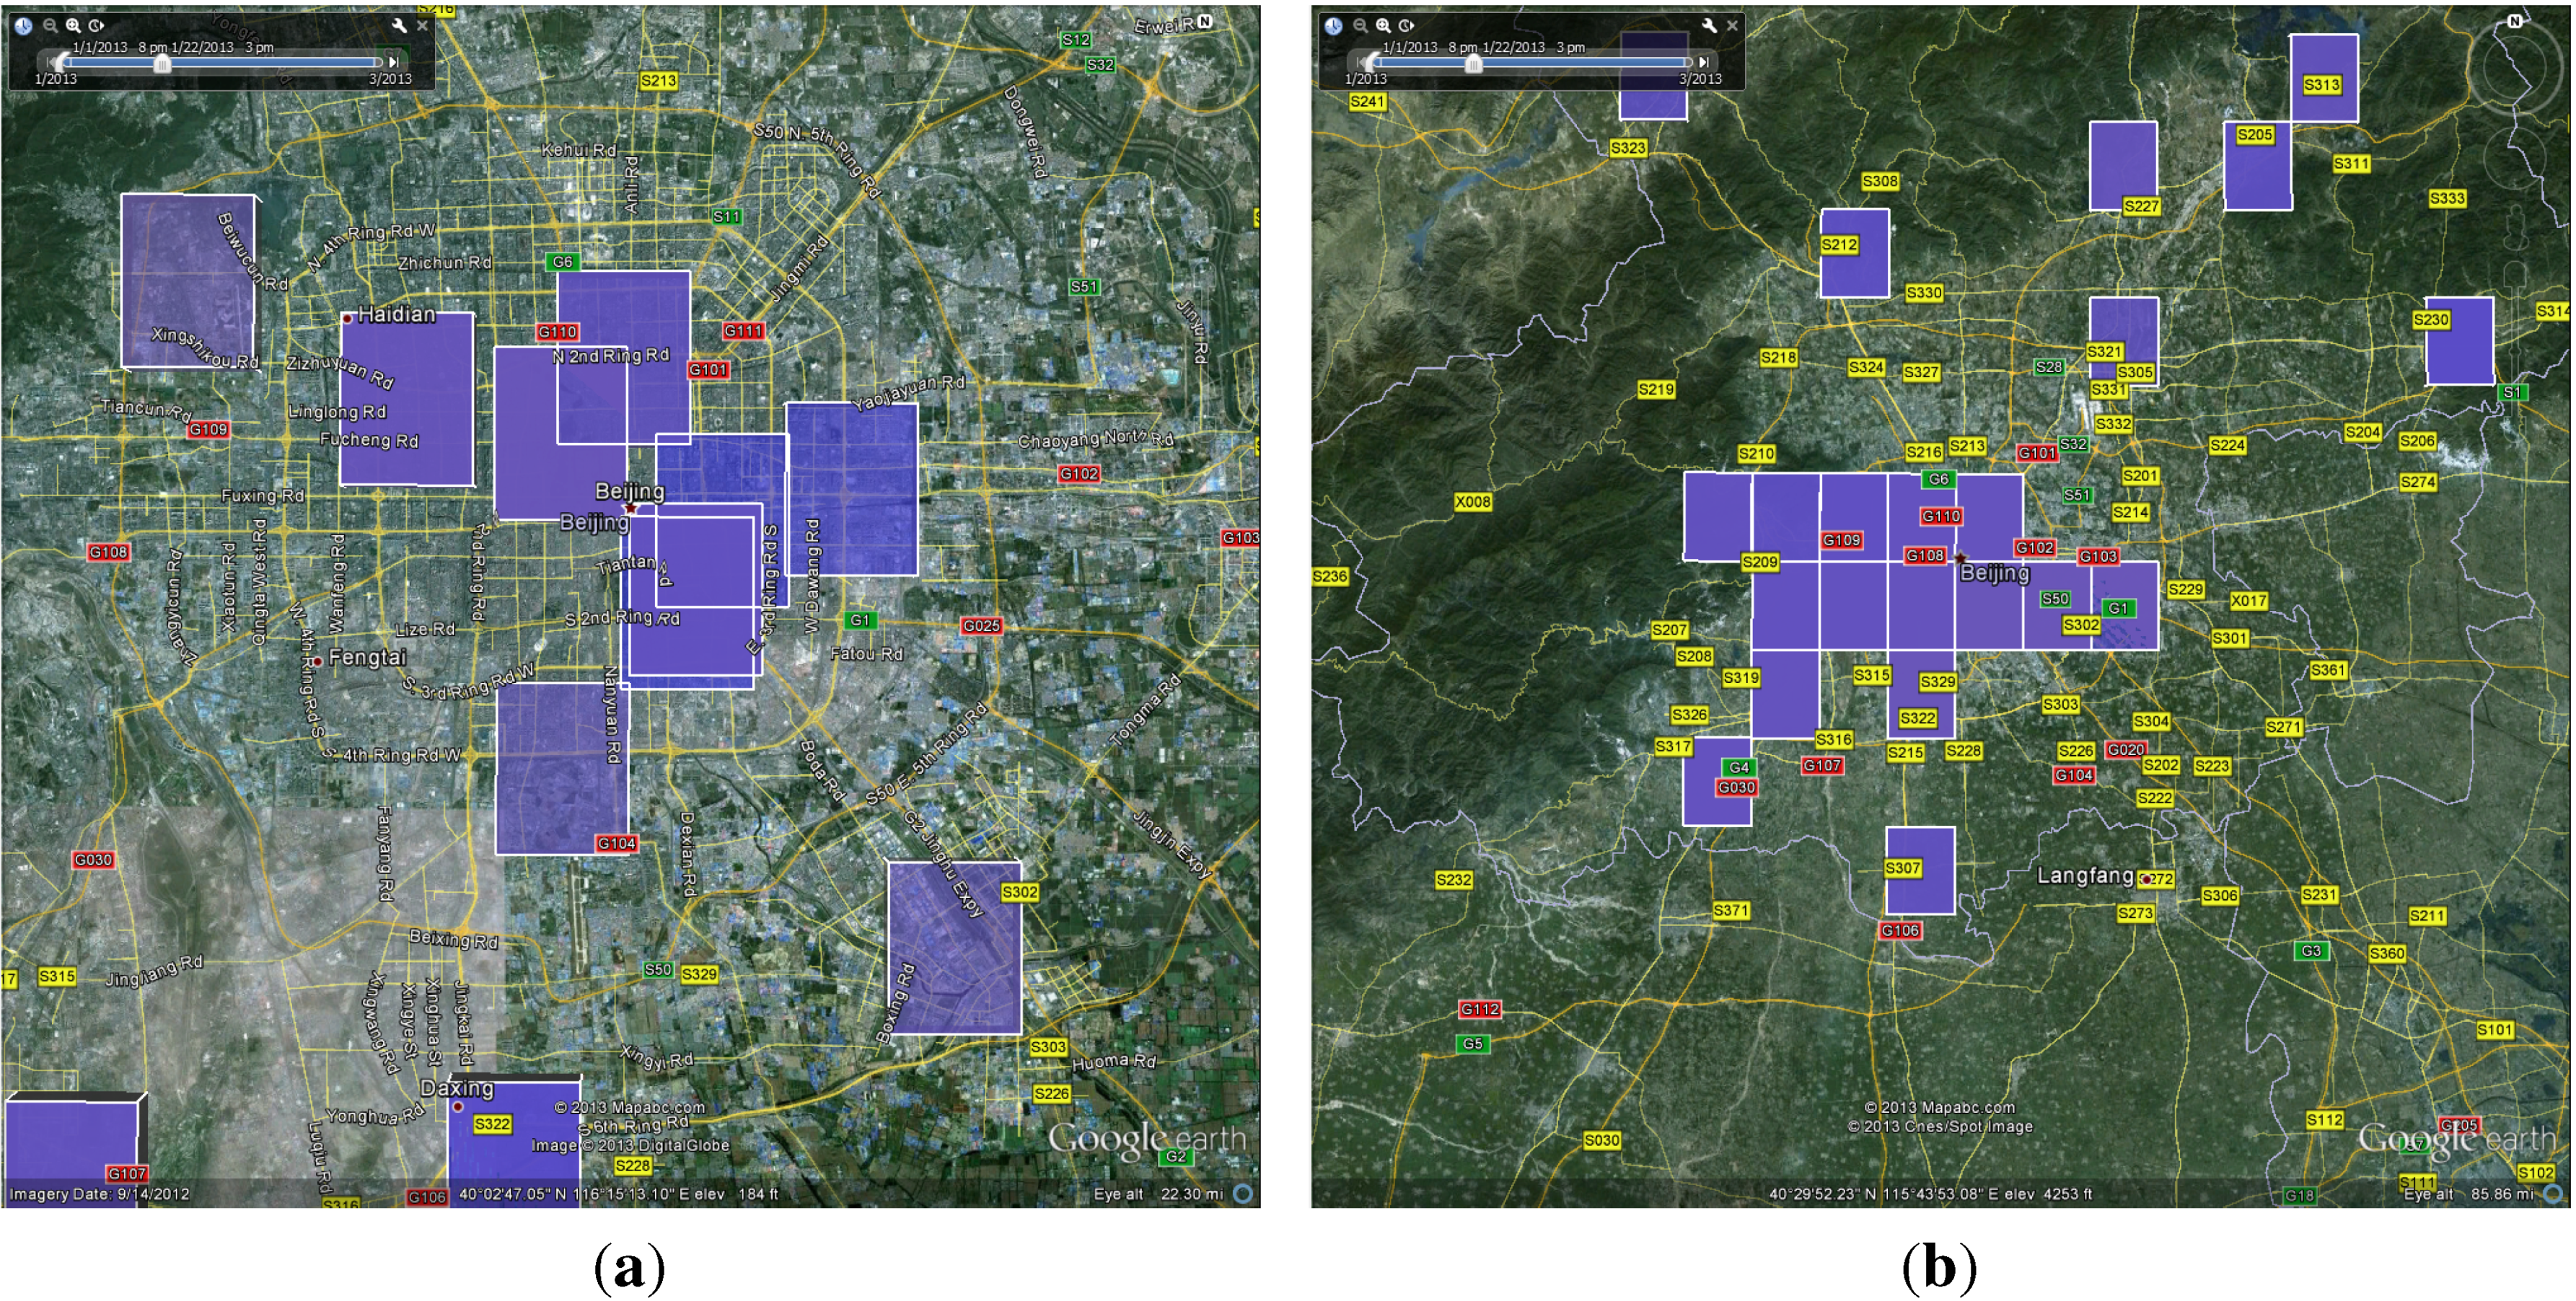
We choose 2D grids as the supplement solution in our visualization system to represent interesting zones derived from the GridScan algorithms. Like 3D anomaly bars, 2D anomaly grids are also intuitive to use for ordinary users, who can instantly visualize the regions on the map at which they should look. Another benefit is that by viewing the grid’s distributions, users may quickly understand the changing trend by considering another important data dimension: temporal dynamics. An example of the anomaly grids visualization can be seen in Figure 4. The highlighted regions represent the interesting or anomalous areas that are worth further investigation, because they have unusual spatiotemporal changing patterns. The overlapping grids in Figure 4a are due to the multiple clustering results. Since the time slider bar (upper left) indicates a time range, all clusters derived during the selected time range will be automatically plotted. If we drag the start and end buttons on the time slider bar and make them overlap, which means we only examine one particular time slice, then there will be no overlapping grids. The sizes of 2D anomaly grids adjust in response to the zoom levels (Figure 4a vs. Figure 4b). Both anomaly bars and grids are designed to support interactive analysis by dynamically adjusting the granularity levels, as discussed in the next section.

3.6. Interaction and Trend Presentation
Important features of the visualization tool include interaction and trend presentation. The design of user interaction is two-fold, i.e., the granularity of data values based on zoom-in/out levels and the granularity of colors based on start-end time slider selection by users, as explained below.
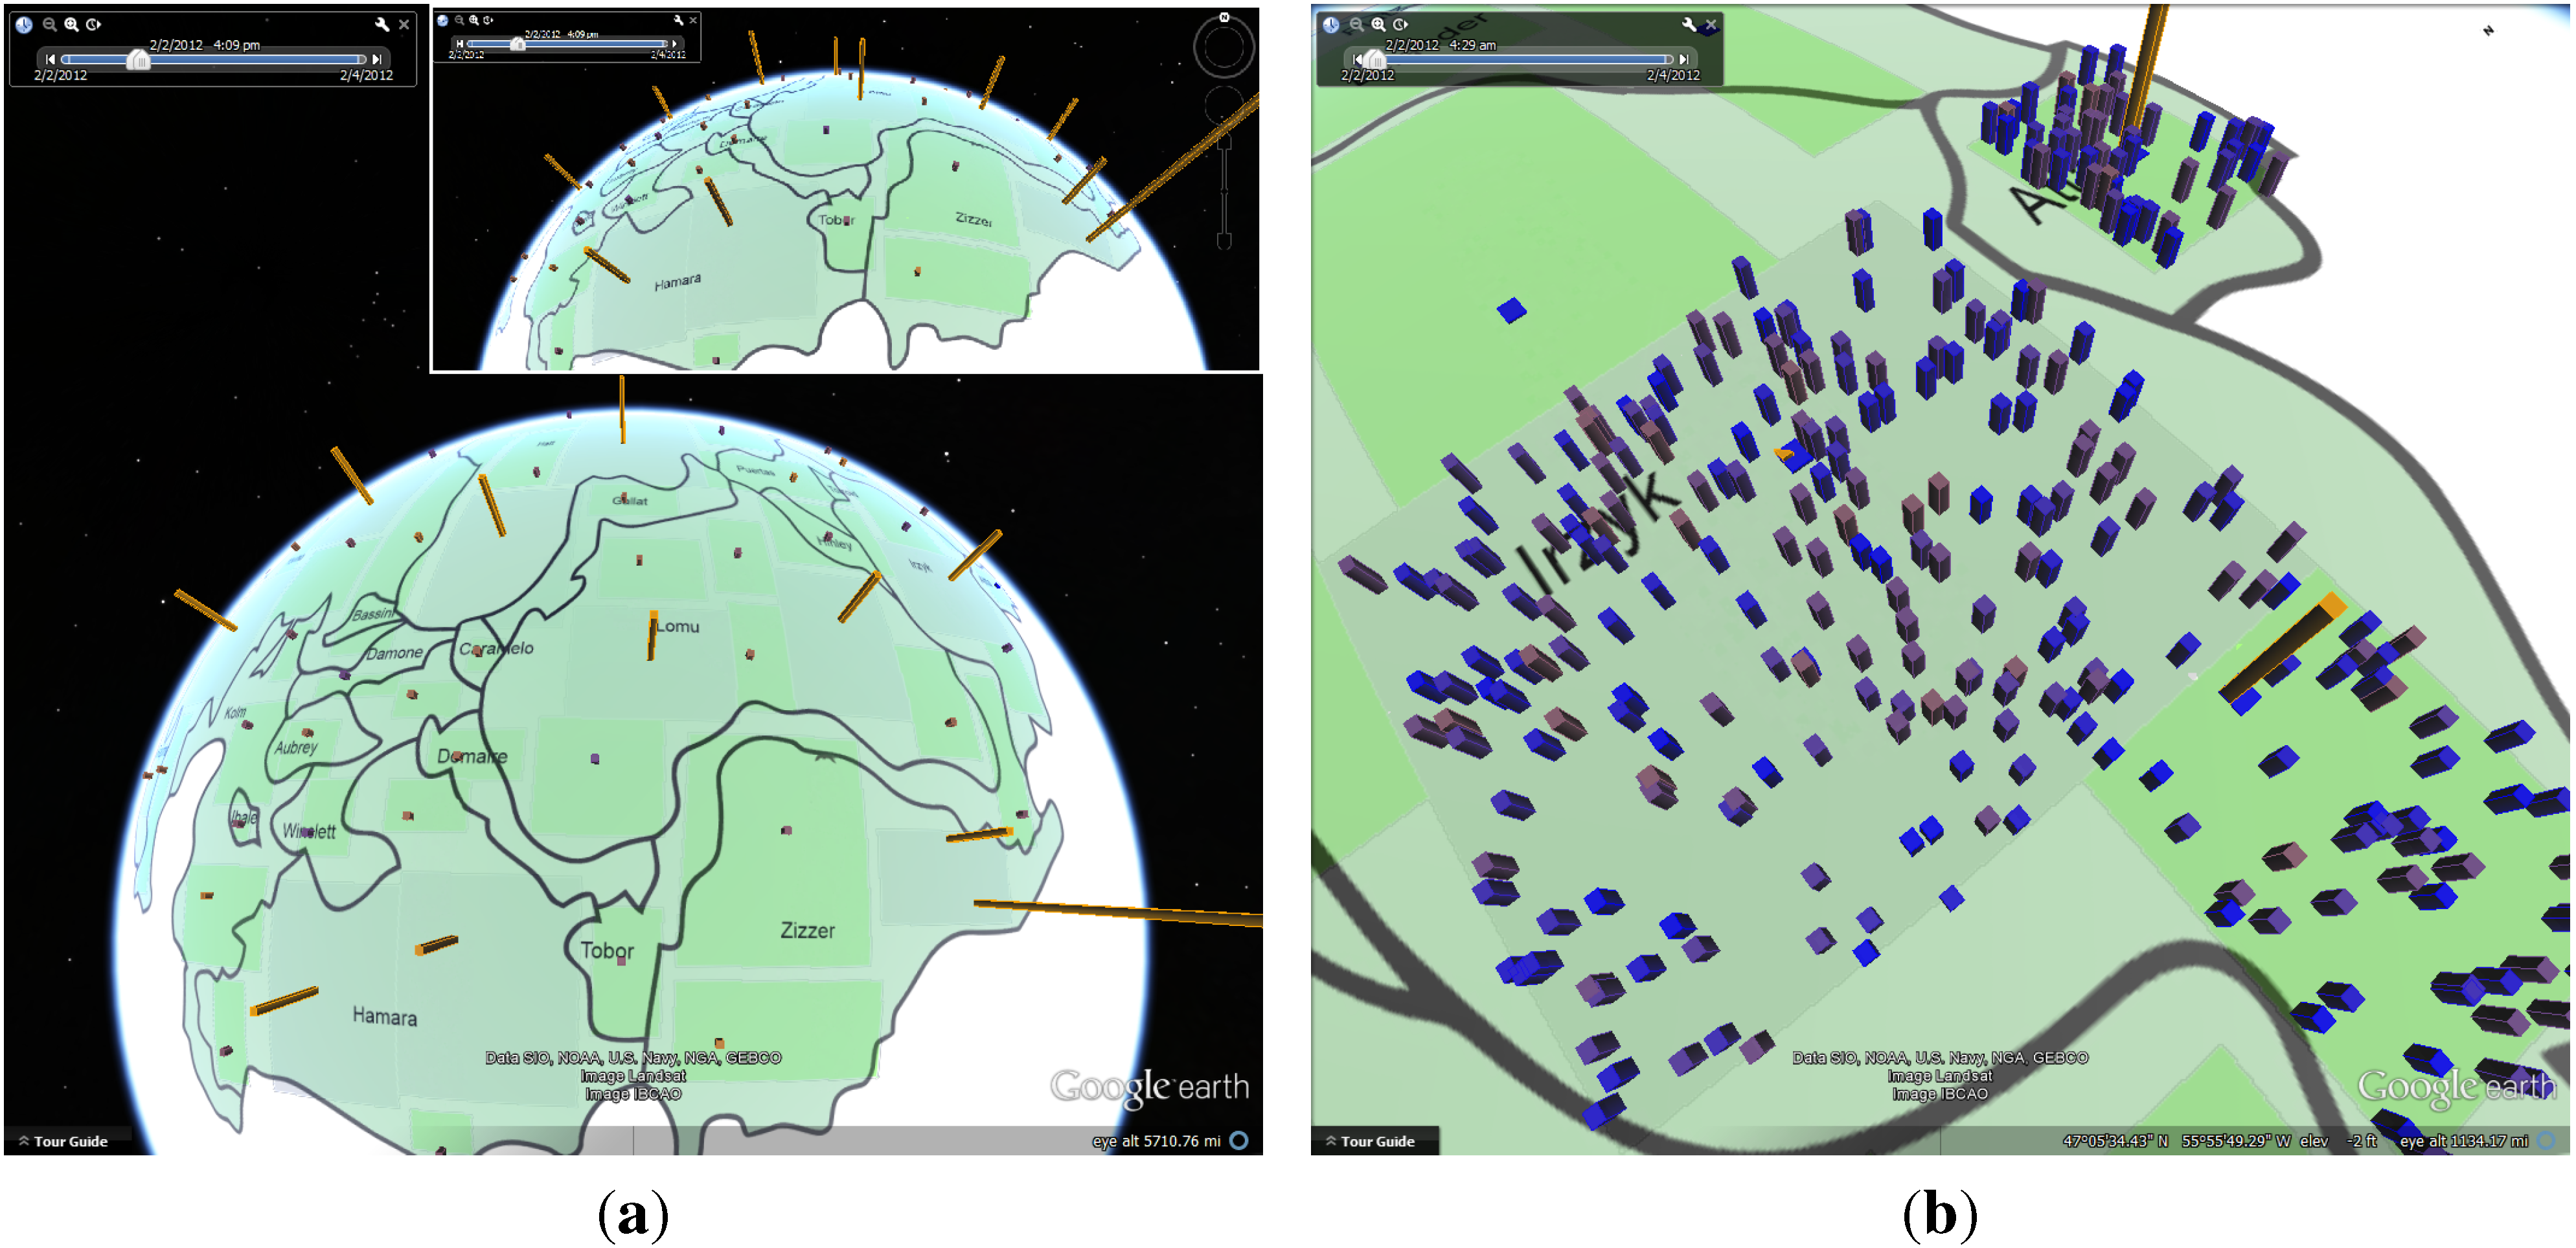
In order to keep the quantity of information at an appropriate level during the investigation process, we create different scanning results by modifying grid sizes. After loading the data into the system, the investigator could perform zoom-in/out and pan operation and view anomaly grids in different sizes (Figure 4). The analysis transits smoothly between overview and detail-on-demand. The sizes of the grids may not only depend on the zoom levels, but ideally depend on the underlying data properties. For example, larger grids may be more suitable for one particular dataset, while smaller grids may be ideal for another dataset. Finding a good balance for the granularity of grid sizes for different datasets and incorporating them into user interaction are our ongoing work and will be included in the future version of the tool. A similar interaction is also possible with the anomaly bar visualization (Figure 5) by controlling the number of bars based on different aggregation and zoom levels. In addition, users may simply click any bar to get further information, such as the original values, normalized values, heights, clusters, etc.
Figure 4. Interactive 2D anomaly grid visualization at multi-level granularity. Highlighted areas represent interesting/anomalous areas that are worth further investigation. Grid sizes may be adjusted depending on zoom levels or the underlying data spatio-temporal prosperities. (a) Level 1; (b) Level 2.
Informatics 01 00100 g004
The ability to analyze the trend of status changes in the setting of situation awareness is another feature of the tool. While an overview of the entire time range of the dataset is useful and a good starting point, by setting a time range between a beginning and an ending time, the tool provides detail-on-demand investigation over a specified time window of interest events. Sometime, a potential issue may be too subtle to be identified in the overview. The common way to analyze a trend is to visualize pictures frame-by-frame, according to the timestamps. By dragging the time slider, the visualization system will dynamically generate an updated view at that specific time, creating an animation-like effect. This function is supported in our system.
Figure 5. Interactive 3D anomaly bar visualization at multi-level granularity. Higher and warmer-colored bars likely indicate anomalous locations. In this example, each region contains many branches in a multinational financial corporation. (a) Region level; (b) branch level.
Informatics 01 00100 g005
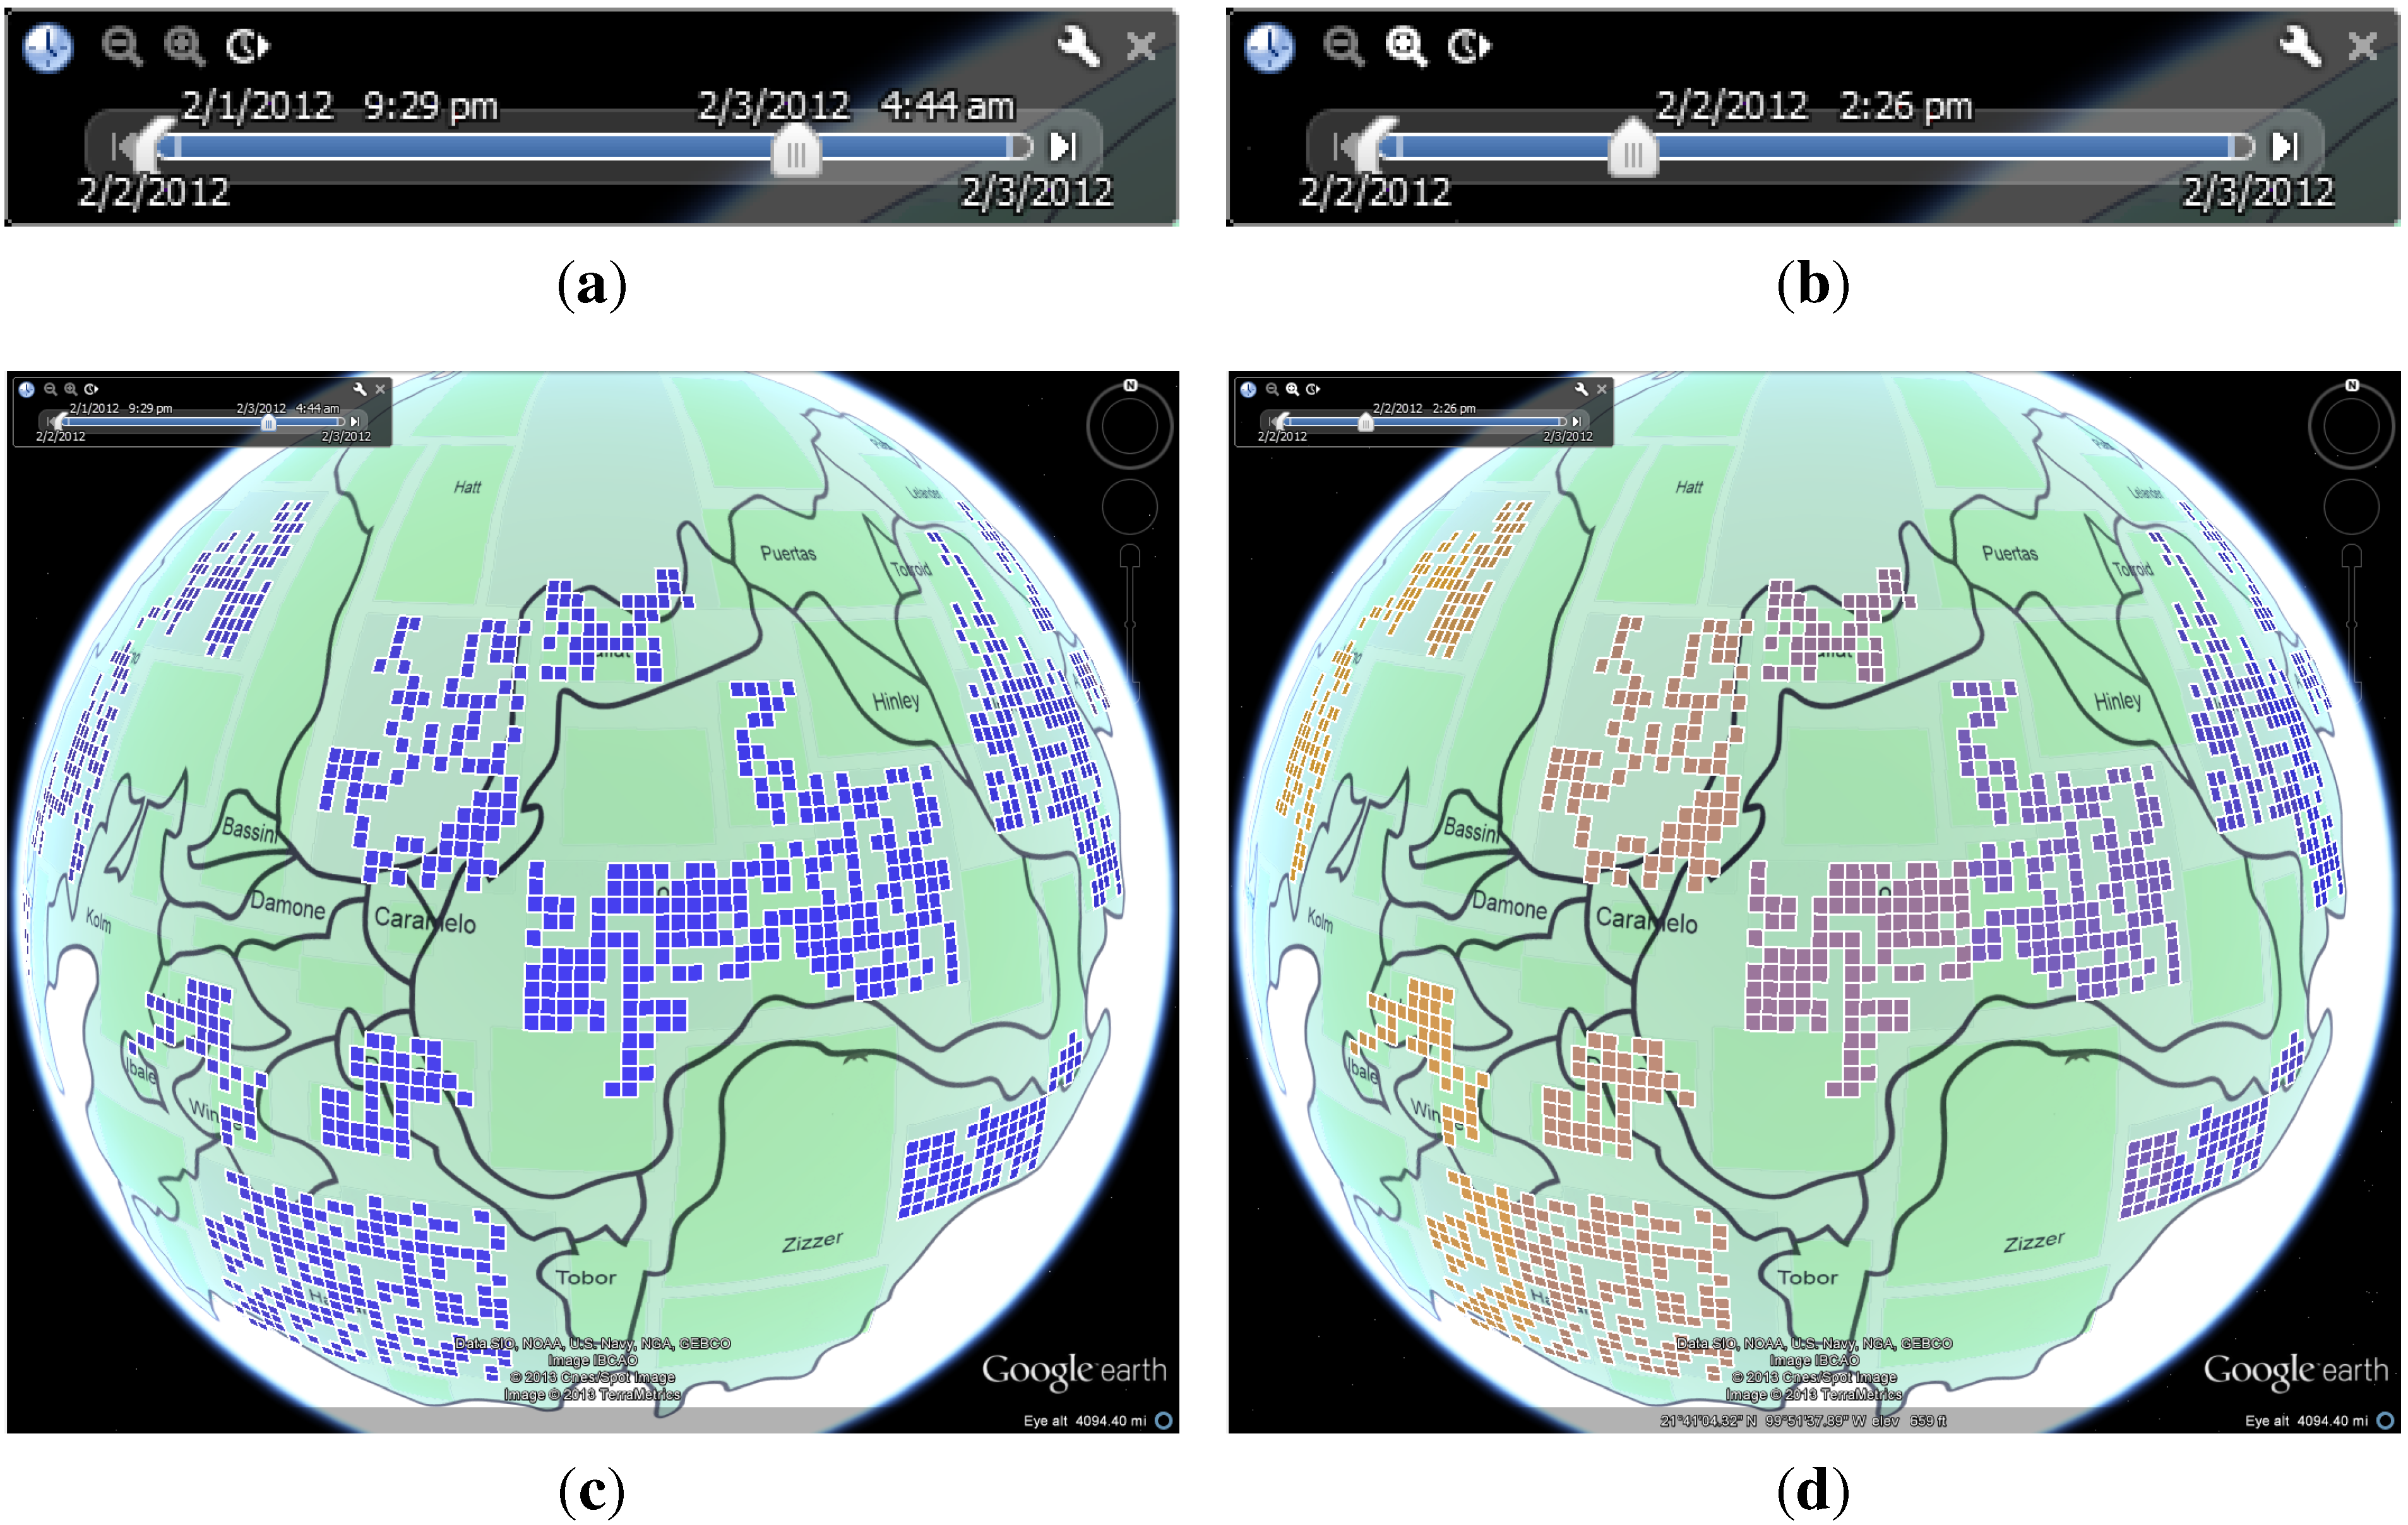
One shortcoming of the above approach is that a human usually performs poorly in remembering things. Memorizing and comparing by shifting images back and forth might be difficult. We try to provide an alternative view, i.e., how can we present temporal dynamics and trends within a static view without requiring users to remember previous images, like in an animation? One useful feature (and novelty) of our tool is that the system will dynamically change the colors of anomaly grids and bars according to our color spectrum model (see Equation (1) in Section 3.7) based on the start and end time values of the slider, which controls the time window of investigation. Figure 6 shows such comparisons. Typically, a static image could sufficiently lower the challenges for human perception and memory limitation.
For trend presentation, we have two solutions: one is we animate the moving trend and view the data temporal variation in either bars or grids. Animated visualization is used in this case to connect the dots between timelines. The function is achieved through a time control panel in the upper-left corner of Google Earth, as discussed above. An alternative solution to animation is to observe the dynamic trend through one static visualization, as discussed below.

3.7. Color Encoding Model

As discussed earlier, in order to show the overall trend and dynamics of the value in one static view in addition to animation, we apply color encoding algorithms to represent 3D bars and 2D grids. The color spectrum is defined in Equation (1):
C o l o r i = C o l o r S · n - 1 - i + C o l o r E · i n - 1
where C o l o r = { R , G , B } is a three-tuple containing values of red, green and blue. C o l o r S and C o l o r E represent the start time and end time respectively, thus defining the color spectrum. In our case, C o l o r S = blue and C o l o r E = orange. n depends on temporal data size, i.e., the number of total time slices. i is the order number for ascending time series. The above color spectrum model is used for calculating C o l o r i of anomaly grids in order to show the temporal trend, evolution and dynamics of the status value changes in a static view without requiring animation.
Figure 6. Examples derived from the dynamic color spectrum model (Equation (1)) on anomaly grids (and possibly bars) through interaction. Colors are dynamically defined based on users’ selection of the start and end time. The static views allow much easier visual analysis of the temporal trend of status changes without forcing users to remember images during an animation. (a) Larger time window; (b) smaller time window; (c) anomaly grids within (a); (d) anomaly grids within (b).
Informatics 01 00100 g006

3.8. Spatiotemporal Anomaly Analysis

The procedure of detecting and analyzing the general spatiotemporal anomalies and their causes using the visualization tool can be summarized in Figure 7. The chart shows the repetition of analysis between two main levels. Investigators find and analyze all interesting areas by switching visualization scales. Conclusion may be reached through clear observation from both static overview pictures and dynamic moving trends. The amount of details are adjusted based on both zoom levels and time window selection, as described in Section 3.6.
Figure 7. The general procedure and flow chart of detecting and analyzing the spatiotemporal anomalies using the visualization interface.
Informatics 01 00100 g007
The analyzing process includes two parts. One is spatiotemporal clustering algorithms and the other is the normalization of aggregated statistics over each geographic location. In the case where the anomaly scores are directly encoded into the bar heights, the investigator could detect anomaly regions easily by observing the bars’ heights. Results from the data mining, such as spatiotemporal clustering (e.g., GridScan), are reflected in anomaly grids, in which case, the investigator can easily detect anomaly regions by observing the highlighted areas (grids) on a 2D map.
The above two analytic methods focus on the data at different scales. The functionalities of two algorithms are partially different during the overall data processing. Clustering is used in finding the “interesting area” by presenting the grids’ geographic distribution and moving trend. This is a good starting point. After coming up with the interesting areas, we use the second algorithm to measure the value changing trend in a detailed scenario and find out the particular reason for the phenomenon.

4. Evaluation

In this section, we evaluate the spatiotemporal anomalies visualization tool by analyzing two publicly available datasets, i.e., VAST 2012 mini-challenge and Beijing air quality data.

4.1. Case Study: Corporate Computer Networks

The VAST 2012 mini-challenge 1 data embodies a large-scale enterprise network with a network traffic log and geographic information. The log data come from locations all over the fictitious Bank of Money (BoM) facilities that contain close to one million IP addresses. The main challenge on our visualization solution is to detect noteworthy (anomalous) events and their possibly underlying causes from such a big data corpus. This is especially useful for large-scale cyber-situation-awareness purpose.
In this case, two types of information may be critical to detect operational changes outside of the normal activities. First, geographic factors may help to detect anomalies among different branches and regions; and second, the time dynamics could also be important for analysis by considering the branch operation hours. Therefore, how to represent anomalous network behavior with the geographic information is the critical part of the task. In addition, the big volume of data could be another challenge for visual analysis. Straightforward visualization of 900,000 IP addresses and over 4,000 physical locations is not scalable. What and how to represent these large data dominate the efficiency of analyzing anomaly in such an enormous network.

4.1.1. Data Process and Analysis

For the normalization of summary statistics, we mainly use regions and branches as the aggregation points. While rendering at finer granularity is useful during detailed investigation tasks, using branches, for example, will generate more than 4,000 bars for the whole BoM world, which will hardly be displayed and recognized by human beings. On the other hand, grouping by branches will be an appropriate way to represent more details when studying only a few regions. By using time as another dimension, we obtain a time series of status distributions, one per every 15 min.
We first show one bar per region, corresponding to one of each of the attributes. The calculations for the four attributes (the number of online machines, the number of connections, policyStatus, activityFlag) are as follows. Then number of machines will be a summation from each branch, then normalized into the value range of (0, 1). A mean numConnection is used by dividing the sum value by the regions’ machine number. The policyStatus has five values, which indicate how serious is the policy violation undergoing at the machine, from one (normal) to five (severe). In order to emphasize the abnormalities, the policyStatus value is subtracted by one before being summed together, so that the normal machine policy (1) will not be counted. The activityFlag attribute has five values, as well. Value 1 means working normally; Values 2–4 mean different abnormal activities on a machine. While the 2–4 values are worth investigating, they have no priority over others. Therefore, the value of one is counted as zero and all the other values as one. After this calculation, the summed value will let us know how many abnormal machines are in the region.

4.1.2. Number of Online Machines

The visual analytic process develops by the following work flow. After receiving the results from both summary statistics and spatiotemporal clustering algorithms, KML files are generated. In Figure 1a, users could select one or multiple KML or zipped KML (KMZ) files for filtering the other information (highlighted in the black box). Selecting multiple files together may generate a visualization combining both regions and branches. A time slider (highlighted in the white box) will be automatically enabled and sets a start and end time according to the entire time range of the datasets. By dragging start and end buttons together (when they overlap), users can view the situation status during that specific time point. By separating the two start/end icons on the time slider, users will be able to view the status spanning the time window. The grids in Figure 1a are anomalous regions based on the GridScan algorithm. The different colors represent the time slices during the selected time window. After narrowing down by simply selecting the machines’ functional types, we could find some interesting distributions among different types of machines.
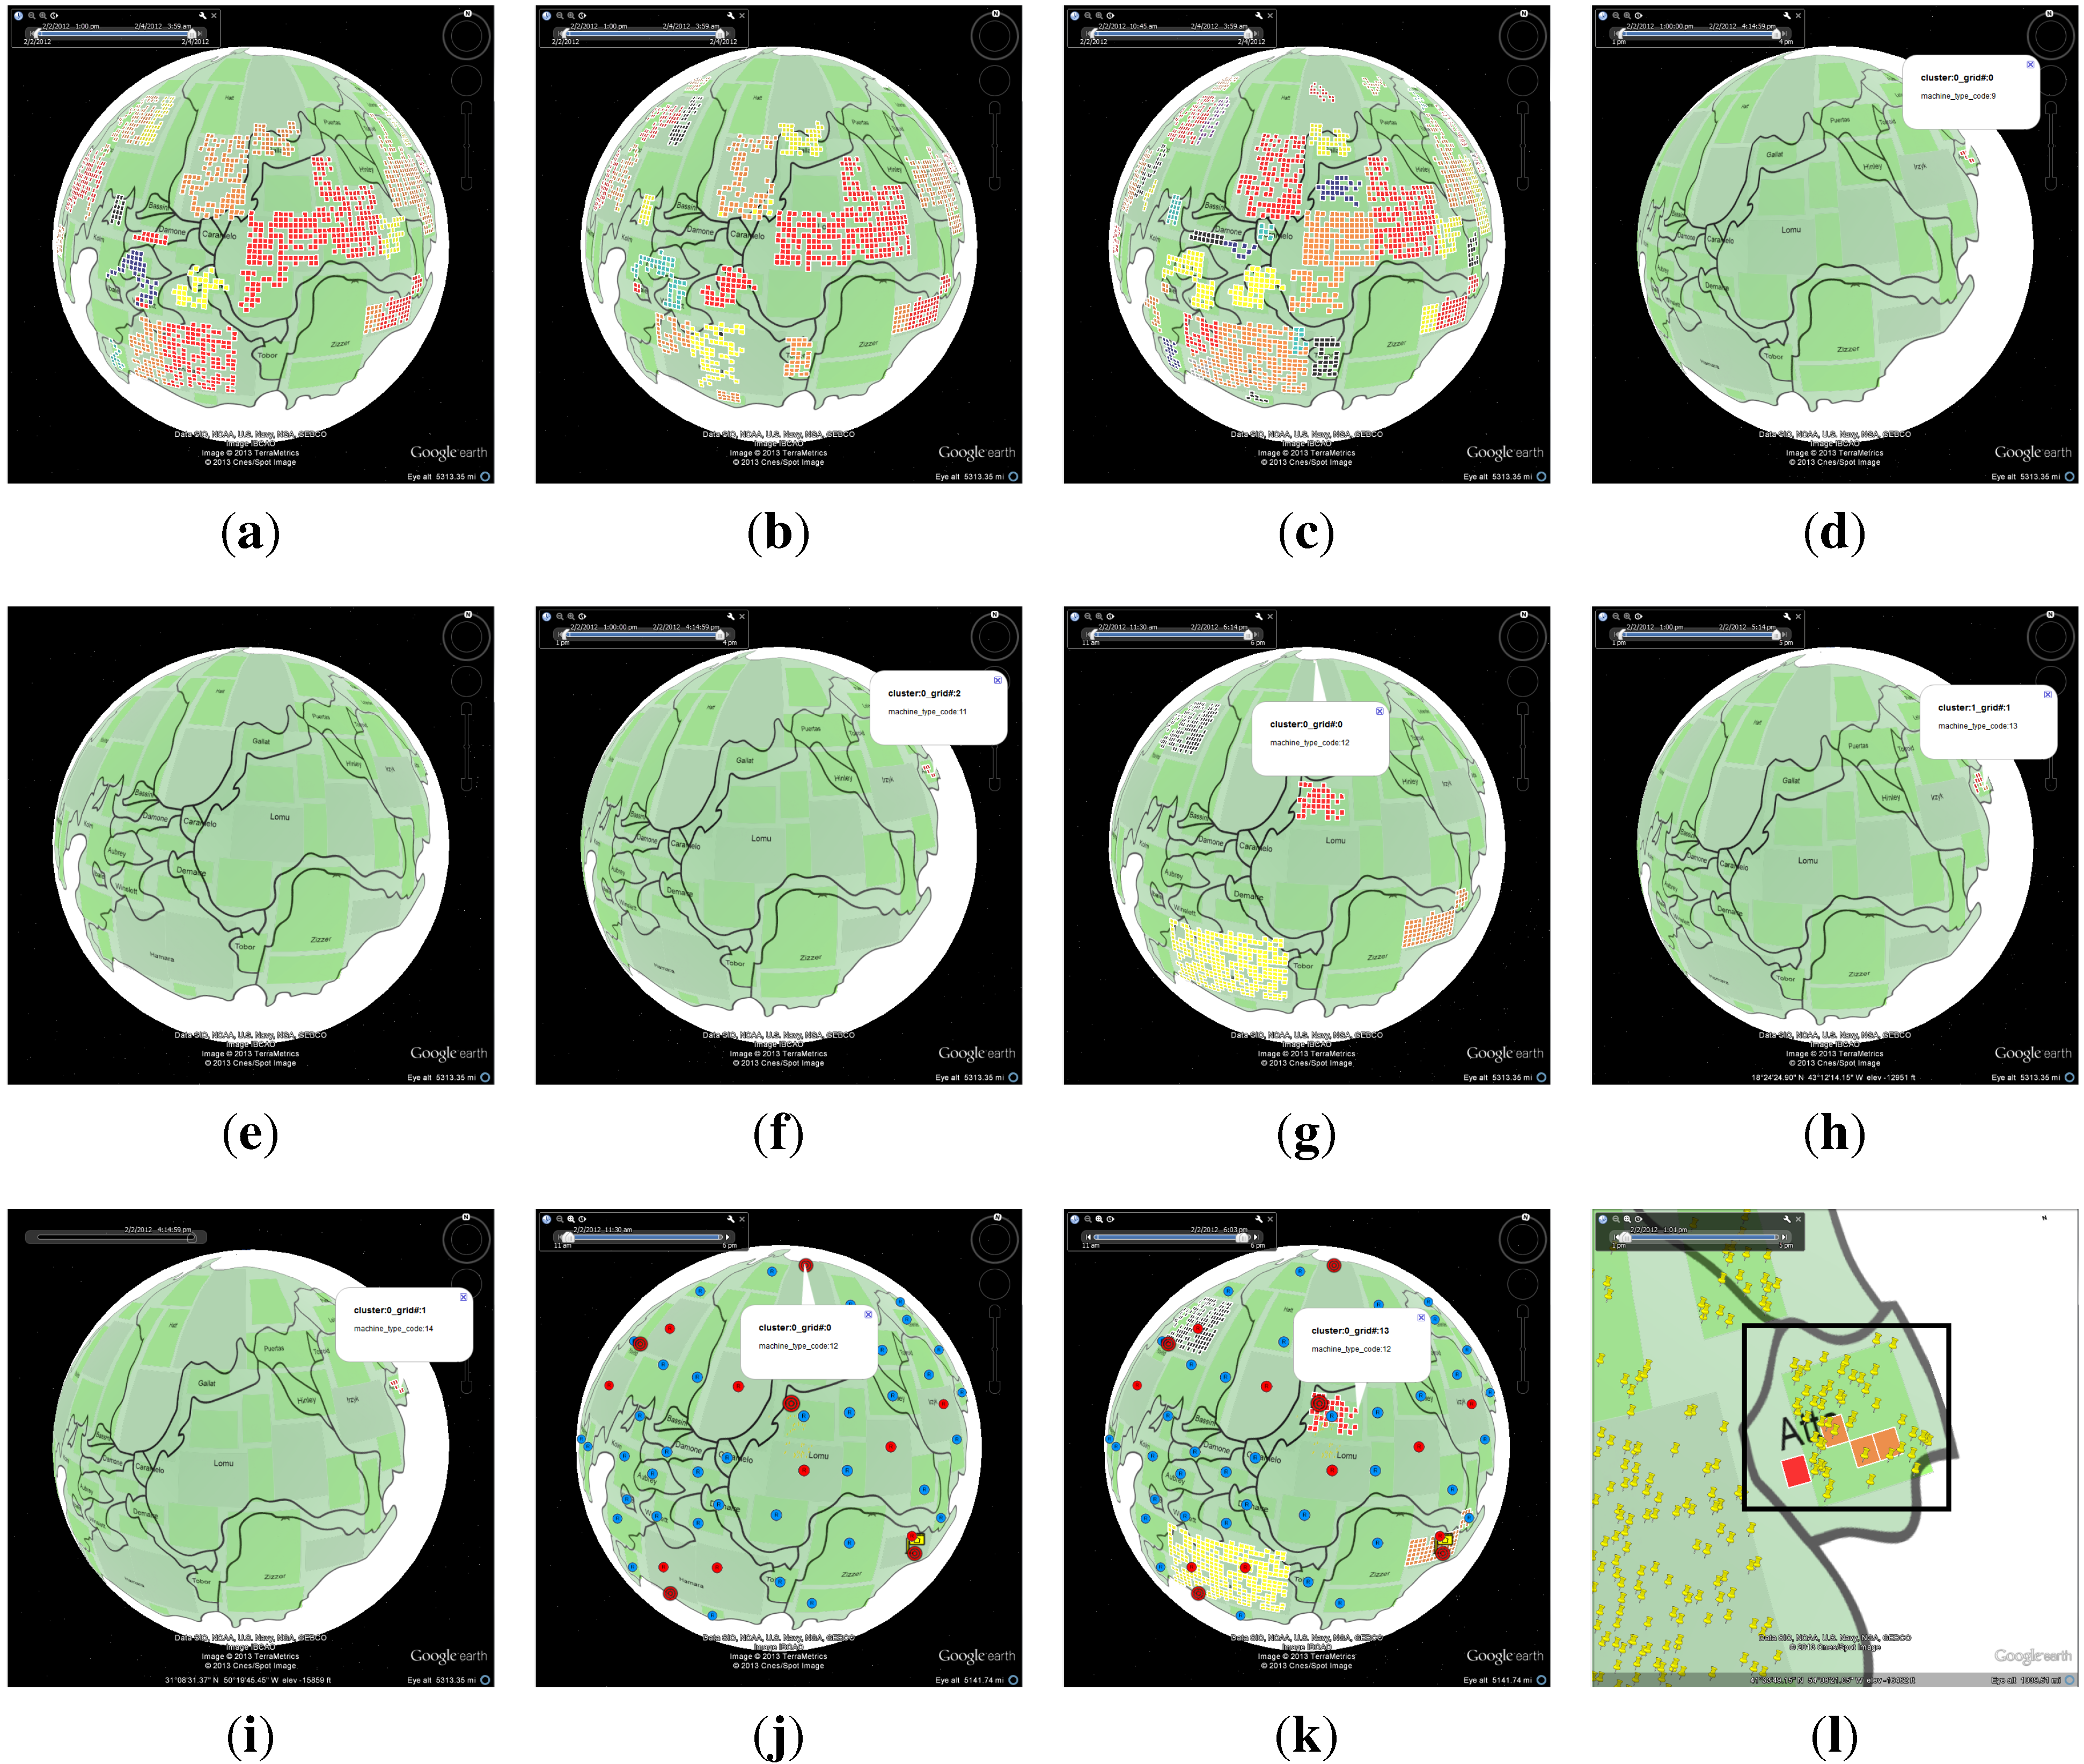
Figure 8 shows a variety of clustering distributions by function types, i.e., workstation (teller), workstation (loan), workstation (office), server (web), server (email), server (file), server (compute), server (multiple) and ATM. The popup text boxes are used to highlight existing clusters, which might not be easily viewed in snapshots, due to the graph size. Figure 8h could be viewed as a snapshot of a cluster distribution of multiple servers. In Figure 8l, the highlighted box shows multiple clusters’ distributions in detail by zooming into one “interesting region”. Figure 8i and Figure 8e could be viewed as snapshots of the distribution of ATMs at two different time points. Figure 8j and Figure 8k are snapshots of the distribution of computer servers at two different times.
It can be observed that workstations have clusters all around the BoM world. Servers and ATMs only have clusters in one interesting area. Within the category of servers, computer server anomaly grids differ from other types of servers. Another special approach at this level’s visualization is that we use the colors’ gradual changes to represent a status’s moving trend within a static view. On the other hand, the animation of machines representing the same moving tendency of all types of workstation machines helps us make another important observation: anomaly clusters of one type of machine, i.e., workstation, change in a trend by time series, as shown in Figure 9. Meanwhile, other types of machines show a tendency that is significantly different from the workstations. With both the gradual color change and the animation of each machine type, the tendency of changing values can be easily detected.
Another conclusion that can be drawn from the observation is that most servers and ATMs have no clusters, except one in an interesting area. In contrast to others, the type of compute servers has a considerable number of anomaly clusters at a particular time point (after 18:00 on the second day). At this time, we have done the visual analysis at a general level through anomaly grids. For the next level, we apply the second algorithm and visually show bars of three dimensions on the discovered “interesting area” (Figure 8l). Figure 3b shows that with a different tendency in the interesting area (‘Region 25’), an anomaly can be observed in this area. In the graph, the bigger red bar contains the aggregation result for each region. The red bars’ heights are directly related to the branch’s status changes in terms of the number of online machines. A possible explanation for such an anomaly of changes in online machines is that some incidents happened in that area, including a power outage due to natural disasters, such as a hurricane, or malicious hacking/virus, etc.
Figure 8. Anomaly grid (clusters) distributions of the number of online machines by different types of machines show trends over both time and space. (a) Workstation (teller); (b) workstation (loan); (c) workstation (office); (d) server (web); (e) server (email); (f) server (file); (g) server (computer); (h) server (multiple); (i) ATM; (j) computer (Time 1); (k) computer (Time 2); (l) interesting area.
Informatics 01 00100 g008
Figure 9. Animation effect to visualize the spatiotemporal trend of anomaly regions by dragging the time slider. (a) Time 1; (b) Time 2; (c) Time 3; (d) Time 4; (e) Time 5.
Informatics 01 00100 g009

4.1.3. Number of Connections

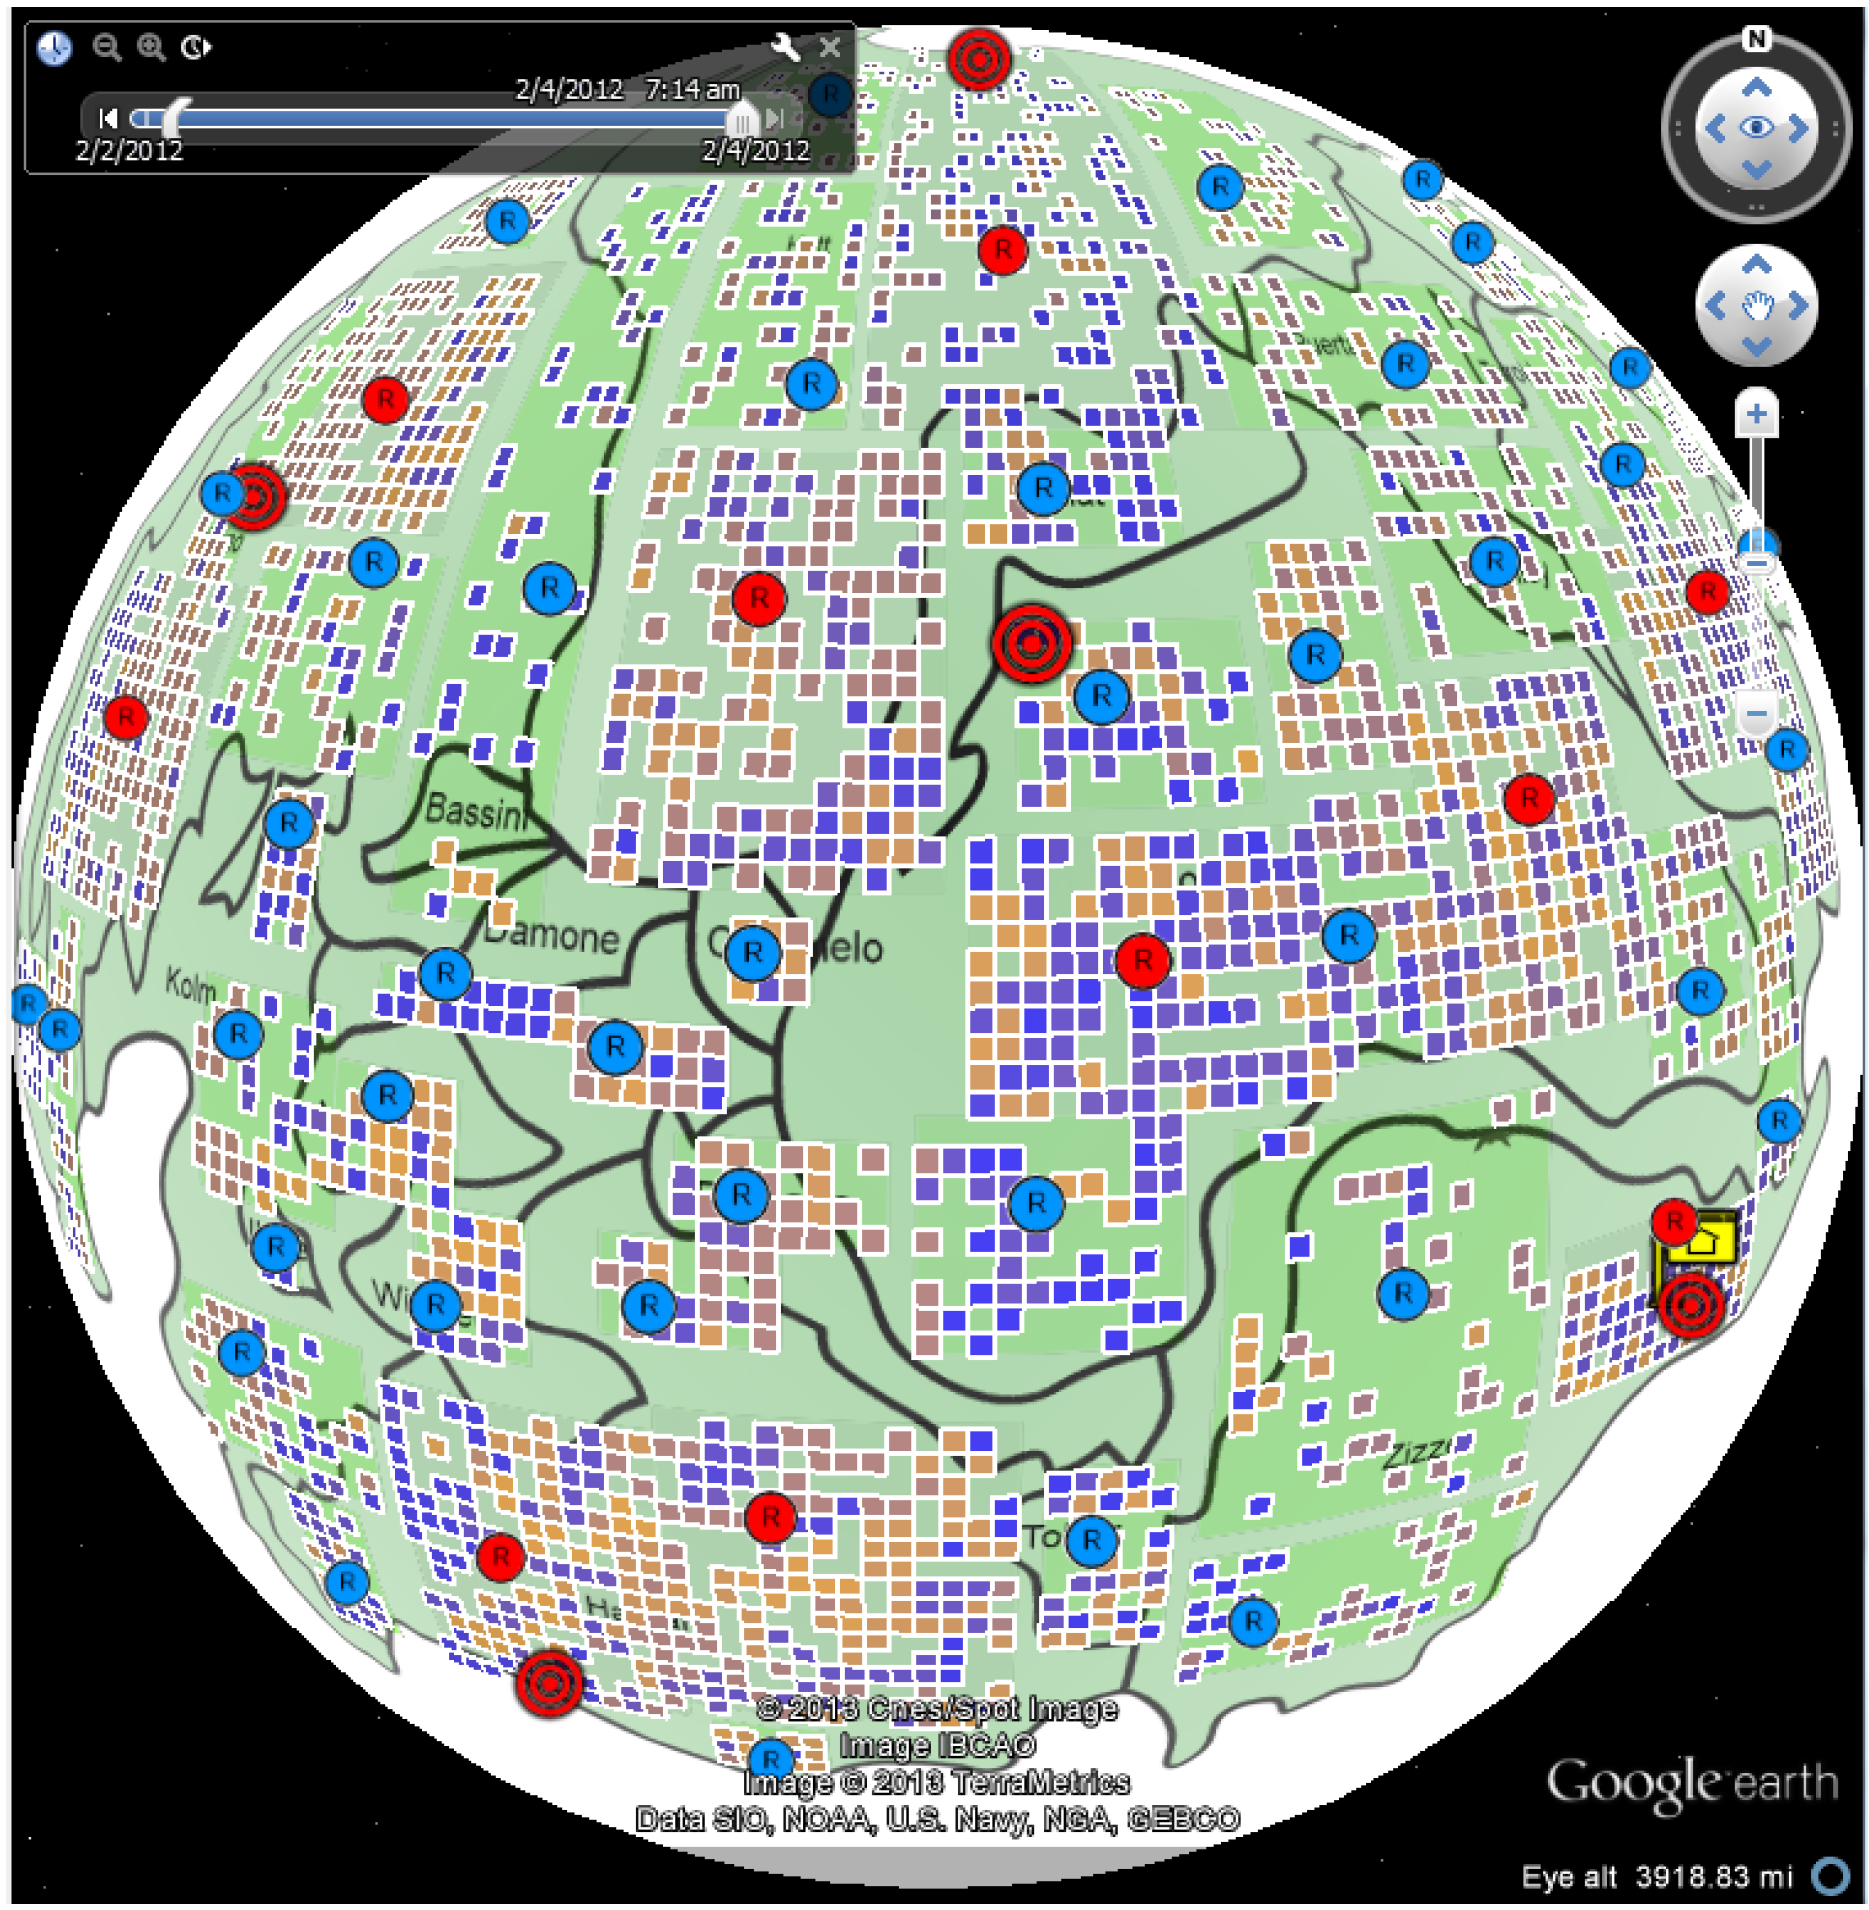
Besides “number of online machines”, another attribute “number of connections” can be used for situation awareness visualization. Using the machine type of “workstation teller” as the study example, we find over-density clusters spread all over the BoM world during the two days of time. In Figure 10, we find that clusters are primarily in two colors, making the geographical distribution uneven. There might be some relationship between the clusters and chronological orders.
Figure 10. Clusters of the number of connections are found during the entire data time range. Colors from blue to orange represent different time points in an increasing order.
Informatics 01 00100 g010
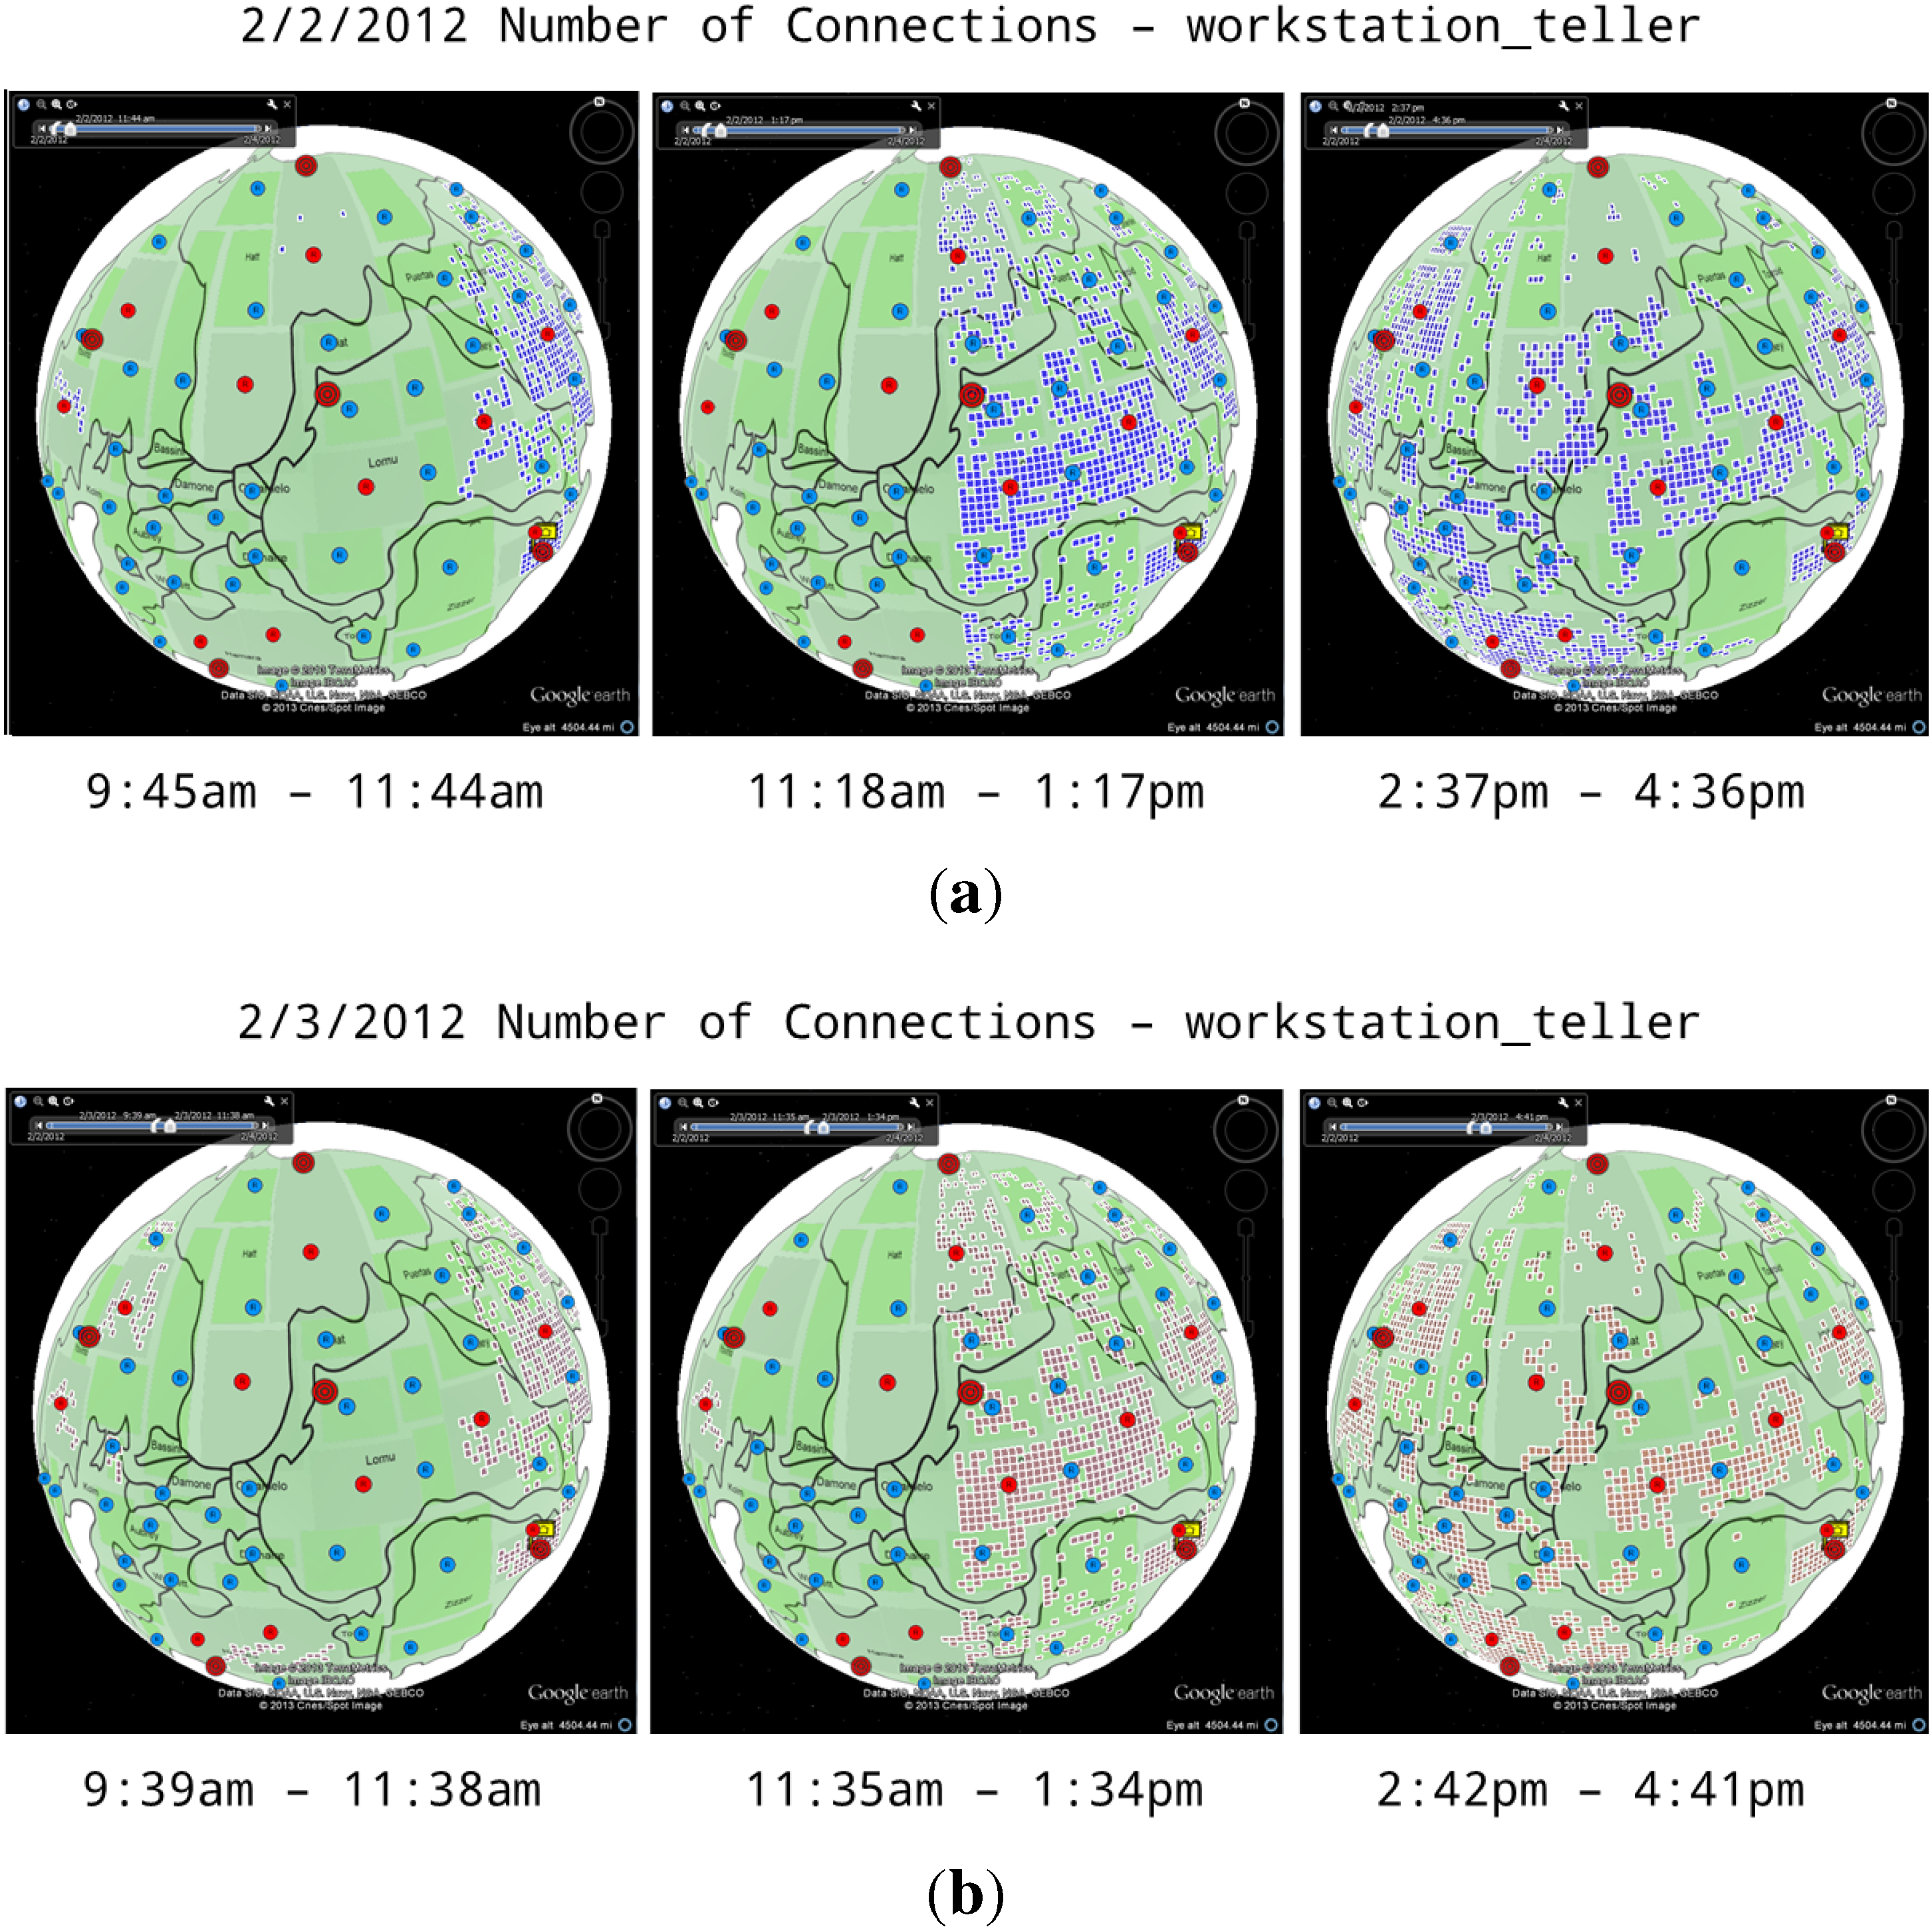
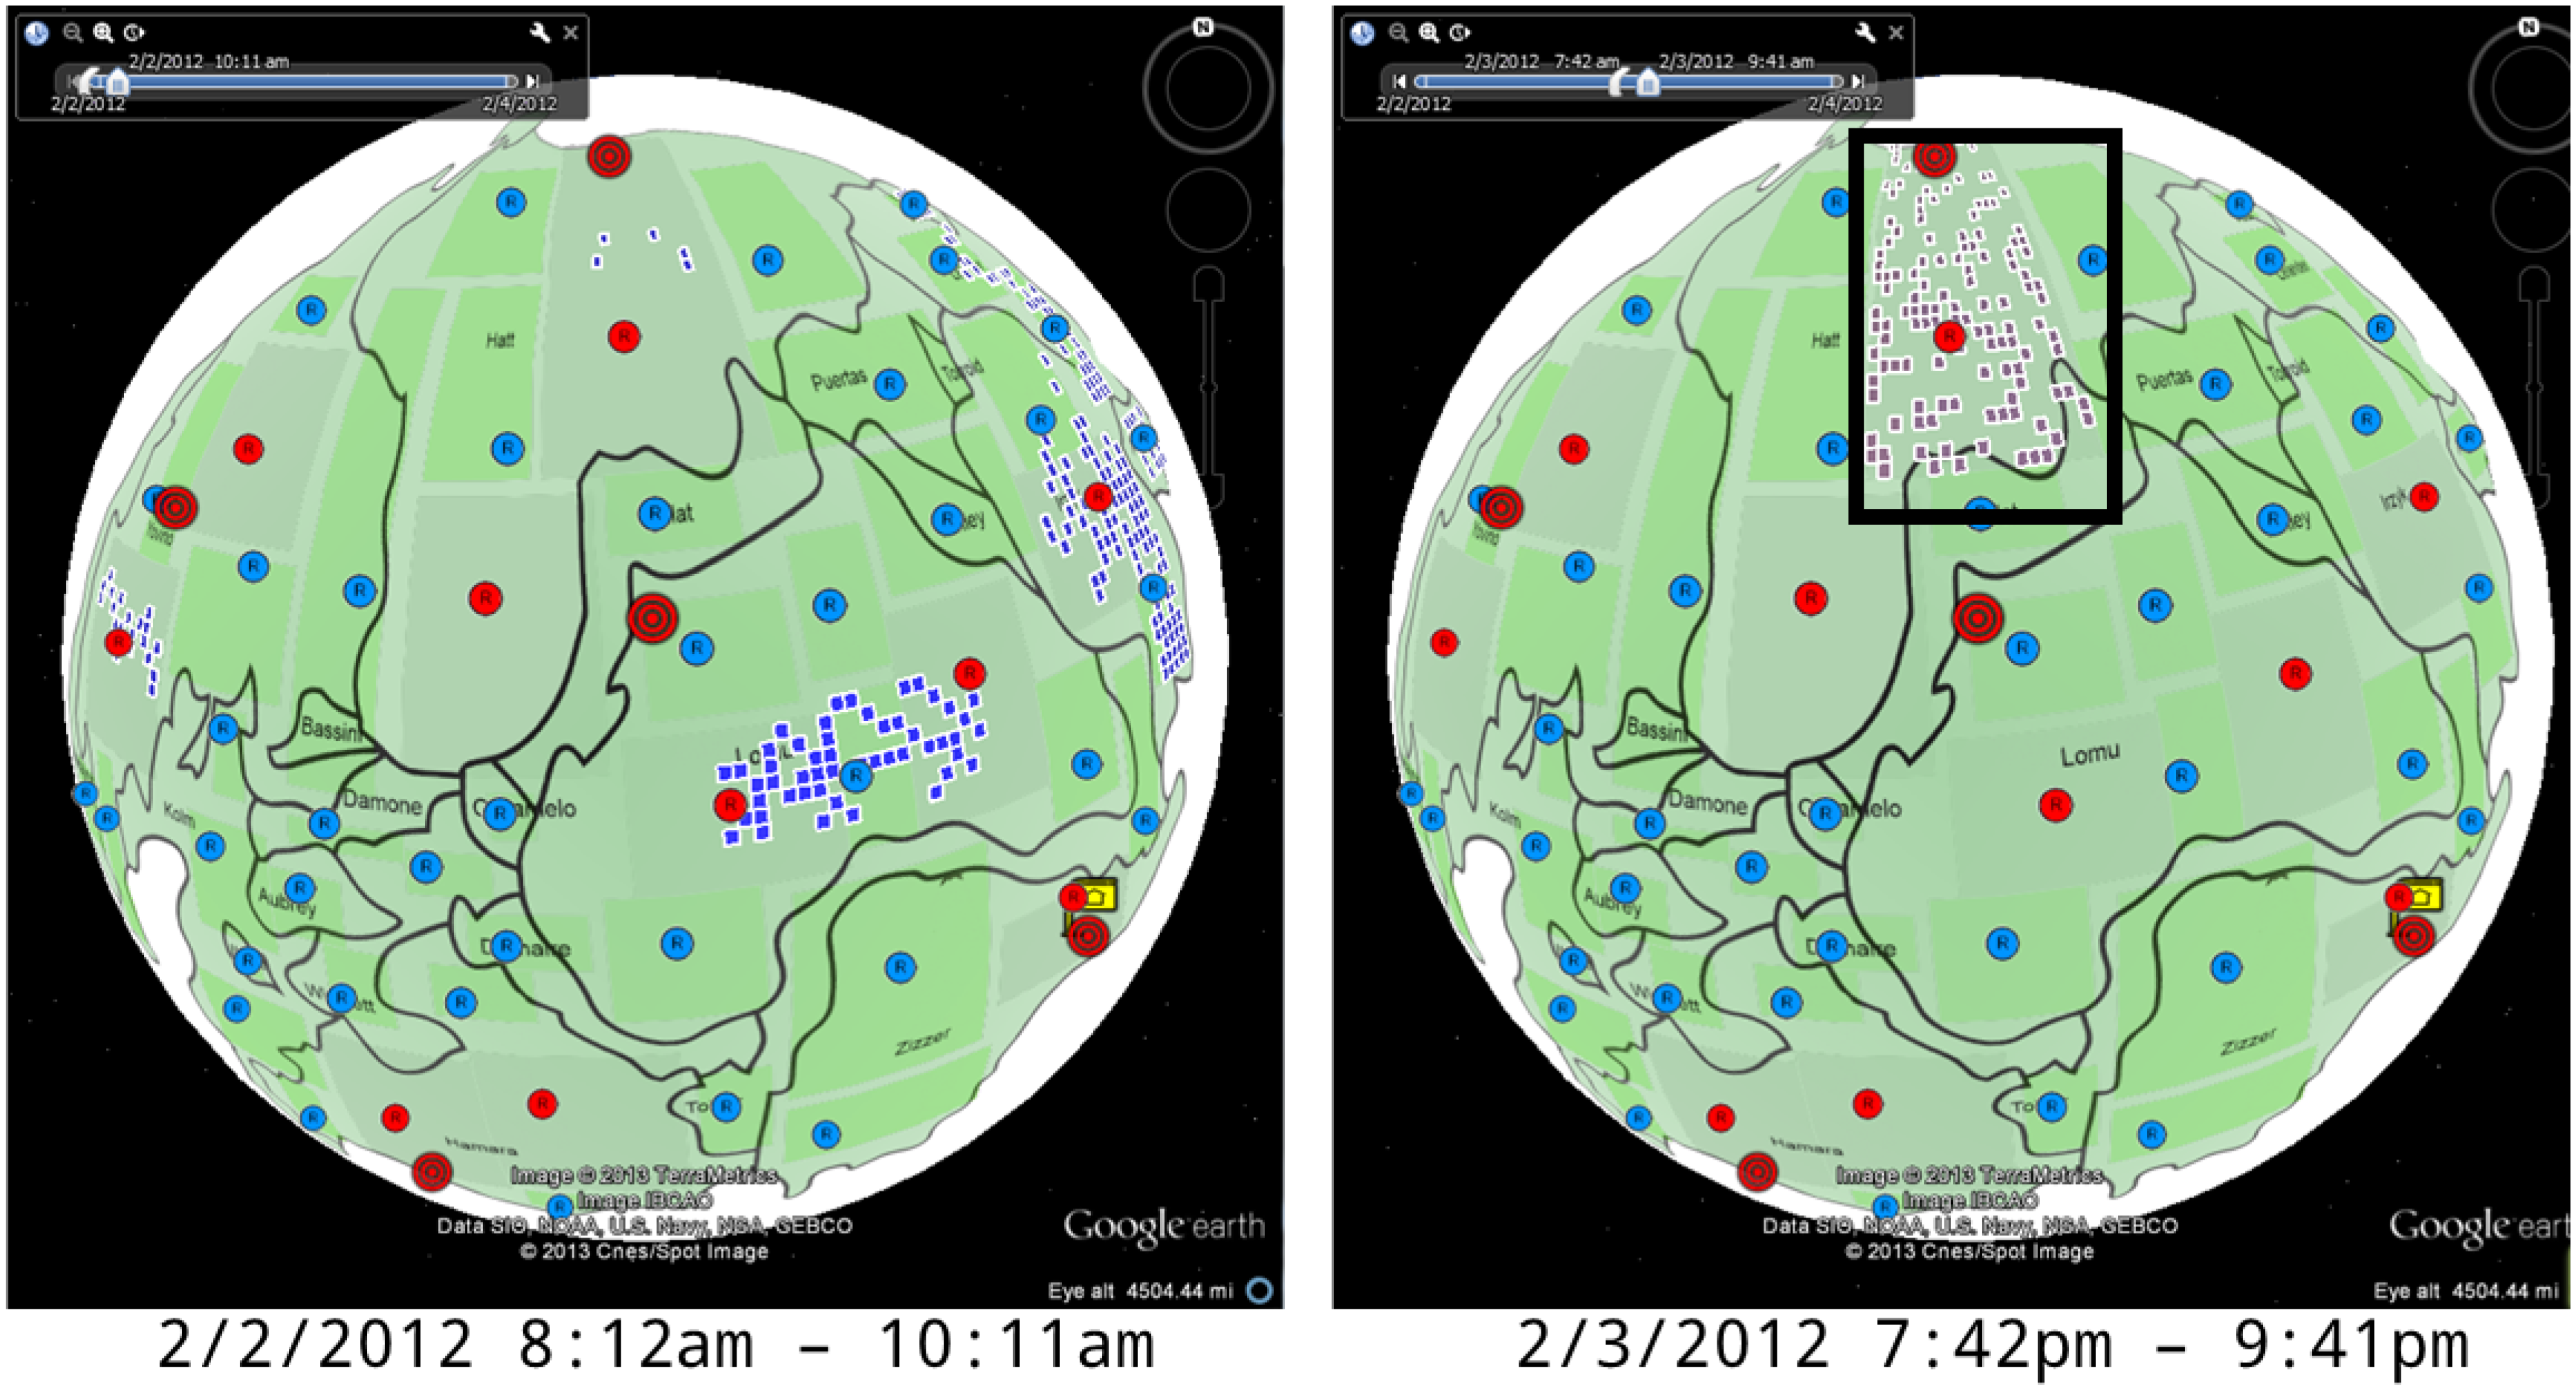
In order to study with further inference, we reduce the length of the present display time window. By setting a 2 h time window and taking snapshots during the same time window for each day, we could easily discover a trend of cluster generation, which is similar to the one of the moving trend by the number of machines discussed in the previous section. Figure 11 compares the cluster distribution over two consecutive days (2–3 February 2012). The almost consistent distributions prove the conjecture we made earlier, except a distinct difference from 8:00 am to 10:00 am.
The significant inconformity is suggested by Figure 12, in which a particular cluster is shown in the right part of the figure (highlighted in black box). The clusters are in different regions on the first day, while the clusters are concentrated in one area on the second day. We observe numerous over-density grids, which suggests an abnormal increasing of values of the selected attribute, i.e., the number of connections, during the two morning hours of the second day. Furthermore, the abnormality happens only in a large region. It is clearly abnormal and suspicious that such a huge number of connections happens during that time.
Figure 11. Over-density anomaly cluster distribution of two-hour windows for the machine type of “workstation teller” and the attribute “number of connections”. The moving trend across different zones by an increasing order during the first and the second days is clear. (a) 2 February 2012; (b) 3 February 2012.
Informatics 01 00100 g011
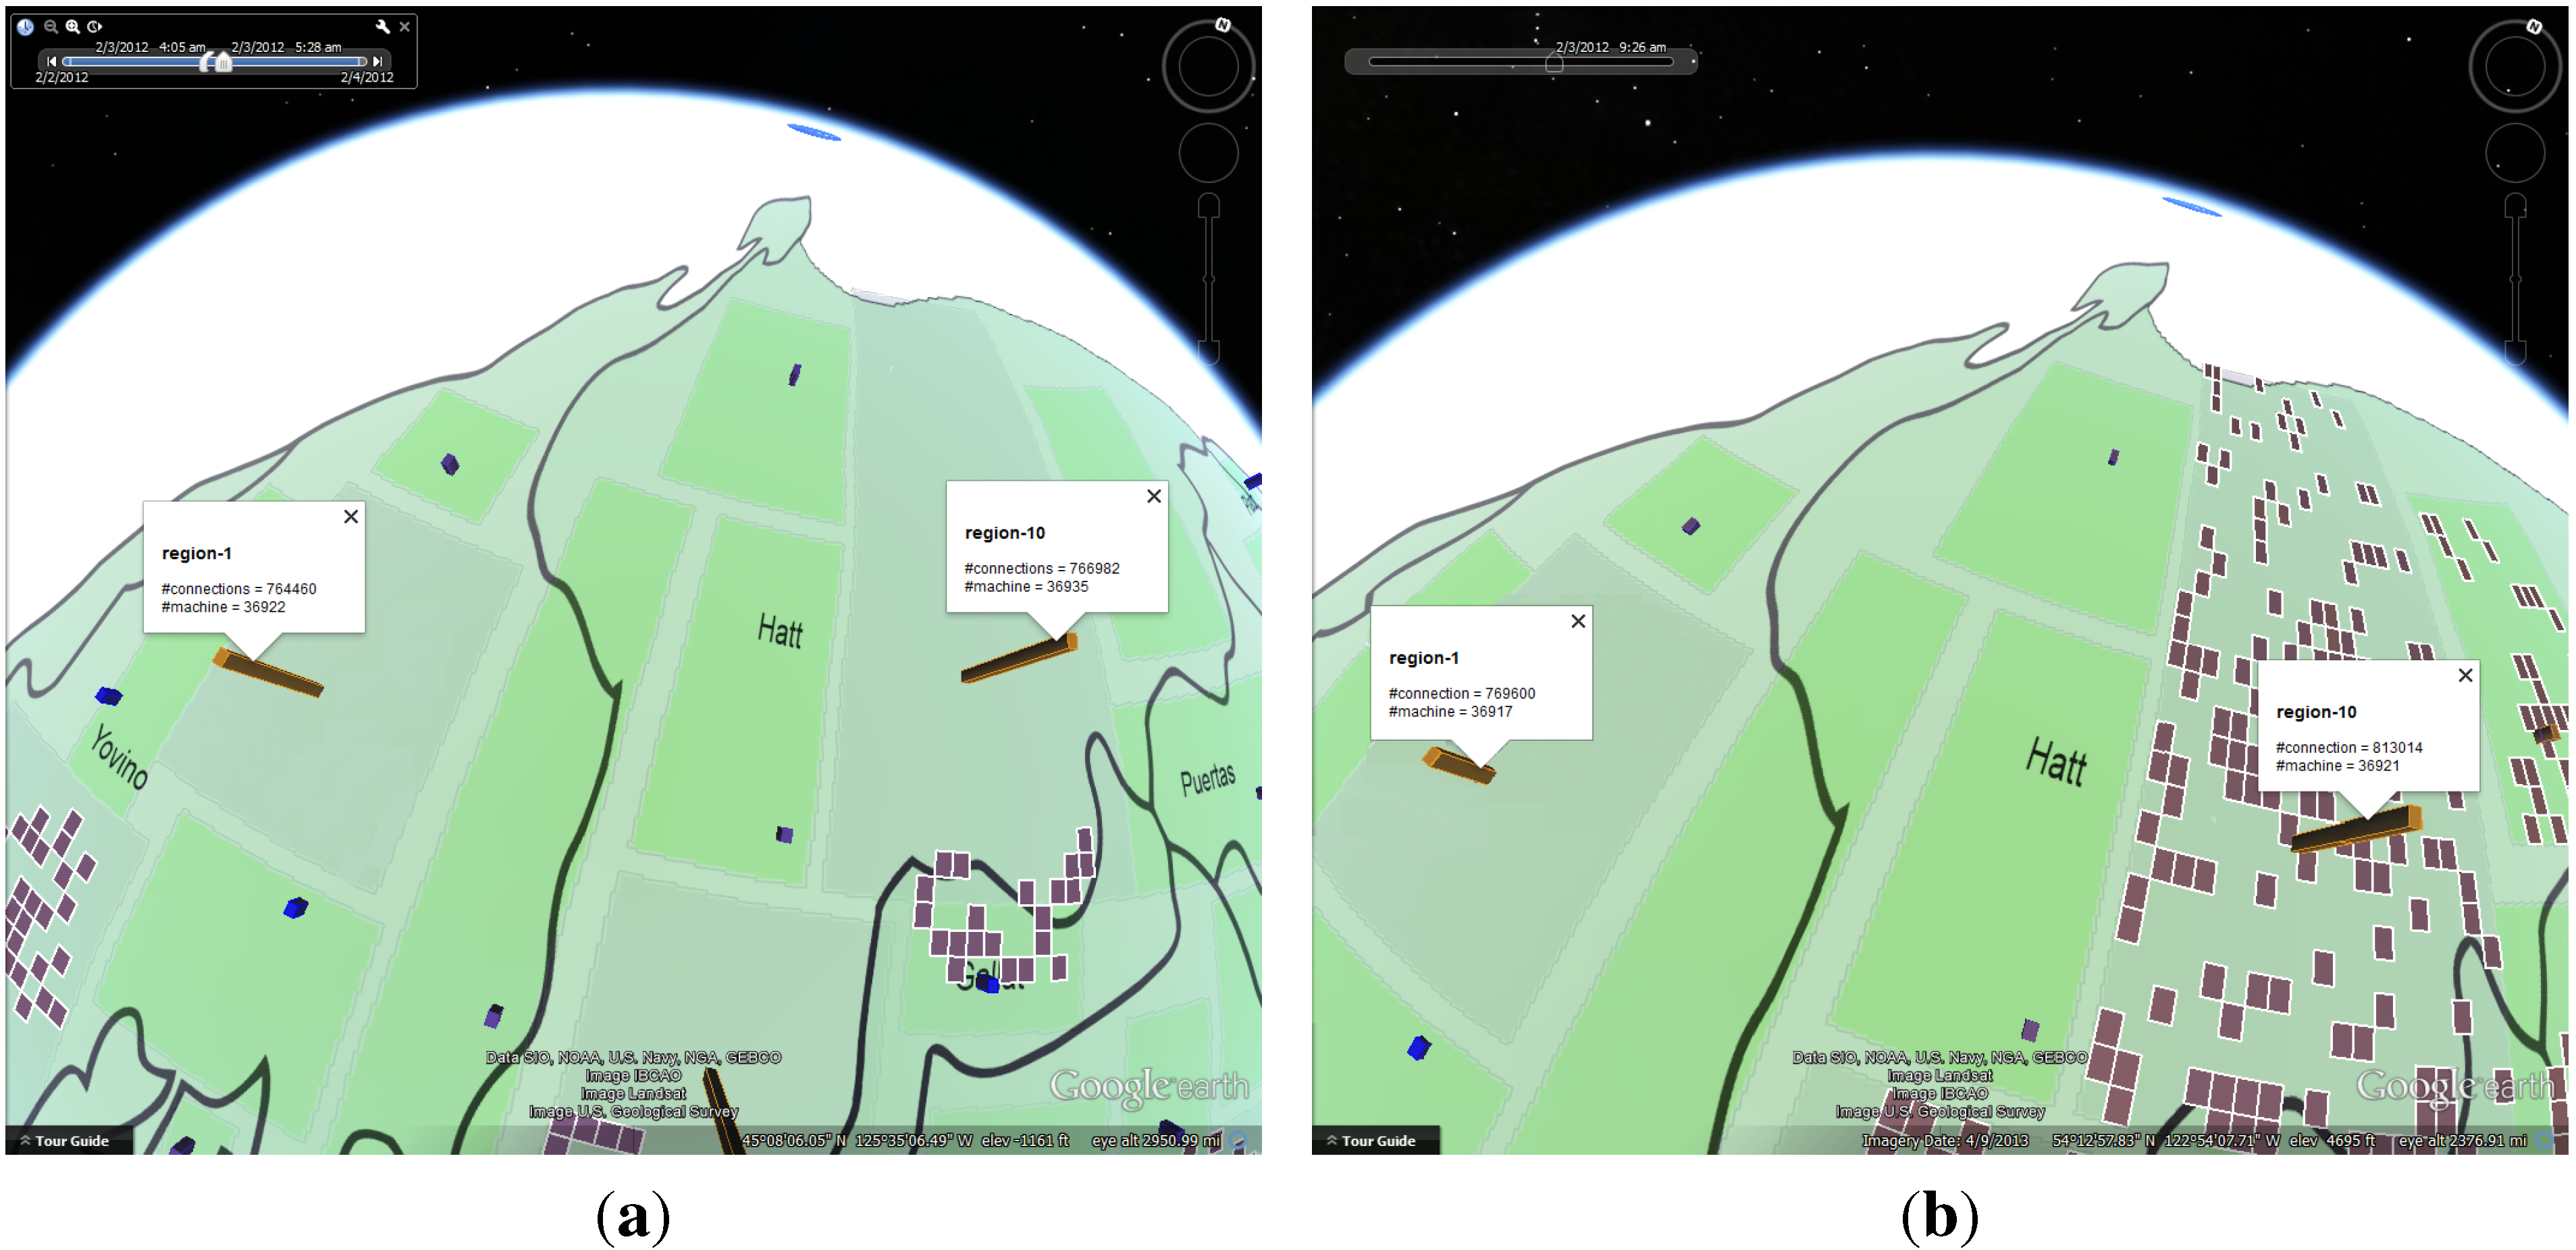
Supplementary anomaly bars can be superimposed on the map by selecting the option on the left control panel, as shown in Figure 13. By comparing the “interesting area” (region-10) between the first and the second day, we find that the number of connections in Region 1 grows by 5,150 while the number of connections in Region 10 grows by 46,032. This suggests that the number of connections in the suspicious Region 10 grows nine times faster than the neighboring region. Further investigation verifies that the suspicious event is indeed caused by the increased use of teller machines during off hours in affected Region 10.
Figure 12. The left picture shows that clusters are in different regions on the first day, while the right picture shows that grids are all concentrated in one region on the second day.
Informatics 01 00100 g012
Figure 13. Aggregation values of the attribute “number of connections” in two neighboring regions (1 and 10) during the same time of day. Region 10 grows nine times more than Region 1. (a) First day; (b) Second day.
Informatics 01 00100 g013

4.1.4. Policy Status

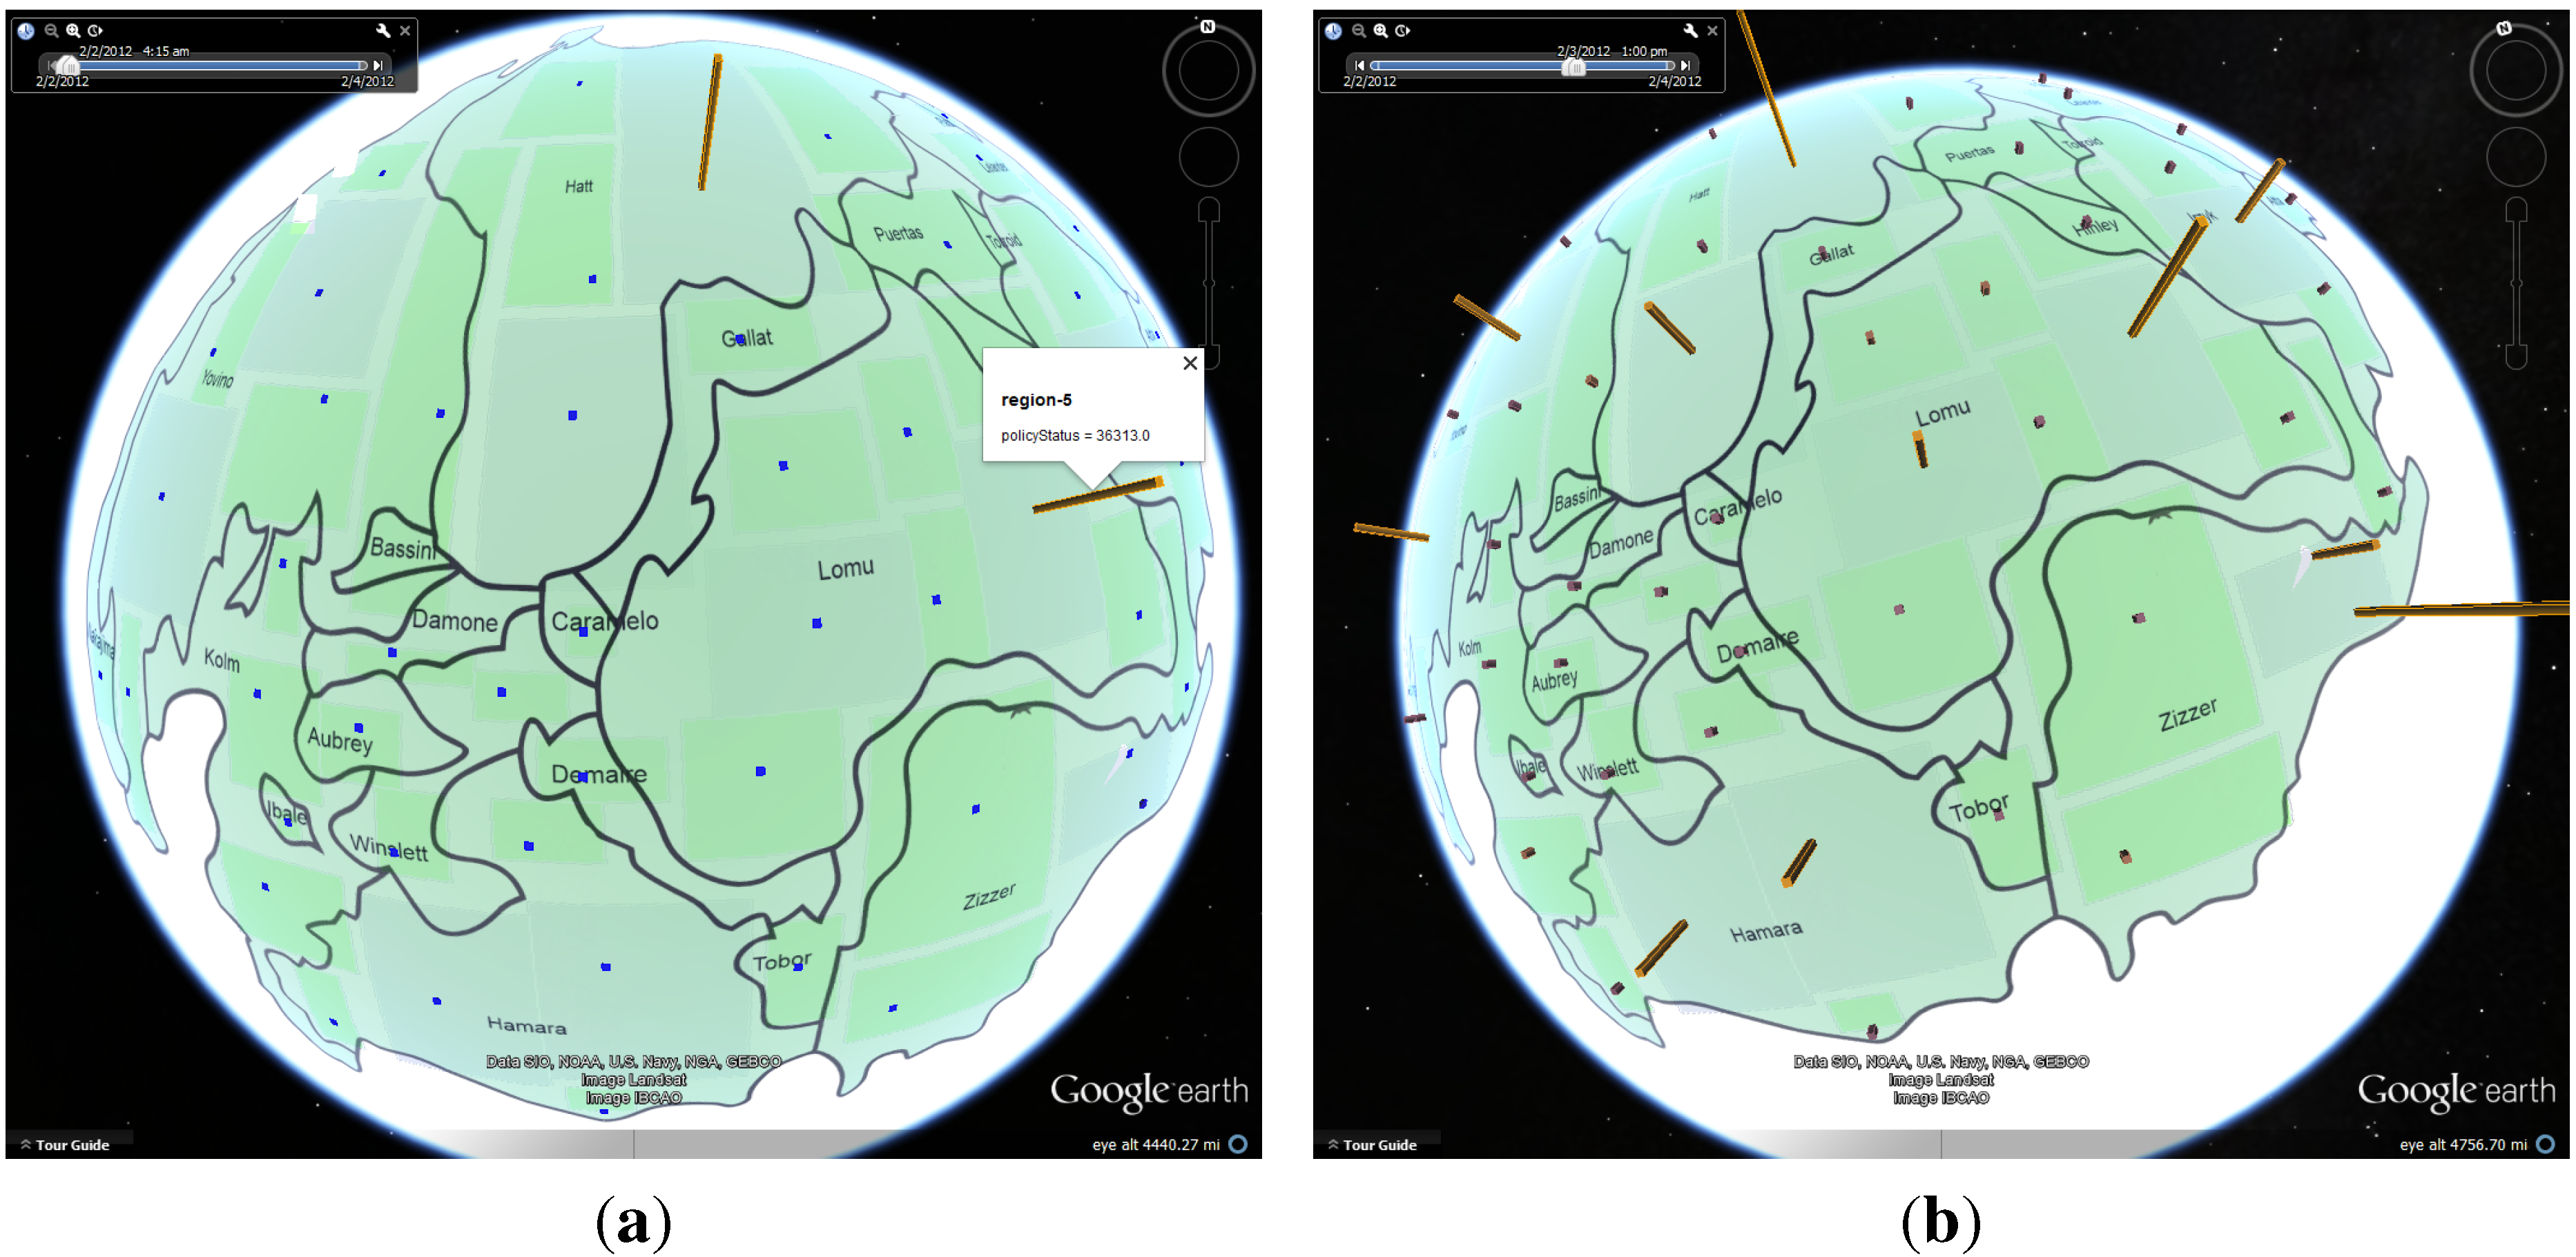
Lastly, we examine the attribute “policy status”, which indicates how well the machine complies with the security policy. The values of the policyStatus are: healthy (1); moderate policy deviation (2); serious policy deviation and non-critical patches failing (3); critical and patches failing (4); and possible infection or questionable files found (5). Anomaly bars can be easily visualized to observe the change of the system status, as shown in Figure 14. The heights of the policy status bars represent how severe a policy violation issue of machines is, e.g., perhaps caused by malicious users and applications under cyber attacks. The rising patterns and moving trend of the policy status can be critical indicators of the network health for enterprise networks, like BoM, especially when the policy status anomaly happens in the company’s headquarters. It seems that most policy deviation warnings consistently exist over time, while the sum of policyStatus keeps rising. Another possibility might be that the increase of policyStatus happens in all large regional offices, because the large regional offices are common targets for various intrusion attempts.
Figure 14. Bank of Money’s (BoM) policy status changes. A few regions have significantly higher bars, indicating severe policy violations, possibly caused by malicious attack activities. (a) February 2, 2012, 8:15 am; (b) 3 February, 2012, 1:00 pm.
Informatics 01 00100 g014

4.2. Case Study: Environmental Quality

Nowadays, people are more concerned about living quality and environmental factors around their places. For this case study, we use the developed visualization tool to analyze the air quality data.

4.2.1. Data Process and Visualization

In the field of environmental protection, the Air Quality Index (AQI) is a common and comprehensive measurement to judge air quality by counting various sub-measures, such as PM2.5, PM10, sulfur dioxide index, etc. These data measure particular particles that might be especially dangerous and can easily penetrate human’s lung and bloodstream. The air pollution problem in developing countries, such as China, becomes increasingly challenging. We collect the AQI data from more than 34 sensor stations in Beijing provided on the web site of the Beijing Municipal Environmental Protection Bureau from January to March of 2013 and combine them with the relative sensor stations’ location information. The sensors’ locations are distributed in the main hubs of communication, the urban area and the surrounding suburbs.
One main challenge of this case from the previous one is that each data item itself represents a measuring result for its local area, which could be viewed as zone data. Since there is only one data value in the entire zone, detecting significant spatiotemporal changes may be challenging with clustering. In addition, missing or a lack of sufficient measurement data is another challenge for investigators to analyze. We set multiple anomaly grid sizes for different view levels. When the investigator zooms out for an overview, the larger size of grids with the relative scanning result will be shown. When zooming in, grids in the smaller size will take the place of the larger grids to visualize with appropriate information contents. In addition, anomaly bars are used to indicate the AQI dynamics at different sensor stations’ locations.
We assign different colors to each AQI category to make it easier for investigators to understand quickly whether air pollution is reaching unhealthy levels in the communities. There are six levels describing air quality status based on the PM2.5 AQI standard from the best to the worst, as shown in Table 1. The heights of bars are based on the values’ min-max normalization. By clicking on a bar, detailed information, such as the AQI value and current status, will be illustrated.
Table 1. The PM2.5 air quality Air Quality Index (AQI) standard based on the WHO’s recommendations.
PM 2.5 (China) μg/m 3 24 h AverageLevel DescriptionBar Color
0–35ExcellentDark blue
35–75GoodBlue
75–115Slightly pollutedGreen
115–150Lightly PollutedYellow
150–250Moderately pollutedOrange
250+Heavily pollutedRed

4.2.2. Analysis

First, we have a general overview picture by studying the grids’ movement trend; then, we zoom in and observe the grids’ distribution in more detail, as in Figure 4. After these steps, we should have a general conclusion that the AQI value changes more significantly in the urban area (within the sixth ring road).
As the next step, we focus on the changing trend of all sensors’ AQI values in the urban area, as illustrated in Figure 15. Higher bars are signs of air pollution, which usually causes a fog and haze, because smog in the air reaches a critical level. By setting the time window in January, viewing the changing trend of bar heights and colors, as well as combining the knowledge with the underlying anomaly grid distribution information, we estimate that the city’s urban area has a high probability of fog and haze from the 11th to the 14th and from the 18th to the 30th, which indeed happened. There are three main candidates for the smog: coal-based heating, automotive tail gas pollution and unusual weather.
Figure 15. Anomaly grids and bars of the Air Quality Index (AQI) in Beijing during January and February, 2013. (a) January 9; (b) January 11; (c) January 13; (d) January 18; (e) January 27; (f) February 9; (g) February 11; (h) February 13; (i) February 18; (j) February 27.
Informatics 01 00100 g015
We further narrow down the candidates and possible reasons by comparing the situation at other times, e.g., February. Through observing the grid distribution, fog and haze starts mainly after 21 February and is located in the same urban area. The exact dates are matched: 9th, 13th, 21st, 24th and 28th. In comparison with January, the cold temperature is the same, which means the city remains under the same coal-based heating level. Therefore, we could infer that the main reason for the abating smog is perhaps not weather related, but possibly due to fewer vehicles with less tail gas release. The flowing or migrating population of Beijing usually starts to cut down at the beginning of February because of so-called spring transportation. People will travel back to their hometown to celebrate the traditional Chinese New Year from the 9th to the 17th. An estimated more than nine million people left the city temporarily during the festival term. Interestingly, the anomaly of special fog and haze on the 9th could be an exception, due to the fireworks, as a convention of celebration. The increasing trend of AQI from the 21st till the end of February also could be a demonstration, as urban transportation pressure returns after the 21st, as people come back from the holiday.

5. Conclusions and Further Work

Data with additional important dimensions, such as time and space, have become common. In order to understand and analyze the abnormal changing patterns from these spatiotemporal data, we develop an interactive visual analytic tool that adopts an overview plus detail investigation flow. The multiple-level anomaly grids and bars derived from spatiotemporal mining allow fast and effective visual analysis of the status changing trend, both in terms of time and geographic regions. While spatiotemporal data analysis gains increasing attention among researchers, it is nevertheless challenging and requires further research studies. It is our hope that the demonstration of this work may be general enough to detect and analyze anomalies or abnormal activities in many other spatiotemporal datasets for better situation awareness. Future work includes developing methods for analyzing zones with very different spatial scales, as well as developing more useful functions and increasing the level of the user interactions of such an analytic system.

Acknowledgements

This work was supported in part by CMU Early Career grant C61920, China National 973 project 2014CB340301 and NSFC grant 61379088.

Author Contributions

Tao Zhang implemented the visualization system and drafted the work. Qi Liao developed the concept and design of the work, edited and revised the final paper. Lei Shi advised on the interactive visualization design and color mapping choices. Weishan Dong contributed in terms of the GridScan clustering algorithm.

Conflicts of Interest

The authors declare no conflict of interest.

References

  1. Von Landesberger, T.; Bremm, S.; Andrienko, N.; Andrienko, G.; Tekusova, M. Visual analytics methods for categoric spatio-temporal data. In Proceedings of the IEEE Conference on Visual Analytics Science and Technology (VAST), Seattle, WA, USA, 14–19 October, 2012; pp. 183–192.
  2. Roddick, J.F.; Spiliopoulou, M. A bibliography of temporal, spatial and spatio-temporal data mining research. SIGKDD Explor. Newsl. 1999, 1, 34–38. [Google Scholar] [CrossRef]
  3. Rao, K.; Govardhan, A.; Rao, K. Spatiotemporal data mining: Issues, tasks and applications. Int. J. Comput. Sci. Eng. Surv. 2012, 3, 39–52. [Google Scholar]
  4. Tsoukatos, I.; Gunopulos, D. Efficient mining of spatiotemporal patterns. In Proceedings of the 7th International Symposium on Advances in Spatial and Temporal Databases (SSTD ’01), Redondo Beach, CA, USA, 12–15 July, 2001; pp. 425–442.
  5. Mamoulis, N.; Cao, H.; Kollios, G.; Hadjieleftheriou, M.; Tao, Y.; Cheung, D.W. Mining, indexing, and querying historical spatiotemporal data. In Proceedings of the Tenth ACM SIGKDD International Conference on Knowledge Discovery and Data Mining (KDD ’04), Seattle, WA, USA, 22–25 August, 2004; pp. 236–245.
  6. Mennis, J.; Liu, J.W. Mining association rules in spatio-temporal data. In Proceedings of the Seventh International Conference on GeoComputation, Southampton, UK, 8–10 September, 2003.
  7. Compieta, P.; Martino, S.D.; Bertolotto, M.; Ferrucci, F.; Kechadi, T. Exploratory spatio-temporal data mining and visualization. J. Vis. Lang. Comput. 2007, 18, 255–279. [Google Scholar] [CrossRef]
  8. Nöllenburg, M. Geographic visualization. In Human-Centered Visualization Environments; Springer: Berlin/Heidelberg, Germany, 2006; pp. 257–294. [Google Scholar] [CrossRef]
  9. Andrienko, N.; Andrienko, G.; Gatalsky, P. Exploratory spatio-temporal visualization: An analytical review. J. Vis. Lang. Comput. 2003, 14, 503–541. [Google Scholar] [CrossRef]
  10. Oliveira, M.; Baptista, C.; Falcao, A. A Web-Based Environment for Analysis and Visualization of Spatio-Temporal Data Provided by OGC Services. In Proceedings of the Fourth International Conference on Advanced Geographic Information Systems, Applications, and Services, Valencia, Spain, 30 January–4 February, 2012; pp. 183–189.
  11. Cao, N.; Lin, Y.R.; Sun, X.; Lazer, D.; Liu, S.; Qu, H. Whisper: Tracing the spatiotemporal process of information diffusion in real time. IEEE Trans. Vis. Comput. Graph. 2012, 18, 2649–2658. [Google Scholar]
  12. Dang, T.N.; Wilkinson, L.; Anand, A. Stacking graphic elements to avoid over-plotting. IEEE Trans. Vis. Comput. Graph. 2010, 16, 1044–1052. [Google Scholar] [CrossRef] [PubMed]
  13. Tominski, C.; Schulze-Wollgast, P.; Schumann, H. 3D Information Visualization for Time Dependent Data on Maps. In Proceedings of the Ninth International Conference on Information Visualisation, London, UK, 6–8 July 2005; pp. 175–181.
  14. Dong, W.; Zhang, X.; Li, L.; Sun, C.; Shi, L.; Sun, W. Detecting Irregularly Shaped Significant Spatial and Spatio-Temporal Clusters; SDM. SIAM/Omnipress: Anaheim, CA, USA, 26–28 April 2002; pp. 732–743. [Google Scholar]
  15. Keim, D.A. Information visualization and visual data mining. IEEE Trans. Vis. Comput. Graph. 2002, 8, 1–8. [Google Scholar] [CrossRef]
  16. Gahegan, M.; Wachowicz, M.; Harrower, M.; Rhyne, T.M. The integration of geographic visualization with knowledge discovery in databases and geocomputation. Cartogr. Geogr. Inf. Sci. 2001, 28, 29–44. [Google Scholar] [CrossRef]
  17. Andrienko, N.; Andrienko, G.; Gatalsky, P. Towards Exploratory Visualization of Spatio-Temporal Data. In Proceedings of the 3rd AGILE Conference on Geographic Information Science, Helsinki/Espoo, Finland, 25–27 May, 2000; Volume 2, pp. 137–142.
  18. Weiskopf, D.; Schramm, F.; Erlebacher, G.; Ertl, T. Particle and Texture Based Spatiotemporal Visualization of Time-Dependent Vector Fields. In Proceedings of IEEE Visualization (VIS 05), Minneapolis, MN, USA, 23–28 October, 2005; pp. 639–646.
  19. Plumejeaud, C.; Vincent, J.M.; Grasland, C.; Bimonte, S.; Mathian, H.; Guelton, S.; Boulier, J.; Gensel, J. HyperSmooth: A system for interactive spatial analysis via potential maps. Web Wirel. Geogr. Inf. Syst. 2008, 5373, 4–16. [Google Scholar]
  20. Chae, J.; Thom, D.; Bosch, H.; Jang, Y.; Maciejewski, R.; Ebert, D.S.; Ertl, T. Spatiotemporal Social Media Analytics for Abnormal Event Detection and Examination using Seasonal-Trend Decomposition. In Proceedings of the IEEE Conference on Visual Analytics Science and Technology (VAST), Seattle, WA, USA, 14–19 October, 2012; pp. 143–152.
  21. Andrienko, G.L.; Andrienko, N.V.; Rinzivillo, S.; Nanni, M.; Pedreschi, D.; Fosca, G. Interactive Visual Clustering of Large Collections of Trajectories. In Proceedings of the IEEE Conference on Visual Analytics Science and Technology (VAST), Atlantic City, NJ, USA, 11–16 October, 2009; pp. 3–10.
  22. Tominski, C.; Schumann, H.; Andrienko, G.; Andrienko, N. Stacking-based visualization of trajectory attribute data. IEEE Trans. Vis. Comput. Graph. 2012, 18, 2565–2574. [Google Scholar] [CrossRef]
  23. Kapler, T.; Wright, W. GeoTime Information Visualization. In Proceedings of the IEEE Symposium on Information Visualization ( INFOVIS ’04), Austin, TX, USA, 10–12 October, 2004; pp. 25–32.
  24. Smallman, H.S.; John, M.S.; Oonk, H.M.; Cowen, M.B. Information availability in 2D and 3D displays. IEEE Comput. Graph. Appl. 2001, 21, 51–57. [Google Scholar] [CrossRef]
  25. Shepherd, I.D.H. Travails in the Third Dimension: A Critical Evaluation of Three-Dimensional Geographical Visualization. In Geographic Visualization: Concepts, Tools and Applications; John Wiley & Sons: Chichester, England, 2008; Chapter 10; ISBN 9780470515112. [Google Scholar]
  26. Cox, K.C.; Eick, S.G.; He, T. 3D geographic network displays. ACM Sigmod Record 1996, 25, 50–54. [Google Scholar] [CrossRef]
  27. Moore, J.H.; Lari, R.C.; Hill, D.; Hibberd, P.L.; Madan, J.C. Human microbiome visualization using 3D technology. Pac. Symp. Biocomput. 2011, 154–164. [Google Scholar]
  28. Kristensson, P.O.; Dahlbäck, N.; Anundi, D.; Björnstad, M.; Gillberg, H.; Haraldsson, J.; Mårtensson, I.; Nordvall, M.; Ståhl, J. An evaluation of space time cube representation of spatiotemporal patterns. IEEE Trans. Vis. Comput. Graph. 2009, 15, 696–702. [Google Scholar] [CrossRef] [PubMed]
  29. Choudhury, S.; Kodagoda, N.; Nguyen, P.; Rooney, C.; Attfield, S.; Xu, K.; Zheng, Y.; Wong, B.; Chen, R.; Slabbert, G.M.; et al. M-Sieve: A Visualisation Tool for Supporting Network Security Analysts: VAST 2012 Mini Challenge 1 Award: “Subject Matter Expert’s Award”. In Proceedings of the IEEE Conference on Visual Analytics Science and Technology (VAST 2012) Challenge Workshop (VisWeek’12), Seattle, WA, USA, 14–19 October, 2012; pp. 265–266.
  30. Kachkaev, A.; Dillingham, I.; Beecham, R.; Goodwin, S.; Ahmed, N.; Slingsby, A. Monitoring the Health of Computer Networks with Visualization: VAST 2012 Mini Challenge 1 Award: “Efficient use of Visualization”. In Proceedings of the IEEE Conference on Visual Analytics Science and Technology (VAST 2012) Challenge Workshop (VisWeek’12), Seattle, WA, USA, 14–19 October, 2012; pp. 269–270.
  31. Zhang, T.; Liao, Q.; Shi, L. 3D Anomaly Bar Visualization for Large-scale Network: VAST 2012 Mini Challenge 1. In Proceedings of the IEEE Conference on Visual Analytics Science and Technology (VAST 2012) Challenge Workshop (VisWeek’12), Seattle, WA, USA, 14–19 October, 2012; pp. 291–292.
  32. Kalnis, P.; Mamoulis, N.; Bakiras, S. On Discovering Moving Clusters in Spatio-Temporal Data. In Proceedings of the 9th international conference on Advances in Spatial and Temporal Databases (SSTD’05), Angra dos Reis, Brazil, 22–24 August, 2005; pp. 364–381.
  33. Andrienko, G.; Andrienko, N.; Hurter, C.; Rinzivillo, S.; Wrobel, S. From Movement Tracks through Events to Places: Extracting and Characterizing Significant Places from Mobility Data. In Proceedings of the IEEE Conference on Visual Analytics Science and Technology (VAST), Providence, RI, USA, 23–28, October, 2011; pp. 161–170.
  34. Crnovrsanin, T.; Muelder, C.; Correa, C.; Ma, K.L. Proximity-based Visualization of Movement Trace Data. In Proceedings of the IEEE Conference on Visual Analytics Science and Technology (VAST), Atlantic City, NJ, USA, 11–16 October, 2009; pp. 11–18.
  35. Kulldoff, M. A spatial scan statistic. Commun. Stat.-Theory Methods 1997, 26, 1481–1496. [Google Scholar] [CrossRef]
  36. Mohammadi, S.H.; Janeja, P.V.; Gangopadhyay, A. Discretized Spatio-Temporal Scan Window. In Proceedings of the Ninth SIAM International Conference on Data Mining, Sparks, NV, USA, 30 April–2 May, 2009; pp. 1197–1208.
  37. Kulldorff, M.; Athas, W.; Feuer, E.; Miller, B.; Key, C. A space-time scan statistic and brain cancer in Los Alamos. Am. J. Public Health 1998, 88, 1377–1380. [Google Scholar] [CrossRef] [PubMed]