
Is Gold a Hedge against Stock Price Risk in U.S. or Indian Markets?


Abstract
:1. Introduction
- (a)
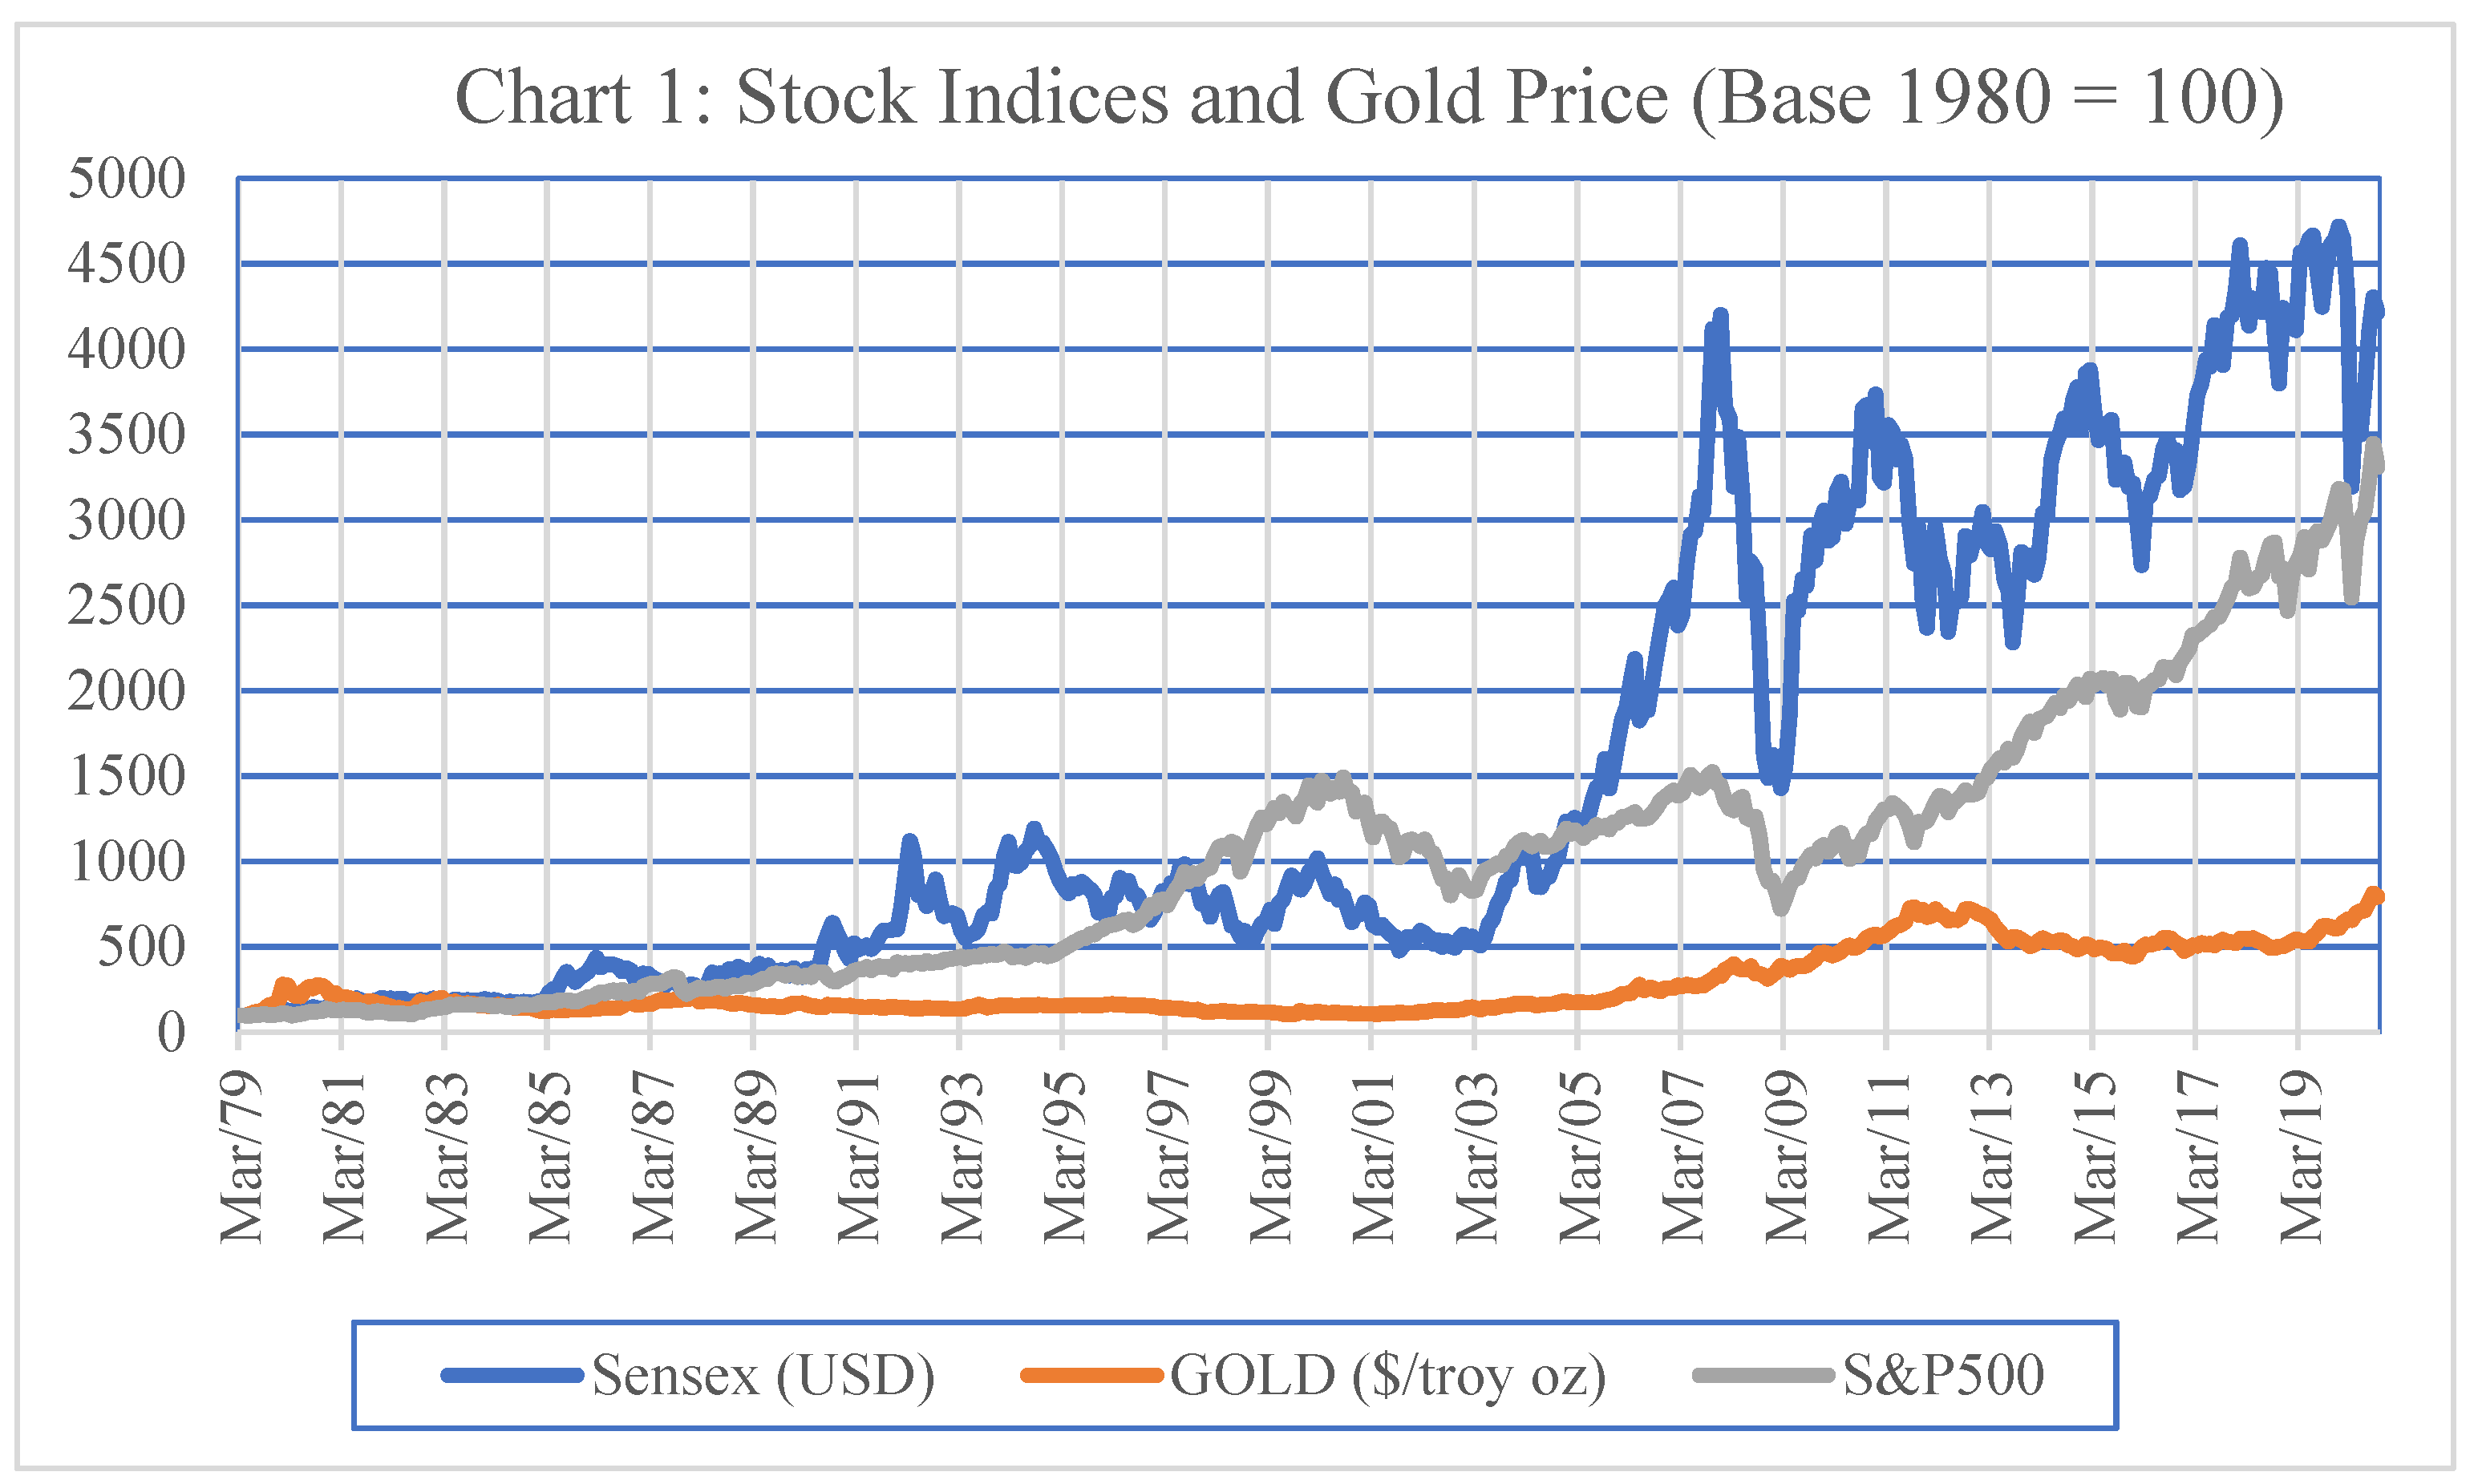
- This extends the few significant studies, known to the authors, on the relationship between gold and stock in the U.S. as well as a large and emerging market such as India over a fairly long period of 1980–2020. This period is sufficiently long to cover multiple financial market crises such as the 1987 crash, the 2000 dot com boom and crash, the 2008 global financial crisis, and, more recently, the COVID-19-led crash in 2020.
- (b)
- We study the hedge and safe haven behaviour of gold in multiple sub-periods within the overall time period of study. While studying the co-variance between gold and the risky assets, the previous studies have not evaluated any regime shift over time. Mei and McNown (2019) had concluded that the behaviour of gold was a strong hedge for the U.S. stocks changed between before and after the 2008 global financial crisis. It was shown to be a strong hedge before the crisis and a weak hedge afterward. However, they did not study if there was any transition across multiple time periods.
- (c)
- We evaluate the relationship between gold and stock returns in the periods of low volatility, i.e., in calm markets. To the best of our understanding, the previous studies have focussed only on the periods of low returns and/or high volatility to understand whether gold acts as a safe haven. It is important to also understand the behaviour in less volatile market conditions.
2. Literature Review
- (A)
- One set of studies found a negative relationship between gold and stock prices. McDonald and Solnick (1977) studied the correlation between gold, inflation, and security returns. They found that gold mining stocks provided the benefit of diversification to European stock portfolios. Similarly, Chua et al. (1990) found that a 25% proportion of gold in a stock portfolio improved the return to risk ratio of the latter. However, they also found the correlation between gold and stocks to be increasing over time, which would imply a decreasing benefit of diversification. On the other hand, Hillier et al. (2006) found weak, and at times, negative correlations between precious metals (gold, silver, platinum, etc.) and S&P 500. They found it useful to include precious metals in the portfolio of stocks.Baur and Lucey (2010) checked the relationship between gold, stock, and bond prices together. The authors were amongst the first ones to explicitly introduce and test the safe haven characteristic of gold. This meant that gold prices had no relationship with the prices of other risky assets, in situations of extreme price movement of the latter. They found that for the stocks traded in the United Kingdom, Germany, and the United States, gold acted as a safe haven. In addition, gold had a negative relationship with stock prices under non-extreme scenarios in the United States and the United Kingdom. In other words, gold was also a hedge for stocks in these countries. However, it was not a safe haven for bonds in any of these countries.
- (B)
- There were also a few studies which did not find a significant relationship between gold and stock prices. McCown and Zimmerman (2006) tested the relationship between the returns on gold and the MSCI stock indices (U.S. as well as world), using the capital asset pricing model (CAPM). He found that gold was a zero-beta asset, i.e., it did not move with the stock indices over long periods of time.
- (C)
- Another dimension of the past studies has been on the relationship between gold and stocks in the developed versus emerging markets.Baur and McDermott (2010) analysed a sample spanning a 30 year period from 1979 to 2009 and showed that gold was both a hedge and a safe haven for major European stock markets and the US when returns were analysed at daily frequency. However, it was not the case for Australia, Canada, or Japan. Gold, however, ceased to be a hedge nor a safe haven against the U.S. stocks, when the returns were measured on a weekly or monthly basis. The latter is an important reference for our study as we have tested the relationship for returns at monthly intervals only.They found that for large, emerging markets such as the BRIC countries (Brazil, Russia, India, and China) it was neither a hedge nor a safe haven when the tests were conducted on daily, weekly, or monthly returns. Curiously, in the case of India, when the tests were performed on weekly returns, gold was found to be a safe haven, in the period when the returns were in the range of the bottom 5% or 10% of historical returns. However, it ceased to be a safe haven when returns fell to the bottom 1% of the historical range. Gold was not a hedge for the Indian stock market in any case.Baur and McDermott (2016) examined the relationship between assets across asset classes. They tested the MSCI world stock market index, the S&P 500 index, the US 10-year Treasury bonds, gold, silver and the CRB commodity index (all denominated in US dollars). During periods of stress, gold, US Treasury bonds, the US dollar, and the Swiss Franc were found to behave as “safe haven” assets. They posited that the variation of gold price posed a risk for investors, unlike the gilt, which assured a risk-free rate even in times of a crisis. They posed the question as to why investors were yet attracted to gold. Their explanation was that psychological and emotional factors affect the decisions of investors during periods of market turmoil. For example, when investors are faced with choices in uncertain times, they encounter cognitive limitations. They suggested that the results of safe haven behaviour of assets should be understood through the lens of investor behaviour.Jaffe (1989); Baur and McDermott (2010); Mensi et al. (2014); Beckmann et al. (2015b); El Hedi Arouri et al. (2015); Mei and McNown (2019); and Ghazali et al. (2020) studied the relationship of gold with emerging market stocks. At a more specific level, Baur and McDermott (2010); Beckmann et al. (2015b); Shalini and Prasanna (2016); and Ghazali et al. (2020); and Bouri et al. (2017) studied the stocks traded on the Indian stock market.Jain and Ghosh (2013) examined, in the Indian context, the relationship among global oil prices, precious metal (gold, platinum and silver) prices, and Indian Rupee–US Dollar exchange. The study, however, did not include the impact on stock prices.Gürgün and Ünalmış (2014) studied the daily returns of gold and stocks of 28 emerging market countries, in their local currencies as well as in USD. They found that gold was a hedge and/or a safe haven for the domestic investors of several emerging markets. Secondly, the safe haven property of gold was stronger during extreme losses in equity markets both for domestic and foreign investors. For India, gold was found to be a strong hedge, though not as strong as a safe haven for USD investors. Furthermore, for the Indian domestic investors, gold did not behave as a hedge or a safe haven.Mensi et al. (2014) studied the relationship between gold and the stock prices of BRICS countries. Using daily prices from 1997–2013, they found that gold acts as neither a hedge nor a safe haven in these countries.El Hedi Arouri et al. (2015) studied the impact of gold prices on Chinese stock prices for the period from March 2004 to March 2011. They found a significant relationship between the returns and volatilities of gold and stock prices in China. They observed that the inclusion of gold in a portfolio comprising of Chinese stocks boosted its risk-adjusted return. Gold also effectively hedged against stock risk over time. They found that a gold asset served as a safe haven for Chinese stocks in the period of crisis as well.Beckmann et al. (2015b) performed a broad study that included data from 18 individual economies and 5 regional indices on a monthly frequency. They went beyond the Baur and McDermott (2010) model and introduced a transition variable in their estimation model. They found that gold varyingly served as a hedge or a safe haven, and this depended on the markets and their conditions. In the case of Indian stocks, gold acted as a strong safe haven but not a hedge.Shalini and Prasanna (2016) studied the relationship between a wide range of commodities and the stock markets. They found that metals had an inverse relationship with stock prices at all times. In addition, the volatility of the metal prices suffered a regime shift in times of a crisis and returned fast to the normal level of volatility.Soja (2019) developed an optimal portfolio that included the Eurozone bond index with investment grade rating, the Eurostoxx50 (a stock index), and gold, using the Markowitz methodology. The author concluded that an optimal portfolio should include gold between 1% and 9%, depending upon the level of risk acceptable to an investor.Mei and McNown (2019) studied the relationship between returns and volatility across stock markets in the U.S., and China, against gold. The study was for the period of 1996–2018. They showed that the hedging ability of gold varied over time. It was a strong hedge for the U.S. stocks before the 2008 financial crisis but turned into a weak hedge after the crisis. For China, gold was a weak hedge throughout the period of study.Ghazali et al. (2020) investigated and confirmed the role of gold as a hedge against stock market collapse in five countries. They also found gold to be a prominent asset for investment in US, UK, China, and India but not in Malaysia.
- (D)
- There have been studies to test the relationship of gold prices with exchange rates, either in themselves or as a factor behind equity portfolios. Capie et al. (2005) analysed the role of gold as a hedge against the U.S. dollar. They found a negative relationship between the two but shifting over time. Beckmann et al. (2015a) found in the context of multiple currency-linked gold prices that the volatility of dollar exchange rates resulted in strong hedging function of the gold prices.Hood and Malik (2013) examined the relationship between gold and other precious metals and the U.S. stock market volatility index (VIX) to check whether the former were a hedge or a safe haven. They found that gold, unlike other precious metals, served as a hedge and a weak safe haven for US stock market. However, in periods of extremely low or high volatility, gold did not have a negative correlation with the US stock market, and VIX was found to be a superior hedging tool and served as a better safe haven than gold.Chkili (2016) looked at the dynamic relationship between gold and stock prices in the BRIC countries. He used the weekly prices and found that the dynamic conditional correlation (DCC) between the two variables switched between positive and negative over the period of 2000–2014. The gold price exhibited a low to negative correlation with stock prices during periods of major financial crises, leading to the conclusion that gold could act as a safe haven in times of such crises.Interestingly, Bouri et al. (2017) studied the impact of the internal gold and oil price volatility on the Indian stock price volatility during the period 2009–2016. They found that the implied volatility of the former affected the volatility of the latter. They also found that there was an inverse and two-way relationship between the volatilities of gold and oil prices.
- (E)
- A few recent studies have focussed on the impact of COVID-19 on the behaviour of gold as a hedge against stock price risk.Salisu et al. (2021a) compared the safe haven property of gold during the COVID-19 period with the behaviour immediately before the COVID-19. They found that gold did act as a safe haven but to a lesser extent during the COVID-19 than before the COVID-19 period. Yousaf et al. (2021) have studied the safe haven behaviour of gold across thirteen Asian stock markets during the COVID-19 period. They found that gold acted as a strong safe haven in China, Indonesia, Singapore, and Vietnam, and a weak safe haven in Pakistan and Thailand. Gold did not exhibit safe haven property for the stock markets in Hong Kong, India, Malaysia, or Philippines.Salisu et al. (2021b) have, in another paper, studied the hedging relationship between the U.S. stocks and gold. They found a significant hedging relationship, though it was weaker during the COVID-19 pandemic, compared to the prior period.
3. Data and Methodology
- H0: bt = 0
- H1: bt <> 0
- (a)
- For the entire data set from 1980–2020. This helps understand the long-term relationship between gold and stock prices.
- (b)
- For four sub-sets of the data for 10 years each. The sub-sets are for the periods 1980–1989, 1990–1999, 2000–2009, and 2010–2020. The tests on these data sets help us understand if there is a shift in the observed relationships over time.
- (a)
- the observations pertaining to the top 10%, 5%, and 1% of the volatility during the period. The results for these regressions are presented in Table 4.
- (b)
- the observations pertaining to the bottom 10%, 5%, and 1% of the volatility during the period. The results for these regressions are presented in Table 5.
Robustness Test
4. Results
4.1. Regressions for Data Stratified by Returns
4.2. Regressions for Periods Stratified by Volatility Using GARCH
- (c)
- the observations pertaining to the top 10%, 5%, and 1% of the volatility during the sample period. The results for these regressions are presented in Table 5A,B.
- (d)
- the observations pertaining to the bottom 10%, 5%, and 1% of the volatility during the period. The results for these regressions are presented in Table 6A,B.
5. Conclusions
Funding
Data Availability Statement
Conflicts of Interest
| 1 | https://www.providentmetals.com/knowledge-center/precious-metals-resources/world-gold-production-consumption.html (accessed on 15 November 2020). |
| 2 | World Bank data. https://data.worldbank.org/indicator/CM.MKT.LCAP.CD?most_recent_value_desc=true (accessed on 20 November 2020). |
| 3 | Sovereign Gold Bond Scheme, Reserve Bank of India https://m.rbi.org.in/Scripts/FAQView.aspx?Id=109 (accessed on 17 November 2020). |
| 4 | Value of gold imported into India, Statista.com, https://www.statista.com/statistics/625818/import-value-of-gold-india/ (accessed on 17 November 2020). |
References
- Baur, Dirk G., and Brian M. Lucey. 2010. Is Gold a Hedge or a Safe Haven? An Analysis of Stocks, Bonds and Gold. Financial Review 45: 217–29. [Google Scholar] [CrossRef]
- Baur, Dirk G., and Thomas K. J. McDermott. 2010. Is gold a safe haven? International evidence. Journal of Banking and Finance 34: 1886–98. [Google Scholar] [CrossRef]
- Baur, Dirk G., and Thomas K. J. McDermott. 2016. Why is gold a safe haven? Journal of Behavioral and Experimental Finance 10: 63–71. [Google Scholar] [CrossRef]
- Beckmann, Joscha, and Robert Czudaj. 2013. Gold as an inflation hedge in a time-varying coefficient framework. The North American Journal of Economics and Finance 24: 208–22. [Google Scholar] [CrossRef] [Green Version]
- Beckmann, Joscha, Robert Czudaj, and Keith Pilbeam. 2015a. Causality and volatility patterns between gold prices and exchange rates. The North American Journal of Economics and Finance 34: 292–300. [Google Scholar] [CrossRef] [Green Version]
- Beckmann, Joscha, Theo Berger, and Robert Czudaj. 2015b. Does gold act as a hedge or a safe haven for stocks? A smooth transition approach. Economic Modelling 48: 16–24. [Google Scholar] [CrossRef] [Green Version]
- Bouri, Elie, Anshul Jain, Pratap Chandra Biswal, and David Roubaud. 2017. Cointegration and nonlinear causality amongst gold, oil, and the Indian stock market: Evidence from implied volatility indices. Resources Policy 52: 201–6. [Google Scholar] [CrossRef]
- Bredin, Don. 2015. Does gold glitter in the long-run? Gold as a hedge and safe haven across time and investment horizon. International Review of Financial Analysis 41: 320–28. [Google Scholar] [CrossRef]
- Capie, Forrest, Terence C. Mills, and Geoffrey Wood. 2005. Gold as a hedge against the dollar. Journal of International Financial Markets, Institutions and Money 15: 343–52. [Google Scholar] [CrossRef]
- Chkili, Walid. 2016. Dynamic correlations and hedging effectiveness between gold and stock markets: Evidence for BRICS countries. Research in International Business and Finance 38: 22–34. [Google Scholar] [CrossRef]
- Chua, Jess H., Gordon Sick, and Richard S. Woodward. 1990. Diversifying with Gold Stocks. Financial Analysts Journal 46: 76–79. [Google Scholar] [CrossRef]
- Ciner, Cetin, Constantin Gurdgiev, and Brian M. Lucey. 2013. Hedges and safe havens: An examination of stocks, bonds, gold, oil and exchange rates. International Review of Financial Analysis 29: 202–11. [Google Scholar] [CrossRef]
- El Hedi Arouri, Mohamed, Amine Lahiani, and Duc Khuong Nguyen. 2015. World gold prices and stock returns in China: Insights for hedging and diversification strategies. Economic Modelling 44: 273–82. [Google Scholar] [CrossRef] [Green Version]
- Ghazali, Mohd Fahmi, Hooi Hooi Lean, and Zakaria Bahari. 2020. Does Gold Investment offer protection against stock market losses? evidence from five countries. Singapore Economic Review 65: 275–301. [Google Scholar] [CrossRef] [Green Version]
- Gürgün, Gözde, and İbrahim Ünalmış. 2014. Is gold a safe haven against equity market investment in emerging and developing countries? Finance Research Letters 11: 341–48. [Google Scholar] [CrossRef]
- Hillier, David, Paul Draper, and Robert Faff. 2006. Do Precious Metals Shine? An Investment Perspective. Financial Analysts Journal 62: 98–106. [Google Scholar] [CrossRef]
- Hoang, Thi-Hong-Van, Hooi Hooi Lean, and Wing-Keung Wong. 2015. Is gold good for portfolio diversification? A stochastic dominance analysis of the Paris stock exchange. International Review of Financial Analysis 42: 98–108. [Google Scholar] [CrossRef]
- Hood, Matthew, and Farooq Malik. 2013. Is gold the best hedge and a safe haven under changing stock market volatility? Review of Financial Economics 22: 47–52. [Google Scholar] [CrossRef]
- Jaffe, Jeffrey F. 1989. Gold and Gold Stocks as Investments for Institutional Portfolios. Financial Analysts Journal 45: 53–59. [Google Scholar] [CrossRef]
- Jain, Anshul, and Sajal Ghosh. 2013. Dynamics of global oil prices, exchange rate and precious metal prices in India. Resources Policy 38: 88–93. [Google Scholar] [CrossRef]
- McCown, James Ross, and John R. Zimmerman. 2006. Is Gold a Zero-Beta Asset? Analysis of the Investment Potential of Precious Metals (SSRN Scholarly Paper ID 920496). Social Science Research Network. Available online: https://susy.mdpi.com/user/manuscripts/proof/file/7b7e1636988b5e754b8ba49372e1e47f (accessed on 31 August 2020). [CrossRef]
- McDonald, John G., and Bruno H. Solnick. 1977. Valuation and strategy for gold stocks. Journal of Portfolio Management 3: 29–33. [Google Scholar] [CrossRef]
- Mei, Ganghua, and Robert McNown. 2019. Dynamic causality between the U.S. stock market, the Chinese stock market and the global gold market: Implications for individual investors’ diversification strategies. Applied Economics 51: 4742–56. [Google Scholar] [CrossRef]
- Mensi, Walid, Shawkat Hammoudeh, Juan Carlos Reboredo, and Duc Khuong Nguyen. 2014. Do global factors impact BRICS stock markets? A quantile regression approach. Emerging Markets Review 19: 1–17. [Google Scholar] [CrossRef]
- Michaud, Richard O., Robert Michaud, and Katharine Pulvermacher. 2011. Gold as a Strategic Asset (SSRN Scholarly Paper ID 2402862). Social Science Research Network. Available online: https://papers.ssrn.com/abstract=2402862 (accessed on 24 September 2020).
- Salisu, Afees A., Ibrahim D. Raheem, and Xuan Vinh Vo. 2021a. Assessing the Safe Haven Property of the Gold Market during COVID−19 Pandemic. International Review of Financial Analysis 74: 101666. [Google Scholar] [CrossRef]
- Salisu, Afees A., Xuan Vinh Vo, and Brian Lucey. 2021b. Gold and US Sectoral Stocks during COVID-19 Pandemic. Research in International Business and Finance 57: 101424. [Google Scholar] [CrossRef]
- Shahzad, Syed Jawad Hussain, Walid Mensi, Shawkat Hammoudeh, Asiya Sohail, and Khamis Hamed Al-Yahyaee. 2019. Does gold act as a hedge against different nuances of inflation? Evidence from Quantile-on-Quantile and causality-in-quantiles approaches. Resources Policy 62: 602–15. [Google Scholar] [CrossRef]
- Shalini, Velappan, and Krishna Prasanna. 2016. Impact of the financial crisis on Indian commodity markets: Structural breaks and volatility dynamics. Energy Economics 53: 40–57. [Google Scholar] [CrossRef]
- Soja, Tijana. 2019. Gold in investment portfolio from perspective of european investor. Zlato U PORTFOLIO INVESTICIJAMA IZ UGLA EVROPSKOG ULAGAČA 16: 41–58. [Google Scholar]
- Upper, Christian. 2000. How Safe Was the “Safe Haven”? Financial Market Liquidity During the 1998 Turbulences. (SSRN Scholarly Paper ID 219132). Social Science Research Network. Available online: https://papers.ssrn.com/abstract=219132 (accessed on 24 September 2020). [CrossRef] [Green Version]
- Yousaf, Imran, Elie Bouri, Shoaib Ali, and Nehme Azoury. 2021. Gold against Asian Stock Markets during the COVID-19 Outbreak. Journal of Risk and Financial Management 14: 186. [Google Scholar] [CrossRef]

| Variable | Period | Currency | Source of Data | Data Frequency |
|---|---|---|---|---|
| S&P BSE 30 index (Sensex) | January 1980–September 2020 | INR | www.bseindia.com (accessed on 20 November 2020) | Monthly |
| S&P 500 index | January 1980–September 2020 | USD | https://finance.yahoo.com (accessed on 20 November 2020) | Monthly |
| Gold | January 1980–September 2020 | USD | World Bank | Monthly |
| Gold | January 1980–September 2020 | INR | Conversion from USD prices, using USD/INR exchange rate | Monthly |
| USD/INR | January 1980–September 2020 | www.rbi.org.in (accessed on 20 November 2020) | Monthly |
| Sensex (INR)—Monthly returns (not annualised) over the given period | |||||
| 1980–2020 | 1980–1989 | 1990–1999 | 2000–2009 | 2010–2020 | |
| Minimum | −0.2700 | −0.1400 | −0.2600 | −0.2700 | −0.2600 |
| 1st quartile | −0.0300 | −0.0300 | −0.0600 | −0.0325 | −0.0200 |
| Mean | 0.0120 | 0.0156 | 0.0158 | 0.0108 | 0.0064 |
| 3rd quartile | 0.0600 | 0.0600 | 0.0725 | 0.0625 | 0.0400 |
| Maximum | 0.3500 | 0.2100 | 0.3500 | 0.2500 | 0.1300 |
| S&P500 (USD)—Monthly returns (not annualised) over the given period | |||||
| 1980–2020 | 1980–1989 | 1990–1999 | 2000–2009 | 2010–2020 | |
| Minimum | −0.2500 | −0.2500 | −0.1600 | −0.1900 | −0.1300 |
| 1st quartile | −0.0200 | −0.0150 | −0.0100 | −0.0200 | −0.0100 |
| Mean | 0.0068 | 0.0096 | 0.0119 | −0.0026 | 0.0082 |
| 3rd quartile | 0.0300 | 0.0400 | 0.0400 | 0.0225 | 0.0300 |
| Maximum | 0.1200 | 0.1200 | 0.1100 | 0.0900 | 0.1200 |
| Gold (USD)—Monthly returns (not annualised) over the given period | |||||
| 1980–2020 | 1980–1989 | 1990–1999 | 2000–2009 | 2010–2020 | |
| Minimum | −0.1800 | −0.18000 | −0.06 | −0.120 | −0.0700 |
| 1st quartile | −0.0200 | −0.03000 | −0.0100 | −0.010 | −0.0200 |
| Mean | 0.0022 | −0.00462 | 0.0119 | 0.0118 | 0.0043 |
| 3rd quartile | 0.0200 | 0.0200 | 0.0400 | 0.0400 | 0.0200 |
| Maximum | 0.1800 | 0.1800 | 0.1100 | 0.1000 | 0.1100 |
| Gold (INR)—Monthly returns (not annualised) over the given period | |||||
| 1980–2020 | 1980–1989 | 1990–1999 | 2000–2009 | 2010–2020 | |
| Minimum | −0.1600 | −0.16000 | −0.06 | −0.130 | −0.0800 |
| 1st quartile | −0.0200 | −0.02000 | −0.0100 | −0.010 | −0.0200 |
| Mean | 0.0068 | 0.00226 | 0.0119 | 0.0119 | 0.0078 |
| 3rd quartile | 0.0300 | 0.0300 | 0.0400 | 0.0400 | 0.0300 |
| Maximum | 0.2000 | 0.1900 | 0.1100 | 0.1300 | 0.1500 |
| Sensex | S&P500 | |||
|---|---|---|---|---|
| Percentile | Threshold | Observations | Threshold | Observations |
| 10% | −0.08 | 49 | −0.05 | 49 |
| 5% | −0.12 | 25 | −0.07 | 25 |
| 1% | −0.18 | 5 | −0.12 | 5 |
| A | ||||||||||
| 1980–2020 | 1980–1989 | 1990–1999 | 2000–2009 | 2010–2020 | ||||||
| Constant | 0.0069 | *** | 0.0015 | - | 0.0041 | - | 0.0126 | *** | 0.0022 | - |
| (0.0020) | (0.0050) | (0.0035) | (0.0037) | (0.0077) | ||||||
| All periods | −0.0138 | - | 0.0511 | - | 0.0563 | - | −0.0594 | - | −0.2153 | - |
| (0.0256) | (0.0740) | (0.0344) | (0.0458) | (0.1522) | ||||||
| Bottom 10% return periods | 0.1144 | - | 0.3694 | - | 0.2039 | - | 0.0132 | - | −0.0731 | - |
| (0.1269) | (0.5155) | (0.1470) | (0.2889) | (0.2736) | ||||||
| Bottom 5% return periods | 0.3469 | - | 1.6719 | - | 0.1816 | - | 0.3687 | - | 0.3016 | - |
| (0.1897) | (0.7469) | (0.2172) | (0.5148) | (0.3791) | ||||||
| Bottom 1% return periods | −0.5163 | - | NA | - | NA | - | NA | - | NA | - |
| (0.1897) | NA | NA | NA | NA | ||||||
| B. Regression of gold returns on S&P500 returns | ||||||||||
| 1980–2020 | 1980–1989 | 1990–1999 | 2000–2009 | 2010–2020 | ||||||
| Constant | 0.0024 | - | −0.0054 | - | −0.0020 | - | 0.0115 | ** | 0.0042 | - |
| (0.0019) | (0.0051) | (0.0028) | (0.0036) | (0.0030) | ||||||
| All periods | −0.0358 | - | 0.0825 | - | −0.0588 | - | −0.1002 | - | −0.0121 | - |
| (0.0417) | (0.1048) | (0.0693) | (0.0753) | (0.0740) | ||||||
| Bottom 10% return periods | 0.0549 | - | 0.0777 | - | 0.0110 | - | −0.0046 | - | 0.0768 | - |
| (0.1743) | (0.4161) | (0.2650) | (0.4092) | (0.4555) | ||||||
| Bottom 5% return periods | 0.1311 | - | −0.0145 | - | 0.1468 | - | 0.2576 | - | 0.0325 | - |
| (0.2534) | (0.1080) | (0.4904) | (0.5788) | (0.0356) | ||||||
| Bottom 1% return periods | −0.1429 | - | NA | - | NA | - | NA | - | NA | - |
| (0.2660) | NA | NA | NA | NA | ||||||
| A | ||||||||||
| 1980–2020 | 1980–1989 | 1990–1999 | 2000–2009 | 2010–2020 | ||||||
| Constant | 0.0069 | *** | 0.0015 | - | 0.0041 | - | 0.0126 | *** | 0.0022 | - |
| 0.0020) | (0.0050) | (0.0035) | (0.0037) | (0.0077) | ||||||
| All periods | −0.0140 | - | 0.0511 | - | 0.0563 | - | −0.0594 | - | −0.2153 | - |
| (0.0256) | (0.0740) | (0.0344) | (0.0458) | (0.1522) | ||||||
| Top 10% volatility periods | 0.0964 | . | −0.2849 | - | −0.1804 | - | 0.1943 | - | −0.4934 | . |
| (0.0532) | (0.2757) | (0.1032) | (0.1642) | (0.2400) | ||||||
| Top 5% volatility periods | 0.1906 | * | 0.1630 | - | 0.1111 | - | 0.0211 | - | −0.8559 | * |
| (0.0718) | (0.5469) | (0.1571) | (0.3000) | (0.1956) | ||||||
| Top 1% volatility periods | 0.3917 | - | NA | - | NA | - | −0.0200 | - | NA | - |
| (0.2165) | NA | NA | NA | NA | ||||||
| B. Regression of gold returns on S&P500 returns for periods of high volatility using GARCH. | ||||||||||
| 1980–2020 | 1980–1989 | 1990–1999 | 2000–2009 | 2010–2020 | ||||||
| Constant | 0.0025 | - | −0.0054 | - | −0.0020 | - | 0.0115 | ** | 0.0042 | - |
| 0.1870 | 0.2920 | 0.4720 | 0.0018 | 0.1660 | ||||||
| All periods | −0.0367 | - | 0.0825 | - | −0.0588 | - | −0.1002 | - | −0.0121 | - |
| (0.0417) | (0.1048) | (0.0693) | (0.0753) | (0.0740) | ||||||
| Top 10% volatility periods | 0.0016 | - | −0.0165 | - | −0.0075 | - | −0.9231 | - | 0.1542 | - |
| (0.0895) | (0.3898) | (0.0111) | (1.0196) | (0.3700) | ||||||
| Top 5% volatility periods | −0.1160 | - | −0.0131 | - | −0.0300 | ** | −0.4944 | - | 0.0017 | - |
| (0.1129) | (0.0247) | (0.0064) | (0.6582) | (0.0230) | ||||||
| Top 1% volatility periods | 0.1874 | - | NA | - | 0.0100 | - | NA | - | NA | - |
| (0.3035) | NA | NA | NA | NA | ||||||
| A | ||||||||||
| 1980–2020 | 1980–1989 | 1990–1999 | 2000–2009 | 2010–2020 | ||||||
| Constant | 0.0069 | *** | 0.0015 | - | 0.0041 | - | 0.0126 | *** | 0.0022 | - |
| (0.0020) | (0.0050) | (0.0035) | (0.0037) | (0.0077) | ||||||
| All periods | −0.0138 | - | 0.0511 | - | 0.0563 | - | −0.0594 | - | −0.2153 | - |
| (0.0256) | (0.0740) | (0.0344) | (0.0458) | (0.1522) | ||||||
| Bottom 10% volatility periods | 0.0964 | . | 0.1374 | - | 0.2978 | * | −0.0905 | - | 0.0466 | - |
| (0.0532) | (0.1400) | (0.1045) | (0.0810) | (0.7639) | ||||||
| Bottom 5% volatility periods | 0.1906 | * | 0.3793 | - | 0.1904 | - | −0.1488 | . | 1.9826 | - |
| (0.0718) | (0.6477) | (0.1355) | (0.0675) | (3.2726) | ||||||
| Bottom 1% volatility periods | 0.3916 | - | NA | - | NA | - | NA | - | NA | - |
| (0.0718) | NA | NA | NA | NA | ||||||
| B. Regression of gold returns on S&P500 returns for periods of low volatility using GARCH. | ||||||||||
| 1980–2020 | 1980–89 | 1990–99 | 2000–09 | 2010–20 | ||||||
| Constant | 0.0024 | - | −0.0054 | - | −0.0020 | - | 0.0115 | ** | 0.0042 | - |
| (0.0019) | (0.0051) | (0.0028) | (0.0036) | (0.0030) | ||||||
| All periods | −0.0358 | - | 0.0825 | - | −0.0588 | - | −0.1002 | - | −0.0121 | - |
| (0.0417) | (0.1048) | (0.0693) | (0.0753) | (0.0740) | ||||||
| Bottom 10% volatility periods | 0.0059 | - | −0.0213 | - | −0.0116 | - | −0.3839 | * | 0.3784 | . |
| (0.0899) | (0.2484) | (0.0077) | (0.1477) | (0.1949) | ||||||
| Bottom 5% volatility periods | 0.1161 | - | 0.0033 | - | −0.0135 | - | −0.3495 | - | 0.0053 | - |
| (0.1129) | (0.0107) | (0.0096) | (0.3030) | (0.0052) | ||||||
| Bottom 1% volatility periods | 0.1876 | - | NA | - | - | - | NA | - | NA | - |
| (0.3036) | NA | NA | NA | NA | ||||||
Publisher’s Note: MDPI stays neutral with regard to jurisdictional claims in published maps and institutional affiliations. |
© 2021 by the author. Licensee MDPI, Basel, Switzerland. This article is an open access article distributed under the terms and conditions of the Creative Commons Attribution (CC BY) license (https://creativecommons.org/licenses/by/4.0/).
Share and Cite
Manuj, H. Is Gold a Hedge against Stock Price Risk in U.S. or Indian Markets? Risks 2021, 9, 174. https://doi.org/10.3390/risks9100174
Manuj H. Is Gold a Hedge against Stock Price Risk in U.S. or Indian Markets? Risks. 2021; 9(10):174. https://doi.org/10.3390/risks9100174
Chicago/Turabian StyleManuj, Hemant. 2021. "Is Gold a Hedge against Stock Price Risk in U.S. or Indian Markets?" Risks 9, no. 10: 174. https://doi.org/10.3390/risks9100174
APA StyleManuj, H. (2021). Is Gold a Hedge against Stock Price Risk in U.S. or Indian Markets? Risks, 9(10), 174. https://doi.org/10.3390/risks9100174