Article

Diversification and Desynchronicity: An Organizational Portfolio Perspective on Corporate Risk Reduction

1
Discipline of International Business, The University of Sydney, Sydney, NSW 2006, Australia
2
Department of Management and Marketing, School of Business Administration, European University Cyprus, 1516 Nicosia, Cyprus
3
School of Labor and Human Resources, Renmin University of China, Beijing 100872, China
4
Graduate School of Economics, Kobe University, 2-1 Rokkodai, Nada-Ku, Kobe 657-8501, Japan
5
Discipline of Finance, The University of Sydney, Sydney, NSW 2006, Australia
6
Trinity College, University of Cambridge, Cambridge CB2 1TQ, UK
7
Center for Research and Innovation in Business Sciences and Information Systems, Polytechnic Institute of Porto, 4610-156 Felgueiras, Portugal
8
Rattanakosin International College of Creative Entrepreneurship, Rajamangala University of Technology Rattanakosin, Nakhon Pathom 73170, Thailand
9
Australian Graduate School of Management, University of New South Wales, Sydney, NSW 2031, Australia
*
Authors to whom correspondence should be addressed.
Risks 2020, 8(2), 51; https://doi.org/10.3390/risks8020051
Submission received: 2 March 2020 / Revised: 9 May 2020 / Accepted: 14 May 2020 / Published: 22 May 2020

Abstract

:
A longstanding objective of managers is to reduce risk to their businesses. The conventional strategy for risk reduction is diversification; however, evidence for the effectiveness of diversification remains inconclusive. According to Organizational Portfolio Analysis, firms are viewed as portfolios of business units, and the key to risk reduction is both diversification and synchronization compensation. This study introduces “desynchronicity”, a process that operationalizes synchronization compensation by assessing the degree of correlation between income streams of business units. Two samples of 737 and 332 firms (from COMPUSTAT) were used to empirically test the relationships between diversification and risk, and desynchronicity and risk. The results show that diversification alone will not always lead to a lower corporate risk. To reduce risk, firms also need to consider the desynchronicity of their business portfolios. Other practical implications include improved decisions on portfolio composition.

1. Introduction

Since the magnitude of the 2008 financial crisis, discourses pertinent to risk management variations have emerged denoting the interrelated role of economic cycles, as well as derivative markets and geopolitical fragmentation (Gouliamos 2014; Han et al. 2019). Reducing business risk is a prime concern of corporate managers. This type of risk is indicated by the extent of fluctuations of income streams (Gerhart and Trevor 1996; Miller and Chen 2003), which can significantly impact a firm’s survival. Lower risk results in greater credibility, with increased access to financial resources; this reduces capital costs and the likelihood of bankruptcy (Matta and McGuire 2008; Miller and Chen 2004). Conventionally, the process of diversification has been considered the most effective way to reduce corporate risk (Andersen et al. 2007; Maurer 2011; Sun et al. 2020), with much empirical evidence supporting a negative diversification-risk relationship (Hoskisson 1987; Keats and Hitt 1988). However, the debate regarding the effectiveness of diversification for risk reduction remains inconclusive. Some researchers believe that the diversification to risk relationship is curvilinear (Tallman and Li 1996), while others maintain that the relationship is no discernible (Lubatkin and O’Neill 1987). In addition, some researchers have suggested that, due to the lack of statistical difference in business risk between the diversified and non-diversified firms, not all diversification strategies lead to risk reduction (Lubatkin and O’Neill 1987). Given this continuing uncertainty and the importance of diversification and risk to practitioners, this study re-examines the diversification-risk relationship from the new perspective of Organizational Portfolio Analysis (OPA).
Further investigation of the diversification-risk relationship is warranted for three reasons. First, clearer understanding of the theoretical foundation of this relationship could provide scholars and corporate managers with a new perspective on how to better allocate resources (Hill and Hansen 1991). Second, further understanding may assist to reduce costs of creating, merging, or acquiring new business units (BUs), in order to diversify a firm’s portfolio (Amihud and Lev 1981). Third, by examining this relationship, scholars and managers can better determine the overall mechanisms of corporate risk reduction (Bettis and Hall 1982).
Based on Organizational Portfolio Analysis (OPA), this study re-examines the diversification-risk relationship from three perspectives. First, OPA views a corporation as a portfolio comprising several individual BUs, and this suggests that diversification may not be a key factor directly contributing to risk reduction. If diversification strategies were based solely on numbers of BUs and sales contributions of BUs, simply rising the extent of diversification does not guarantee a risk reduction, as it may not influence correlations between BU income streams. Second, OPA explains the measures to analyze the portfolio effect, which is a measure of the cumulative contributions of all BUs to the firm’s business risk. OPA focuses on the extent of diversification and the movements of individual BU incomes. This income movement for each BU is similar to a sinewave, where BU income rises and falls. If all BU incomes are synchronized, moving in the same direction, then BU coefficient correlations are 1. This means that there will be no risk reduction, regardless of what the level of diversification might be. Third, OPA specifically introduces the concept of ‘synchronization compensation’ to capture the amount of risk reduction where there is a low level of correlation between BU income flows (Donaldson et al. 2012). While conventional diversification-risk research does not measure such correlations, OPA has highlighted the possibility of incorporating relationships between income flows of BUs into the assessment.
As the prime objective of this research is to examine how the diversification strategy may affect corporate risk, it is relevant to briefly review the concept of risk, together with the relationship of diversification to risk as well as the OPA perspective. The development of the three working hypotheses is discussed below.

2. Concepts, Relationships and Development of Hypotheses

There are different definitions for risk (Miller and Reuer 1996). Risk management, relationships, and approaches have also been hot research topics, involving many aspects of business and society (Liu et al. 2020; Luo et al. 2020; Yue et al. 2020; Shao et al. 2020; He et al. 2019). The literature describes two forms of corporate risk: first, there is accounting risk, or fluctuation, in a firm’s aggregate earning streams such as sales or profitability (Ball and Brown 1969); and second is market risk, relating to fluctuations of stock market prices (Blume 1970). This study focuses on accounting risk, since it is more directly connected to managerial decisions (Bettis and Hall 1982). Although potentially relevant, market risk includes both internal influences (controllable by managers), as well as external stock market factors, and so is considered outside the scope of this study (Chang and Thomas 1989).
The topic of corporate diversification has been widely studied (Chen and Chu 2012; Palich et al. 2000; Park and Jang 2012), and two major approaches to investigating diversification are identified (Datta et al. 1991). The first approach, relating to degree or extent, involves the Berry-Herfindahl and Jacquemin-Berry’s entropy methods; the second approach, relating to type of diversification, most commonly applies Rumelt’s Scheme (Rumelt 1974). Both approaches are used here to investigate diversification as it relates to risk.
Most previous diversification-risk studies have argued that diversification leads to lowered risk, in one of three ways. The first mechanism is via portfolio logic: this is where managers apply a diversification strategy to achieve a particular portfolio effect, to reduce the overall variance in total revenue or profitability (Chakrabarti et al. 2007). Companies’ BUs might have differing income flows in different fields and the movements might anticipate, lag behind, or coincide with the macro business cycle. Where firms have BUs with varying performances over time, there is reduced volatility in sales and profitability, meaning lower risk.
Parenting advantage is another reason that risk may be lowered through diversification, as it involves companies re-allocating resources among BUs (Campbell et al. 1995; Goold et al. 1998). This strategy allows a firm to overcome crisis events, such as possible bankruptcy, or to reinforce a vulnerable BU (Datta et al. 1991). This ability to move financial resources as required confers advantage by enhancing firm competitiveness and reducing risk (Campbell et al. 1995).
The third way to ensure a lowering of risk is to expand the size of the company (Chang and Thomas 1989). Larger companies are usually able to attract investment more easily, and obtain the benefits from economies of scale, to survive during critical periods (Balakrishnan and Fox 1993). Building on the above understanding we hypothesize that:
Hypothesis 1.
Diversification is negatively related to corporate risk.
Donaldson et al. (2012), from an OPA perspective, incorporated correlations between income flows into an overall analysis of risk to the firm. They argued that firms may reduce risk more by diversifying into a single BU, with an income flow that is temporally the reverse of the existing income; in this instance, a decline in revenue of one BU can be offset by a rising income in another BU (Donaldson et al. 2012). Therefore, to enhance a firm’s portfolio effect on risk reduction, BUs with opposite income cycles are more important than traditional ideas of diversification (number of BU, size of BU). To conceptualize this situation, Donaldson et al. (2012) introduced the idea of synchronization compensation, which captures the extent to which risk is reduced as a result of income fluctuations of different BUs inside the portfolio offsetting each other. In theory, in a firm with only two business units, generating equal incomes countercyclically, then the corporate risk will be close to zero.
Donaldson et al. (2012), however, did not assess synchronization compensation to empirically examine how this affects risk. Hence, building on the work of these researchers, we developed the notion of desynchronicity, which is designed to: (i) assess the extent to which a firm’s portfolio achieves synchronization compensation by capturing the combined effects of BU incomes; and (ii) estimate the degree to which these incomes are minimally correlated with the remaining income streams in the corporate portfolio of a firm (Shughart and Donaldson 2004).
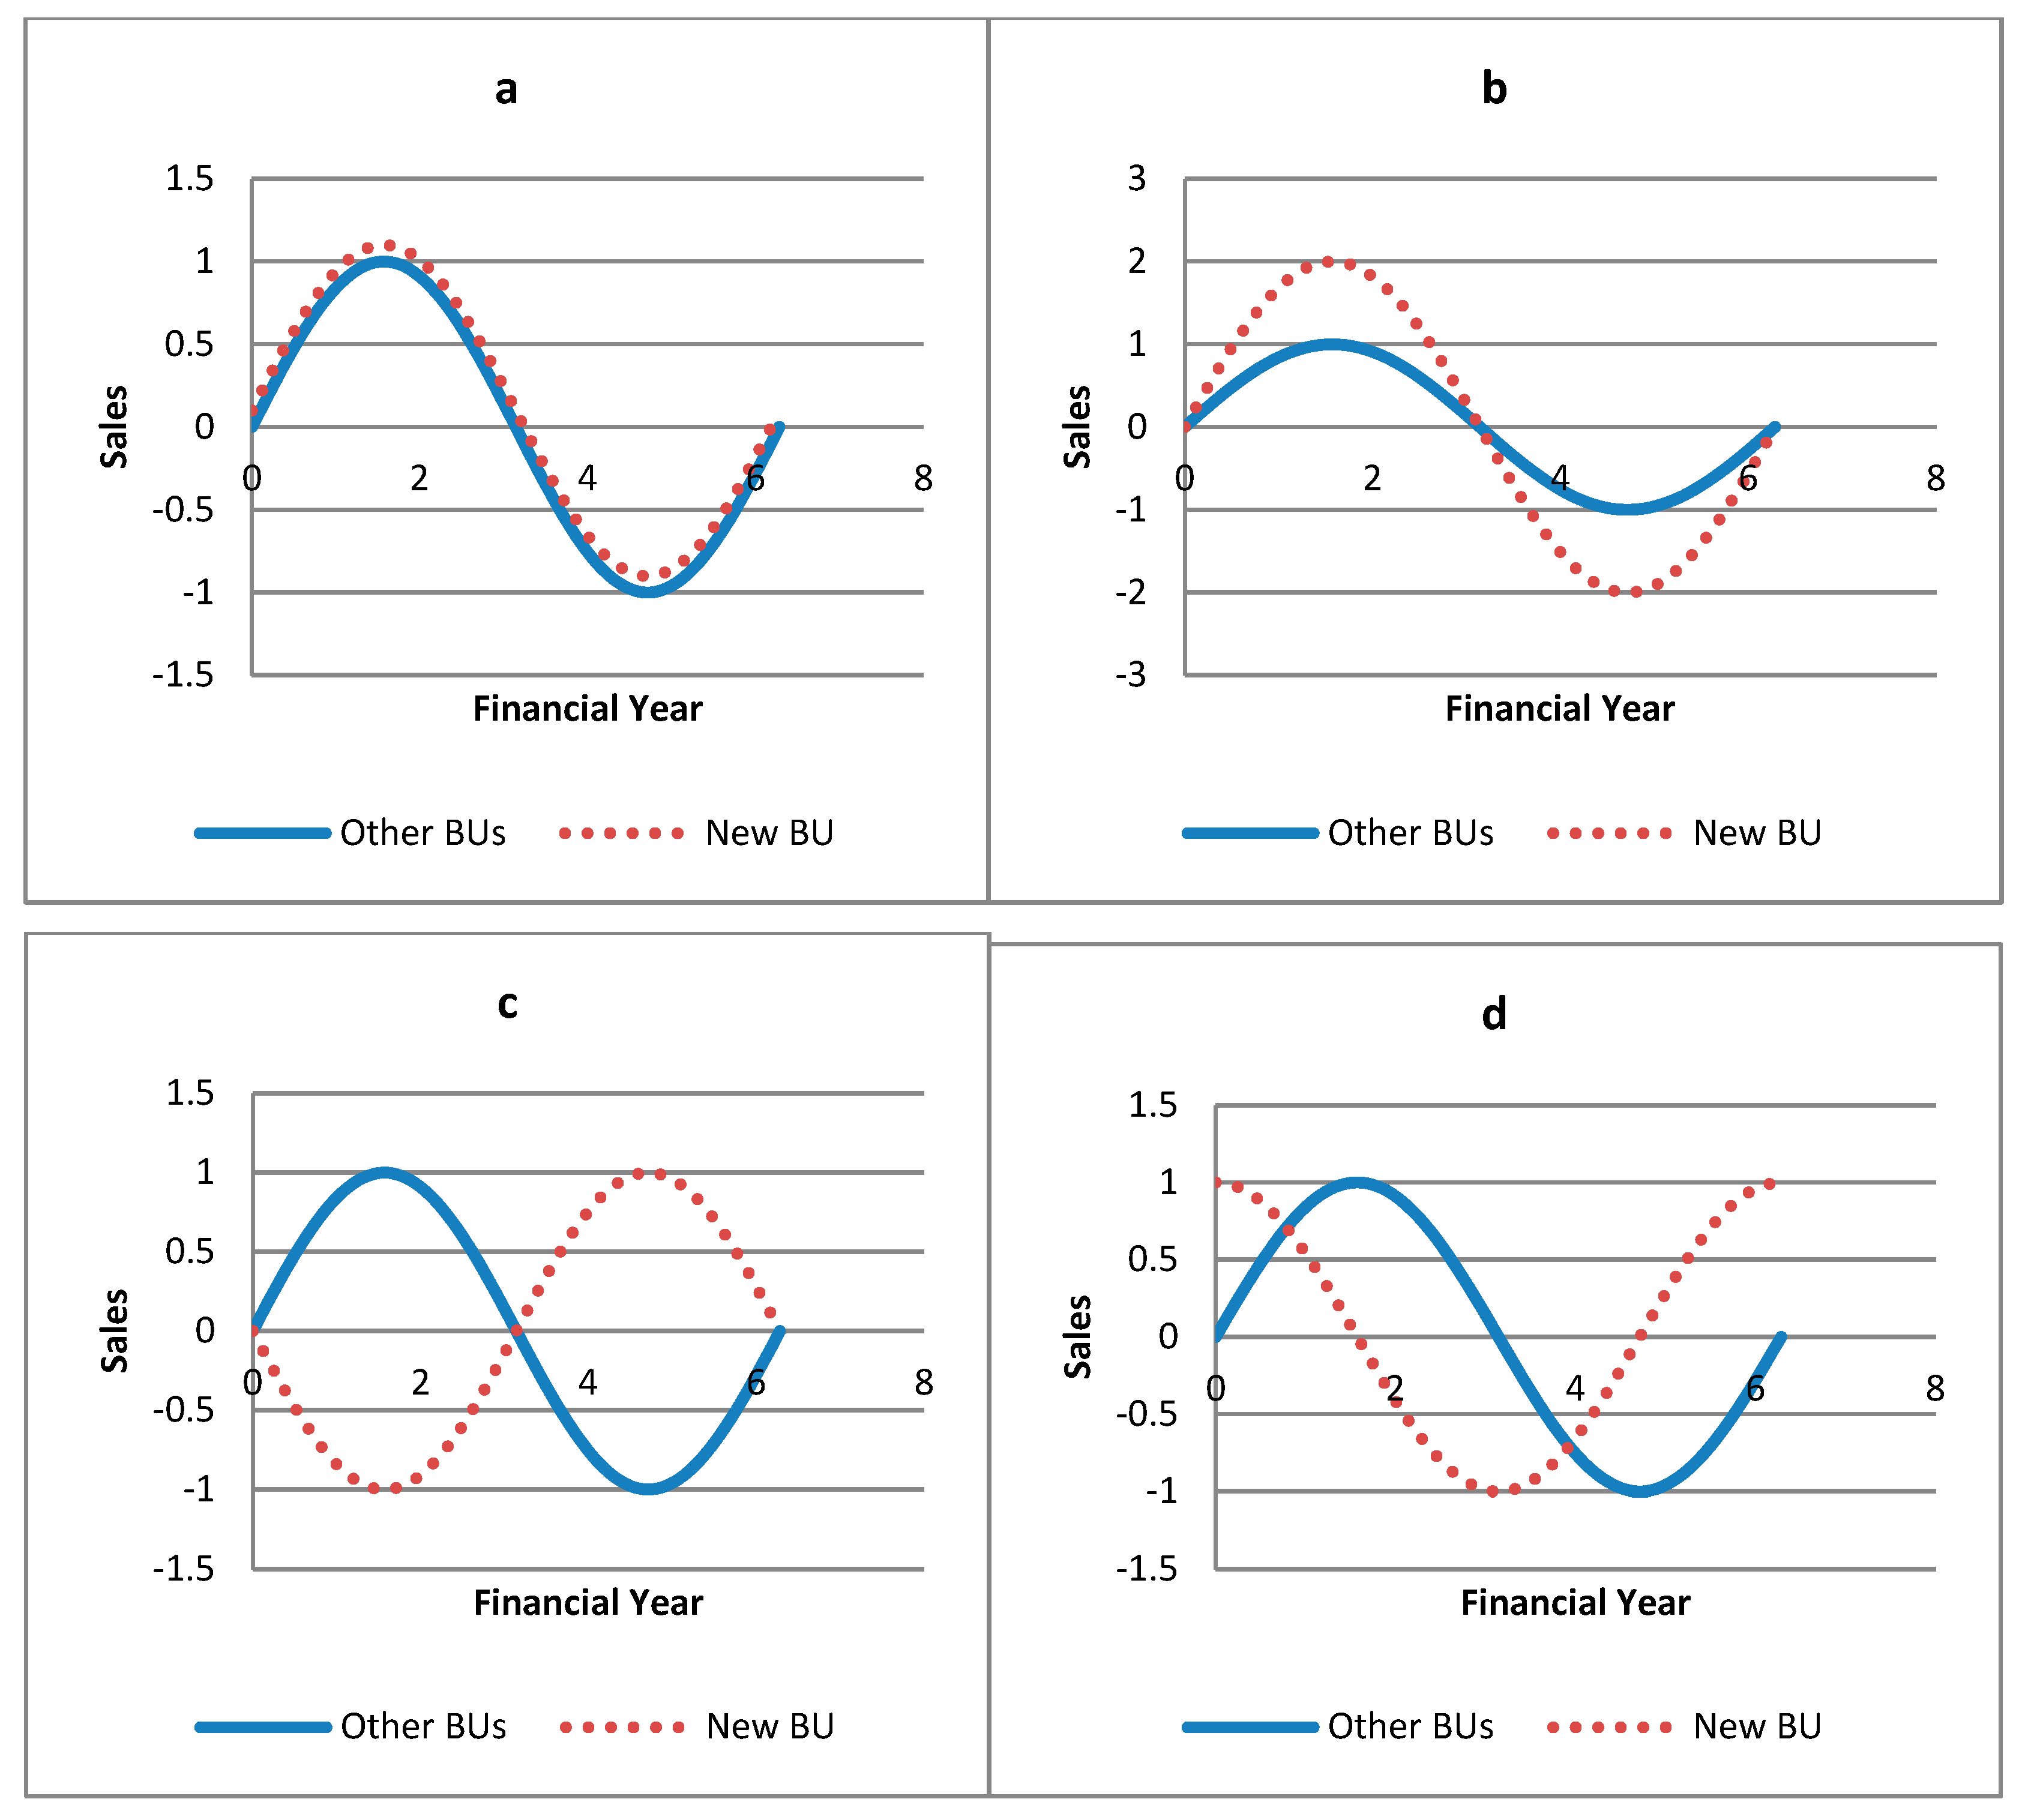
Figure 1 illustrates different circumstances to further explain the concept of desynchronicity. If all BUs of a firm, including new acquisitions, have income flows moving in the same direction simultaneously (Figure 1a), there is high correlation, no synchronization compensation, and no risk reduction. If a high-risk BU (i.e., volatile, fluctuating income) is acquired, with income movement coinciding with existing BUs (Figure 1b), the new BU will significantly increase risk. However, if a new BU’s income stream is moving with a different frequency or pattern to existing BUs (Figure 1c), this will increase desynchronicity of the portfolio and reduce risk. Thus, an effective diversification strategy for risk management is expanding to BUs that increase desynchronicity in the portfolio. Even moderate desynchronicity (Figure 1d) can result in significant reduction of corporate risk.
In contrast to previous studies, desynchronicity is presented as an integrative measure that incorporates all risk reduction, where BUs are not in exactly the same cycle. From the above, a second hypothesis is proposed:
Hypothesis 2.
Desynchronicity is negatively related to corporate risk.
To develop OPA, Donaldson et al. (2012) examined four leading corporations, to study how their corporate risk was affected by their diversification strategies. In their study, the mildly diversified firm (e.g., IBM) reduces corporate risk far below the average risk of its original BUs. On the other hand, they found that after the highly diversified Colonial Sugar Refining (CSR) decreased its level of diversification, it also had decreased corporate risk. This was because the sales of the divested BU were positively correlated with the main sales of the corporation, and, hence, did not create much portfolio effect. Moreover, this BU had a higher BU risk if standing alone, thereby increasing the corporate risk. Thus, the extent to which a firm diversifies does not necessarily correlate with risk reduction.
In contrast, Donaldson et al. (2012) argued that synchronization compensation is more efficient in reducing corporate risk compare to just low risk BUs only. The introduction of desynchronicity makes it possible for us to compare the effectiveness in risk reduction by diversification and synchronization compensation (measured by desynchronicity). Based on this OPA capacity, we propose a third hypothesis:
Hypothesis 3.
Desynchronicity is more negatively related than diversification to corporate risk.

3. Data and Methods

For data, we initially targeted all firms in the COMPUSTAT BU database over the period 2002–2011. Financial data, defined by the segment identification (SID) code in COMPUSTAT of firms over 10 years period, are required to confidently calculate desynchronicity. In addition to the constraint of publicly available data, this method also requires the BUs under analysis to be consistent across the entire period; we included firms with data for two or more BUs over the decade, but excluded others with incomplete data. Based on companies listed on US stock market, the final samples were 737 diversified firms based on desynchronicity measured by sales, and 332 firms based on desynchronicity measured by profitability. Amongst these companies, 614 companies have headquarters in the USA and only 123 are headquartered across in the rest of world. Using both sales and profitability allowed us to produce more accurate and comprehensive empirical results.

3.1. Dependent Variables

Corporate risk is measured by accounting data; the two most commonly used measures are the sales variability measure and the volatility of profitability (Ferri and Jones 1979; Miller and Chen 2003). The sales variability measure is an important factor in corporate performance, and is regarded as a sound method of defining risk (Boyd 1995; Boyd et al. 1993; Lai et al. 2013; Yuan et al. 2008). Corporate risk, as Ferri and Jones (1979) claimed, can be represented by the historical volatility in sales and profitability. Hence, a CV of sales is a common measure used to determine sales volatility (Miller and Chen 2004; Robins 1993; Wagner et al. 2014). The CV is a relative measure and is useful for comparing variances between groups, as the denominator eliminates the size effect (Bedeian and Mossholder 2000; Eckel 1981; Patel and Cooper 2014). It is also used to capture demographic homogeneity and heterogeneity (Michel and Hambrick 1992). Volatility of profitability is often used to assess risk levels and the SD of ROA is a standard measure (Andersen et al. 2007; Bettis 1982).
The measures used strive to capture the uncertainty during the 10-year period. Specifically, risk is calculated by the natural logarithm of the CV of sales by the following formula:
R i s k   1 = log ( i = 1 N ( x i x ¯ ) 2 N 1 x ¯ )
where xi is the annual sales of a certain year, x ¯ is the mean of annual sales for the 10-year period, and N is the overall 10 years in this calculation. In addition, risk could also be calculated by the natural logarithm SD of ROA captured in the formula:
R i s k   2 = log i = 1 N ( x i x ¯ ) 2 / ( N 1 )
where x i is the annual ROA of a certain year, x ¯ is the mean of annual ROA for the 10-year period, and N is the overall 10 years in this calculation.

3.2. Independent Variables

Product diversity. This study utilized three common methods for assessing product diversity to estimate levels of diversification. The percentage of sales of each BU to overall sales was used to conduct the calculation, with the formula:
Div   1 = 1 i = 1 N W i 2
where Wi is the percentage of the BU to overall sales.
The second method was the Jacquemin-Berry entropy method. This is based on the Berry-Herfindahl method (Lee and Lieberman 2010; Nayyar 1992; Su 2010) and makes calculations from three elements of a firm’s product diversity. Specifically, the number of BUs operating in the firm, the weight of each BU by the BU’s sales divided by total sales, and the relatedness among the various BUs (Jacquemin and Berry 1979). The formula for diversification level by this method is:
Div   2 = i = 1 N W i ln ( 1 W i )
where Wi is the percentage of the BU’s sales to overall sales.
Third, Rumelt (1974) divided diversification into nine related categories and four general categories, but this method categorizes the groups subjectively, and therefore may not be sufficiently precise to determine levels of diversification. Rumelt’s (1974) classification system is highly cited in the domain of management (Rugman 1976). Here, Rumelt’s scheme was used to divide firms into groups and investigate statistical differences.
Desynchronicity. This measure is proposed to operationalize the level of synchronization compensation as a complementary method of diversification, as measured by product diversity. It starts with the calculation of r i , r —the correlation between the sales of each BU to that of the remainder of the corporation—and multiplying the weight of the BU to obtain weighted correlation and summing weighted correlation. After logarithmic transformation to convert the sum of weighted correlation to a normal distribution, this indicator was named desynchronicity. Desynchronicity will be lower if the firm has less synchronization compensation among BUs, with fluctuations of BUs’ income moving in a similar direction. Higher desynchronicity means that the BUs’ income streams are moving against each other, resulting in lower corporate risk. Similar to the entropy method, we took the natural log of the sum of weighted correlation; logging makes the residuals normally distributed and decreases the tail effect. As the sum of weighted correlation is in the range −1 to 1, to convert the residual to a normal distribution, desynchronicity is calculated by subtracting the sum of weighted correlation from 1. Relying on both weight and synchronization, this study proposes a method to calculate the desynchronicity using the formula:
D S l o g = L N ( 1 i = 1 , r = 1 n r i , r W r )
where r i , r is the correlation between one BU with the remainder firm, and W r s the percentage of the BU’s sales to the overall sales.
Honeywell International is presented as an example of the firms in the sample. This firm had five BUs during 2002–2011: Aerospace Solutions, Performance Materials, Power and Transportation Products, Corporate and Unallocated, and Automation. The analysis first calculated the weight of BUs based on their 10-year sales. Then we calculated the correlation between one BU’s 10-year sales, and the total sales of the remainder of the corporation (Table 1). The third step involved multiplying the weight of one BU’s correlation to generate the weighted BU’s correlation for each BU. Then, we added them together to give the sum of weighted BU’s correlation, which was 0.71 in this case. The desynchronicity was the log transformation of 1 minus the sum of weighted BU’s correlation, and was −1.23 for Honeywell International for that 10-year period.
Controls. Six control variables were used for this analysis: firm size, firm age, industry, internationalization, and headquarter location. Firm size can impact on return and risk, as larger firms are less likely to be profitable and less risky. Firm size was defined as the total asset (Gedajlovic and Shapiro 1998; Wan et al. 2011; Zhou 2011). Firm age (the natural logarithm of the firm’s years) could also impact return and risk, as stable firms normally have lower return and lower risk (Anderson and Reeb 2003; Tzafrir 2006). To capture the industry effect, this study uses industry dummy variable as it affects the level of corporate risk. In the field of diversification studies, the industry effect as a dummy variable is widely accepted (Geringer et al. 2000; Hitt et al. 1997; Qian et al. 2010). Internationalization is also a common variable in the diversification literature (Chan et al. 2008; Lu and Beamish 2004; Qian et al. 2010). Multinationalism impacts the volatility of a firm’s performance and, thus, this research includes it as a dummy variable, based on a two digit SIC code. A nationality effect might also influence the level of corporate risk. The method this study used to define the nationality of the firm is the location of its headquarters (Harzing and Sorge 2003; Qian et al. 2010). This research applies a dummy variable to define whether a firm is US based.

3.3. Analyses

Sample selection underwent two adjustment processes. First, the final dataset was unbalanced, because it included firms with varying degrees of yearly observations. To analyze these unbalanced data, we chose the first-year data as a consistent way to select the sample. Second, the splintering or merging of BUs across the 10-year period resulted in incomplete data sets. For instance, a BU named Food and Drink (SID3) was splintered into two BUs named Food (SID4) and Drink (SID5) after five years of operations. Thus, the data set included five years of data as a merged BU and consequent data as two separate BUs; for accurate analysis, these were combined as one BU over the 10 years. The outlier effect was eliminated by winsorizing continuous variables at the 99th and 1st percentiles of their distributions (Fama and French 1992; Patel and Cooper 2014). As this sample is restricted, we present risk measures calculated using window of three years as a robustness check to illustrate that similar results are obtained (Ashraf 2017; Ashraf et al. 2016). Even though we expected similar results, it is important, we choose three three-year period (2003–2005; 2006–2008; 2009–2011).
Using the above procedure, we created a first-stage regression using variables previously identified in the literature that influence risk. Specifically, my first-stage regression (Relationship 1) was:
R i s k i t = β 1 Firm   size i t + β 2 Firm   age i t + β 3 Industry   ( dummies ) + β 4 MNC   ( dummies ) + β 5 US   ( dummies ) + β 6 Firm   performance i t + β 7 Firm   diversification   ( TD ) i t + ( or   Desynchronicity ) i t
The risk applied in this study could be affected by other missing variables, such as board independence. We addressed the problem of missing variables by separating data into two 5-year periods. If the relationship in this sample was still significant, my model works in this case. Therefore, this study also used the difference of each variable in my second regression model (Relationship 2):
Δ R i s k i t = β 1 Δ Firm   size i t + β 2 Δ Firm   performance i t + β 3 Δ Firm   diversification   ( Δ TD ) i t   ( or   Δ Desynchronicity i t )
To examine whether desynchronicity has a stronger effect than diversification, as predicted by H3, we compared the standardized coefficients between diversification and desynchronicity in the regression of corporate risk. We conducted eight bootstrap approaches, one for each of the measures of corporate risk and diversification. After standardizing three variables—Berry-Herfindahl diversification, Jacquemin-Berry entropy diversification, and desynchronicity—we used the bootstrap approach to conduct a t-test to compare these coefficients. In this instance, we randomly selected 500 out of 737 firms and ran a regression as follows (Relationship 3). After running this step 1000 times to have 1000 pairs of coefficients of diversification ( β 1 ) and desynchronicity ( β 2 ), we compared β 1 and β 2 to examine whether the impact of β 2 was significantly higher than β 1 :
R i s k i t = β 1 Firm   diversification   ( TD ) i t + β 2 Desynchronicity i t + β 3 Firm   size i t + β 4 Firm   age i t + β 5 Industry   ( dummies ) + β 6 MNC   ( dummies ) + β 7 US   ( dummies ) + β 8 Firm   performance i t

4. Results and Models

This section presents the statistics and summarizes the outcomes of previously described analyses. Table 1 shows results for the 737 firms with information about BUs’ sales. Table 2 shows results for the 332 firms with information about BUs’ ROA. Descriptive statistics are not presented for calculating the change in sales/ROA; time-series methods eliminated fixed-effects.
To test Hypothesis 1, both the Jacquemin-Berry entropy and Berry-Herfindahl methods were used; key results are presented in Table 3 and Table 4, respectively. For each method, the study ran four models displaying regressions between product diversification and corporate risk. Model 1 and Model 2 applied the CV of sales and the SD of ROA, respectively, and acted as benchmarks for the calculation of risk levels. A no discernible relationship still held in first difference methods, which is the difference between two periods (2002–2006 vs. 2007–2011). Model 3 and Model 4 applied CV of sales and SD of ROA, respectively, to calculate each variable by the change between two periods.
Table 3 summarizes the Jacquemin-Berry entropy method results. None of the models supported a negative diversification-risk relationship. Model 1 showed that diversification had a negative, although not significant, impact on corporate risk, measured by CV of sales (b = −0.05, p > 0.05). Similarly, Model 2 showed that entropy diversification had a nonsignificant relationship with corporate risk, measured by SD of ROA (b = −0.05, p > 0.05). In Model 3, this entropy method did not demonstrate statistical significance related to corporate risk, measured by ∆ CV of Sales (b = −0.18, p > 0.05), or to ∆ SD of ROA (b = −0.16, p > 0.05) in Model 4. These findings suggest that the diversification is not significantly related to corporate risk.
Table 4 shows that the Berry-Herfindahl method had similar p-values and R-squared values to the entropy method. Models 1, 2, and 4 all suggested insignificant results between product diversity and corporate risk. Model 1 indicated that the Berry-Herfindahl diversification does not significantly impact on risk, as measured by CV of sales (b = −0.12, p > 0.05). This was consistent with when risk was measured by the SD of ROA in Model 2 (b = −0.08, p > 0.05). When first difference data were considered (in Model 3), the Berry-Herfindahl diversification had a marginal statistical significance in relation to ∆ CV of Sales (b = −0.39, p < 0.10). Nevertheless, there is no association with ∆ SD of ROA (b = −0.46, p > 0.05) in Model 4. In summary, the evidence for the diversification-risk hypothesis is very limited; no model showed a relationship between diversification and risk that was statistically significant, where p < 0.05.
Based on Rumelt’s scheme, this study categorized the sample into four groups, which comprised single, dominant, related, and unrelated businesses. Table 5 summarizes results of an ANOVA of these subgroups for corporate risk. In the sample of 737 firms in which risk was measured by CV of sales, 48 were single businesses, 292 were dominant, 262 were related diversified businesses, and 135 were unrelated diversified businesses. As the ANOVA model demonstrates, the effect for diversification on corporate risk was marginally significant to nonsignificant. In the sample of 332 firms where risk was measured by SD of ROA, 22 were single businesses, 124 were dominant firms, 107 were related diversified businesses, and 79 were unrelated diversified firms. The significance level calculated from this method exceeded 0.10 and, thus, no significant effect of diversification groups for corporate risk was detected.
To examine whether any group could be distinguished from others, in terms of risk, the risk means of all groups were compared. The Table 6 results indicated that dominant (DOM) and related diversified (RD) firms were less risky than single or unrelated diversified (UD) firms. Among all the groups, only related diversification had a marginal significantly lower risk (p < 0.10) than single businesses and, overall, there was no statistically significant difference (p < 0.05) between the four groups. This indicates that the diversification measure, based on Rumelt’s scheme, could not detect a risk reduction.
Table 7 shows that, in Model 1, where CV of sales was applied to measure risk, a significant negative relationship between desynchronicity and risk (b = −0.18, p < 0.001) was demonstrated. For risk measured by the SD of ROA (Model 2), a negative association between desynchronicity and corporate risk (b = −0.36, p < 0.001) was shown. In conjunction with regression results in Model 3 (b = −0.19, p < 0.001) and Model 4 (b = −0.32, p < 0.001), the findings supported Hypothesis 2 (that corporate risk decreases when desynchronicity increases). Moreover, R2 and Adjusted R2 in the models for desynchronicity were significantly higher than models for diversification. For example, Model 1 of desynchronicity had a R2 of 0.26, which was twice that of Model 1 of both entropy methods’ R2 (0.13) and Berry-Herfindahl methods’ R2 (0.13). These findings support our argument that desynchronicity, rather than diversification, could reduce the levels of corporate risk.
A bootstrapping technique was used to investigate whether desynchronicity is more accurate than diversification in predicting corporate risk reduction. As shown in Table 8, the results of a bootstrapping estimation with 1000 bootstrap resamples supported the sign and significance of Hypothesis 3, regardless of the measures of diversification and corporate risk. Specifically, all eight bootstrapping results were positive, which means the impact of desynchronicity was significantly stronger than diversification on risk. Moreover, all the confidence intervals excluded zero, indicating that desynchronicity, rather than diversification, should be applied for risk prediction. The results suggested that desynchronicity, rather than diversification, could explain more corporate risk.

5. Discussion

In summary, Hypothesis 1 was not supported, as very limited evidence supported the postulation that diversification is negatively associated with risk; no statistical significance was found between product diversification and corporate risk. The empirical findings presented also support the idea that diversification is not the key to reducing risk. All three diversification measures (Berry-Herfindahl, entropy, and Rumelt) failed to follow portfolio logic, and had little or no correlation with low levels of corporate risk. This study has provided the first empirical evidence that challenges the conventional understanding that diversification significantly affects the level of corporate risk. However, this unexpected finding, of a no discernible relationship between diversification and corporate risk, merits further investigation. This research contributes to existing debate and managerial practice in two ways. First, it has led to the development of an integrative quantitative measure of desynchronicity to operationalize the concept of synchronization compensation, which is one of the most important elements in OPA. Second, it has provided empirical evidence that although no significant relationship is found between diversification and risk, there is a significant negative desynchronicity-risk relationship.
There are three managerial implications from this study. First, managers promoting diversification strategies should be more realistic about the relationship of diversification and risk. As diversification is not significantly related to low risk, it may not be the most appropriate strategy. Second, the firm needs to ensure that BUs within the corporate portfolio continue to generate income streams with low levels of correlation. Assessing this correlation requires sufficient time (e.g., up to 10 years) to detect and trace cycles in each BU. Third, desynchronicity can be used as a quantitative indicator of risk in a portfolio. This permits a more precise understanding of the impact of any BU on risk levels. For example, the indirect and long-term benefits of desynchronicity, an investment into a new high-risk BU, with low incomes correlation with existing BUs, can be assessed in terms of a significant portfolio effect to reduce corporate risk.
While contributing to knowledge of the mechanisms of risk reduction, this study has some limitations that may offer opportunities for future study. The majority of firms in the dataset did not have comprehensive BU data for 10 consecutive years, and the models based on historical data. Whether the desynchronicity would have similar effect on risks in different periods can be another field for study. This study focused mainly on corporate risk without considering corporate return; however, a more comprehensive understanding could be achieved by examining the impact of desynchronicity on returns. Finally, there is a potential issue in this study of endogeneity, in terms of missing variables, and this area is of great interest to management scholars (Hamilton and Nickerson 2003).

6. Conclusions

To date, scholars have investigated risk by considering diversification as a portfolio effect, without considering income synchronization compensation. Using a large sample, this analysis tests hypotheses derived from traditional diversification theory, as well as the more recent OPA perspective, and contributes to the ongoing debate about the diversification-risk relationship. Measuring desynchronicity provides an opportunity for investigating correlations between income streams within a firm, and these studies have demonstrated that high desynchronicity reduces risk. From a practical perspective, we offer managers with a different measure to compare companies’ portfolio and their risk. To implement diversification strategies is a resource intensive exercise, so identifying determinants of an effective strategy would assist managers to make more informed decisions about the optimal mix for their corporate portfolio, as well as the risks of acquiring or divesting of any particular BU.

Author Contributions

Conceptualization, X.-F.S. and X.-G.Y.; methodology, B.N.-F.L. and X.-F.S.; investigation, J.Q.; writing—original draft preparation, X.-F.S.; writing—review and editing, B.N.-F.L., X.-G.Y., K.G., S.H., S.S. and J.Q. All authors have read and agreed to the published version of the manuscript.

Funding

This work was supported by JSPS KAKENHI Grant Number 17H00983.

Conflicts of Interest

The authors declare no conflict of interest.

References

  1. Amihud, Yakov, and Baruch Lev. 1981. Risk reduction as a managerial motive for conglomerate mergers. The Bell Journal of Economics 12: 605–17. [Google Scholar] [CrossRef]
  2. Andersen, Torben J., Jerker Denrell, and Richard A. Bettis. 2007. Strategic responsiveness and Bowman’s risk-return paradox. Strategic Management Journal 28: 407–29. [Google Scholar] [CrossRef]
  3. Anderson, Ronald C., and David M. Reeb. 2003. Founding-Family Ownership and Firm Performance: Evidence from the S&P 500. The Journal of Finance 58: 1301–27. [Google Scholar]
  4. Ashraf, Badar Nadeem. 2017. Political institutions and bank risk-taking behavior. Journal of Financial Stability 29: 13–35. [Google Scholar]
  5. Ashraf, Badar Nadeem, Changjun Zheng, and Sidra Arshad. 2016. Effects of National Culture on Bank Risk-taking Behavior. Research in International Business and Finance 37: 309–26. [Google Scholar] [CrossRef]
  6. Balakrishnan, Srinivasan, and Isaac Fox. 1993. Asset specificity, firm heterogeneity and capital structure. Strategic Management Journal 14: 3–16. [Google Scholar] [CrossRef]
  7. Ball, Ray, and Philip Brown. 1969. Portfolio theory and accounting. Journal of Accounting Research 7: 300–23. [Google Scholar] [CrossRef]
  8. Bedeian, Arthur G., and Kevin W. Mossholder. 2000. On the use of the coefficient of variation as a measure of diversity. Organizational Research Methods 3: 285–97. [Google Scholar] [CrossRef]
  9. Bettis, Richard A. 1982. Risk considerations in modeling corporate strategy. Academy of Management Proceedings 1982: 22–25. [Google Scholar] [CrossRef]
  10. Bettis, Richard A., and William K. Hall. 1982. Diversification strategy, accounting determined risk, and accounting determined return. The Academy of Management Journal 25: 254–64. [Google Scholar]
  11. Blume, Marshall E. 1970. Portfolio theory: A step toward its practical application. The Journal of Business 43: 152–73. [Google Scholar] [CrossRef]
  12. Boyd, Brian K. 1995. CEO duality and firm performance: A contingency model. Strategic Management Journal 16: 301–12. [Google Scholar] [CrossRef]
  13. Boyd, Brian K., Gregory G. Dess, and Abdul M. A. Rasheed. 1993. Divergence between archival and perceptual measures of the environment: Causes and consequences. Academy of Management Review 18: 204–26. [Google Scholar] [CrossRef]
  14. Campbell, Andrew, Michael Goold, and Marcus Alexander. 1995. Corporate strategy: The quest for parenting advantage. Harvard Business Review 73: 120–32. [Google Scholar]
  15. Chakrabarti, Abhirup, Kulwant Singh, and Ishtiaq Mahmood. 2007. Diversification and performance: Evidence from East Asian firms. Strategic Management Journal 28: 101–20. [Google Scholar] [CrossRef]
  16. Chan, Christine M., Takehiko Isobe, and Shige Makino. 2008. Which country matters? Institutional development and foreign affiliate performance. Strategic Management Journal 29: 1179–205. [Google Scholar] [CrossRef]
  17. Chang, Yegmin, and Howard Thomas. 1989. The impact of diversification strategy on risk-return performance. Strategic Management Journal 10: 271–84. [Google Scholar] [CrossRef]
  18. Chen, Chien-Nan, and Wenyi Chu. 2012. Diversification, resource concentration, and business group performance: Evidence from Taiwan. Asia Pacific Journal of Management 29: 1045–61. [Google Scholar] [CrossRef]
  19. Datta, Deepak K., Nandini Rajagopalan, and Abdul M. A. Rasheed. 1991. Diversification and performance: Critical review and future directions. Journal of Management Studies 28: 529–58. [Google Scholar] [CrossRef]
  20. Donaldson, Lex, Steven D. Charlier, and Jane X. J. Qiu. 2012. Organizational portfolio analysis: Focusing on risk inside the corporation. Long Range Planning 45: 235–57. [Google Scholar] [CrossRef]
  21. Eckel, Norm. 1981. The income smoothing hypothesis revisited. Abacus 17: 28–40. [Google Scholar] [CrossRef]
  22. Fama, Eugene F., and Kenneth R. French. 1992. The cross-section of expected stock returns. The Journal of Finance 47: 427–65. [Google Scholar] [CrossRef]
  23. Ferri, Michael G., and Wesley H. Jones. 1979. Determinants of financial structure: A new methodological approach. The Journal of Finance 34: 631–44. [Google Scholar] [CrossRef]
  24. Gedajlovic, Eric R., and Daniel M. Shapiro. 1998. Management and ownership effects: Evidence from five countries. Strategic Management Journal 19: 533–53. [Google Scholar] [CrossRef]
  25. Gerhart, Barry, and Charlie O. Trevor. 1996. Employment variability under different managerial compensation systems. Academy of Management Journal 39: 1692–712. [Google Scholar]
  26. Geringer, Michael J., Stephen Tallman, and David M. Olsen. 2000. Product and International Diversification among Japanese Multinational Firms. Strategic Management Journal 21: 51–80. [Google Scholar] [CrossRef]
  27. Goold, Michael, Andrew Campbell, and Marcus Alexander. 1998. Corporate strategy and parenting theory. Long Range Planning 31: 308–14. [Google Scholar] [CrossRef]
  28. Gouliamos Kostas. 2014. The Monstrous Idol of Europe. Athens: Synchroni Orizontes. [Google Scholar]
  29. Hamilton, Barton H., and Jackson A. Nickerson. 2003. Correcting for endogeneity in strategic management research. Strategic Organization 1: 51–78. [Google Scholar] [CrossRef]
  30. Han, Yan, Xue-Feng Shao, Xin Cui, Xiao-Guang Yue, Kelvin J. Bwalya, and Otilia Manta. 2019. Assessing Investor Belief: An Analysis of Trading for Sustainable Growth of Stock Markets. Sustainability 11: 5600. [Google Scholar] [CrossRef] [Green Version]
  31. Harzing, Anne-Will, and Anne-Will Sorge. 2003. The relative impact of country of origin and universal contingencies on internationalization strategies and corporate control in multinational enterprises: Worldwide and European perspectives. Organization Studies 24: 187–214. [Google Scholar] [CrossRef] [Green Version]
  32. He, Han, Sicheng Li, Lin Hu, Nelson Duarte, Otilia Manta, and Xiao-Guang Yue. 2019. Risk Factor Identification of Sustainable Guarantee Network Based on Logistic Regression Algorithm. Sustainability 11: 3525. [Google Scholar] [CrossRef] [Green Version]
  33. Hill, Charles W. L., and Gary S. Hansen. 1991. A longitudinal study of the cause and consequences of changes in diversification in the U.S. pharmaceutical industry 1977–1986. Strategic Management Journal 12: 187–99. [Google Scholar] [CrossRef]
  34. Hitt, Michael A., Robert E. Hoskisson, and Hicheon Kim. 1997. International diversification: Effects on innovation and firm performance in product-diversified firms. The Academy of Management Journal 40: 767–98. [Google Scholar]
  35. Hoskisson, Robert E. 1987. Multidivisional structure and performance: The contingency of diversification strategy. Academy of Management Journal 30: 625–44. [Google Scholar]
  36. Jacquemin, Alexis P., and Charles H. Berry. 1979. Entropy measure of diversification and corporate growth. The Journal of Industrial Economics 27: 359–69. [Google Scholar] [CrossRef]
  37. Keats, Barbara W., and Michael A. Hitt. 1988. A causal model of linkages among environmental dimensions, macro organizational characteristics, and performance. Academy of Management Journal 31: 570–98. [Google Scholar]
  38. Lai, Cheng Y., Yang Li, Yaowen Shan, and Stephen Taylor. 2013. Costs of mandatory international financial reporting standards: Evidence of reduced accrual reliability. Australian Journal of Management 38: 491–521. [Google Scholar] [CrossRef]
  39. Lee, Gwendolyn K., and Marvin B. Lieberman. 2010. Acquisition vs. internal development as modes of market entry. Strategic Management Journal 31: 140–58. [Google Scholar] [CrossRef]
  40. Liu, Wei, Xiao-Guang Yue, and Paul B. Tchounwou. 2020. Response to the COVID-19 Epidemic: The Chinese Experience and Implications for Other Countries. International Journal of Environmental Research and Public Health 17: 2304. [Google Scholar] [CrossRef] [Green Version]
  41. Lu, Jane W., and Paul W. Beamish. 2004. International diversification and firm performance: The S-curve hypothesis. The Academy of Management Journal 47: 598–609. [Google Scholar]
  42. Lubatkin, Michael, and Hugh M. O’Neill. 1987. Merger strategies and capital market risk. The Academy of Management Journal 30: 665–84. [Google Scholar]
  43. Luo, Yu-Meng, Wei Liu, Xiao-Guang Yue, and Marc A. Rosen. 2020. Sustainable Emergency Management Based on Intelligent Information Processing. Sustainability 12: 1081. [Google Scholar] [CrossRef] [Green Version]
  44. Matta, Elie, and Jean McGuire. 2008. Too risky to hold? The effect of downside risk, accumulated equity wealth, and firm performance on CEO equity reduction. Organization Science 19: 567–80. [Google Scholar] [CrossRef]
  45. Maurer, Frantz. 2011. Risk and return: New insights for theory, measurement and management. Journal of Applied Business Research (JABR) 24. [Google Scholar] [CrossRef] [Green Version]
  46. Michel, John G., and Donald C. Hambrick. 1992. Diversification posture and top management team characteristics. Academy of Management Journal 35: 9–37. [Google Scholar] [CrossRef] [Green Version]
  47. Miller, Kent D., and Wei-Ru Chen. 2003. Risk and firms’ costs. Strategic Organization 1: 355–82. [Google Scholar] [CrossRef]
  48. Miller, Kent D., and Wei-Ru Chen. 2004. Variable organizational risk preferences: Tests of the march-shapira model. The Academy of Management Journal 47: 105–15. [Google Scholar]
  49. Miller, Kent D., and Jeffery J. Reuer. 1996. Measuring organizational downside risk. Strategic Management Journal 17: 671–91. [Google Scholar] [CrossRef]
  50. Nayyar, Praveen R. 1992. On the measurement of corporate diversification strategy: Evidence from large U.S. service firms. Strategic Management Journal 13: 219–35. [Google Scholar] [CrossRef]
  51. Palich, Leslie E., Laura B. Cardinal, and C. Chet Miller. 2000. Curvilinearity in the diversification-performance linkage: An examination of over three decades of research. Strategic Management Journal 21: 155–74. [Google Scholar] [CrossRef]
  52. Park, Kwangmin, and SooCheong Shawn Jang. 2012. Effect of diversification on firm performance: Application of the entropy measure. International Journal of Hospitality Management 31: 218–28. [Google Scholar] [CrossRef]
  53. Patel, Pankaj C., and Danielle Cooper. 2014. The harder they fall, the faster they rise: Approach and avoidance focus in narcissistic CEOs. Strategic Management Journal 35: 1528–40. [Google Scholar] [CrossRef]
  54. Qian, Gongming, Theodore A. Khoury, Mike W. Peng, and Zhengming Qian. 2010. The performance implications of intra- and inter-regional geographic diversification. Strategic Management Journal 31: 1018–30. [Google Scholar] [CrossRef] [Green Version]
  55. Robins, James A. 1993. Organization as strategy: Restructuring production in the film industry. Strategic Management Journal 14: 103–18. [Google Scholar] [CrossRef]
  56. Rugman, Alan M. 1976. Risk reduction by international diversification. Journal of International Business Studies 7: 75–80. [Google Scholar] [CrossRef]
  57. Rumelt, Richard P. 1974. Strategy, Structure, and Economic Performance. Cambridge: Division of Research, Graduate School of Business Administration, Harvard University Boston. [Google Scholar]
  58. Shao, Xue-Feng, Wei Liu, and Xiao-Guang Yue. 2020. Editorial for the Special Issue on “The Belt and Road-Risks and Financial Management Issues Faced by Enterprises’ Internationalization”. Journal of Risk and Financial Management 13: 10. [Google Scholar] [CrossRef] [Green Version]
  59. Shughart, Larry A., and Lex Donaldson. 2004. Redesigning the commercial organization of CSX: An organizational portfolio analysis. Journal of the Transportation Research Forum 43: 69–84. [Google Scholar] [CrossRef] [Green Version]
  60. Su, Larry D. 2010. Ownership structure, corporate diversification and capital structure: Evidence from China’s publicly listed firms. Management Decision 48: 314–39. [Google Scholar] [CrossRef]
  61. Sun, Shilu, Tiantian Li, Hong Ma, Rita Y. M. Li, Kostas Gouliamos, Jianming Zheng, Yan Han, Otilia Manta, Ubaldo Comite, Teresa Barros, and et al. 2020. Does Employee Quality Affect Corporate Social Responsibility? Evidence from China. Sustainability 12: 2692. [Google Scholar] [CrossRef] [Green Version]
  62. Tallman, Stephen, and Jiatao Li. 1996. Effects of international diversity and product diversity on the performance of multinational firms. The Academy of Management Journal 39: 179–96. [Google Scholar]
  63. Tzafrir, Shay S. 2006. A Universalistic Perspective for Explaining the Relationship between HRM Practices and Firm Performance at Different Points in Time. Journal of Managerial Psychology 21: 109–30. [Google Scholar] [CrossRef]
  64. Wagner, Stefan, Karin Hoisl, and Grid Thoma. 2014. Overcoming localization of knowledge—The role of professional service firms. Strategic Management Journal 35: 1671–88. [Google Scholar] [CrossRef] [Green Version]
  65. Wan, William, Robert Hoskisson, Jeremy Short, and Yiu Daphne. 2011. Resource-Based Theory and Corporate Diversification: Accomplishments and Opportunities. Journal of Management 37: 1335–68. [Google Scholar] [CrossRef]
  66. Yuan, Ding, Hua Zhang, and Junxi Zhang. 2008. The financial and operating performance of Chinese family-owned listed firms. Management International Review 48: 297–318. [Google Scholar] [CrossRef]
  67. Yue, Xiao-Guang, Xue-Feng Shao, Rita Y. M. Li, James C. Crabbe, Lili Mi, Siyan Hu, Julien S. Baker, and Gang Liang. 2020. Risk Management Analysis for Novel Coronavirus in Wuhan, China. Journal of Risk and Financial Management 13: 22. [Google Scholar] [CrossRef] [Green Version]
  68. Zhou, Yue. 2011. Synergy, Coordination Costs, and Diversification Choices. Strategic Management Journal 32: 624–39. [Google Scholar] [CrossRef]
Figure 1. Business Units’ Movements and Desynchronicity.
Risks 08 00051 g001
Table 1. Summary of Key Statistics and Correlations of Variables—relating sales to risk.
VariableMeanSDMaxMin12345678
1Corporate risk−1.420.56−0.06−3.04
2Entropy diversification0.680.321.920.02−0.02
3B-H diversification0.420.180.840.00−0.030.96 **
4Desynchronicity−1.141.190.66−4.99−0.38 **−0.10 **−0.10 **
5MNC0.140.351.000.000.01−0.07−0.060.05
6Location0.170.371.000.000.14 **0.12 **0.08 *−0.10 **0.00
7Size (LN)7.312.2013.941.56−0.060.19 **0.11 **−0.15 **−0.07 *0.35 **
8ROA0.040.070.33−0.660.040.050.00−0.27 *−0.050.070.25 **
9Age (LN)3.400.504.162.49−0.23 **0.11 **0.09 *0.01−0.08 *−0.28 *0.10 *0.07 *
n = 737, * p < 0.05, ** p < 0.01.
Table 2. Summary of Key Statistics and Correlations of Variables—relating SD of ROA to risk.
VariableMeanSDMaxMin12345678
1Corporate risk−3.000.94−0.45−5.59
2Entropy diversification0.680.331.540.00−0.02
3B-H diversification0.410.190.760.000.030.97 **
4Desynchronicity−0.380.710.65−3.72−0.26 **−0.03−0.04
5MNC0.120.331.000.000.01−0.13 *−0.14 *−0.07
6Location0.110.321.000.000.000.030.01−0.040.05
7Size (LN)7.172.0112.112.20−0.42 **0.17 **0.09−0.06−0.060.31 *
8ROA0.040.070.33−0.66−0.20 **0.02−0.030.12 *−0.050.030.21 **
9Age (LN)3.470.494.162.49−0.11 *0.14 *0.10−0.03−0.13 *−0.23 **0.13 *0.08
N = 332, * p < 0.05, ** p < 0.01.
Table 3. Comparison of Diversification Models, as Measured by the Entropy Method for Corporate Risk.
VariablesModel1Model2Model3Model4
CV of SalesSD of ProfitΔ CV of SalesΔ SD of Profit
Entropy diversification−0.05(0.06)−0.05(0.15)−0.18(0.12)−0.16(0.21)
Controls
MNC0.05(0.06)0.01(0.14)
Location0.147 *(0.06)0.35 *(0.16)
Size (LN)−0.01(0.01)−0.18 ***(0.03)−0.38 ***(0.07)−0.27 *(0.11)
ROA0.45(0.29)−1.72 **(0.64)−0.42(0.41)−5.04 ***(0.72)
Age (LN)−0.23 ***(0.04)−0.07(0.10)
Industry dummiesYesYesNoNo
Intercept0.05(0.56)−0.63(0.90)−0.21 ***(0.04)0.27 ***(0.06)
N737332765369
F7.039.6912.9521.49
R-squared0.130.320.050.15
Adj. R-squared0.110.280.050.14
Standard errors are in parentheses. *** p < 0.001, ** p < 0.01, * p < 0.05
Table 4. Effect of Diversification Measured by the Berry-Herfindahl Method.
VariablesModel1Model2Model3Model4
CV of SalesSD of ProfitΔ CV of SalesΔ SD of Profit
B-H diversification−0.12(0.11)−0.08(0.25)−0.39 (0.22)−0.46(0.40)
Controls
MNC0.05(0.06)0.01(0.14)
Location0.15 *(0.06)0.35 *(0.16)
Size (LN)−0.01(0.01)−0.18 ***(0.03)−0.38 ***(0.07)−0.27 *(0.11)
ROA0.44(0.29)−1.72 **(0.64)−0.45(0.41)−5.11 ***(0.72)
Age (LN)−0.23 ***(0.04)−0.07(0.10)
Industry dummiesYesYesNoNo
Intercept0.07(0.56)−0.63(0.90)−0.21 ***(0.04)0.27 ***(0.06)
N737332765369
F7.089.6813.1421.77
R-squared0.130.320.050.15
Adj. R-squared0.110.280.050.15
Standard errors are in parentheses. *** p < 0.001, ** p < 0.01, * p < 0.05, p < 0.10.
Table 5. Comparison of Analyses of Variance on Diversification Groups, as Related to Corporate Risk.
CV of Sales MethodDfMSFSig.
Diversification groups30.772.460.06
Error7330.31
Corrected total736
SD of ROA MethodDfMSFSig.
Diversification groups30.0030.370.77
Error3280.009
Corrected total331
Table 6. A comparative Mean Risk Test—related to Diversification Groups.
Difference between MeansSimultaneous 95% Confidence LimitsComparisons Significant at the 0.10 Level Are Indicated by
UD–RD0.09−0.070.24
UD–Dominate0.08−0.070.23
UD–Single−0.12−0.360.125
RD–Dominate−0.004−0.130.12
RD–Single−0.20−0.430.02
Dominate–Single−0.20−0.420.02
p < 0.10.
Table 7. Effect of Desynchronicity on Corporate Risk.
VariablesModel1Model2Model3Model4
CV of SalesSD of ProfitCV of SalesSD of Profit
Desynchronicity−0.18 ***(0.02)−0.36 ***(0.06)−0.19 ***(0.01)−0.32 ***(0.04)
Controls
MNC0.05(0.05)−0.07(0.13)
Location0.11 (0.06)0.34 *(0.15)
Size (LN)−0.03 **(0.01)−0.19 ***(0.02)−0.24 ***(0.06)−0.26 *(0.10)
ROA−0.24(0.28)−1.21 *(0.61)−0.41(0.37)−4.35 ***(0.66)
Age (LN)−0.23 ***(0.04)−0.10(0.09)
Industry dummiesYesYesNoNo
Intercept−0.27(0.51)−0.57(0.85)−0.12 ***(0.03)0.26 ***(0.06)
N737332765369
F16.8313.0678.4547.93
R-squared0.260.380.240.28
Adj. R-squared0.240.350.230.28
Standard errors are in parentheses. *** p < 0.001, ** p < 0.01, * p < 0.05, p < 0.10.
Table 8. t-test of the Effect Difference of Diversification and Desynchronicity.
Bootstrap Estimation
Diversification MethodRisk MethodConfidence IntervalSignificance Support
Berry-Herfindahl DiversificationCV of Sales 0.090.23Supported
SD of Profit 0.120.45Supported
∆ CV of Sales 0.210.39Supported
∆ SD of Profit0.150.58Supported
Entropy DiversificationCV of Sales 0.070.25Supported
SD of Profit 0.120.47Supported
∆ CV of Sales 0.210.39Supported
∆ SD of Profit0.200.62Supported

