Abstract
The paper proposes a novel computational impact analysis framework to proactively manage dynamic constraints and optimally promote the inception of central banks’ regulatory policies. Currently, central banks are encountering contradictory challenges in developing and implementing regulatory policy. These constraints mainly comprise of incomplete or anomalous information (information asymmetry), and very tight temporal and resources limitations (bounded rationality) when the efficiency of a policy is determined at a system-level. The complex relationships of the policy attributes and their interactions generate very dynamic emergent behaviours due to the complex causal relationships. This paper adopted and tailored the hierarchical change management structure framework to design a first step framework called ‘computational regulatory policy change governance’. The methodology uses interviews, focus-group workshop and the application of empirical data. The results of the evaluation and case study validate its applicability in computing policy parameters and the impacts of their interactions. The evaluation of the framework gained a remarkable score, averaging a 130 per cent improvement compared to the existing methods. However, the research paper used a single case study, and its outcomes require further evaluation and testing. Accordingly, we invite regulators, banks, scholars and practitioners to explore the uniqueness and features of the proposed framework.
1. Introduction
Central banks (CBs)/regulators, these terms will be used interchangeably or together in this paper whenever this does not create ambiguity, strive to adopt effective mechanisms to improve the regulation policy systems of their financial institutions (Alrabiah 2018; Capano and Woo 2017; IFC 2019; IMF 2017; Stiroh 2019). They operate and manage their tasks to keep the economy in good health and create the right set of policies to regulate the economy (Goodhart 2011; IFC 2019; Wagner 2010). These tasks are usually adopted by considering the effects of the negative influences on regulatory policy implementation. These influences (in this paper called multidimensional constraints) are the CBs’ objectives, commercial banks’ goals, consumer expectations and other exogenous parameters, such as economic growth, GDP, inflation management and solutions for unemployment (see Appendix A, Appendix B, Appendix C) (Adem 2010; Black and Jacobzone 2009; Parker and Kirkpatrick 2012). However, the dynamic complexity imposed by the multidimensional constraints makes it arduous for regulators to implement optimal and efficient policies without a standardised and common framework (BIS 2013; Brunnermeier et al. 2012). The global financial crisis (GFC) of 2007–2009 in particular revealed the complexity of the banking regulations and led financial regulators to examine their regulatory policies and investigate the causes and failures of the crisis (Alpanda et al. 2014; Sarlin 2016; Wagner 2010). The traditional technology setup between CBs and commercial banks to implement policies requires rigorous, real-time impact analysis and a constrained and holistic framework that can efficiently deal with the complexity of the commercial banks’ setups and targets (Armenia et al. 2014; Bicking 2011; Gai et al. 2019; OECD 2010, 2015a; Wagner 2010). The implementation of various regulatory standards adhering to the regulatory policy framework per se is a crucial mission, and involves issues that need to be dealt with. Firstly, weaknesses can be seen during the implementation of regulatory practices due to information asymmetries. Secondly, the implementation process also lacks practical assistance of a holistic framework that can deal with the presence of information quality anomalies. Thirdly, the policy setters focus mainly on distinct financial activities and not on treating the various regulatory issues such as feedback loops and negative ripple effects that interconnect in multi-complex relationships in the financial sector. Furthermore, the regulatory standards have also assumed the presence of institutionalising regulatory policy implementation, which is not yet efficiently controlled by regulators. Also, variations in the way identical elements of regulation are treated make policy implementation a complex process.
The paper proposes a potential solution to minimise the negative ripple effects (negative feedback loops) that undoubtedly are induced by orthogonal relationships among policy quality attributes such as objectivity, quantifiability, rationality, alignment, consistency, completeness, accuracy, reliability and granularity. The lack of holistic policy analysis measures between CBs and banks leads to expansion of the regulations’ negative ripple effects and affects other policy dimensions. In contrast, this study tries to design a Computational Regulatory Policy Change Governance framework (CRPCG) to address the lack of holistic analysis that is capable of reducing the considerable costs, time, efforts and resources for both the CBs and the regulated-entities. (Fischer and Miller 2017; Loi and Rodrigues 2012). The phenomena of ripple effects in the business domain are defined as the inconsistency or the unexpected outputs of one or more actions that produce impacts on other schemes or bodies (Alrabiah and Drew 2018b; Lee 1998; Luftman et al. 1993; Yau et al. 1978). Thus, these behaviours probably generate impacts in different directions and lead to the propagation of those effects (Khan 2018). These multifaceted banks’ structures, technology setups and challenges induce negative ripple effects and diminish the optimal implementation of the regulatory policy. Consequently, regulators remain systematically unequipped to analyse the correlation and impact of these factors.
1.1. Problem Statement
Regulatory policy implementation (hereafter, RPI) by regulators are often incepted with low-quality regulations due to negative feedback loops and negative ripple effects generated from information quality anomalies and dynamic complex multidimensional constraints (Adem 2010) (see Figure A2 in Appendix B). These multidimensional constraints are associated with the implementation of the CBs’ regulatory policies that need to be aligned with Basel requirements and regulatory standards (Basel II and III). Adem (2008) has identified ten quality attribute constraints (QACs) that CBs should measure to implement optimal and fair regulatory policies among financial institutions. However, so far, no systematic solution is offered yet to deal efficiently and dynamically with these constraints and measure the impacts of the implemented regulations. CBs usually implement a generic or ‘one-size-fits-all’ policy to regulate the financial sector without considering the dynamic complex structure of the regulated-entities because they are lacking a rigorous measurements tool and full information (Gai et al. 2019; IFC 2019; Stiroh 2019). Consequently, this leads regulated-entities to either comply entirely with the implemented regulation, which affects their plans and strategies, or to ignore and work around them. This is known as ‘policy collision’, which occurs due to an ‘agency problem’ or ‘principal-agent problems’ between CBs and regulated-entities/banks and this affects regulatory policy objectives and diminishes the quality of the policy (Jones et al. 2006).
In such a polymorphic environment (Jones et al. 2006) such as in hierarchical structures, technology infrastructures, business strategies, business operations and firm sizes where each bank/regulated-entity differs in objectives and has strategies to maximise profit and gain more customers, the regulator struggles to ensure a fair and competitive policy without having symmetric information for all stakeholders (Hartmann et al. 2018). Some banks, for example, work around the compliance requirements by presenting inconsistent data due to the difficulties in applying the policy changes that do not align with their objectives (Stiroh 2019). Accordingly, the banking sector loses its competition by not considering banks’ differences and setups.
This dilemma has received more attention since the problems and damage caused by the GFC to the banking sector and the world economy. The International Monetary Fund (IMF), Bank for International Settlements (BIS), European Central Bank (ECB) and community researchers published subsequent reports that insisted on the need for systematic tools that are able to obtain more granular data, reduce negative impacts and information asymmetry and solve bounded rationality (BIS 2015; Carstens 2017; Cœuré 2017a; IFC 2018, 2019; IMF 2013a, 2017, 2009; Walters 2019). The information quality anomalies between CBs and financial firms, such as inaccurate, incomplete and missing data, and asymmetric information, were widely reported as major issues in regulatory policies (Cerutti et al. 2012; Cœuré 2017b; Leone 2010; Lim et al. 2016). Therefore there is a need for analytical tools that can minimise the deficiencies by simulating CBs’ regulatory policy implementations (Cecchetti 2018; Gai et al. 2019; Hartmann et al. 2018; Vinals 2010). The IMF team and BIS experts in various reports on the CB’s imperfect policies advised regulators to improve the quality of the information and reduce the information asymmetry before implementation (Cerutti et al. 2012; Müller and Bundesbank 2019; Witt and Blaschke 2019).
However, the most challenging dynamic behaviours are the negative feedback loops induced by orthogonal relationships among policy quality attributes such as objectivity, quantifiability, rationality, alignment, consistency, completeness, accuracy, reliability and granularity. These negative feedback loops compromise policy objectives (return on policy), thereby compromising its maturity and effectiveness. Generally, policy interacts with a multitude of factors such as the objectives, constraints imposed by a central bank, consumers, regulated-entities, and other exogenous entities. These interactions inevitably create much more complex ripple effects due to the complex orthogonal causal relationships, thereby aggravating the maturity of a newly incepted policy.
The information quality anomalies and negative ripple effects in the banking regulation are illustrated in Figure 1. The figure shows timeliness, consistency, completeness, accuracy, reliability and representation dimensions. These information quality dimensions are vital factors in creating and processing optimal regulatory policy. Whenever these factors are incomplete or encounter discrepancies, they negatively impact the quality of policy information and induce anomalous information (information asymmetry). These behaviours correlate with dynamic complex causal relationships (orthogonal relationships) (Coglianese 2012), bounded by very tight temporal constraints and resources (bounded rationality) and regulated-entities in a polymorphism environment (Bitetti 2018). These issues negatively impact the information and aggregate more negative ripple effects, which eventually diminish the return on policy (policy objectives). The indicated factors in Figure 1 are the results of the first and second round of effects and feedback that is usually observed by regulators.
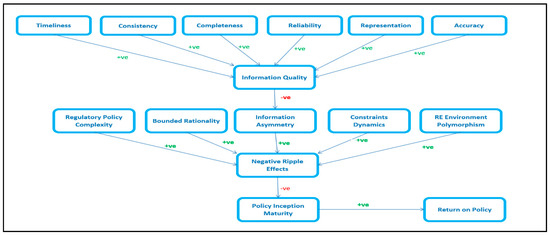
Figure 1.
The correlation of information quality dimensions and negative ripple effects factors on policy implementation.
Also for the regulated-entities, there are different objectives, setups, technology infrastructure and constraints dynamics that induce policy complexity to deal with the generic policy implementations (FSB 2017; IFC 2019; Neuberger and Rissi 2012; Parker and Kirkpatrick 2012). Accordingly, regulators still confront complex and multidimensional constraints (see Figure A1 in Appendix A). From an information technology viewpoint, it seems that there is inadequate literature on the multidimensional constraints that affects the regulatory policy implementations. Therefore, it is necessary to research and propose a computerised framework that is able to measure all the related factors and promote the inception of regulatory policy implementations with relatively high maturity. Consequently, a proactive regulatory policy framework to efficiently compute the complexity of the banks’ multidimensional constraints and economic parameters’ interactions would be an adequate remedy to solve these problems.
This paper uses one case to demonstrate the application and efficacy of a novel computational framework to improve banking regulation process. Thus, the following question is posed:
RQ. How does the development of ‘computational regulatory policy change governance framework’ improve the return on policy and resolving information asymmetry and bounded rationality in central banks’ regulations?
1.2. Motivation and Related Work
The attempts to implement optimal regulatory policy in the banking system by central banks are still facing impediments (Capano and Woo 2017; Freixas et al. 2015; Large 2015; Witt and Blaschke 2019). Because of the heterogeneous and complex nature of banks’ setups, these impediments profoundly impact on the information quality of the implemented policies if they are not adequately measured and analysed (Inoue et al. 2019; Khan 2018; Witt and Blaschke 2019). Therefore, designing a framework to elicit, compute and identify causes would be an appropriate solution. The computational hierarchical change management structure (HCMS) framework developed by (Alrabiah and Drew 2018b) quantifies and analyses the time, cost and impacts in each node (see Figure A4 in Appendix D). Further, the causal analysis framework technique strengthens the competence to develop a regulatory policy framework (Fischer and Miller 2017; Loi and Rodrigues 2012). The novelty of that HCMS framework motivates the researchers to use it to improve and develop a computational framework to measure the regulatory policy instruments between CBs and regulated-entities. The exploratory study provides insights that can assist CBs to minimise adverse effects and negative impacts that may affect a central bank’s objectives, regulated-entities business, consumers’ outlooks and exogenous authorities (Appendix C).
Further, this paper extends the work by (Alrabiah 2018) that proposes a standardisation and integration framework to ideally and proactively regulate the banking system. Also, the paper uses the HCMS framework proposed by (Alrabiah and Drew 2018b). Figure A4 shows an example of the adopted HCMS. The framework would be a useful method to be adopted in the regulatory policy setting to minimise and mitigate impacts and detect negative ripple effects from the multidimensional structure among the financial institutions. Thus, we selected and tailored the HCMS framework to create our framework (CRPCG), shown in Figure A5 in Appendix E. The framework has been initially evaluated based on the literature, the collected data and the focus-group workshop. The novelty of the HCMS framework led the researchers to use it in this case study, though no such similar solution is available yet.
1.3. Study Objectives and the Expected Contribution
The primary purpose of this study was to research and design a computational framework that can systematically model complex policy objectives and forecasts alternatives, including the identification of organisational and cross-organisational interactions, impacts and ripple effects measurement (Fischer and Miller 2017; Hartmann et al. 2018; Howlett 2019; Howlett et al. 2018; Jordan and Turnpenny 2015; Miteski et al. 2018). The aims are to: design a computational framework that assists CBs and stakeholders (i.e., banks, government agencies, regulation authorities, cross-border organisations and the public) to implement effective and equilibrium policies (see Figure A3 in Appendix C); proactively enable optimal implementation of regulatory policy with high maturity and outcome; and finally quantifiably manage the dynamics constraints imposed by exogenous organisations and factors (FSB 2017). Consequently, the absence of computing frameworks that can simultaneously undertake regulatory policy assessment checks and measure macro-level and micro-level parameters, including the identification of their interactions to tackle information asymmetry (incomplete, untimely and inconsistent information) between the CBs (regulators) and the banks is the focus of this paper.
The remainder of this paper: Section 2 reviews the relevant literature on regulatory policy and its importance and challenges, including reasons for failures, impacts on commercial banks, consumers and exogenous organisations. The paper also discusses the feedback loops and complexity in policy implementation, causal loop analysis, risk management in regulation and the required knowledge to execute regulatory policy proactively. Section 3 outlines the research methodology, the outcome of the preliminary data and focus-group workshop including the application of vital regulatory policy instruments and parameters, and describes the proposed framework. Section 4 illustrates the features of the proposed framework and the outcome of the workshop. Finally, Section 5 provides concluding remarks including a summary of findings, practical implications, research limitations and future work.
2. Related Literature
2.1. What is Banking Regulatory Policy and Its Importance?
Banking regulatory policy is a structure that creates transparency between banking institutions and public policy to fit the developmental purpose with high-quality standards (Fischer and Miller 2017; OECD 2014b). As stated in the research by Davies and Green (2010), the importance of the regulatory policy supports the ongoing policy reforms. Inadequate information concerning various regulatory policies has led to many shortcomings and implementation insufficiencies such as those that are biased, resisted, worthless and misinterpreted (OECD 2010). The reports from the OECD indicated that an effective regulatory policy supports economic development and backs the rule of law, among other roles. In many countries, the implementation of regulatory policy has been imperative to minimise corruption and its negative impacts (OECD 2014b).
2.2. Banking Regulatory Policy Challenges
Currently, many CBs and regulators face different challenges when implementing or changing policies (Anagnostopoulos and Kabeega 2018; Capano and Woo 2017; Constâncio et al. 2019; Freixas et al. 2015). Banks, financial firms and regulated-entities have different polymorphism environmental setups, such as in hierarchical structures, technology infrastructures, business strategies, business operations and firm sizes (Alrabiah and Drew 2018b; Brent and Addo 2012). Reports indicate that the policy implementations of most CBs were inefficient (suboptimal) because of information quality (Cœuré 2017b; IMF 2009; Tosun and Treib 2018). The reports indicate that incomplete, inaccurate and untimely data were the most significant impediments in achieving optimum policy. Optimal RPI requires consistent, timely, accurate, complete, represented and reliable information (Chorafas 2011; OECD 2010; Tosun and Treib 2018; Witt and Blaschke 2019).
Another challenge is the exogenous parameters that need a prompt action from CBs, such as government policy constraints due to economic changes, consumer demands and cross-border factors (Brunnermeier et al. 2012; Chorafas 2011; OECD 2010). These issues can impede CBs from implementing equal and fair policies (OECD 2011, 2014a). The differences between the banks make it difficult to measure the risk and impact of the implemented policies in such a complex environment (Stiroh 2019). Other challenges are the primitive methods used to implement regulatory policies that impede banking mechanisms from detecting problems and doing timely impact analyses, and the lack of developed technological systems that can automatically identify policy implementation problems (Aldy 2014; Armenia et al. 2014; Baudino et al. 2018; Broeders and Prenio 2018). Large (2015) enumerates other significant challenges, among them the lack of an automated and integrated regulatory policy system with commercial banks and the differences in knowledge, risks assessment and experience among financial institutions. Arnold et al. (2012) indicated that the RIA process requires a risk measurement approach, which involves a quantitative evaluation of the magnitude of different risks caused by the regulatory policy change. The risk analysis method allows decision-makers to determine whether the regulatory policy change is effective in reducing risks (Loi and Rodrigues 2012). Loi and Rodrigues (2012) introduced various counterfactual approaches to evaluate policies that use ex-post methods. However, the applied methods use algorithms and complicated and lengthy equations that involve time, cost and expertise to analyse impacts. These methods require supportive systematic tools or holistic computational modeling software to enhance the expected outputs by measuring all the correlated dimensions (Appendix C). Chorafas (2011) claimed that when conducting risk analysis, systemic risks must be measured with the aim of achieving high return on policy through regulatory policy change. However, this requires having a systematic tool that can measure microeconomic parameters through the granularity of the data involved to quantify their impacts (Ayadi 2019; FSB 2017; Witt and Blaschke 2019).
Regulatory policy architects in CBs and regulators usually use regulatory impact analysis (RIA) before (ex-ante) or after (ex-post), macroprudential impact analysis, stress tests, the DSGE model, the SYstemic Model of Bank Originated Losses (SYMBOL), the ECB framework (Stamp€) and other tools to analyse, measure and ensure there are effective and efficient regulations (Anderson et al. 2018; Commission 2012; Daripa and Varotto 2005; Dees and Henry 2017; OECD 2015a). Although these analysis methods generate some data about the implemented policies and their performance, these methods measure the higher macroeconomic level, and are not computerised to retrieve and calculate all the needed measurements at the microeconomic level (Aldy 2014; Bholat 2016; OECD 2015a; Smismans 2015). In this vein, Constâncio (2016) call to integrate and strengthen the micro and macro supervisory functions to identify effects, contagion, feedback loops and interactions in the present economy. Thus, there are demands for systematic tools that can provide data measurements–calculations for each firm individually and simultaneously (Cœuré 2017a; Constâncio et al. 2019; Gai et al. 2019; Sarlin 2016). To address this gap, this paper presents a computational framework that measures multi-layer financial parameter(s) nodes and their interactions and collects more granular data.
2.3. How Does a Central Bank Policy Fail?
When exploring the policy change process, different issues are examined to determine the reasons for the failure of a central bank policy (Renda 2006, 2015). Firstly, the degree of independence exercised by the CB is reviewed to determine the authority of the bank in the development of financial policy, policy decisions and implementation of such decisions (FSB 2017; Renda 2006). However, this involves examining the CB’s capacity to set policy objectives relating to monetary and exchange rates (Renda 2006). In situations where its rationality is bounded, the implementation of its policy is likely to fail or be imperfect (Enkhzaya 2006; Walters 2019). For instance, the autonomy of the CB may be hampered by interference from political leaders serving in the government. Such political ideologies tend to influence the extent to which the central bank can design and implement appropriate policies in the national interest (Bolton and Rosenthal 2002; Jacobs 2006). Secondly, the degree of responsibility associated with the CB contributes to the failure of its policy (Sobel and Dove 2012). For instance, the successful implementation of a CB policy requires possession of the instruments needed to achieve financial stability by managing negative ripple effects and not inducing negative impacts (Kim et al. 2010). Similarly, the tasks allocated to it, based on the regulation of the financial sector and the supervision of financial institutions, are considered to influence the success of the policy implementation (Cœuré 2019; Mahadeva and Sterne 2012). For instance, tasks that are not defined clearly and aligned with specific objectives may lead to the failure of a CB policy. Without considering the challenges facing the CB, the policy implementation process may fail to achieve the projected objectives (OECD 2015a).
2.4. Regulatory Policy Impact on Commercial Banks, Consumers and Exogenous Organisations
The implementation of CB policies presents significant impacts on the operations of the banks (OECD 2014a). CB policy includes the monetary policy that it executes to achieve specific objectives for controlling the supply of money in an economy (Kaufmann et al. 2011; OECD 2010). Various components of CB policies that are characterised with negative impacts affect commercial banks’ objectives (OECD 2015a). For instance, each bank operates with different objectives and setups. Further, banks differ in their structure and capability, which in this paper is defined as quality attribute constraints (QACs). This heterogeneous environment (polymorphism) leads to information asymmetries and unfair implementations of ‘one-size-fits-all’ regulatory policies, which hinder reaching optimum objectives (Hartmann et al. 2018; Müller and Bundesbank 2019). However, the operations of banks must be determined by the financial stability objective of CB policies. Many CBs perform their duties based on the fact that they have primary policy responsibility for maintaining financial stability (IFC 2019; OECD 2007).
CB policies also have significant impacts on consumers by influencing the kind of services that consumers can receive from banking institutions (OECD 2012). Consumers obtain different products from banks and other financial institutions (Cartwright 2004). According to Cartwright (2004), one important banking product that consumers receive is the consumer loan, which allows them to acquire the funds they need to cover their consumption expenses. However, a consumer loan is usually affected by interest rates (Waller 2000), which are affected by CB policies that determine the interest rate. As a result, the implementation of CB policies has a significant impact on different economic sectors and activities that influence consumers’ living standards (Beck et al. 2010; Cartwright 2004).
RPI in CBs has been explored to determine the effect on exogenous organisations. (Schmitt-Grohé and Uribe 2012) presented an example from Greece and Spain showing that exogenous (external) factors heavily impacted these countries during the GFC. Their report shows that the primary source of the problem is incomplete data with cross-border financial linkages. However, the financial effects relating to the implementation of central bank policies tend to influence the operations of other organisations operating within an economy. Therefore, the RPI should involve the identification of QACs and the mitigation of diverse issues that may affect the effective implementation of the new policy changes to realise financial and economic stability. Therefore, this paper proposes an equilibrium framework for the four groups of stakeholders: the CB, banks, consumers and exogenous entities (Appendix C).
2.5. Feedback Loops, Ripple Effects and Complexity in Regulatory Policy Implementation
Saeed (2004) points out that manual implementation of regulatory policies is associated with negative feedback loops that can impede the optimal implementation of new or updated regulatory policies. Further, he argued that the use of computerised systems is likely to assist the CBs to refine regulatory policy by detecting these negative feedback loops. In the banking sector, the negative feedback loops come in different guises, which impact on banking products positively and negatively (Freixas et al. 2015; Gramlich and Oet 2012; Kim and Kim 2014; Oet and Pavlov 2014). In this case, they can provide the general mechanism for self-adoption and benefits if measured and monitored properly (Oet and Pavlov 2014). However, with the current methods and restrictions of RPI, it is difficult to achieve optimal regulation adjustments (Bounds 2010; Parker and Kirkpatrick 2012).
Immature regulatory policy implementation is particularly due to information quality anomalies that contribute inefficiencies and impact negatively on policy objectives. The IMF has indicated that the crises that are found in the banking industry reveal bank inefficacies in handling negative ripple effects induced by regulatory policy vulnerability (IMF 2013b, 2018). Therefore, to mitigate the problem, the IMF has insisted on deploying timely and sophisticated communication channels between CBs. Another shared viewpoint is that banking regulatory policies are supposed to act as the remedy for banks’ passivity and other biases (World Bank 2014). However, CB regulatory systems continue to face contrary challenges because of the lack of advanced tools and systematic methods that can holistically measure and detect the interconnectedness multidimensional factors (Cœuré 2017b; Duncan and Nolan 2015; KPMG 2014; Oet and Pavlov 2014).
Based on the preceding points, it is apparent that a computational regulatory policy framework could help to narrow this gap in banking regulation. To clarify what the regulatory policy complexity in the CB’s relationship dimensions looks like, Figure A1 shows an example of the complexity of the multidimensional constraints and factors that a CB needs to manage and deal with during the implementation of regulatory policy. In Figure A1 there are three zones of constraints to deal with, namely commercial banks constraints, national constraints and global constraints. However, most CBs lack a tool that can compute and analyse all these dynamic constraints to obtain equilibrium policies that can suit all parties (Broeders and Prenio 2018).
As reported by Eijffinger and Masciandaro (2012) the issue of different hierarchical supervision systems affects the policy execution in banks. Furthermore, they noted that various financial government institutions have different infrastructures. However, although systematic and measured regulation may help to minimise negative impacts caused by feedback loops, ‘one-size-fits-all’ regulation has been a burden (Dowd 2014; Fischer and Miller 2017; FSB 2017; IFC 2019; Neuberger and Rissi 2012; Stiroh 2019). Nevertheless, the complexity of heterogeneous entities has been a hindrance to implementing efficient regulatory policy (Dowd 2014; Inoue et al. 2019; Sterman 2000).
2.6. Causal Loop Analysis
Several research studies have presented evidence of using causal loops as an analysis tool for banking issues, crises or complexities around the world (Coglianese 2012; Morecroft 2015; Richardson 1986; Rosenberg et al. 2014). The recent study by Moradi and Paulet (2014) sought to provide analysis of the austerity policy as well as a demonstration of its impact and side effects on the economy of the European Union (EU) through the application of causal loop diagrams to the policy framework parameters. Moradi and Paulet (2014) have employed causal loop diagrams (CLDs) to capture the mechanisms of the European banking crisis as well as the European sovereign debt crisis. These attempts have aimed at providing an understanding of the banking system that is dynamically complex. Further, they captured the expected impacts of the delayed and indirect consequences that the rigorous measures had on the EU‘s economy. In their findings, they noted that CLDs have attempted to predict the issues of differences arising between the European banking crisis and the overall banking crisis. Regarding the side effects of the policy, Moradi and Paulet (2014) pointed out two categories of economic consequences: where CLDs are useful in modeling of the causal structure of the real system. One is an increase in the unemployment rate, a slump in the economy and a decline of asset values; the other is the ongoing political issues. In a similar vein, they have attempted to give an illustration of the interaction between different economic factors such as debits, profits, assets, taxes and other pivotal parameters. New research by (Sayyadi and Awasthi 2017) undertakes a rich study that shows the indispensable role of the CLDs methods in visualising the causes and identifying feedback loops which help detect negative ripple effects. Further, the focused study of the CLD capabilities by Rosenberg et al. (2014) indicates the powerful tactics used to measure and identify relationships, impacts and policy complexity. Vukoslavcevic (2012) concludes that CBs need a consistent measurement tool to monitor their policies. Hence, our paper used the advantages of the CLD methods to develop the proposed CRPCG framework, and the causal analysis model (CAM) to measure impacts and changes (Figure A5).
2.7. Regulatory Risk Management
Researchers on policy ripple effects have examined several instances, including the aftermath of the 2008 GFC, where CBs and lawmakers promulgated sweeping rules which would cut down systematic risks activities (Dhameja 2010; IMF 2013a). CBs combine their capacities to employ macroeconomic instruments, statistical, business models, scoring models and other techniques to promptly address deviations as they emerge (Engelmann and Rauhmeier 2014). Usually, CBs struggle to be in a proactive mode to measure the impacts of critical financial instruments and parameters such as the Loan-to-Deposit Ratio (LDR), Capital Adequacy Ratio (CAR), Liquidity Coverage Ratio (LCR), Provisioning Requirements, Leverage Ratio (LR), Net Stable Funding Ratio (NSFR) and other crucial components due to the heterogeneous and complex nature of the banking sector. This requires the guidance of a framework to elicit and evaluate the risk to achieve the objectives of regulation (Capano and Woo 2017).
These impediments were mostly due to the incapability of the regulators’ technological tools to monitor and assess banks’ risk instruments (Alrabiah 2018). Thus, by strengthening supervision and control over other financial institutions, based on the new policy framework, CBs are likely to foster the stability of the financial market (Ayadi 2019; Broeders and Prenio 2018; Jerger 2002). Thus, macro and microeconomic regulation products should be measured concurrently by the regulator to rectify any mismatch objectives or outcomes (Baudino et al. 2018; Crane et al. 2017). The study performed by Ibtissem and Bouri (2013) on credit risk management suggest improving the statistical frameworks to measure and analyse qualitative data. (Van Gool et al. 2012) present the mechanism of credit risk management using examples such as credit scoring in microfinance. In the previous studies about micro financing credit risk management, some authors have expressed the need for the regulatory policy to control banking products. For instance, Moti et al. (2012) have proposed loan reviews as part of a policy measure, which is helpful in the regulatory management of impacts identification. The approach is essential in assessing if the offered products are complying with the regulatory policy or not. However, these initiatives are not enough to handle and maintain a proactive regulatory policy system, and they require adding a sophisticated framework to measure the multidimensional heterogeneous parameters that has been identified as QACs in this paper.
2.8. Knowledge Requirements for Regulatory Policy Execution
For many years, banking RPI has faced dynamic complex issues that prevented the achievement of optimal implementation (Barth et al. 2010; Chorafas 2011; Murphy 2013). Some of these issues are due to the knowledge requirements needed to execute regulatory policies effectively (Rym Ayadi and Mouley 2013; Canuto and Ghosh 2013; Cecchetti 2018; Fischer and Miller 2017). Most of the policies that are executed require multi-disciplinary knowledge that is most likely inadequate in many financial firms (Orphanides and Williams 2004). For instance, the use of poor knowledge to implement regulatory policy within diverse departments has been shown to negatively affect CBs’ policy objectives (Bitetti 2018; Brown et al. 2006). The Canuto and Ghosh (2013) study indicated that in-depth knowledge is imperative when dealing with issues that pertain to policy execution in CBs. CBs do not necessarily comprehend everything at once, but the proposed framework aims to assist in that test by making regulatory policy systems more efficient and allowing CBs to comprehend all the RPI activities and information. Therefore having a framework that contains information about who is doing what, and shares how to measure and simulate RPI would be a big advantage and let the organisation gradually build its knowledge-based system (Cecchetti 2018; Fischer and Miller 2017; Gai et al. 2019). Furthermore, feeding and storing the RPI knowledge-based system with every single action would also facilitate the regulatory policy daily routine, multidisciplinary and epistemic ambience and reduce employee turnover and the dependency on experts (Witt and Blaschke 2019).
3. Materials and Methods
3.1. Research Design
The methodology of this paper uses mixed methods in a case study combining qualitative and quantitative data. It focuses on the exploratory research of preliminary data (operational) surveys, the interviews and focus-group workshop (see Table 1) designed to evaluate the appropriateness of using the adopted framework (HCMS) from (Alrabiah and Drew 2018a). The use of methodological triangulation is a common approach to get reliable data and validate the analysis and outcome (Graue 2015). The comprehensive and critical review of the literature identified some factors and impediments that hinder regulators from having the optimal regulation used here to design the surveys. Specifically, the assigned ten QACs are the primary source of information evaluated in the interviews and then used in the proposed CRPCG framework. The study uses the Saudi Arabian Monetary Authority (SAMA), the central bank of Saudi Arabia, and the commercial banks in Saudi Arabia as a case study. The methods use full samples as the study seeks the profession of the functionalities regardless of participants size and sample features. The preliminary survey, interviews and arranged focus-group workshop are carried out by ten participants (executives, seniors and experts) from SAMA and the commercial banks.

Table 1.
Summary of the study and the research design.
During the preliminary phase, the Monetary Policy and Financial Stability Department in SAMA provided us with the main critical policy instruments that are used to control and stabilise the economy; they are the Loan-to-Deposit Ratio (LDR), Interest Rate, Capital Adequacy Ratio (CAR), Provisioning Requirements and Liquidity Coverage Ratio (LCR). We selected the LDR, Provisioning Requirements and LRC to examine the applicability and capacity of the proposed framework (see Section 3.3). The extracted financial parameters and values in the tables will not be discussed in this paper. However, they are indicated to show the strength of the framework in measuring policy impacts. The conducted exploratory phase arranged common relevant questions that facilitate identifying the causes and events in RPI (Mayer 2015). The questions are why the implemented regulatory policy is suboptimal and inefficient and has shortcomings; why it takes a long time to implement the regulatory policy; how these problems can be solved, who is involved and responsible of these problems. Other questions such as what are the main factors that contributed to these problems; could a computational model improve regulatory policy implementation. Additional preliminary data and facts were collected that tacitly reveal some of the challenges and used to design the surveys. Most of the data and its questions results are used to narrow the scope and focus on the primary issues (see Table A1 in Appendix F).
For our current study, the interview approach is quite advantageous when compared with the other data collection techniques. Direct interviews ensure precise screening and meaningful data (Braun and Clarke 2006; OECD 2015b). Further, the interviewee cannot provide inaccurate information during the interview based on role, race, age and gender (Mayer 2015). Meanwhile, this study requires experts in the field of banking regulatory policy implementation and understand the context of the research to interview them. Therefore, in this study, the interviewer controls the entire interview process and ensures that the interviewee is knowledgeable and stays focused and elicit the complete answers during RPI. The interview protocol consists of two parts: a first interview is Semi-structured interviews aim to justify the collected answers from the surveys and to elicit more information regarding the main issues and challenges. The second interview is planned to introduce the ten QACs and asked the participants to rate the current regulatory system against the ten QACs based on their importance, existence, usability by using Likert response scale from 1 (low) to 5 (high) (see Table 3). Then we asked the participants to rate the proposed CRPCG again (see Figure 2) using the same approach.
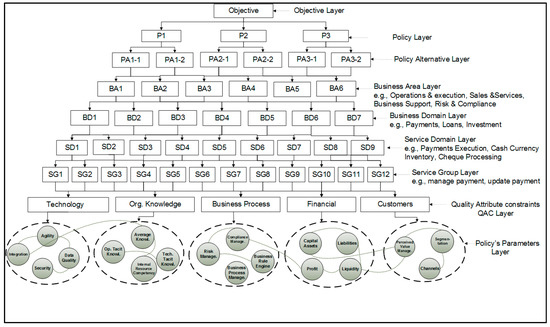
Figure 2.
Computational regulatory policy change governance framework.
The focus-group is appropriate to our study, as it helps in measuring the way participants react to the regulatory practices. The focus-group also offers useful ideas for improving the current situation and play an essential role in identifying the challenges that failing to address (Gray 2019; Krueger and Casey 2014). It provides adequate insights about what the participants think about the ongoing regulatory practices and assesses their reaction to the proposed framework. Thus, we arranged the focus-group workshop to present and discuss the analysis of the extracted data from the exploratory, surveys and interviews, including open-ended questions. Further, the workshop is designed to evaluate the current RPI system compared with the proposed CRPCG framework (see Table 4). The empirical method is designed to test the feasibility of the proposed framework using one of the commercial bank data, as illustrated in Section 3.3. Then the application of that data is evaluated by the focus-group team (see Figure A6 in Appendix H).
3.2. The Development of the Computational Regulatory Policy Change Governance Framework Structure
The framework shown in Figure 2 was adopted and tailored from the HCMS Framework developed by (Alrabiah and Drew 2018b). We customised the HCMS framework to fit with the regulatory policy implementation system in our case study (SAMA). The proposed framework consists of nine hierarchy layers. The first layer is the Objective Layer and sets out to define the goal of the desired policy. The next layer, the Policy Layer, aims to determine the required policies that can accomplish the objective. The third layer, the Policy Alternatives Layer, is used to achieve the main policy among the implemented alternatives, though it eventually depends on the output of the prior layer, the Policy Parameters Layer. The next four layers, the Business Area, Business Domain, Service Domain and Service Group are departmental and operational layers designed to determine the path and process to execute each policy. The regulatory standards and semantic definitions of these layers are adopted from the Banking Industrial Architecture Network (BIAN 2018) and aimed to standardise the available banking services, which has become a standard for many banks around the world. These standards are optional for the CBs and banks to use, and the framework is designed to operate with new or existing, edited standards. Layer eight, Quality Attribute Constraints (QACs), is defined from the literature (see Table A2 in Appendix G).
We limited layer eight, only in this framework version, to cover five QACs: Technology, Organisational Knowledge, Business Process, Financial and Customers. Each of these constraints consists of several parameters (see Table A2 in Appendix G). Also, these parameters are editable and optional to allow the banks to include their preferred parameters or add a new one. The nominated QACs are currently adequate to validate and present the purpose of the developed framework, whereas the other five QACs, Strategy, Governance, Ergonomics, Risk and Organisational Behaviours, are also essential and suggested to be added in the next research phase. The last layer, Policy Parameters, is developed based on the literature of the causal loop diagram models. Each implemented policy is measured and evaluated via the five QACs and their parameters in layer nine. Figure 2, of the Policy Parameters Layer, shows policy parameters and how they link to each other or even cause impacts to a different group. This layer can be cascaded to show and identify multi-layer interaction and causality. Further, the framework can be linked to measure the other identified dimensions, such as consumers and exogenous entities (Figure A3). So, CBs and regulatory authorities would be able to strengthen their regulation based on real-time data and causality dimensions (Jordan and Turnpenny 2015).
Accordingly, this technique would reduce negative impacts and detect the source of negative ripple effects (Kim et al. 2010), resulting in a proactive regulatory policy system and enhancing efficiency. For example, the Financial constraint has four parameters; Capital Assets, Liabilities, Profit and Liquidity, which are impacted or have their values changed by the implemented policy and caused impact (negative or positive) and generate feedback and ripple effects to other parameters, internally and externally. The policy parameters are designed to be measured so far by percentages, numerical values, text or by adding another sub-parameter. This technique allows CBs to measure any impacts of the intended policy, ex-post or ex-ante, and identify the interactions, causalities and the variables behind the consequences (Hartmann et al. 2018). It is worth mentioning that all the nine layers can be widened to accommodate more nodes as required. The developed framework is designed to be used by any regulator, organisation or authority, or even a practitioner or individual. In this paper, we sought validation of the framework by SAMA staff, commercial banks and practitioners. This framework intends to use the private network between SAMA and its commercial banks. Currently, the prototype of this framework is under development, and the next stage of the research will include more details of this phase.
3.3. Application of Policy Instruments and Parameters
The following example illustrates the process of using the proposed framework. In Figure 3 we used a common task in every CB that stabilises the financial sector, as an objective. In the Policy Layer, we selected LDR, Provisioning Requirements and CAR as policy instruments. Then we assigned the policy alternatives that belong to each policy, as indicated in Figure 3. Then, each alternative was implemented through four departmental layers—Business Area, Business Domain, Service Domain and Service Group. These four layers are optional and designed to help decision-makers, regulators and staff to navigate where and how the processes are performed. The QACs, Technology, Organisational Knowledge, Business Process, Financial and Customers are classified and linked to the policy parameters that apply to their groups. Customer QAC is limited, in this example, to measure small and medium enterprise (SME) parameters. Once this policy alternative is executed by SAMA staff, it is sent to each bank to implement and return the results to SAMA. Each bank has the option to use the provided definitions and naming terminology or to use their own structure on the condition that they obtain the proper hierarchy path in each layer required to measure the policy alternative with its parameters.
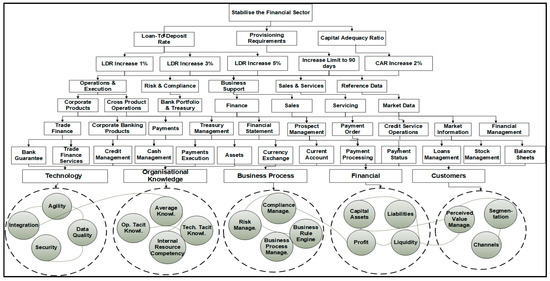
Figure 3.
Application of ‘Stabilise the financial sector in SAMA’.
To demonstrate the feasibility of the framework, we asked one of the commercial banks to simulate and apply the abovementioned example (stabilise the financial sector in SAMA) as in Figure 3. The extracted data have obtained changes and impacts, as shown in Table 2. The resulting data in Table 2 shows the simulation results of three QACs: Financial, Business Process and Customers. While the extracted financial parameters and values in Table 2 will not be discussed in this paper, they are indicated to show the strength and soundness of the framework in measuring and representing policy impacts. The collected parameters’ values are essential indicators to measure how the policies were impacted and by whom. These measurements would be significant and beneficial for regulators if they were available instantly. The extracted data can be simulated in different ways to improve the return on policy and meet policy equilibrium regulation (Appendix C). The usability of the obtained data can be stored in SAMA repository databases for easy access and historical policy simulation, future projection and information sharing (Truong and Tissot 2019). The pull-out data can also encourage CBs to adopt the proposed framework to fully automate the measurements of RPI. The merit behind this framework is to integrate the regulators’ system with their commercial banks to simulate and extract granular data and to measure the impacts and interactions. Consequently, the framework empowers the regulatory policy techniques with a new method to systematically measure the involved multidimensional constraints in the banking sector, as well as in a different domain.
Table 2.
Simulation results of three quality attribute constraints (QACs): Financial, Business Process and Customers.
4. Results
The initial interpretation of the preliminary data highlights the problems besetting SAMA’s RPI and can be summarised as follows: (1) the development and deployment of policy is manually handled; (2) it takes a minimum of 27 months to fully implement a policy in the banks; (3) there is a preference towards developing new policies rather than updating existing ones, hence leading to a very high level of policy collision; (4) policy specifications are ambiguous. (5) policy quality attributes are not explicitly defined (Adem 2008). Further, the analysis of the survey in Table A1 in Appendix F shows average rating scores in most of the answers, which indicates the need to improve the current regulatory policy system. The answers reveal significant challenges such as difficulties predicting the impact and issues until the policy is executed for a long time, as well as information accuracy and dissatisfaction problems.
Table 3 sums up the results of the evaluation of the current RPI system between SAMA and commercial banks. The study used the Likert response scale from 1 (low) to 5 (high) for the assessment of the current and proposed framework. The analysis of the current regulatory policy into the ten QACs shows a total of the average rate. For instance, business processes and governance constraints indicate inadequate management and governance. The technology and organisational knowledge constraints below the average rate explain the long interval time needed to implement a policy. Even though the other constraints are average, there is more room for improvement.
Table 3.
Current regulatory policy system evaluation.
Table 4 shows the evaluation of the current system and the proposed regulatory policy framework. The process of the evaluation comprised firstly presentation of the new CRPCG framework features and followed by a demonstration of its capabilities. Then we asked the participants questions, rating the ten QACs when using the new framework. The evaluation in Table 4 indicates a significant need to improve the quality of the RPI and scored an average improvement of 130%. This result revealed that QAC6 (Technology) scored a 200% improvement with the new framework. Similarly, the other eight QACs show an improvement in the development of more than 100%.
Table 4.
Evaluation of the current RPI system and the proposed framework.
5. Discussion
The proposed CRPCG framework is designed to proactively solve the shortcomings in regulatory policy implementation. The inevitable requirements to regulate, stabilise and govern the financial system after the recent GFC lessons need proactive systematic frameworks that offer rigorous and precise measurements. Thus, the framework structure and technique assist in simulating and measuring policy parameters. The extracted measurement technique shown in Table 2 has added to the RPI practices by facilitating the measurement and evaluation of the policy impacts and interactions which would lead to significant results and enhance the return on policy. The developed framework simplifies the regulatory policy processes and increases the ability to detect feedback loops and negative ripple effects, while simulating the desired policy or after the implementation. The proposed framework also navigates the processes of how the policy is implemented through the hierarchy structure and empowers CBs, decision-makers and practitioners with a holistic view of objectives, policies’ alternatives, workloads, complete information, impacts and parameters’ interactions and to identify causality (Fischer and Miller 2017; Jordan and Turnpenny 2015; Truong and Tissot 2019). Therefore, in regulatory policy settings a framework such as this would equip CBs and regulatory authorities with a sophisticated tool to proactively manage the dynamic constraints and achieve optimum regulation. This new technique simplifies some of the traditional and algorithmic methods that require complex statistical processes.
The evaluation of the presented CRPCG framework indicates a high chance of success in its implementation. Figure 4 shows the comparison of the two systems, wherein nine of the evaluated QACs scored more than a 100 per cent improvement. The focus-group workshop results revealed a 130% average improvement if the proposed framework is applied. Consequently, the study findings satisfactorily answered the research question on ‘how does the development of the CRPCG framework improve the return on policy and resolve information asymmetry and bounded rationality in CBs’ regulations?’
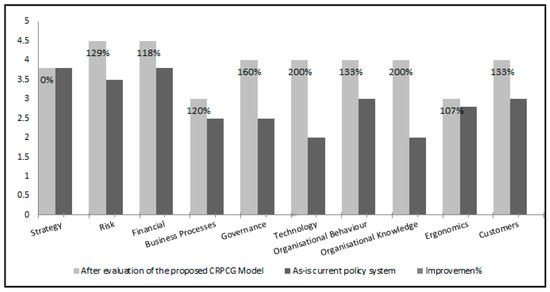
Figure 4.
Comparison of the evaluation of the proposed framework with the current policy system.
In this study, the proposed CRPCG framework allows the organisation to select the best policy alternatives that are most efficient and appropriate for the execution of the required regulation. This approach increases an organisation’s ability to respond proactively and implement the policy in different ways. First, it minimises the associated cost that usually results from change by reducing the required resources, reducing the estimated time to change, and diminishing the scope of impact. Second, it minimises the risks that an organisation might incur by predicting possible threats introduced by the changed policy. It maximises the quality of the service and ensures there is no discrepancy once the appropriate policy alternative is selected. Third, the CRPCG framework can measure the impacts and ripple effects by modeling changes in the policy’s parameters and instruments. Fourth, the CAM technique strengthens regulators’ confidence in their assessment and reduces the efforts (cost, time, resources and knowledge) to identify causality, impacts and negative ripple effects. Additionally, the proposed framework enables the regulator to identify banks compliance with policy implementation, given that regulators and banks have limited temporal timeframes, experience and resources (Gong and Janssen 2017).
The CRPCG framework also extends the existing literature in three ways. First, the framework provides a systemic view of all the parameters involved in the execution of the regulatory policy, including the objectives and the policy alternatives. Second, it systematically identifies the best policy alternatives with regards to the five QACs. Third, the arrival at the best policy alternatives is based upon the CAM models that use system dynamics causal loop diagrams (CLDs) (Rosenberg et al. 2014).
6. Conclusions
This research paper offered a novel computational impact analysis framework to assist with regulatory policy implementation that encounters informational asymmetries and information quality anomalies. The regulator uses generic policies for commercial banks despite these being heterogeneous and complex in their setups, structure, objectives, capitals and dynamic constraints. Inevitably, banks are then impacted by unfit and unmeasured policies that cause disparity and lack of incentives to comply with the regulator’s policies. Subsequently, regulators strive to accomplish an equilibrium policy that takes into consideration all the multidimensional constraints (Figure A1). These multifaceted constraints generate feedback loops and negative ripple effects in untracked and different directions. Therefore, this research paper has proposed the computational regulatory policy change governance framework (CRPCG) that would help in providing regulators with a computable measurement tool (Broeders and Prenio 2018; Zedda 2017). Further, the study claims that the framework is a potential remedy to systematically measure the impacts of regulatory policy parameters and constraints before and after implementation.
6.1. Implications to Theory and Practice
The framework has been evaluated theoretically through the conducted focus-group workshop. The evaluation indicates a potential improvement for replacing the traditional processes with the proposed framework. The comparison analysis showed an average improvement of 130% across the ten quality attribute constraints (QACs). Further, the example of the applied policies elucidates its purposes and merits. The practical test of computing policy parameters, statistics and impacts of the three QACs (Financial, Business Process and Customers) confirms the framework’s capacity to quantify and measure RPI impacts and interactions in each bank. The Policy Parameters Layer is designed to be cascaded to a multi-causal analysis models layer that is able to navigate causes and compute policy impacts and interactions as in Figure A5.
The contributions and key benefits of this paper for regulatory authorities, CBs and supervision authorities are presenting proactive regulatory policy management and deployment framework equipping them with a measurement-based remedy along with stakeholders like banks, practitioners and scholars. The CRPCG framework analytically measures macro and micro policies’ parameters and also categorises metadata in banking regulation implementation (Baudino et al. 2018; Cecchetti 2018). The framework presents an innovative move to optimise regulatory policy systems and open up a new way of creativity for practitioners and regulators (Coglianese 2018). The CRPCG framework would also standardise the policy implementations between regulators and regulated-entities (Tosun and Treib 2018). The framework fits as a multidisciplinary knowledge base and uses common standards among the stakeholders. In general, this framework would add advantages to the public policy community and equilibrate consumers’ demands among the other dimensions, central bank, regulated-entities, and exogenous entities and towards the ‘technology-driven data’ era (Cœuré 2017a) and policy analytics (Longo and McNutt 2018).
6.2. Key Lessons Learnt
The analysis of the conducted study revealed potential improvements by using the proposed CRPCG framework. The framework is a step to set the financial regulatory policy implementation to measure the multidimensional parameters in a proactive environment. The remarkable feedback and rating scores by the banking professionals encourage us to work on a prototype system that would include the quantification and detection of policy parameters causes and interactions. The expected benefits of adopting this framework are the enabling of optimal generation and execution of regulatory policy with high-quality output (return on policy); the achievement of optimal regulatory policy change; the creation of a computational regulatory policy framework, the management of multidimensional constraints; and the adoption of more rigorous policy life-cycle management. This framework primarily benefits CBs and regulators as well as many other stakeholders, including scholars, practitioners and banks.
The proposed CRPCG framework is a novel approach to bridging the gap and contributing to the ongoing initiatives of regulatory policy computational framework assessments and evaluations (Constâncio et al. 2019). The uniqueness of this framework is in unifying and standardising the structure of banking regulatory policy systems. Further, the framework reduces the efforts of identifying policy negative ripple effects and other negative impacts and determines the interactions between various parameters. In addition, the framework facilitates the creation of a policy life-cycle management framework.
The CRPCG framework is under prototype development that will integrate the commercial banks with SAMA including the adding of computational techniques and features. We expect to extend the study to cover the remaining ten QACs and the use of simulation software to test the framework on real-time mode via cross-organisation and exogenous financial entities which would validate its usefulness and merits. The aimed simulation software would also strengthen regulators’ information quality measures to manage risks, compliance checks, monitoring performances and forecast growth. Managerially, it enables regulators to analyse the cataclysm of the big data to discover opportunities, added values and sharing knowledge (Cœuré 2017b). Besides, it puts regulatory systems in a proactive mode to control and manage local and interconnected financial turmoil.
6.3. Limitations of This Research
The limitation of this paper is that it used a single case study to present a proof-of-concept framework. Therefore, some of the evaluation processes of the proposed framework are based on subjective metrics and require more research. Further, the framework is tailored for the explored case study, SAMA and its commercial banks. Therefore, the generalisability and applicability of this framework on various regulatory spaces awaits further evaluation and testing. The applicability of this framework can be confirmed by automating and integrating with the regulated-entities to pull-up policy impacts and statistics instantaneously, thereby providing concrete evidence of its effectiveness.
6.4. Future Research Recommendations
The current research can be further expanded by focusing on different central banks across different regions and also explore their current regulatory framework practices and implementation methodologies. This research will also help in further adding regulation management practices across different countries and issues. Furthermore, the next research will be a practical and simulated use of the proposed framework in prototype software.
Author Contributions
Conceptualization, A.A. and S.D.; Methodology, A.A.; Validation, A.A.; Formal Analysis, A.A.; Investigation, A.A.; Resources, A.A.; Data Curation, A.A.; Writing-Original Draft Preparation, A.A.; Writing-Review & Editing, A.A. and S.D.; Visualization, A.A.; Supervision, S.D.; Project Administration, A.A. and S.D. All authors have read and agreed to the published version of the manuscript.
Funding
This research received no external funding.
Conflicts of Interest
The authors declare no conflict of interest.
Appendix A. Central Banks’ Regulatory Policy Multidimensional Constraints

Figure A1.
Central banks’ regulatory policy multidimensional constraints.
Appendix B. Central Bank Regulatory Policy Quality-Attribute Constraints with Commercial Banks

Figure A2.
Central bank regulatory policy quality-attribute constraints with commercial banks.
Appendix C. Regulatory Policy Change Management Dimensions

Figure A3.
Regulatory policy change management dimensions.
Appendix D. Hierarchical Change Management Structure Computational Framework

Figure A4.
Hierarchical Change Management Structure Computational Framework (Alrabiah and Drew 2018b).
Appendix E. The Generic Computational Regulatory Policy Change Governance Model (CRPCG)

Figure A5.
The generic computational regulatory policy change governance model.
Appendix F. Preliminary Data Analysis
Table A1.
Preliminary data and surveys analysis.
Table A1.
Preliminary data and surveys analysis.
| SAMA and Commercial Banks Preliminary and (Consolidated Surveys) | Related Quality Attribute Constraints | Average Score (No. of Participants = 10) Likert Scale (Low = 1, High = 5) | STD Average |
|---|---|---|---|
| 1. At what level you can predict the issues that the banks have during the implementation of SAMA’s policy? | Risk, Governance, Technology, Org. Knowledge | 1.81 | 0.457260 |
| 2. At what level do you rate the execution of SAMA’s regulations? | Business process, Technology, Org. Behaviour, Org. Knowledge | 3.14 | 0.776886 |
| 3. How do you rate the impact of SAMA’s policy implementation on the banks business processes? | Business process, Technology, Org. Knowledge | 3.82 | 0.740555 |
| 4. How do you rate the level of the interaction with the banks during SAMA’s policy? | Org. Behaviour, Customers | 3.19 | 0.657220 |
| 5. What is the data accuracy level of the implemented policies? | Governance, Technology | 2.26 | 0.402672 |
| 6. To what extent do you rate the new issues that arise after implementation of SAMA’s policy in the banks? | Org. knowledge, Governance, Technology | 3.32 | 0.431148 |
| 7. At what level do you rate the effectiveness of the implemented policy on banks’ operations? | Governance, Strategy, Financial | 3.01 | 0.543801 |
| 8. How do you rate the banks compliance with SAMA’s policy? | Risk, Financial, Governance | 3.00 | 0.444554 |
| 9. How do you rate the stability of SAMA’s policies? | Financial, Strategy | 3.08 | 0.552201 |
| 10. How do you rate the level of the executed policies? | Governance, Business process | 2.75 | 0.478427 |
| 11. How do you rate the dissatisfaction (negative impact) of exogenous entities (such as Ministry for Economic Planning, Ministry of Finance, Ministry of Labour, Royal Council) due to the implementation of new or updated regulatory policies? | Consumers, Strategy, Financial, Risk | 2.00 | 0.474455 |
| 12. How do you rate the frequency to update or modify the implemented policies? | Strategy, Org. knowledge, Org. behaviour, Governance | 3.09 | 0.598495 |
| 13. In what level do you rate the banks’ feedback and complaint (negative feedback and ripple effects) with SAMA’s policies? | Customers, Org. knowledge, Org. behaviour, Governance, Strategy, Risk | 3.14 | 0.542882 |
Appendix G. Quality Attribute Constraints Parameters
Table A2.
Quality Attribute Constraints parameters.
Table A2.
Quality Attribute Constraints parameters.
| # | Financial | Business Processes | Org. Knowledge | Technology | Customers |
|---|---|---|---|---|---|
| 1. | Capital Assets | Business Process Management | Technological Tacit Knowledge | Agility | Segmentation |
| 2. | Liabilities | Operations Management | Operational Tacit Knowledge | Performance Sensitivity | Experience Management |
| 3. | Profit | Compliance Management | Innovation Competencies | Dependency Complexity | Customer Integration |
| 4. | Liquidity | Product Management | Regulatory Compliance | Integration Affinity | Perceived Value (Inventory Management) |
| 5. | Wholesale Funding | Liquidity Management | Systemic Risk Continuous Stress Testing Strategy | Security Implementation | Channels e-channels, Social Channels |
| 6. | SIBOR | Business Rule Engine | Holistic Analysis | Data quality Implementation | Satisfaction |
| 7. | Credit Standard | Process Agility | Internal Resources Competencies | Reusability | |
| 8. | HQLA | Loosely coupled Implementation | Access to External Resources | Modularity | |
| 9. | Liquidity Risk | Bain Map Implementation | Average Knowledge Access Leadtime | Maturity (CMMI) | |
| 10. | Credit Growth | Risk Management Quantification | |||
| 11. | Total Loans | ||||
| 12. | Total Liabilities |
Appendix H. Research Design Chart

Figure A6.
Research Design Chart.
References
- Adem, Hamid. 2008. Analysis of Ripple Effects Triggered by the Implementation of New Regulatory Systems in Saudi Banks, Technical Report Presented to Bank Supervision Department, Retrieved from Riyadh, Saudi Arabia. Unpublished work.
- Adem, Hamid. 2010. Regulatory Policy Analysis Using Four Dimensional Agent Based Hybrid Nash Equilibrium Model, Technical Report Presented to Bank Supervision Department, Retrieved from Saudi Arabia. Unpublished work.
- Aldy, Joseph Edgar. 2014. Learning from Experience: An Assessment of the Retrospective Reviews of Agency Rules and the Evidence for Improving the Design and Implementation of Regulatory Policy. Administrative Conference of the United States. Available online: https://dash.harvard.edu/handle/1/23936082 (accessed on 12 March 2020).
- Alpanda, Sami, Gino Cateau, and Césaire Meh. 2014. A Policy Model to Analyze Macroprudential Regulations and Monetary Policy. Basel: BIS. [Google Scholar]
- Alrabiah, Abdulrahman. 2018. Optimal Regulation of Banking System’s Advanced Credit Risk Management by Unified Computational Representation of Business Processes Across the Entire Banking System. Cogent Economics and Finance 6: 1–22. [Google Scholar] [CrossRef]
- Alrabiah, Abdulrahman, and Steve Drew. 2018a. Deriving Organisational Business Process Change Factors using the Hierarchical Elicitation Workshop. International Journal of Business Process Integration and Management 9: 1–11. [Google Scholar] [CrossRef]
- Alrabiah, Abdulrahman, and Steve Drew. 2018b. Formulating optimal business process change decisions using a computational hierarchical change management structure framework: A case study. Journal of Systems and Information Technology 20: 207–40. [Google Scholar] [CrossRef]
- Anagnostopoulos, Yiannis, and Jackie Kabeega. 2018. Insider perspectives on European banking challenges in the post-crisis regulation environment. Journal of Banking Regulation 20: 136–58. [Google Scholar] [CrossRef]
- Anderson, Ron, Jon Danielsson, Chikako Baba, Udaibir S. Das, Heedon Kang, and Miguel A Segoviano Basurto. 2018. Macroprudential Stress Tests and Policies: Searching for Robust and Implementable Frameworks. Washington: International Monetary Fund. [Google Scholar]
- Armenia, Stefano, Camillo Carlini, and Riccardo Onori. 2014. Policy Modeling as a new area for research: Perspectives for a Systems Thinking and System Dynamics approach? Paper presented at 2nd International Symposium “SYSTEMS THINKING FOR A SUSTAINABLE ECONOMY. Advancements in Economic and Managerial Theory and Practice”, Universitas Mercatorum, Roma, Italy, January 23–24. [Google Scholar]
- Arnold, Bruce, Claudio Borio, Luci Ellis, and Fariborz Moshirian. 2012. Systemic risk, macroprudential policy frameworks, monitoring financial systems and the evolution of capital adequacy. Journal of Banking and Finance 36: 3125–32. [Google Scholar] [CrossRef]
- Ayadi, Rym. 2019. Banking Business Models: Definition, Analytical Framework and Financial Stability Assessment. Cham: Springer International Publishing. [Google Scholar]
- Ayadi, Rym, and Sami Mouley. 2013. Monetary Policies, Banking Systems, Regulatory Convergence, Efficiency and Growth in the Mediterranean. London: Palgrave Macmillan. [Google Scholar]
- Barth, James R., Tong Li, and Wenling Lu. 2010. Bank regulation in the United States. CESifo Economic Studies 56: 112–40. [Google Scholar] [CrossRef][Green Version]
- Baudino, Patrizia, Roland Goetschmann, Jérôme Henry, Ken Taniguchi, and Weisha Zhu. 2018. Stress-testing Banks: A Comparative Analysis. In FSI Insights on Policy Implementation. Basel: FSI. [Google Scholar]
- Beck, Thorsten, Ross Levine, and Alexey Levkov. 2010. Big bad banks? The winners and losers from bank deregulation in the United States. Journal of Finance 65: 1637–67. [Google Scholar] [CrossRef]
- Bholat, David. 2016. Modeling Metadata in Central Banks. Statistics Paper Series. [Google Scholar] [CrossRef]
- BIAN. 2018. BIAN SERVICE LANDSCAPE 6.0. Available online: https://bian.org/deliverables/bian-standards/3154-2/ (accessed on 10 October 2018).
- Bicking, Melanie. 2011. Modeling and simulation to facilitate policy choices: The impact of policy modeling gaps on good governance. In Proceedings of the 12th Annual International Digital Government Research Conference: Digital Government Innovation in Challenging Times. College Park: Association for Computing Machinery, pp. 104–11. [Google Scholar]
- BIS. 2013. Integrated management of micro-databases. In Deepening Business Intelligence within Central Banks’ Statistical Systems. Porto: Irving Fisher Committee on Central Bank Statistics, vol. 37. [Google Scholar]
- Bank of International Settlements. 2015. Regulatory Change and Monetary Policy. Available online: https://www.bis.org/publ/cgfs54.htm (accessed on 11 March 2020).
- Bitetti, Rosamaria. 2018. Principles of the Austrian Tradition in the Policy Cycle. Austrian Economics: The Next Generation 23: 145–59. [Google Scholar]
- Black, Julia, and Stéphane Jacobzone. 2009. Tools for Regulatory Quality and Financial Sector Regulation. Paris: OECD Publishing. [Google Scholar]
- 2002. Political Intervention in Debt Contracts. Journal of Political Economy 110: 1103–34. [CrossRef]
- Bounds, Gregory. 2010. Challenges to Designing Regulatory Policy Frameworks to Manage Risks, In Risk and Regulatory Policy: Improving the Governance of Risk. Paris: OECD Publishing. [Google Scholar]
- Braun, Virginia, and Victoria Clarke. 2006. Using thematic analysis in psychology. Qualitative Research in Psychology 3: 77–101. [Google Scholar] [CrossRef]
- Brent, William H., and Charles K. Addo. 2012. Minimizing Information Asymmetry: Does Firm’s Characteristics Matter? Academy of Banking Studies Journal 11: 43. [Google Scholar]
- Broeders, Dirk, and Jermy Prenio. 2018. Innovative Technology in Financial Supervision (Suptech): The Experience of Early Users. Basel: Financial Stability Institute/Bank for International Settlements. [Google Scholar]
- Brown, Ashley C., Jon Stern, Bernard William Tenenbaum, and Defne Gencer. 2006. Handbook for Evaluating Infrastructure Regulatory Systems. Washington: World Bank Publications. [Google Scholar]
- Brunnermeier, Markus, José De Gregorio, Barry Eichengreen, Mohamed El-Erian, Arminio Fraga, and Takatoshi Ito. 2012. Banks and Cross-Border Capital Flows: Policy Challenges and Regulatory Responses. Committee on International Economic Policy and Reform. Washington: Brookings Institution. [Google Scholar]
- Jones, Bryan D., Graeme Boushey, and Samuel Workman. 2006. Behavioral rationality and the policy processes: Toward a new model of organizational information processing. In Handbook of Public Policy. London: SAGE Publications, pp. 49–74. [Google Scholar]
- Canuto, Otaviano, and Swati Ghosh. 2013. Dealing with the Challenges of Macro Financial Linkages in Emerging Markets. Herndon: World Bank Publications. [Google Scholar]
- Capano, Giliberto, and Jun Jie Woo. 2017. Resilience and robustness in policy design: A critical appraisal. Policy Sciences 50: 399–426. [Google Scholar] [CrossRef]
- Carstens, Agustín. 2017. Policymaking-Respecting the Life-Cycle of Policies. Available online: https://www.bis.org/review/r170816b.pdf (accessed on 10 July 2019).
- Cartwright, Peter. 2004. Banks, Consumers and Regulation. London: Bloomsbury Publishing. [Google Scholar]
- Cecchetti, Stephen G. 2018. Collaboration in Financial Regulatory Reform: The IMF, the Financial Stability Board, and the Standard Setting Bodies. IEO Background Paper No. BP/18-02/04. Washington: International Monetary Fund. [Google Scholar]
- Cerutti, Eugenio, Stijn Claessens, and Patrick McGuire. 2012. Systemic Risks in Global Banking: What Available Data Can Tell Us and What More Data Are Needed? Available online: https://www.nber.org/papers/w18531.pdf (accessed on 15 May 2019).
- Chorafas, Dimitris N. 2011. Basel III, the Devil and Global Banking. London: Palgrave Macmillan. [Google Scholar]
- Cœuré, Benoît. 2017a. Policy analysis with big data. In Speech at the Conference on "Economic and Financial Regulation in the Era of Big Data". Paris: European Central Bank. [Google Scholar]
- Cœuré, Benoît. 2017b. Setting standards for granular data. In Opening Remarks at the Third OFRECB-Bank of England workshop on "Setting Global Standards for Granular Data: Sharing the Challenge". Frankfurt: BIS. [Google Scholar]
- Cœuré, Benoît. 2019. The case for cooperation-cross-border CCP supervision and the role of central banks. In Conference on CCP Risk Management. Frankfurt: BIS. [Google Scholar]
- Coglianese, Cary. 2012. Measuring Regulatory Performance Evaluating the Impact of Regulation and Regulatory Policy. OECD Expert Paper No. 1. Paris: OECD, pp. 1–59. [Google Scholar]
- Coglianese, Cary. 2018. Optimizing Regulation for an Optimizing Economy. University of Pennsylvania Journal of Law & Public Affairs 4: 1. [Google Scholar]
- Commission. 2012. Regulatory Impact Analysis: Benchmarking Productivity Commission Research Report. Productivity Commission Research Report. Canberra: Productivity Commission. [Google Scholar]
- Constâncio, Vítor. 2016. The role of stress testing in supervision and macroprudential policy. In Stress Testing and Macroprudential Regulation. London: Centre for Economic Policy Research, pp. 51–68. [Google Scholar]
- Constâncio, Vítor, Inês Cabral, Carsten Detken, John Fell, Jérôme Henry, Paul Hiebert, Sujit Kapadia, Sergio Nicoletti Altimar, Fatima Pires, and Carmelo Salleo. 2019. Macroprudential Policy at the ECB: Institutional Framework, Strategy, Analytical Tools and Policies. ECB Occasional Paper (227). Frankfurt: European Central Bank. [Google Scholar]
- Crane, Daniel A., Markus Kitzmuller, and Graciela Miralles. 2017. Integrating Micro and Macro Policy Levers in Response to Financial Crises. Mich. Bus. and Entrepreneurial L. Rev. 7: 191. [Google Scholar]
- Daripa, Arup, and Simone Varotto. 2005. Ex ante versus ex Post Regulation of Bank Capital. Birkbeck: University of London, School of Economics, Mathematics and Statistics, pp. 1–51. [Google Scholar]
- Davies, Howard, and David Green. 2010. Banking on the Future: The Fall and Rise of Central Banking. Princeton: Princeton University Press. [Google Scholar]
- Dees, Stéphane, and Jérôme Henry. 2017. Stress-test analytics for macroprudential purposes: Introducing STAMP€. Frankfurt: European Central Bank, pp. 13–30. [Google Scholar]
- Dhameja, Nand. 2010. Global financial crisis: Impact, challenges and way-out. Indian Journal of Industrial Relations 45: 336–49. [Google Scholar]
- Dowd, Kevin. 2014. Math Gone Mad: Regulatory Risk Modeling by the Federal Reserve. Washington: Cato Institute Policy Analysis. [Google Scholar]
- Duncan, Alfred, and Charles Nolan. 2015. Objectives and Challenges of Macroprudential Policy. Glasgow: University of Glasgow Economics. [Google Scholar]
- Eijffinger, SSylvester, and Donato Masciandaro. 2012. Handbook of Central Banking, Financial Regulation and Supervision: After the Financial Crisis. Incorporated: Edward Elgar Publishing. [Google Scholar]
- Engelmann, Bernd, and Robert Rauhmeier. 2014. The Basel II Risk Parameters: Estimation, Validation, Stress Testing—With Applications to Loan Risk Management, 2th ed. Berlin and Heidelberg: Springer Science and Business Media. [Google Scholar]
- Enkhzaya, Chuluunbaatar. 2006. The Impact of Institutions on Lending. Berlin: Springer. [Google Scholar]
- Fischer, Frank, and Gerald J. Miller. 2017. Handbook of Public Policy Analysis: Theory, Politics, and Methods. London: Routledge. [Google Scholar]
- Freixas, Xavier, Luc Laeven, and José-Luis Peydró. 2015. New Challenges for Regulatory Policy. Cambridge: The MIT Press, p. 329. [Google Scholar]
- FSB, Financial Stability Board. 2017. Framework for Post-Implementation Evaluation of the Effects of the G20 Financial Regulatory Reforms. Basel: Financial Stability Board. [Google Scholar]
- Gai, Prasanna, Malcolm Kemp, Antonio Sánchez Serrano, and Isabel Schnabel. 2019. Regulatory Complexity and the Quest for Robust Regulation. SUERF Policy Note. Vienna: The European Money and Finance Forum. Available online: https://www.suerf.org/docx/f_7aee5d5dfa97b2516e5f639672c7e199_6581_suerf.pdf (accessed on 20 July 2019).
- Gong, Yiwei, and Marijn Janssen. 2017. The Impact of Social Business Process Management on Policy-making in e-Government. Paper presented at the Proceedings of the 50th Hawaii International Conference on System Sciences, Waikoloa, HI, USA, January 4–7. [Google Scholar]
- Goodhart, Charles Albert Eric. 2011. The changing role of central banks. Financial History Review 18: 135–54. [Google Scholar] [CrossRef]
- Gramlich, Dieter, and Mikhail V. Oet. 2012. Systemic financial feedbacks–Conceptual framework and modeling implications. Paper presented at the 30th International Conference of the System Dynamics Society on ‘Model-based Management’, St. Gallen, Switzerland, July 22–26. [Google Scholar]
- Graue, Carolin. 2015. Qualitative data analysis. International Journal of Sales, Retailing and Marketing 4: 5–14. [Google Scholar]
- Gray, David E. 2019. Doing Research in the Business World. Thousand Oaks: Sage Publications Limited. [Google Scholar]
- Hartmann, P., H. Huang, and D. Schoenmaker. 2018. The Changing Fortunes of Central Banking. Cambridge: Cambridge University Press. [Google Scholar]
- Howlett, Michael, Giliberto Capano, and M Ramesh. 2018. Designing for Robustness: Surprise, Agility and Improvisation in Policy Design. Milton Park: Taylor and Francis. [Google Scholar]
- Howlett, Michael. 2019. Designing Public Policies: Principles and Instruments. London: Routledge. [Google Scholar]
- Ibtissem, Baklouti, and Abdelfettah Bouri. 2013. Credit risk management in microfinance: The conceptual framework. ACRN Journal of Finance and Risk Perspectives 2: 9–24. [Google Scholar]
- IFC. External Sector Statistics: Current Issues and New Challenges. IFC Bulletins. Washington: IFC.
- IFC. 2019. Are Post-Crisis Statistical Initiatives Completed? IFC Bulletins. Washington: IFC. [Google Scholar]
- IMF. 2009. The Financial Crisis and Information Gaps. Washington: International Monetary Fund. [Google Scholar]
- IMF. 2013a. Global Financial Stability Report: Transition Challenges to Stability. Washington: International Monetary Fund. [Google Scholar]
- IMF. 2013b. The Financial Crisis and Information Gaps: Fourth Progress Report on the Implementation of the G-20 Data Gaps Initiative. Washington: International Monetary Fund. [Google Scholar]
- IMF. 2017. Global Financial Stability Report, April 2017: Getting the Policy Mix Right. Washington: IMF. [Google Scholar]
- IMF. 2018. Republic of Korea Selected Issues. Washington: International Monetary Fund. [Google Scholar]
- Inoue, Hitoshi, Kiyotaka Nakashima, and Toshiaki Ogawa. 2019. The Impacts of Strengthening Regulatory Surveillance on Bank Behavior in Microprudential Policy. Available online: http://kiyotaka.sakura.ne.jp/Inoue_Nakashima_Ogawa_20190912.pdf (accessed on 11 January 2020).
- Jacobs, Scott. 2006. Current Trends in Regulatory Impact Analysis: The Challenges of Mainstreaming RIA into Policy-Making. Available online: http://regulatoryreform.com/wp-content/uploads/2015/02/Jacobs_Current__Trends_and_Processes_in_RIA_May_2006.pdf (accessed on 14 July 2019).
- Jerger, Jürgen. 2002. How strong is the case for a populist central banker? A note. European Economic Review 46: 623–32. [Google Scholar] [CrossRef]
- Jordan, Andrew J., and John R Turnpenny. 2015. The Tools of Policy Formulation: Actors, Capacities, Venues and Effects. Cheltenham: Edward Elgar Publishing. [Google Scholar]
- Kaufmann, Daniel, Aart Kraay, and Massimo Mastruzzi. 2011. The Worldwide Governance Indicators: Methodology and Analytical Issues. Hague Journal on the Rule of Law 3: 220–46. [Google Scholar] [CrossRef]
- Khan, Ashraf. 2018. A Behavioral Approach to Financial Supervision, Regulation, and Central Banking. Washington: International Monetary Fund. Washington: International Monetary Fund. [Google Scholar]
- Kim, Jungeun, Kyeong Pyo Ryu, and Doowoo Nam. 2010. An Analysis of the Ripple Effects of the Global Financial Crisis on the South Korean Economy and the Recovery. In The Financial and Economic Crises: An International Perspective. Cheltenham: Edward Elgar Publishing, pp. 105–20. [Google Scholar]
- Kim, Myeong Hyeon, and Baeho Kim. 2014. Systematic cyclicality of systemic bubbles: Evidence from the US commercial banking system. Journal of Macroeconomics 42: 281–97. [Google Scholar] [CrossRef]
- KPMG. 2014. The Changing Face of Regulatory Reporting: Challenges and Opportunities for Financial Institutions. Amstelveen: KPMG. [Google Scholar]
- Krueger, Richard A, and Mary Anne Casey. 2014. Focus Groups: A Practical Guide for Applied Research. Thousand Oaks: Sage Publications. [Google Scholar]
- Large, Andrew. 2015. Financial Stability Governance Today: A Job Half Done: Ongoing Question for Policymakers. Washington: Group of Thirty. [Google Scholar]
- Lee, Michelle L. 1998. Change Impact Analysis of Object-Oriented Software. Fairfax: George Mason University Virginia. [Google Scholar]
- Leone, Alfredo. 2010. Data and the crisis: Gaps, initiatives and challenges. Central Banking, Quarterly Journal 21: 74–80. [Google Scholar]
- Lim, Ivan, Jens Hagendorff, and Seth Armitage. 2016. Regulatory Monitoring, Information Asymmetry and Accounting Quality: Evidence from the Banking Industry. Available online: https://efmaefm.org/0EFMAMEETINGS/EFMA%20ANNUAL%20MEETINGS/2016-Switzerland/papers/EFMA2016_0504_fullpaper.pdf (accessed on 20 July 2019).
- Loi, Massimo, and Margarida Rodrigues. 2012. A Note on the Impact Evaluation of Public Policies: The Counterfactual Analysis. Luxembourg: Publications Office of the European Union. [Google Scholar]
- Longo, Justin, and Kathleen McNutt. 2018. From policy analysis to policy analytics. In Policy Analysis in Canada. Bristol: Policy Press, pp. 369–89. [Google Scholar]
- Luftman, Jerry N., Paul R. Lewis, and Scott H. Oldach. 1993. Transforming the enterprise: The alignment of business and information technology strategies. IBM Systems Journal 32: 198–221. [Google Scholar] [CrossRef]
- Müller, Stephan, and Deutsche Bundesbank. 2019. Creating Comprehensive Data Worlds Using Standardisation. IFC Bulletins Chapters. Washington: IFC, p. 49. [Google Scholar]
- Mahadeva, Lavan, and Gabriel Sterne. 2012. Monetary Policy Frameworks in a Global Context. Abingdon: Routledge. [Google Scholar]
- Mayer, Isabella. 2015. Qualitative research with a focus on qualitative data analysis. International Journal of Sales, Retailing and Marketing 4: 53–67. [Google Scholar]
- Miteski, Mite, Ana Mitreska, and Mihajlo Vaskov. 2018. The Risk-Taking Channel of Monetary Policy in Macedonia: Evidence from Credit Registry Data. Skopje: National Bank of the Republic of Macedonia. [Google Scholar]
- Moradi, Amir, and Elisabeth Paulet. 2014. A causal loop analysis of the austerity policy adopted to address the Euro crisis-effects and side effects. International Journal of Applied Decision Sciences 8: 1–20. [Google Scholar] [CrossRef]
- Morecroft, John D.W. 2015. Strategic Modeling and Business Dynamics: A Feedback Systems Approach. Hoboken: John Wiley and Sons. [Google Scholar]
- Moti, Haron O., Justo Simiyu Masinde, Nebat Galo Mugenda, and Mary Nelima Sindani. 2012. Effectiveness of credit management system on loan performance: Empirical evidence from micro finance sector in Kenya. International Journal of Business, Humanities and Technology 2: 99–108. [Google Scholar]
- Murphy, Edward V. 2013. Who Regulates Whom and How? An Overview of US Financial Regulatory Policy for Banking and Securities Markets. Ithaca: ILR School. [Google Scholar]
- Neuberger, Doris, and Roger Rissi. 2012. Macroprudential Banking Regulation: Does One Size Fit All? Thünen-Series of Applied Economic Theory Working Paper. Rostock: University of Rostock. [Google Scholar]
- OECD. 2007. Indicators of Regulatory Management Systems. OECD Working Papers on Public Governance, 2007/4. Paris: OECD Publishing. [Google Scholar] [CrossRef]
- OECD. 2010. Regulatory Policy and the Road to Sustainable Growth. Paris: Organization for Economic Co-Operation and Development. [Google Scholar]
- OECD. 2011. The Achievements of Regulatory Policy. Paris: OECD Publishing. [Google Scholar]
- OECD. 2012. Measuring Regulatory Performance. Paris: OECD Publishing. [Google Scholar]
- OECD. 2014a. The Governance of Regulators: Best Practice Principles for Regulatory Policy. Paris: OECD Publishing. [Google Scholar]
- OECD. 2014b. Regulatory Policy in Mexico: Towards a Whole-of-Government Perspective to Regulatory Improvement. Paris: OECD Publishing. [Google Scholar]
- OECD. 2015a. Regulatory Policy in Perspective. Paris: OECD Publishing. [Google Scholar]
- OECD. 2015b. OECD Regulatory Policy Outlook 2015. Paris: OECD Publishing. [Google Scholar]
- Oet, Mikhail V., and Oleg V. Pavlov. 2014. Feedback Mechanisms in the Financial System: A Modern View. Delft: Delft University of Technology. [Google Scholar]
- Orphanides, Athanasios, and John Williams. 2004. Imperfect knowledge, inflation expectations, and monetary policy. In The Inflation-Targeting Debate. Chicago: University of Chicago Press, pp. 201–46. [Google Scholar]
- Parker, David, and Colin Kirkpatrick. 2012. Measuring Regulatory Performance the Economic Impact of Regulatory Policy: A Literature Review of Quantitative Evidence. Paris: OECD Publishing. [Google Scholar]
- Renda, Andrea. 2006. Impact Assessment in the EU. Brussels: Centre for European Policy Studies. [Google Scholar]
- Renda, Andrea. 2015. Regulatory Impact Assessment and regulatory policy. Regulatory Policy in Perspective: A Reader’s Companion to the OECD Regulatory Policy Outlook 2015: 35–114. [Google Scholar]
- Richardson, George P. 1986. Problems with causal-loop diagrams. System Dynamics Review 2: 158–70. [Google Scholar] [CrossRef]
- Rosenberg, Zuzana, Marlen Jurisch, Michael Schermann, and Helmut Krcmar. 2014. Using Case Survey Methodology to Extract Variables and Causal Links: An Example from Studying Business Process Change. Paper presented at the 32nd International Conference of the System Dynamics Society, Wiley, Delft, The Netherlands, July 20–24. [Google Scholar]
- Saeed, Khalid. 2004. Designing an environmental mitigation banking institution for linking the size of economic activity to environmental capacity. Journal of Economic Issues 38: 909–37. [Google Scholar] [CrossRef]
- Sarlin, Peter. 2016. Macroprudential oversight, risk communication and visualization. Journal of Financial Stability 27: 160–79. [Google Scholar] [CrossRef]
- Sayyadi, Reza, and Anjali Awasthi. 2017. A system dynamics based simulation model to evaluate regulatory policies for sustainable transportation planning. International Journal of Modeling and Simulation 37: 25–35. [Google Scholar] [CrossRef]
- Schmitt-Grohé, Stephanie, and Martin Uribe. 2012. Prudential Policy for Peggers. Cambridge: National Bureau of Economic Research, p. 34. [Google Scholar]
- Smismans, Stijn. 2015. Policy evaluation in the EU: The challenges of linking ex ante and ex post appraisal. European Journal of Risk Regulation 6: 6–26. [Google Scholar] [CrossRef]
- Sobel, Russell S, and John A Dove. 2012. State Regulatory Review: A 50 State Analysis of Effectiveness. Arlington: Mercatus Center at George Mason University. [Google Scholar]
- Sterman, John. 2000. Business Dynamics: Systems Thinking and Modeling for a Complex World. New York: McGraw-Hill Education. [Google Scholar]
- Stiroh, Kevin. 2019. Policy Efficiency in Supervision. Available online: https://www.bis.org/review/r190326d.htm (accessed on 11 January 2020).
- Tosun, Jale, and Oliver Treib. 2018. Linking Policy Design and Implementation Styles. London: Routledge. [Google Scholar]
- Truong, Evelyn, and Bruno Tissot. 2019. Are the Post-Crisis Statistical Initiatives Complete? An Overview. IFC Bulletins Chapters. Washington: IFC, p. 49. [Google Scholar]
- Van Gool, Joris, Wouter Verbeke, Piet Sercu, and Bart Baesens. 2012. Credit scoring for microfinance: Is it worth it? International Journal of Finance and Economics 17: 103–23. [Google Scholar] [CrossRef]
- Vinals, Jose. 2010. Central Banking Lessons from the Crisis. Washington: International Monetary Fund. [Google Scholar]
- Vukoslavcevic, Drasko. 2012. The Crisis Of The Euro And New European Governance: Fiscal Union As Solution? Montenegrin Journal of Economics 8: 153. [Google Scholar]
- Wagner, Helmut. 2010. The causes of the recent financial crisis and the role of central banks in avoiding the next one. International Economics and Economic Policy 7: 63–82. [Google Scholar] [CrossRef]
- Waller, Christopher J. 2000. Policy boards and policy smoothing. Quarterly Journal of Economics 115: 305–39. [Google Scholar] [CrossRef]
- Walters, Daniel E. 2019. The Self-Delegation False Alarm: Analyzing Auer Deference’s Effects on Agency Rules. Columbia Law Review 119: 85–168. [Google Scholar]
- Witt, Emily, and Jannick Blaschke. 2019. ECB Data for Analysis and Decision-Making: Data Governance and Technology. IFC Bulletins Chapters 49. Washington: IFC. [Google Scholar]
- World Bank. 2014. Global Financial Development Report 2014: Financial Inclusion. Washington: World Bank Publications. [Google Scholar]
- Yau, Stephen S., James S. Collofello, and T. MacGregor. 1978. Ripple effect analysis of software maintenance. Paper presented at the IEEE Computer Society’s Second International Computer Software and Applications Conference COMPSAC’78, Chicago, IL, USA, November 13–16. [Google Scholar]
- Zedda, Stefano. 2017. Banking Systems Simulation: Theory, Practice, and Application of Modeling Shocks, Losses, and Contagion. Hoboken: Wiley. [Google Scholar]
© 2020 by the authors. Licensee MDPI, Basel, Switzerland. This article is an open access article distributed under the terms and conditions of the Creative Commons Attribution (CC BY) license (http://creativecommons.org/licenses/by/4.0/).