1. Introduction
One of the most important aims in the insurance industry is to manage risk and capital properly. The first attempt in connecting solvency requirements to risk measures relies on the investment of a minimum capital required into a single security, often considered as a risk-free asset. However, this choice has been proven to be non-optimal, whereas the investment in multiple traded assets results in being the correct alternative (see, for instance, [
1] for an example and [
2] for a theoretical introduction). In this process, the choices of the solvency margin and of the optimal portfolio are treated separately. Only in recent years, actuarial research has begun to focus on optimization problems involving both solvency capital and portfolio weights as decision variables. The first example of this interest is represented by [
3], where the maximization of the expected return on risk-adjusted capital is subject to a conditional value-at-risk constraint. Similarly, in [
4], the capital requirement is minimized on the basis of both a ruin probability constraint and a return-on-capital constraint. A dynamic improvement of this approach is provided in [
5], where the portfolio optimization is analyzed under three different solvency regimes.
This new strand of research may be placed in the more general field of portfolio selection problems where an investor utility function is maximized in order to identify the optimal portfolio (see [
6] for a treatment of contemporary applications of the standard portfolio selection framework, while [
7] for an introduction to asset and liability management). All of these papers model the portfolio selection procedure as a single-objective optimization process in which both the constraints due to policyholders and stakeholders are taken into account in order to optimize allocations. At the same time, the classical reward-to-risk analysis carried out on the first two moments of the loss-profit distribution or on quantile-based risk measures may result in being insufficient to provide a complete characterization of the optimal portfolio, because of being unable to capture all of the aspects of stakeholders’ utility function and the liability distribution of the insurer (see [
8] for an introduction to reward-to-risk analysis in portfolio optimization). Therefore, a multiple objective approach may be advisable in order to capture all of these complexities [
9]. In the literature, there are several ways to implement procedures from multiple criteria optimization into portfolio selection in order to better serve the needs of both institutional investors and shareholders [
10]. The main goal is to represent the Pareto front and, more specifically, to guarantee a satisfactory balance between convergence to optimal solutions and diversity among points on the efficient frontier. There are several algorithms that may be implemented to this end, and a preliminary review needs to be done. A classification useful for our purposes has been provided by [
11], according to which we can distinguish between classical methods, which use direct or gradient-based procedures following some mathematical or geometrical principles, and non-classical methods, which are inspired by biological or physical principles. To the first category belongs, for instance, the
ϵ-constraint method that reformulates a multi-objective problem into a single-objective one by converting all, but one of the objectives to constraints with the corresponding right-hand sides set to target values at the discretion of the user. An interesting application is provided by [
12], who proposes a mean-risk model with a portfolio expected value, variance and conditional value-at-risk (CVAR) as optimization criteria. The motivation for extending the standard Markowitz mean-variance analysis by including two risk measures is that there may be an improvement in the solution when a mean-variance-efficient portfolio has an excessively large CVAR or a mean-CVAR-efficient portfolio has an excessively large variance. A promising variant on the subject is represented by the approach developed in [
13], where the risk aversion, prudence, temperance and other higher-order risk characteristics of investors are handled in the multidimensional single-period portfolio optimization. A shortage function is defined in this case that looks for possible increases in odd moments and decreases in even moments. The method ensures sufficient conditions for global optimality. In [
14], the authors compare polynomial goal programming with the shortage function method in constructing mean-variance-skewness portfolios.
Besides the
ϵ-constraint method, the weighted sum method is probably the best known technique to solve multi-criteria optimization problems. As the name suggests, the original multi-objective problem is transformed into a single-objective problem, where the function to optimize is an aggregation of the criteria, with weights provided at the discretion of the user. This procedure has been used in [
15], where the authors propose a four-objective portfolio selection problem where an entropy measure is added to the mean, variance and skewness in order to include explicitly the diversification into portfolio optimization. A complete introduction to this classical type of methods and conditions guaranteeing Pareto optimality can be found in [
16] and in [
17], respectively.
Among the non-classical methods, the multi-objective evolutionary algorithms (MOEAs) seem to be the most important, since they represent a promising tool for complex real-world optimization problems. In general, they attempt to find multiple Pareto optimal solutions in a single run by considering a set of potential candidate solutions that form the so-called initial population. A selection operator based on Pareto domination and a reproduction operator are used iteratively to evolve the population towards the Pareto optimal front. A procedure that has been extensively analyzed in the evolutionary computing literature is the non-dominated sorting genetic algorithm-II (NSGA-II [
18]). It builds a population of competing individuals and sorts them with a non-dominated sorting procedure, which results in all of the chromosomes being assigned a rank. The selection that follows uses the crowded tournament strategy. Crossover and mutation are then applied to create a new pool of offspring, which are combined with parents, before partitioning the enlarged pool into fronts. Elitism is then conducted by adding a crowding distance to each member to generate the next population. This ensures diversity in the population and helps the algorithm to explore the fitness landscape. The chromosomes in the first front of the final population constitute the set of solutions. A recent application in the financial area is given by [
19], who proposes a method to generate technical trading systems for stock timing by selecting the most informative signals by means of a variant of the NSGA-II with variable string length coding. A novel multi-objective optimization algorithm, called DEMPO, has been developed by [
20] to solve mean-variance, mean-expected shortfall and mean-value-at-risk portfolio optimization problems with real-world constraints. The algorithm integrates the differential evolution principle with the paradigms of the NSGA-II. The work in [
21] proposes a variant of the multi-objective particle swarm optimization algorithm based on non-dominated sorting and compares its performance to those of the four other MOEAs. They solved a set of mean-variance problems with budget, floor, ceiling and cardinality constraints. This approach is capable of identifying good Pareto optimal solutions, maintaining adequate diversity.
An example of a procedure that combines classical and evolutionary methods is described in [
22]. The authors integrate an NBI-style Tchebycheff approach in the decomposition phase of a standard MOEA/D [
23]. A portfolio management problem represented by a mean-variance optimization with cardinality constraints and transaction costs is considered to test the effectiveness of the algorithm. Experiments on real data show very promising results.
In the actuarial context, the study conducted in [
24] represents a first attempt to analyze and compare the capabilities of genetic programming and the particle swarm algorithm to find optimal solutions with respect to inspection algorithms for reinsurance problems (see also [
25] for a precise definition). They concluded that the evolutionary algorithms are excellent options to find good solutions in short computation times. A multi-objective framework for EU-based non-life insurance companies is developed in [
26] in order to find the best asset allocation that maximizes simultaneously expected utility and technical efficiency. In this manner, it is possible to consider both shareholders’, as well as customers’ objectives. The optimization is performed by integrating a simulation model into a multi-objective particle swarm optimization algorithm.
For a detailed exposition of other methods and algorithms in the MOEA literature, the interested read may consult [
27,
28], while for a complete survey on portfolio management and economics applications, he/she may refer to [
29,
30].
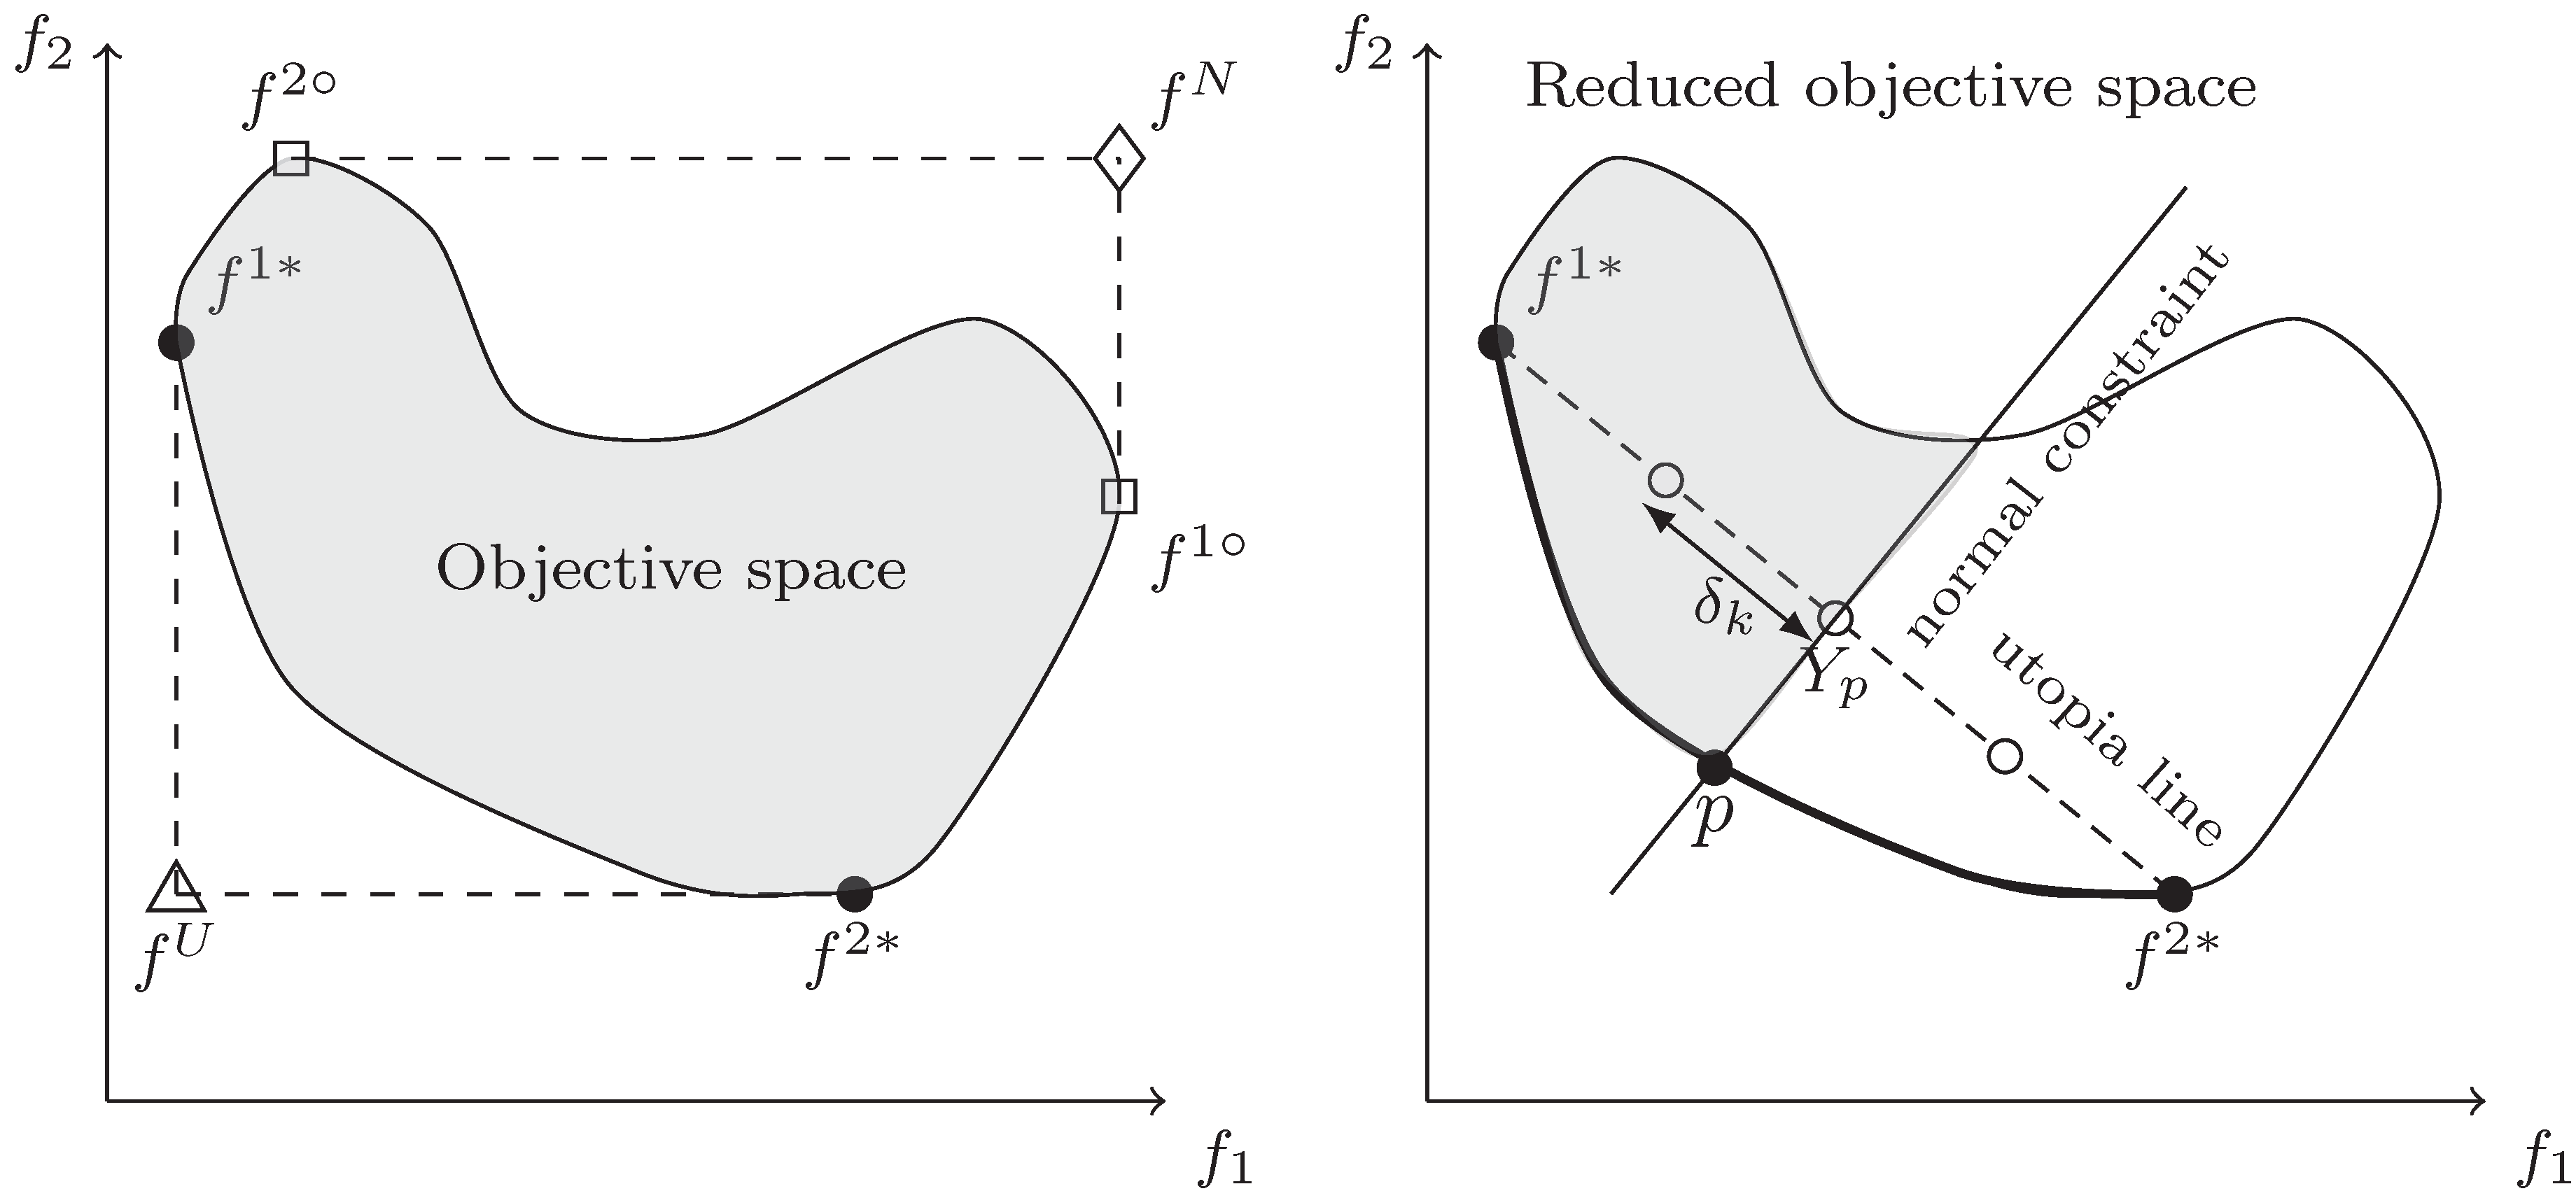
According to these findings, we aim at introducing a flexible and efficient multi-objective simulation-based optimization framework to better represent the tradeoff between portfolio performance and risks associated with both assets and liabilities for a non-life insurance company under the Solvency II Directive. More precisely, we propose to use a Pareto frontier-generating algorithm in the category of classical methods, called the normal constraint optimization method (NC) [
31], to transform multi-objective portfolio problems into single-objective ones by means of a sequential reduction of the feasible space by hyperplanes passing through particular points on the plane spanned by individual function minimizers, the so-called utopia hyperplane. Thus, multi-objective strategies for portfolio selection may be handled as standard stochastic programs with continuous variables. We employ the sample path method, also called the sample average approximation method or the stochastic counterpart method, in order to solve this type of optimization problem. The procedure consists of replacing the original stochastic problem with its sampling approximation and of applying the deterministic optimization techniques to solve the modified problem (see, for example, [
32,
33] for a detailed treatment of the subject). In our context, we propose to estimate the objectives by combining the semiparametric approach recently proposed by [
4] with the GARCH-extreme value theory (EVT)-Copula model in order to reduce the number of simulated scenario and to capture the dependence tail structure of asset return distributions more satisfactorily than traditional multivariate GARCH models and Copula-based models (the interested reader may refer to [
34] for an introduction to the subject and to [
35,
36] for other applications in portfolio optimization).
From a theoretical point of view, to the best of our knowledge, this is the first attempt to develop a general multi-objective scheme that hybridizes the normal constraint method with a global single-objective optimizer in order to solve multi-objective stochastic optimization problems with chance constraints. From an empirical point of view, we furthermore provide a detailed comparison of several standard insurance and financial reward-to-risk portfolio performance measures and analyze how these criteria impact the portfolio selection process. To this end, three portfolio optimization strategies are developed. The first focuses exclusively on the shareholders’ objectives of obtaining maximum profits with minimum capital invested. The second extends the standard reward-to-risk analysis by considering as objectives the expected return on risk-adjusted capital and two risk measures. The last strategy point out the interactions among three performance indicators that usually characterize an insurance company, i.e., expected return on capital, expected return on risk-adjusted capital and the Sharpe ratio.
The paper is organized as follows.
Section 2 provides an introduction to risk measures, performance indicators and regulatory constraints that characterize an EU-based non-life insurance company. Moreover, three stochastic programming problems that integrate at different levels both financial and insurance criteria are also described. The multi-objective optimization procedure is explained in
Section 3. Whereas
Section 4 describes the estimation methods for assets, liabilities and portfolio objectives, in
Section 5, we perform an empirical analysis of the multi-objective portfolio selection problems and discuss the results. Finally in
Section 6, some remarks and ideas are reported for further improvements.
2. Portfolio Optimization Framework
2.1. Preliminaries
We consider a non-life insurance company interested in assessing the risk exposure where both assets and liabilities are included. The insurer operates on a single line of business over a one-month investment period. The liability is expressed by the random variable Y and represents the total sum of contingent claims payable at the end of the period. In order to cover future liabilities, the insurance company receives the premiums paid by the policyholders at the beginning of the period. We assume the premium volume to be proportional to the expected liability, i.e., , where η is the relative security loading factor. Let c denote the amount of capital that, free from constraints due to policyholders, is generally provided by the insurance company’s shareholders, and it can be invested in the same manner as the premium volume in financial markets. Note that the main purpose of c is to ensure the availability of a regulatory capital required of the insurer by the Solvency II Directive. Investment decisions on the total amount are assumed to be made at the beginning of the month.
Suppose that a portfolio consisting of
n assets is available for investments, with
representing the expected value of the assets’ gross returns over the investment period
τ1. Let
be the vector of portfolio weights, whose components satisfy the standard budget constraint:
and a set of box constraints of the type:
where
are respectively the lower bound and the upper bound of the
j-th portfolio decision variable. Box constraints are usually considered in portfolio selection problems for both denoising the asset returns covariance matrix [
37], as well as for defining the investment profile of the portfolio [
38]. In this paper, they will be used to better describe the strategic investment plan of the insurance company.
In summary, the net loss at the end of the period is defined as the excess of liabilities over assets,
i.e.,
and it depends on both shareholders’ invested capital and portfolio weights, while the set of admissible portfolios is:
Our optimization framework jointly solves for c and x and minimizes the risk of mismatch between assets and liabilities depending on how the solvency requirement is defined.
2.2. Risk Measures and Performance Indicators for an Insurance Company
A general definition of a risk measure may be stated as follows [
39].
Definition 1. Let be a probability space, be the space of -valued random variables and be a suitable vector subspace; a risk measure is then a map from to .
Among the plethora of possible sources of uncertainty that may impact the performance of a portfolio, we mainly focus on insurance and market risks.
Since the insurance risk is usually identified with the tail behavior of the loss distribution, we will adopt the value-at-risk and the conditional value-at-risk as possible risk measures. The value-at-risk represents the
α-quantile of the loss distribution and is given by:
It provides the minimal portfolio loss that occurs in of the worst scenarios.
The conditional (or average) value-at-risk is instead defined as the average of losses in the
worst scenarios [
8]. When the loss distribution is continuous, as it is in our case, it is equivalent to the definitions of tail value-at-risk and expected shortfall. Accordingly, there are several ways to compute this quantity; however, the most convenient formulation in this context is the one proposed, for instance, in [
40], where conditional value-at-risk is defined as the solution of a convex optimization problem. Another relevant feature of this risk measure, which will be fundamental in defining selection criteria for our portfolio strategies, is that it can be minimized over the set of decision variables. These results are based on [
41,
42] and are summarized below.
Proposition 1. Let be the net loss defined in Equation (1), with the vector of decision variables ,
and denote the confidence level. Consider the function:where .
The following results hold:- (a)
is finite and continuous as a function of s;
- (b)
the conditional value-at-risk can be evaluated as: - (c)
the set of solutions to the stochastic program defined in Equation (4) is the non-empty, closed and bounded interval:where ; - (d)
minimizing with respect to is equivalent to minimizing with respect to ,
i.e.,
(moreover, a triple minimizes the right-hand side if and only if minimizes the left-hand side and ); - (e)
is convex with respect to , and is convex with respect to .
As a consequence, the conditional value-at-risk may be expressed in terms of the value-at-risk as follows:
When has a positive density in a neighborhood of , as it is customary to assume in financial applications, Equation (4) has a unique solution, i.e., . Thus, if one knows , he can apply Equation (5) to directly estimate the conditional value-at-risk instead of solving the stochastic program in Equation (4). Alternatively, by solving (4), one can deduce the value for .
The portfolio volatility will be defined as the standard deviation of the net profit distribution. Assuming the aggregate liability
Y to be nonnegative and independent of the gross returns of portfolio constituents
, this quantity may be evaluated as follows:
where
is the variance of the liabilities and Σ represents the covariance matrix of asset gross returns.
In the strategic asset allocation process, it is fundamental to identify a set of objectives that a portfolio has to achieve at the best, according to certain assumptions for the future dynamics of assets and liabilities. The
ex ante choice of the optimal portfolio is then related to the efficient frontier generated by a reward-risk analysis that concerns the tradeoff comparisons among the key performance indicators associated with the predetermined portfolio objectives [
8]. Accordingly, we consider the following performance measures. On the one hand, in order to point out the risk-adjusted reward of the portfolio, two reward-to-risk measures are implemented. The former is the expected gross return on the invested capital and is given by:
where
c represents shareholders’ invested capital. The latter is the ratio of the expected gross return to the risk-adjusted capital:
Finally, a reward-to-variability indicator, similar to the Sharpe ratio, is defined as:
Note that in the second and third ratio, the conditional value-at-risk is invested instead of general capital c.
2.3. Multi-Objective Portfolio Optimization Problems with Solvency Constraint
Since the Solvency II Directive requires a minimum capital to be held by EU-based insurance companies in order to guarantee a target level for the ruin probability over a specified period of time, we add to the set of linear constraints represented by Equation (2) the following chance constraint:
where
α represents the prespecified solvency level. A major difficulty in dealing with this type of constraint is that its evaluation may involve multidimensional integrals. Alternatively, we can express the solvency constraint in terms of expected value as:
with
denoting the indicator function, or, in terms of the value-at-risk (see [
43]), as:
However, these equivalent formulations may be non-convex, since, in general,
is non-convex with respect to
. In order to overcome this drawback, we follow the semi-parametric approach used, for instance, in [
5] and assume claim amounts to be modeled with a lognormal distribution. This condition is sufficient in most practical cases to guarantee the convexity of the solvency constraint (a more detailed treatment will be provided in the section where we describe the estimation methods).
Therefore, the set of efficient portfolios for an EU-based insurance company may be represented by:
and results in being convex and compact.
Due to the fact that different subjects act in the identification of an optimal insurance portfolio, we model this decision process from a multi-objective point of view. In this manner, it is possible to extend the standard risk-reward analysis from the study of tradeoff curves to the study of multi-dimensional tradeoff surfaces [
44]. Three portfolio selection problems are introduced in order to integrate at different levels both financial and insurance criteria.
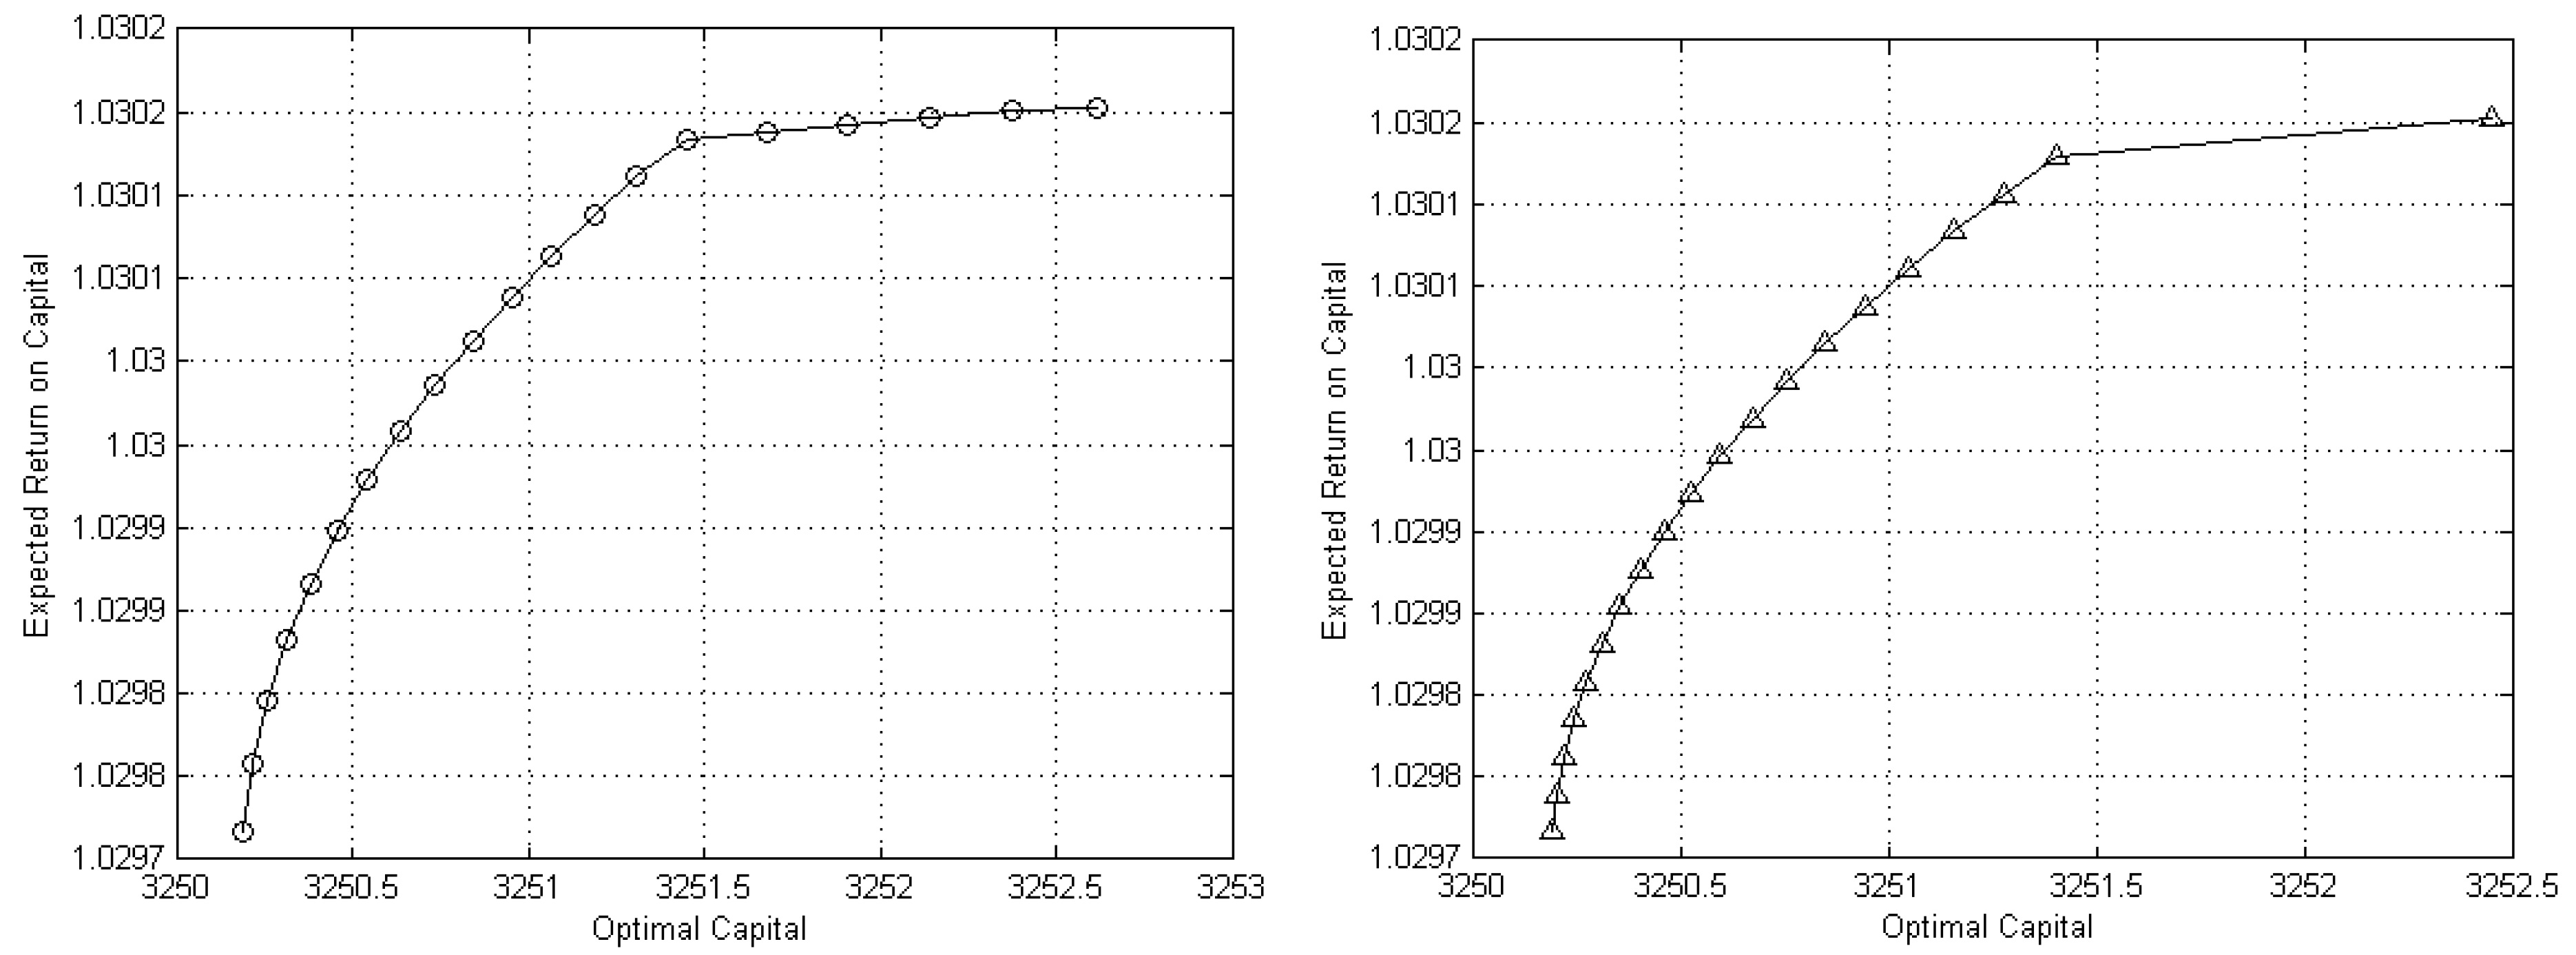
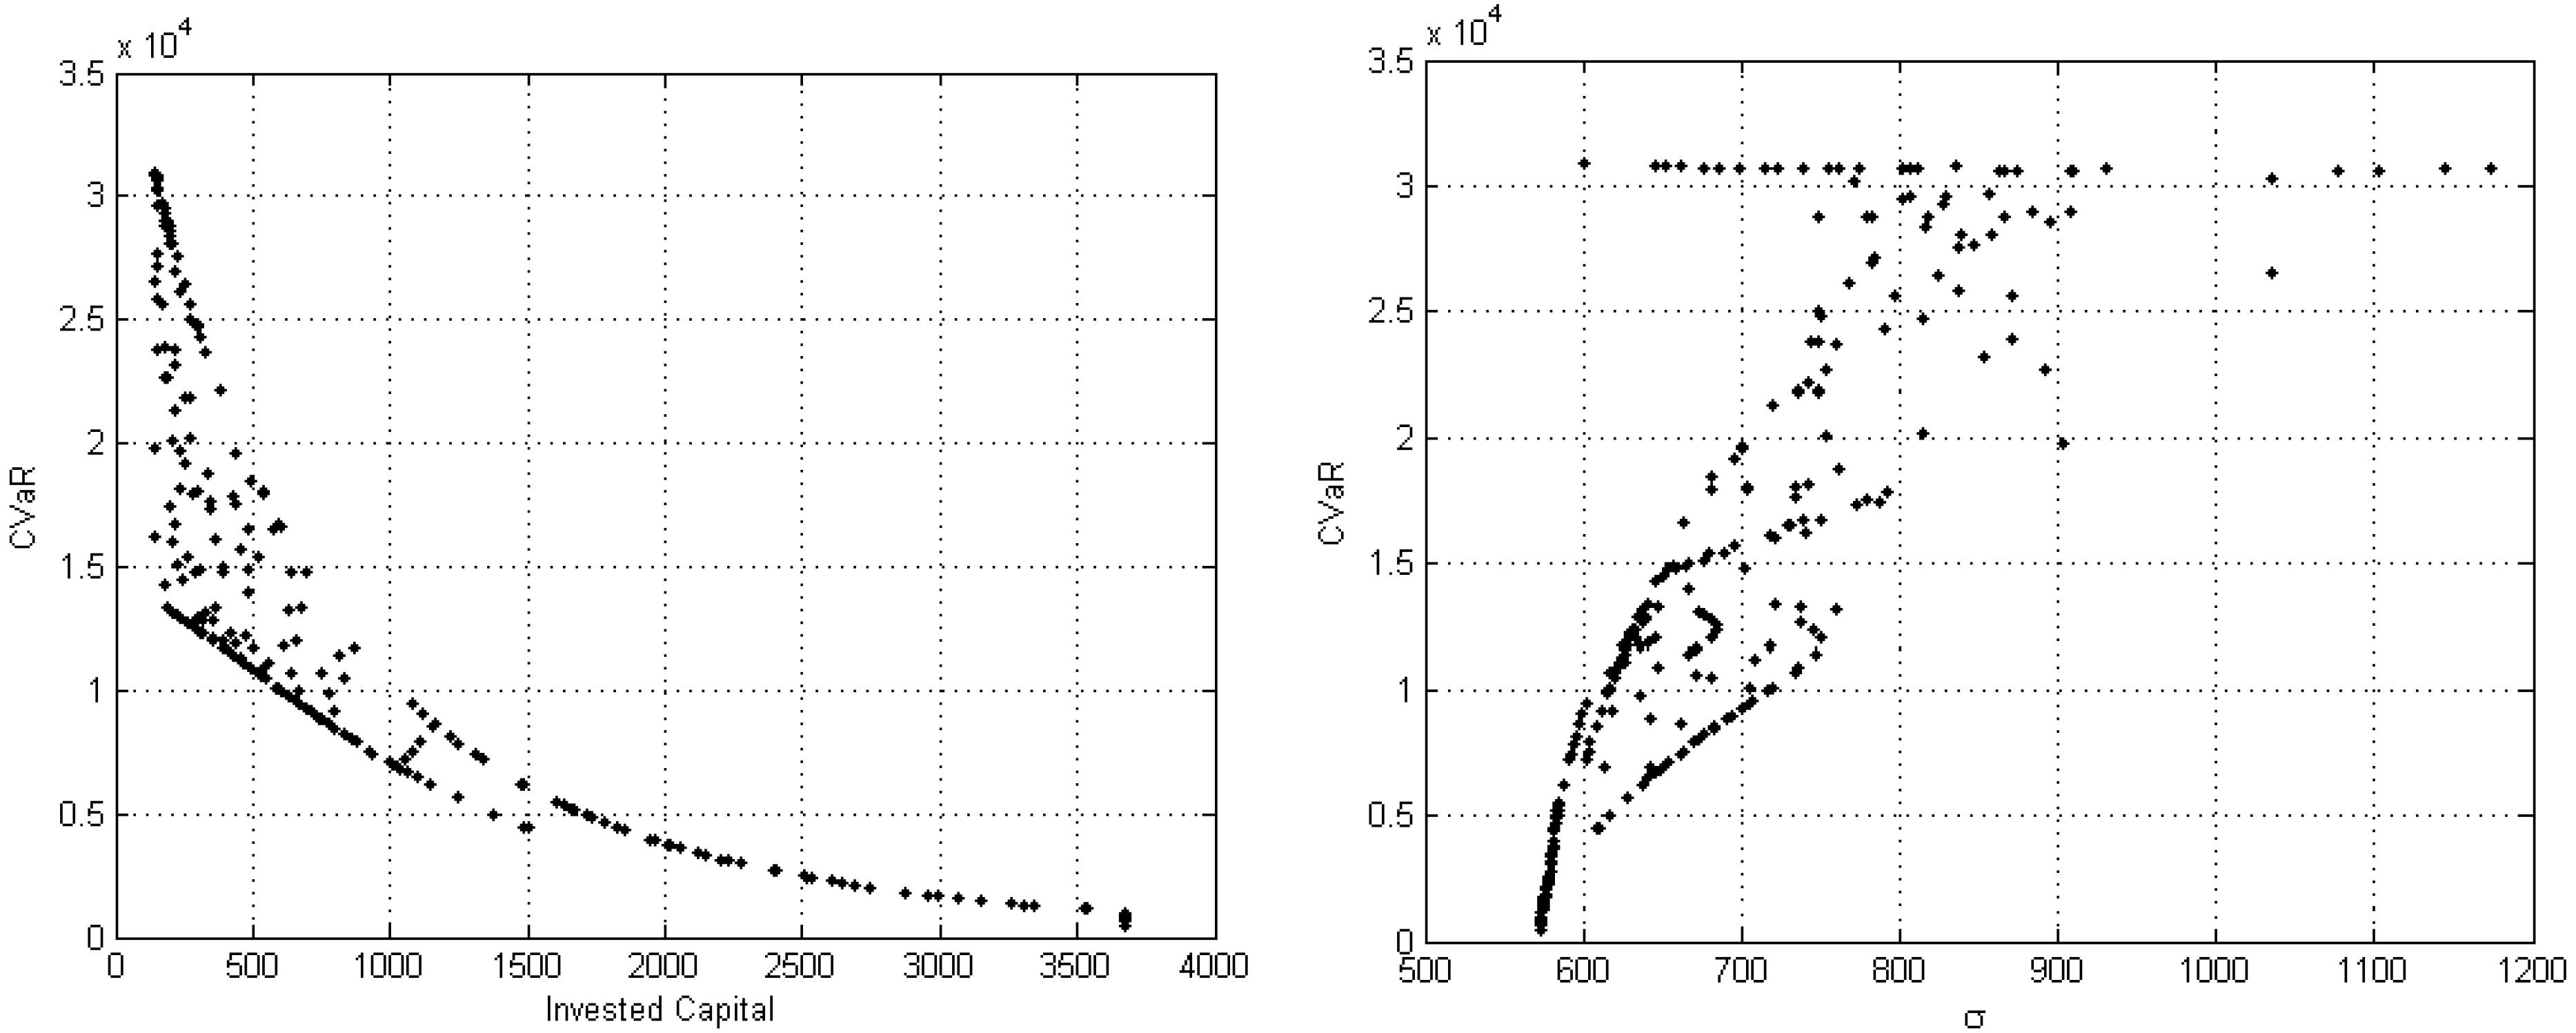
The first portfolio is bi-objective in nature and takes into account the shareholders’ expectations of obtaining a satisfactory rate of return on the provided capital. The objectives may be stated as follows:
In this case, a stockholder tries to maximize profits and minimize the invested capital. The problem is equivalent to the one in [
5], but a multi-objective approach is here adopted instead of an
ϵ-constraint scheme. In the Experimental Section, we will investigate the benefits of this choice.
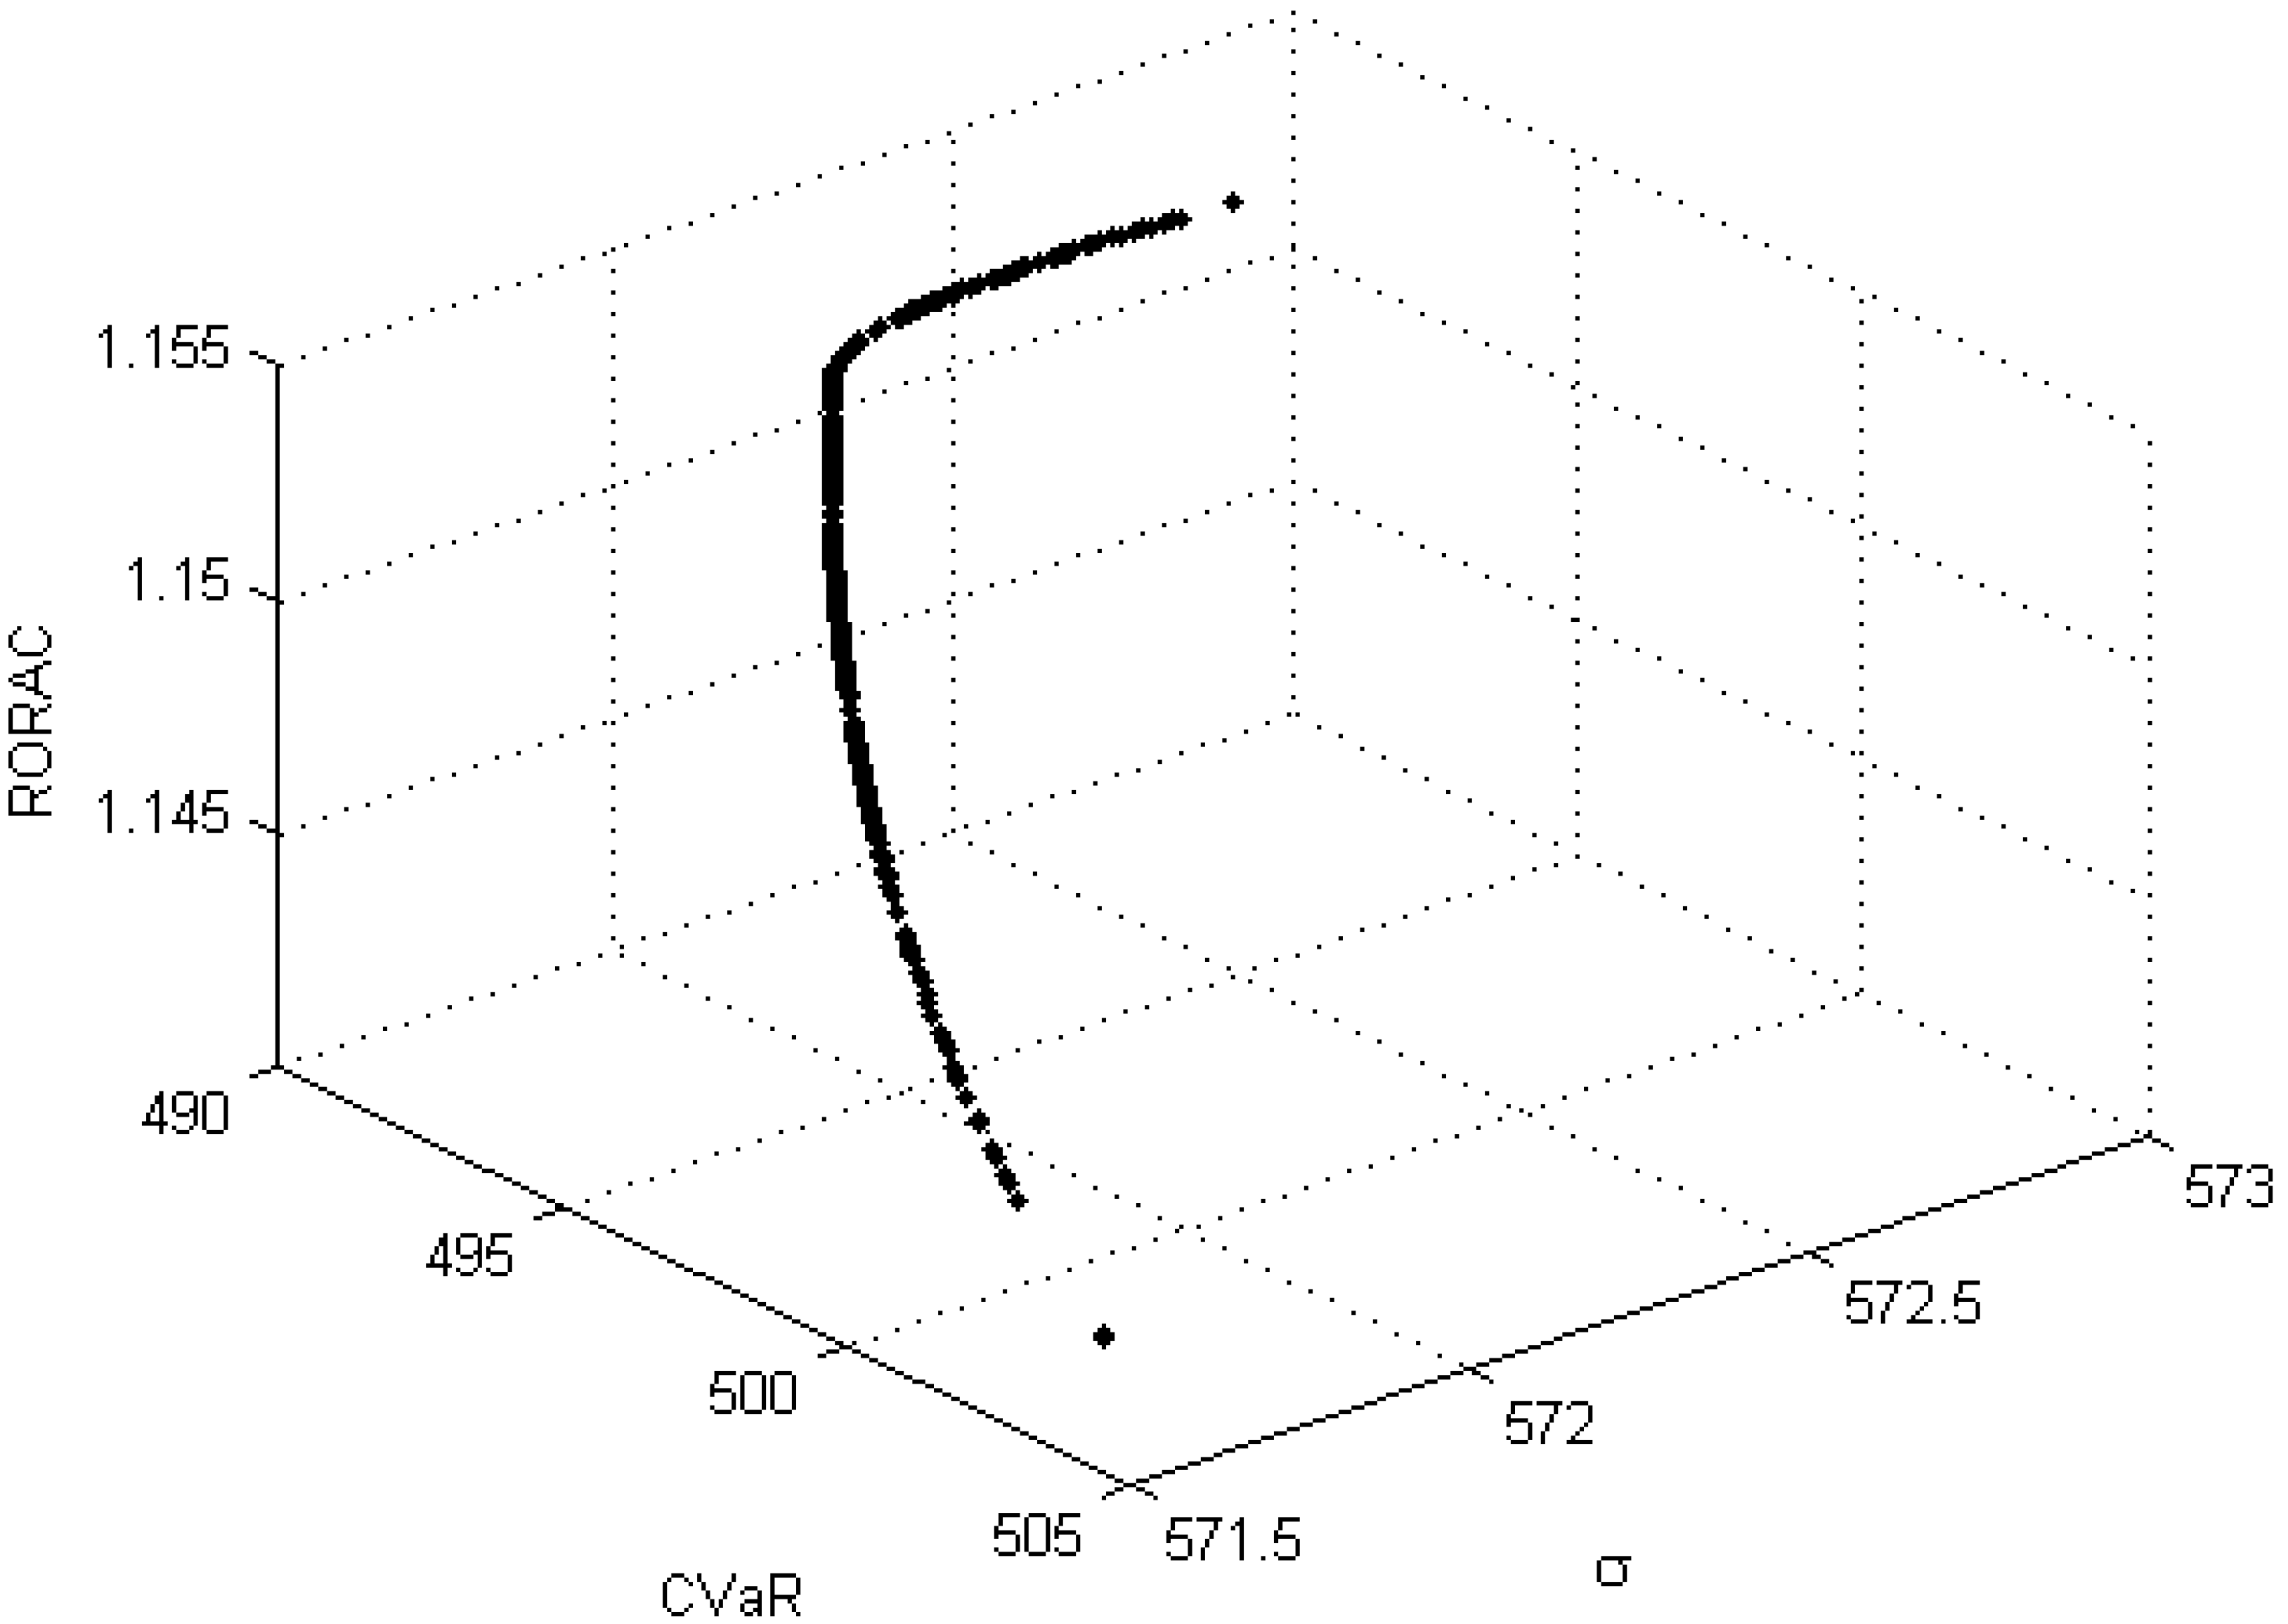
The second portfolio selection model represents the case of an insurance company that could be characterized as using the
concept and two risk measures (conditional value-at-risk at the confidence level
α and portfolio volatility). On the basis of Proposition (1), the resulting tri-objective optimization problem may be formulated as follows:
where the feasible set has been modified as:
once the relation between value-at-risk and conditional value-at-risk is exploited (see Equations (4) and (5)).
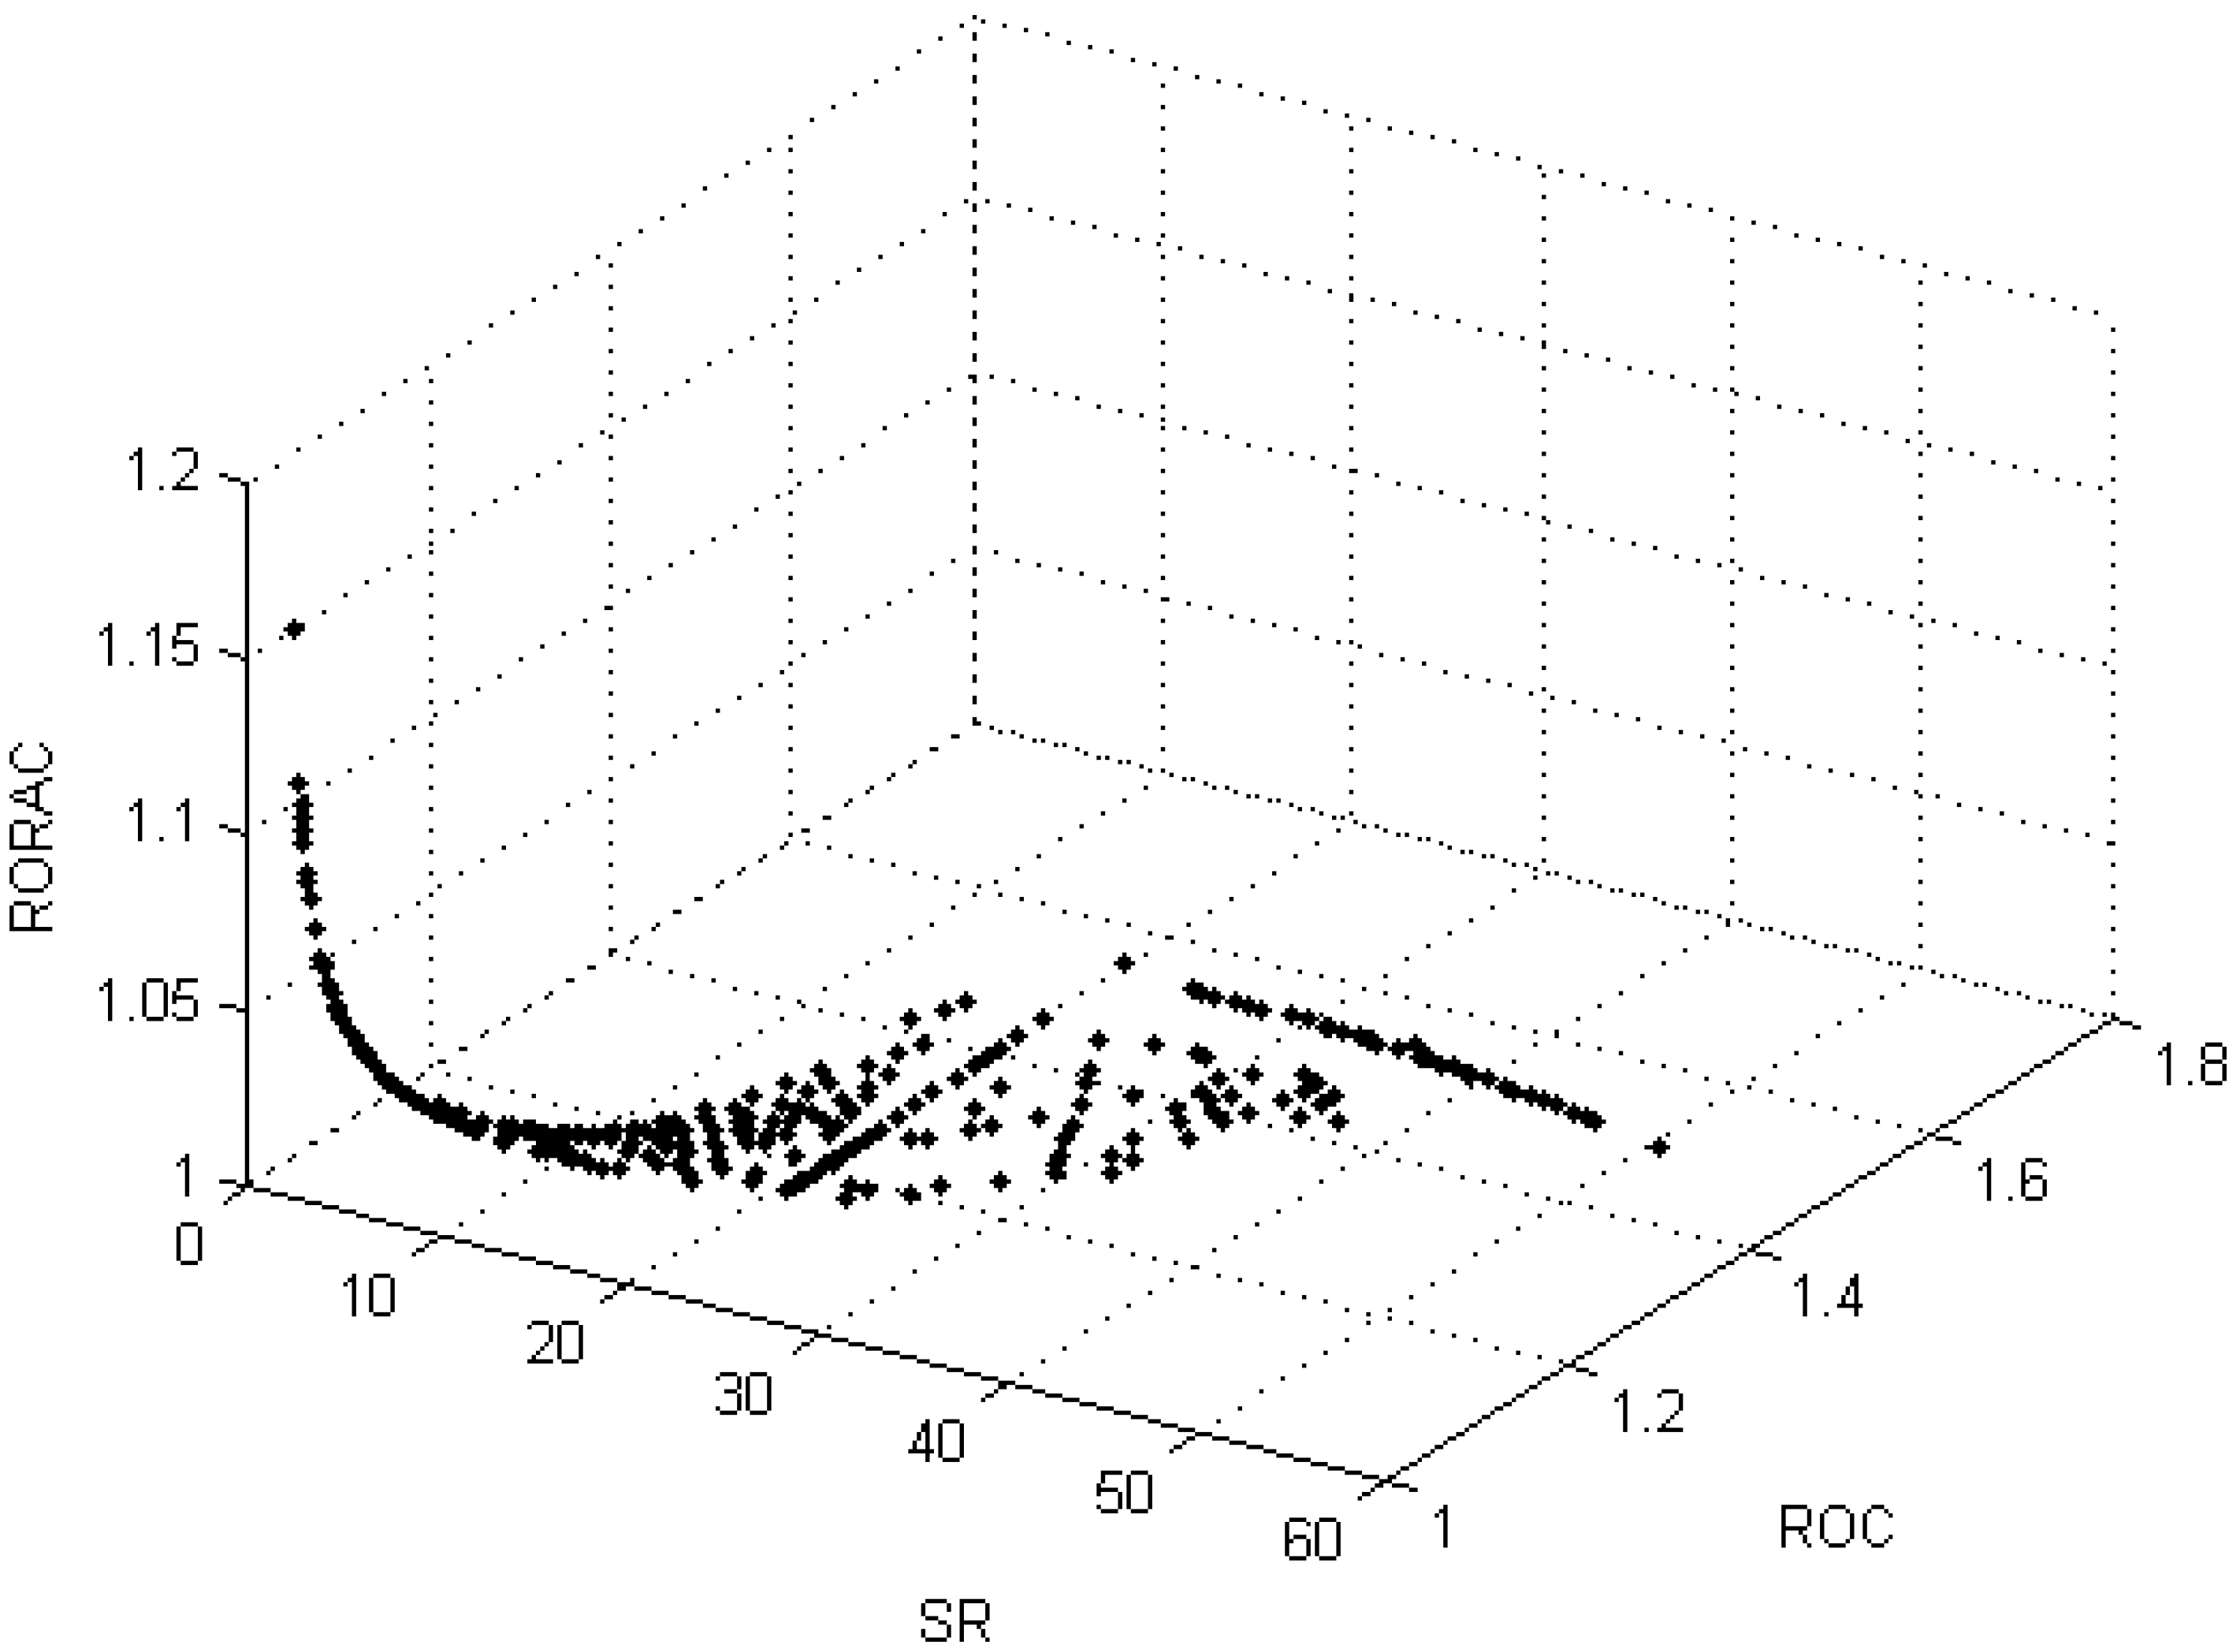
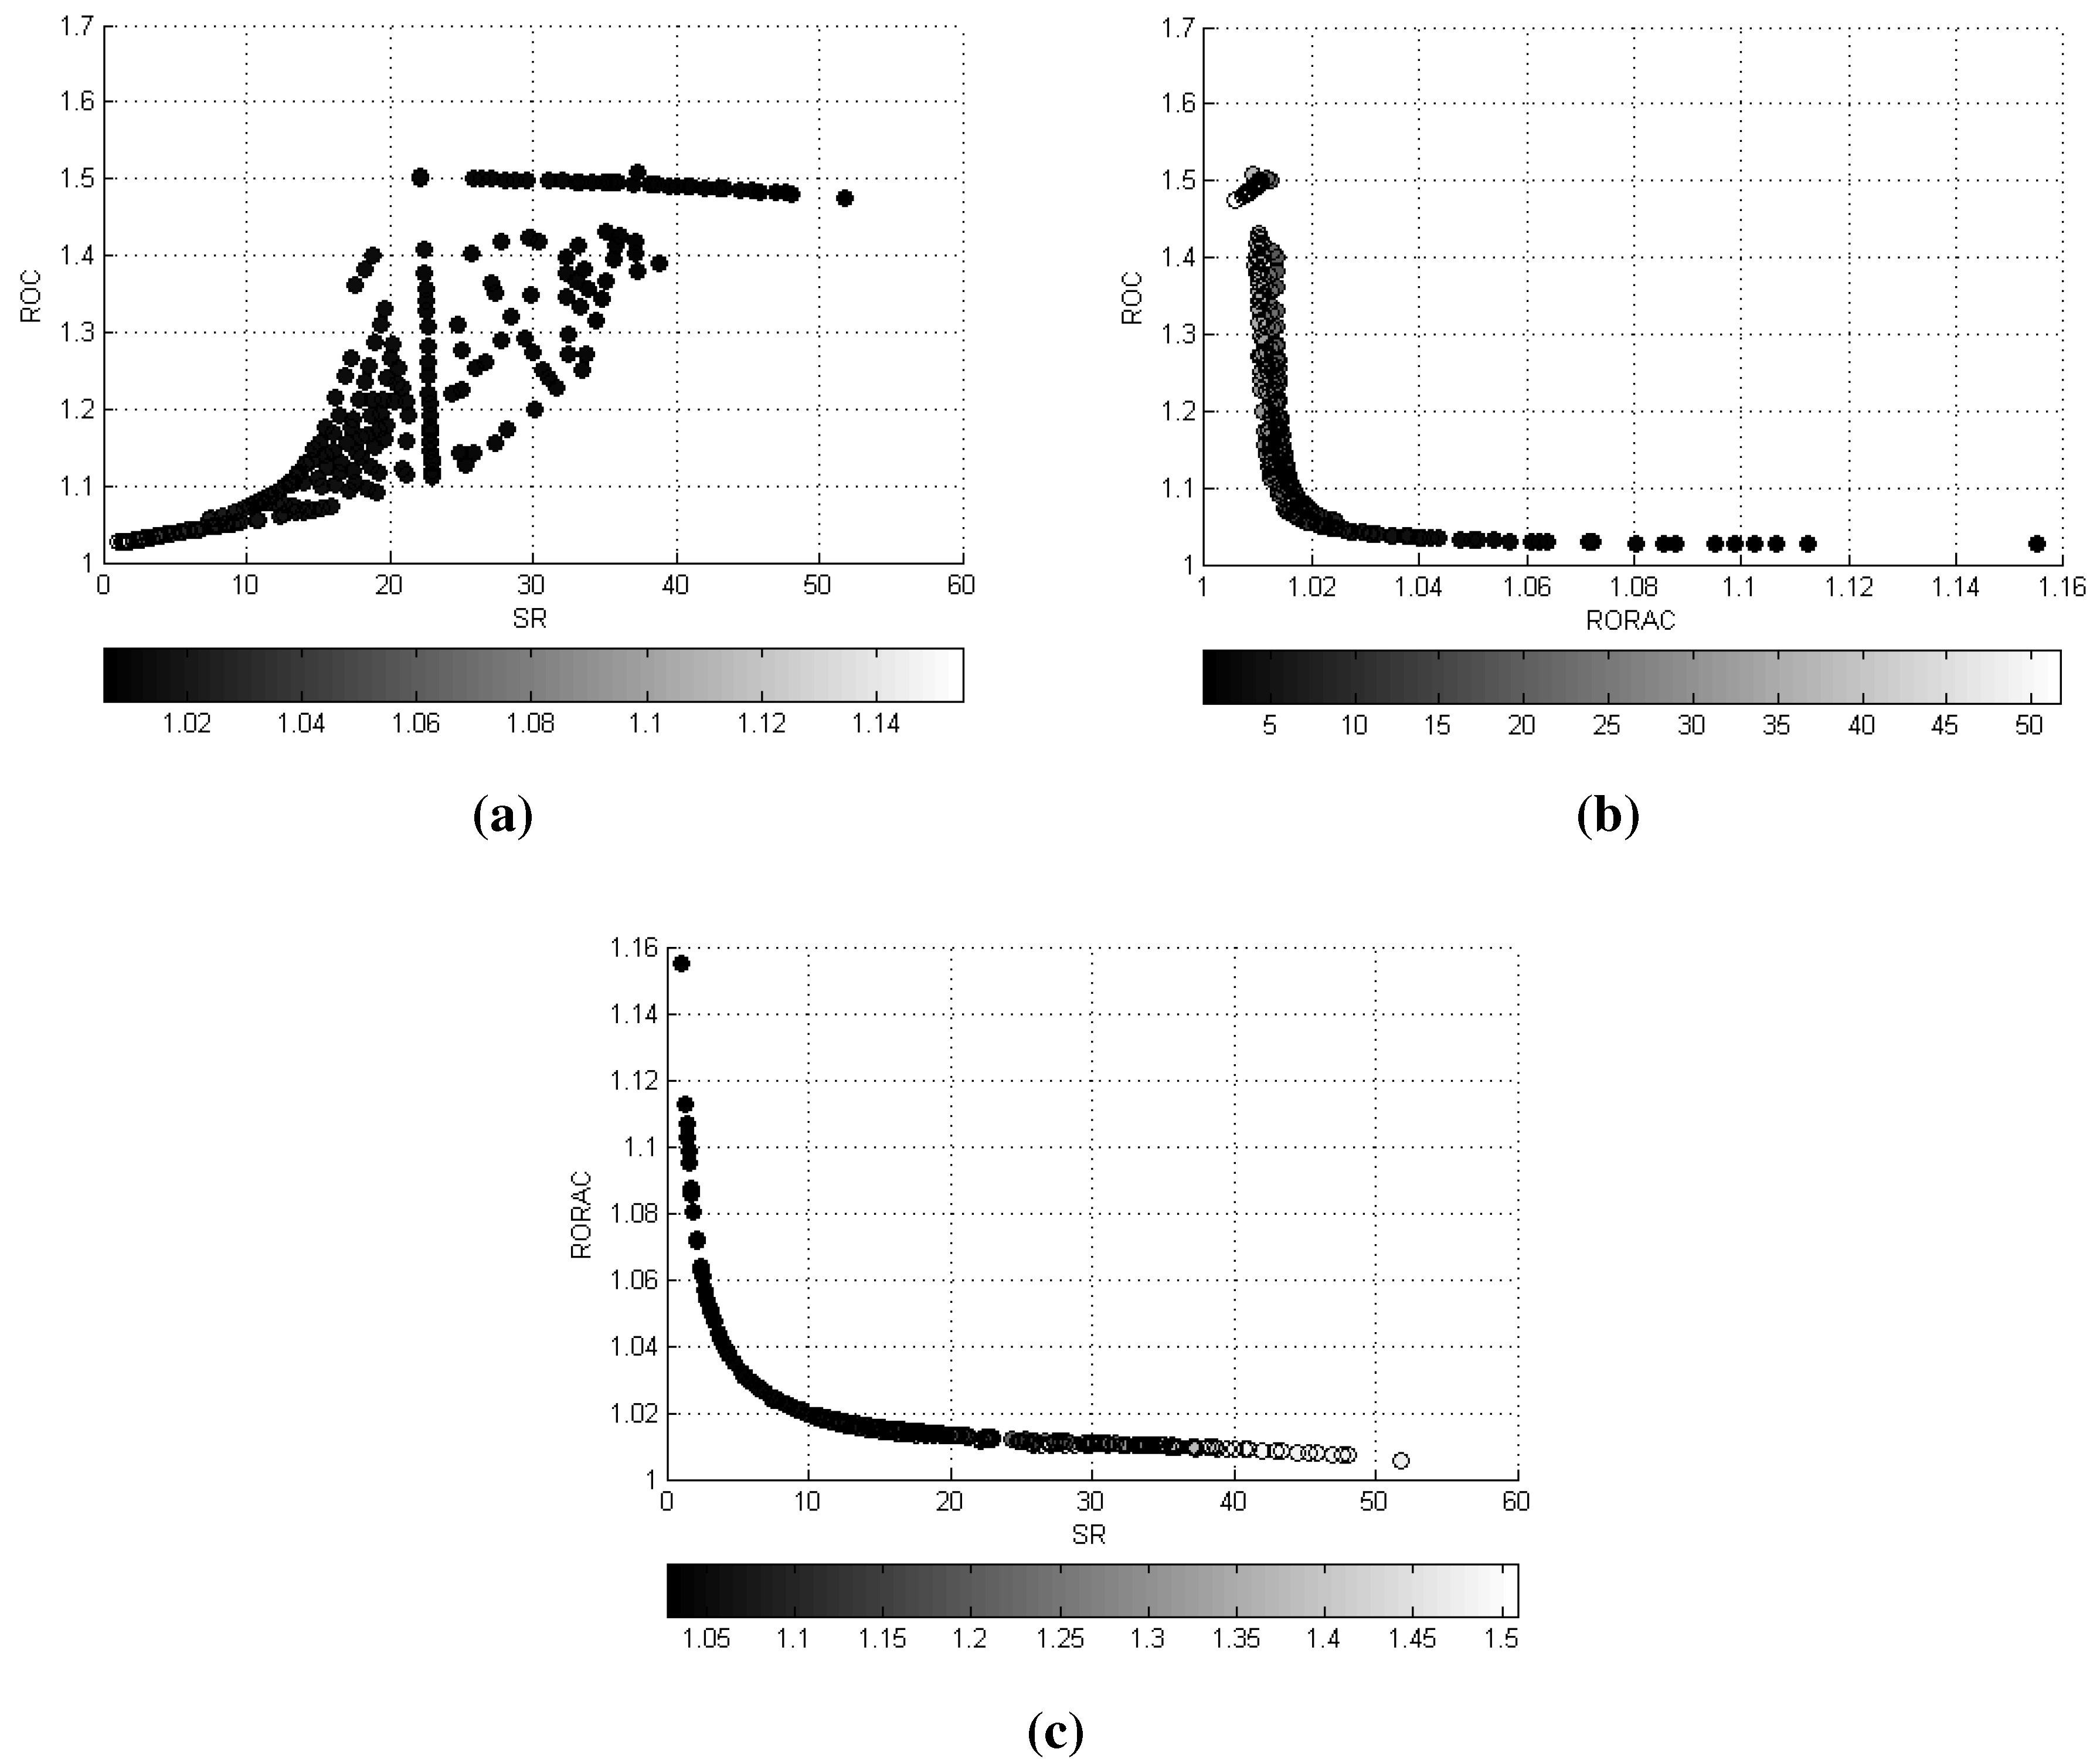
The third selection strategy identifies as optimal those portfolios that simultaneously maximize the performance indicator Equations (7–9) and can be written as:
According to this version of the portfolio selection problem, a sensitivity analysis may be conducted, linking company-level interests, represented by , with both stockholders and actuarial goals, characterized by and , respectively.
6. Summary and Conclusions
In this paper, we propose an alternative approach to tackle multi-objective portfolio optimization problems with chance constraints. The procedure involves semi-parametric techniques to generate scenarios and implements an alternative version of the normalized normal constraint method in order to provide an even dotted approximation of the Pareto front. High accuracy in solutions is achieved by integrating a global optimizer.
We apply this optimization framework in the portfolio selection process of an EU-based non-life insurance company that, on the one hand, aims at jointly solving for shareholders’ capital and investment weights and, on the other hand, seeks to minimize the risk of mismatch between assets and liabilities under the Solvency II Directive.
Three instances of the problem are experimentally investigated. In the first case, the shareholders’ expectations of obtaining a satisfactory rate of return on the provided capital are represented through a bi-objective optimization program. The comparison of the results with those obtained by the ϵ-constraint method confirms the superior ability of the proposed method to guarantee high quality approximations of the complete risk-reward profile.
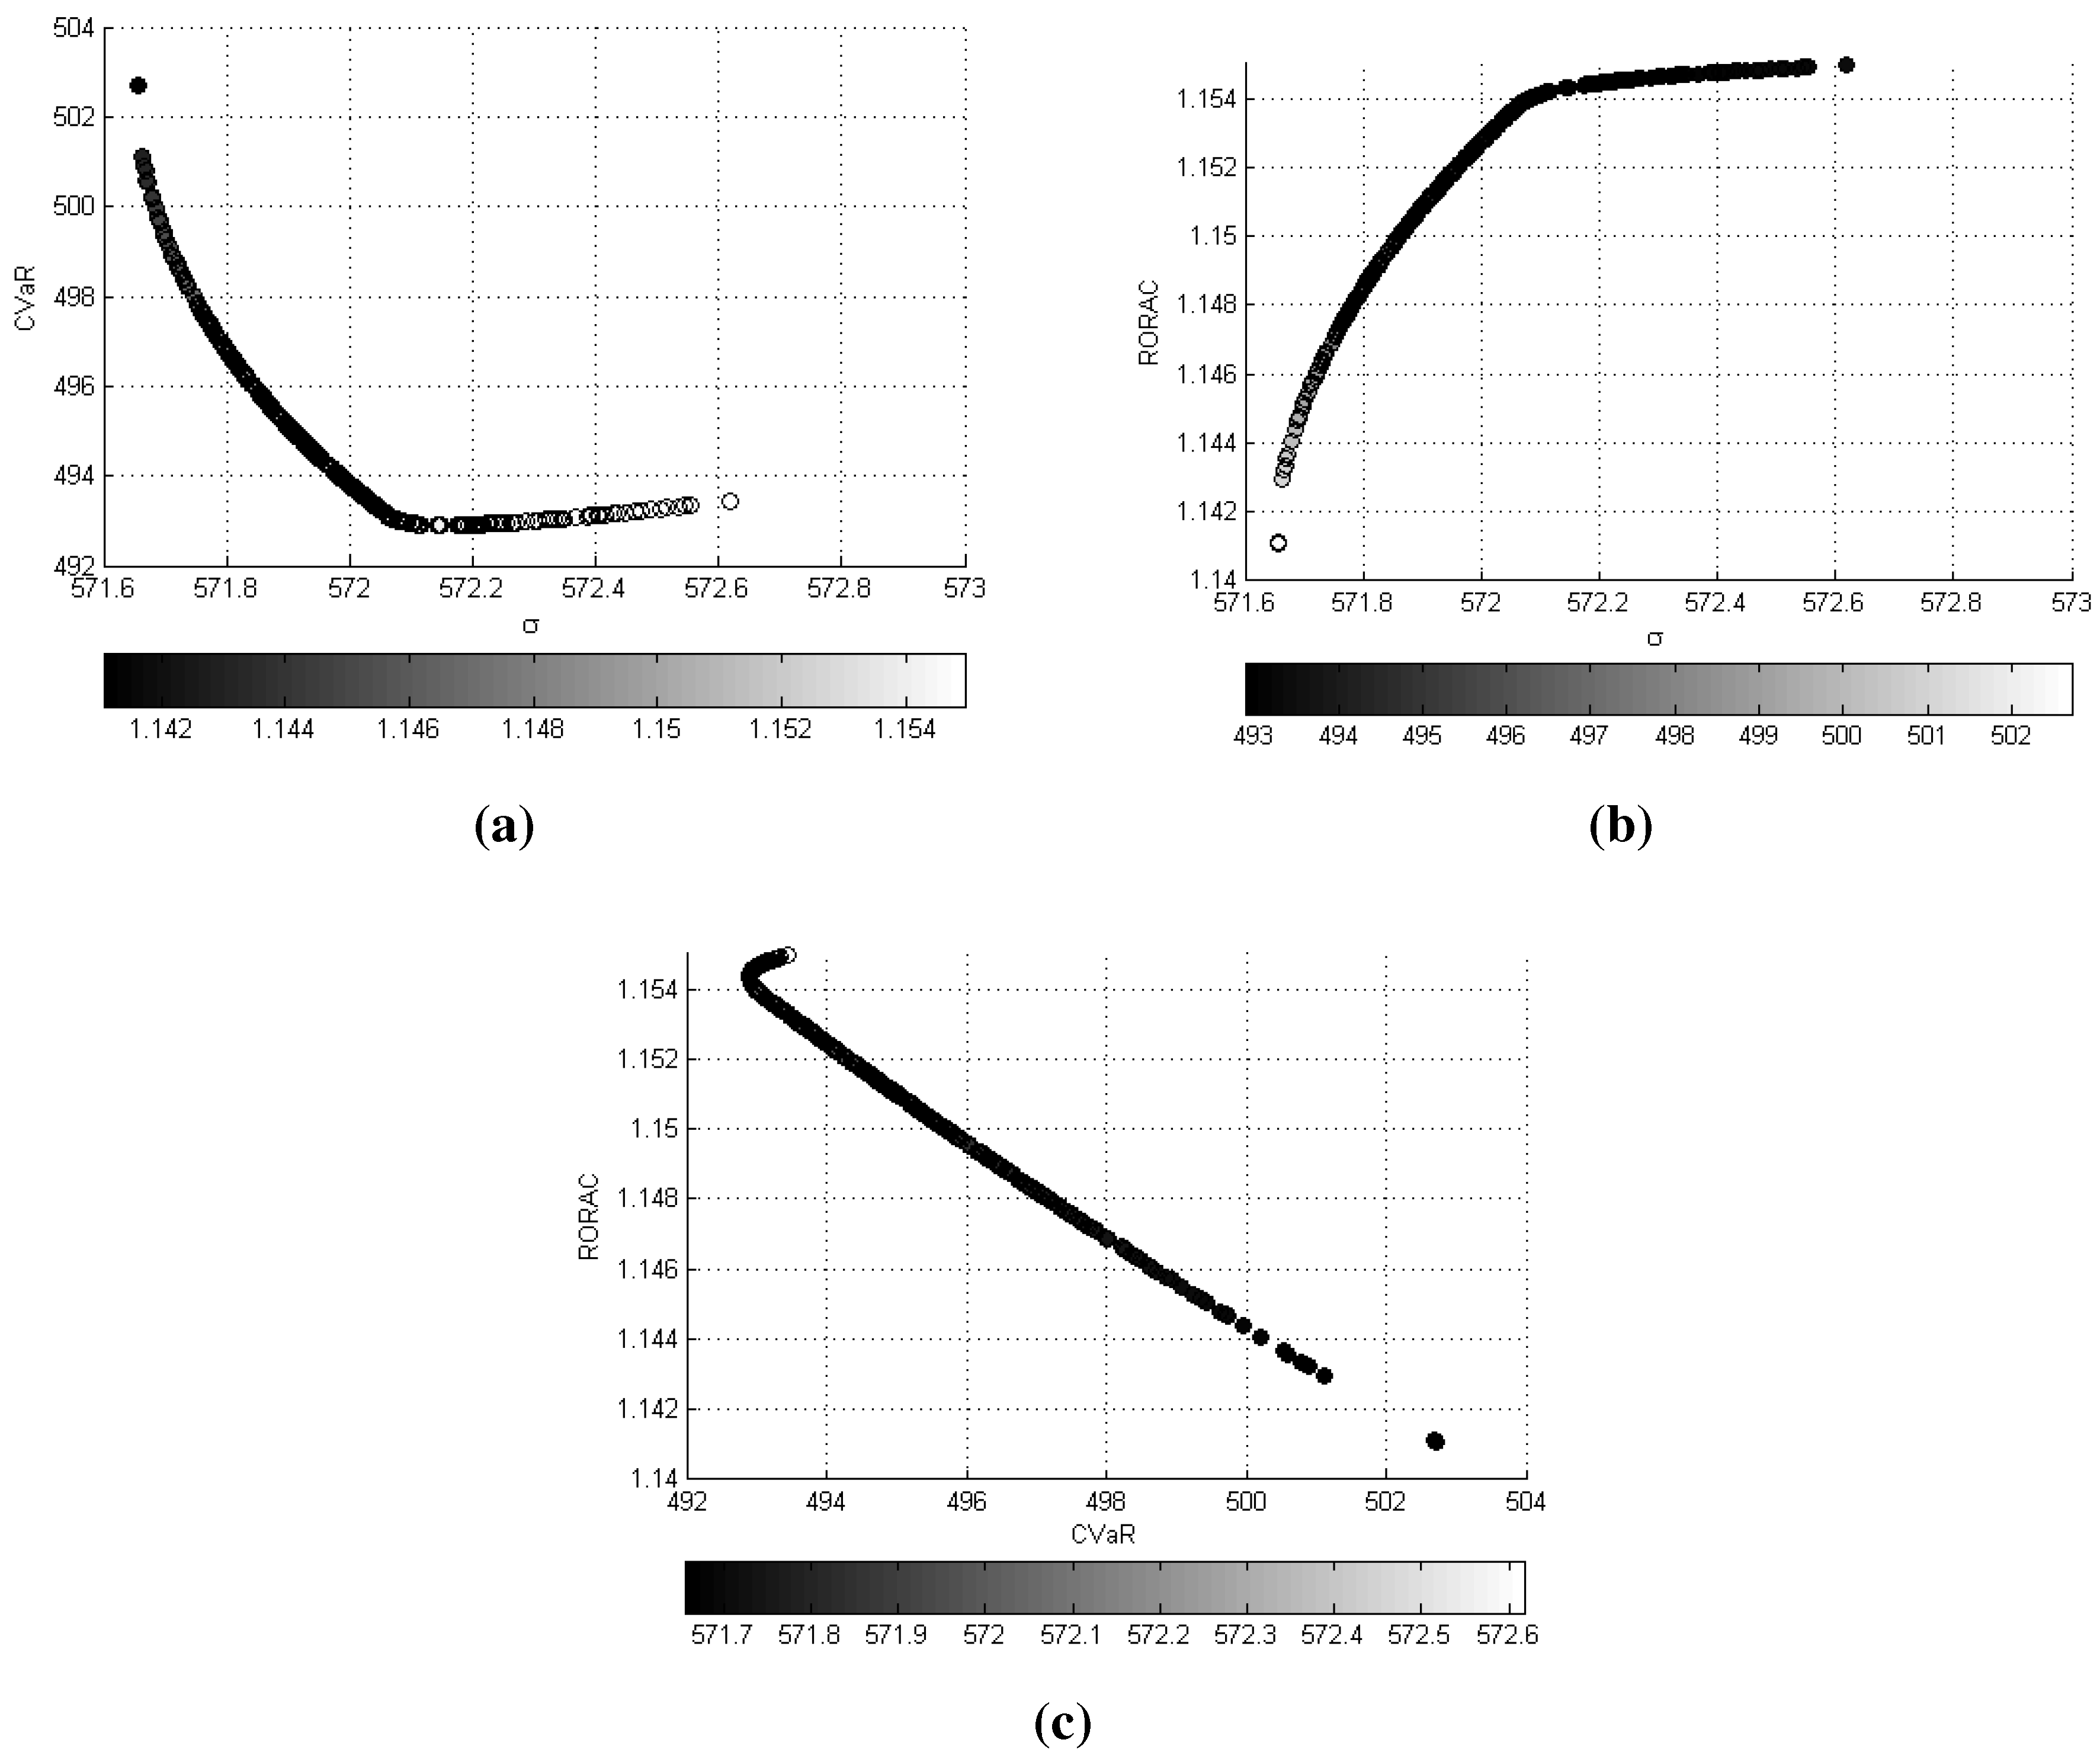
The second portfolio strategy extends the analysis by including two risk measures in the optimization process; the insurance company is now characterized by the concept with the conditional value-at risk and the portfolio volatility. The Pareto front results in being a curve in the σ-- space. The objective tradeoff analysis is conducted by exploiting the bi-dimensional projections of this curve on the σ-, σ- and - planes. From the empirical study, the fundamental contribution of the knowledge of the link between risks in order to guide the decision-maker in the selection identification of an optimal portfolio emerges.
The third experiment takes into account the performance measures , and Sharpe ratio . The solutions set results in being a surface in the -- space. The tradeoff analysis in this case is based on the bi-dimensional projections and on the correlation matrix of the objectives. Considerations of the behavior of in relation to the optimal invested capital and to the portfolio volatility are also derived.
The combination of mathematical programming methods and multiple criteria techniques has been proven to be very successful in portfolio optimization problems, also providing a useful tool to represent the relations among different risk measures, as well as performance indicators. In future work, we plan to proceed in analyzing other types of criteria and investments, possibly including more than three objectives.


