Article

Comparing the Effectiveness of Machine Learning and Deep Learning Models in Student Credit Scoring: A Case Study in Vietnam

1
Faculty of Accounting and Auditing, VNU University of Economics and Business, Hanoi 100000, Vietnam
2
Faculty of Development Economics, VNU University of Economics and Business, Hanoi 100000, Vietnam
3
Hanoi Institute for Socio-Economic Development Studies, Hanoi 100000, Vietnam
*
Author to whom correspondence should be addressed.
Risks 2025, 13(5), 99; https://doi.org/10.3390/risks13050099
Submission received: 28 March 2025 / Revised: 7 May 2025 / Accepted: 12 May 2025 / Published: 20 May 2025

Abstract

:
In emerging markets like Vietnam, where student borrowers often lack traditional credit histories, accurately predicting loan eligibility remains a critical yet underexplored challenge. While machine learning and deep learning techniques have shown promise in credit scoring, their comparative performance in the context of student loans has not been thoroughly investigated. This study aims to evaluate and compare the predictive effectiveness of four supervised learning models—such as Random Forest, Gradient Boosting, Support Vector Machine, and Deep Neural Network (implemented with PyTorch version 2.6.0)—in forecasting student credit eligibility. Primary data were collected from 1024 university students through structured surveys covering academic, financial, and personal variables. The models were trained and tested on the same dataset and evaluated using a comprehensive set of classification and regression metrics. The findings reveal that each model exhibits distinct strengths. Deep Learning achieved the highest classification accuracy (85.55%), while random forest demonstrated robust performance, particularly in providing balanced results across classification metrics. Gradient Boosting was effective in recall-oriented tasks, and support vector machine demonstrated strong precision for the positive class, although its recall was lower compared to other models. The study highlights the importance of aligning model selection with specific application goals, such as prioritizing accuracy, recall, or interpretability. It offers practical implications for financial institutions and universities in developing machine learning and deep learning tools for student loan eligibility prediction. Future research should consider longitudinal data, behavioral factors, and hybrid modeling approaches to further optimize predictive performance in educational finance.

1. Introduction

In an era of constant global economic fluctuations, access to financial resources has become a crucial factor for the sustainable development of individuals and communities. For students who must cover tuition fees and living expenses, securing loans from financial institutions is essential (Organisation for Economic Co-operation and Development 2025). As a result, accurately predicting students’ loan eligibility is a critical step in helping lenders mitigate credit risk while ensuring that students can access funding in a stable and efficient manner. However, traditional credit evaluation methods often struggle to handle large, complex datasets that contain nonlinear relationships (Mestiri 2024).
The rapid advancement of Artificial Intelligence (AI), particularly Machine Learning (ML) and Deep Learning (DL) techniques, has opened up new prospects for credit risk management. Numerous studies have demonstrated that ML-based models outperform traditional statistical methods in predicting loan defaults (Abbas and Hussein 2024; Golbayani et al. 2020; Schmitt 2022). Algorithms such as Linear Discriminant Analysis, Random Forest, Logistic Regression, Decision Tree, Support Vector Machine, and Deep Neural Networks have been widely applied, yielding promising results in credit scoring and risk assessment (Sayed et al. 2024).
The application of ML and DL techniques in credit scoring has shown promising results in recent years. However, the majority of existing studies have focused on traditional borrowers with well-established credit histories, while the prediction of loan eligibility for students remains largely underexplored. This lack of attention to student-specific financial behavior and credit profiles has resulted in a shortage of tailored models that accurately predict the loan eligibility of this demographic. Although studies from Shukla et al. (2023) and Wang et al. (2015) evaluated the performance of ML and DL algorithms in general credit scoring, comprehensive comparative research focusing specifically on student borrowers is still limited.
Consequently, the unique financial patterns, limited credit histories, and alternative risk factors associated with student borrowers remain underexplored. Additionally, the scarcity of student-specific datasets restricts the applicability of existing findings to educational loan contexts (Wang et al. 2015). Without datasets that reflect student income sources, repayment behavior, and academic performance, the predictive power of these models for predicting student loan eligibility remains questionable.
Another underexplored aspect in previous research is the lack of a comprehensive comparative analysis between ML and DL approaches in student credit scoring applications. Rather than offering broad benchmarking across multiple algorithms, many studies have focused narrowly on a limited subset of classifiers (Shukla et al. 2023), thereby hindering a deeper understanding of their relative strengths and weaknesses, especially in the context of student credit risk. Furthermore, few studies have addressed the trade-offs between model accuracy, interpretability, and computational efficiency, which are crucial factors for financial institutions when adopting ML and DL credit scoring models.
This study aims to compare the effectiveness of ML and DL models in predicting student loan eligibility. Specifically, we evaluate and compare the performance of traditional ML models (e.g., Logistic Regression, Decision Trees, and Random Forest) and DL models (e.g., Deep Neural Networks) based on key performance metrics such as accuracy, precision, recall, and F1-score. Additionally, we analyze the advantages and limitations of each approach to determine their practical applicability in student credit scoring systems. By addressing these research gaps, this study seeks to provide a comprehensive evaluation of ML and DL methodologies in student loan eligibility prediction, with a particular focus on the case of Vietnam.
Vietnam represents a typical case of a developing economy in the credit scoring landscape, where the adoption of ML and algorithmic credit scoring is accelerating but remains constrained by regulatory and operational challenges. Local banks are increasingly applying ML models such as Logistic Regression and Random Forest to improve credit risk management using both financial and non-financial data (Van Trung and Vuong 2024). However, the lack of a comprehensive legal framework raises concerns over fairness, transparency, and data privacy (Lainez and Gardner 2023). Like many emerging markets, Vietnam faces data limitations, including imbalance and bias, which undermine the reliability of credit assessments (Fejza et al. 2022). The absence of a unified national credit database further exacerbates these issues (T. Le 2017). Despite these challenges, Vietnam offers a promising testing ground for innovative approaches in credit scoring, with the potential to inform similar initiatives in other developing countries.
By exploring the intersection between ML and DL techniques in credit risk assessment and student loan repayment prediction, this study contributes to the expanding body of literature on data-driven credit scoring models. The results are expected to provide practical guidance for financial institutions, policymakers, and student loan providers in optimizing credit risk models while promoting fair, transparent, and inclusive access to financial support for students. This study not only enriches the literature on ML and DL credit scoring but also provides concrete implications for designing effective and equitable loan eligibility prediction in emerging economies such as Vietnam.

2. Literature Review

2.1. Conceptual Framework of Credit Scoring and Student Loan Repayment

Credit scoring is a systematic approach employed by lenders to assess the creditworthiness of potential borrowers, including students applying for educational loans. This process involves analyzing a range of data points to estimate the likelihood of loan repayment, an increasingly critical issue amid the growing volume of student loan debt and rising default rates in countries such as the United States (Lochner and Monge-Naranjo 2016). A thorough understanding of credit scoring and its implications for student loan repayment is essential for both borrowers and lending institutions. Credit scoring typically leverages algorithmic models to evaluate an individual’s credit risk based on historical financial data, including payment history, debt-to-income ratios, and outstanding obligations (Kiviat 2019). These models help lenders determine loan eligibility, interest rates, and repayment conditions, thereby shaping the overall structure of the lending landscape (Malik and Hermawan 2018).
Students as borrowers often encounter significant challenges in loan repayment due to escalating tuition fees and an uncertain job market, both of which contribute to elevated default rates (Lochner and Monge-Naranjo 2016). Effective credit scoring mechanisms can assist in designing loan products that balance access to education with realistic and manageable repayment terms, thereby reducing the risk of default (Luo et al. 2018). However, while credit scoring offers a structured and data-driven method for assessing borrower risk, it may inadvertently perpetuate inequality. Luo et al. (2018) stated that individuals from disadvantaged socioeconomic backgrounds often face systemic barriers to obtaining loans, regardless of their true repayment potential. This underscores the need for more inclusive and equitable lending practices that go beyond traditional credit evaluation metrics.

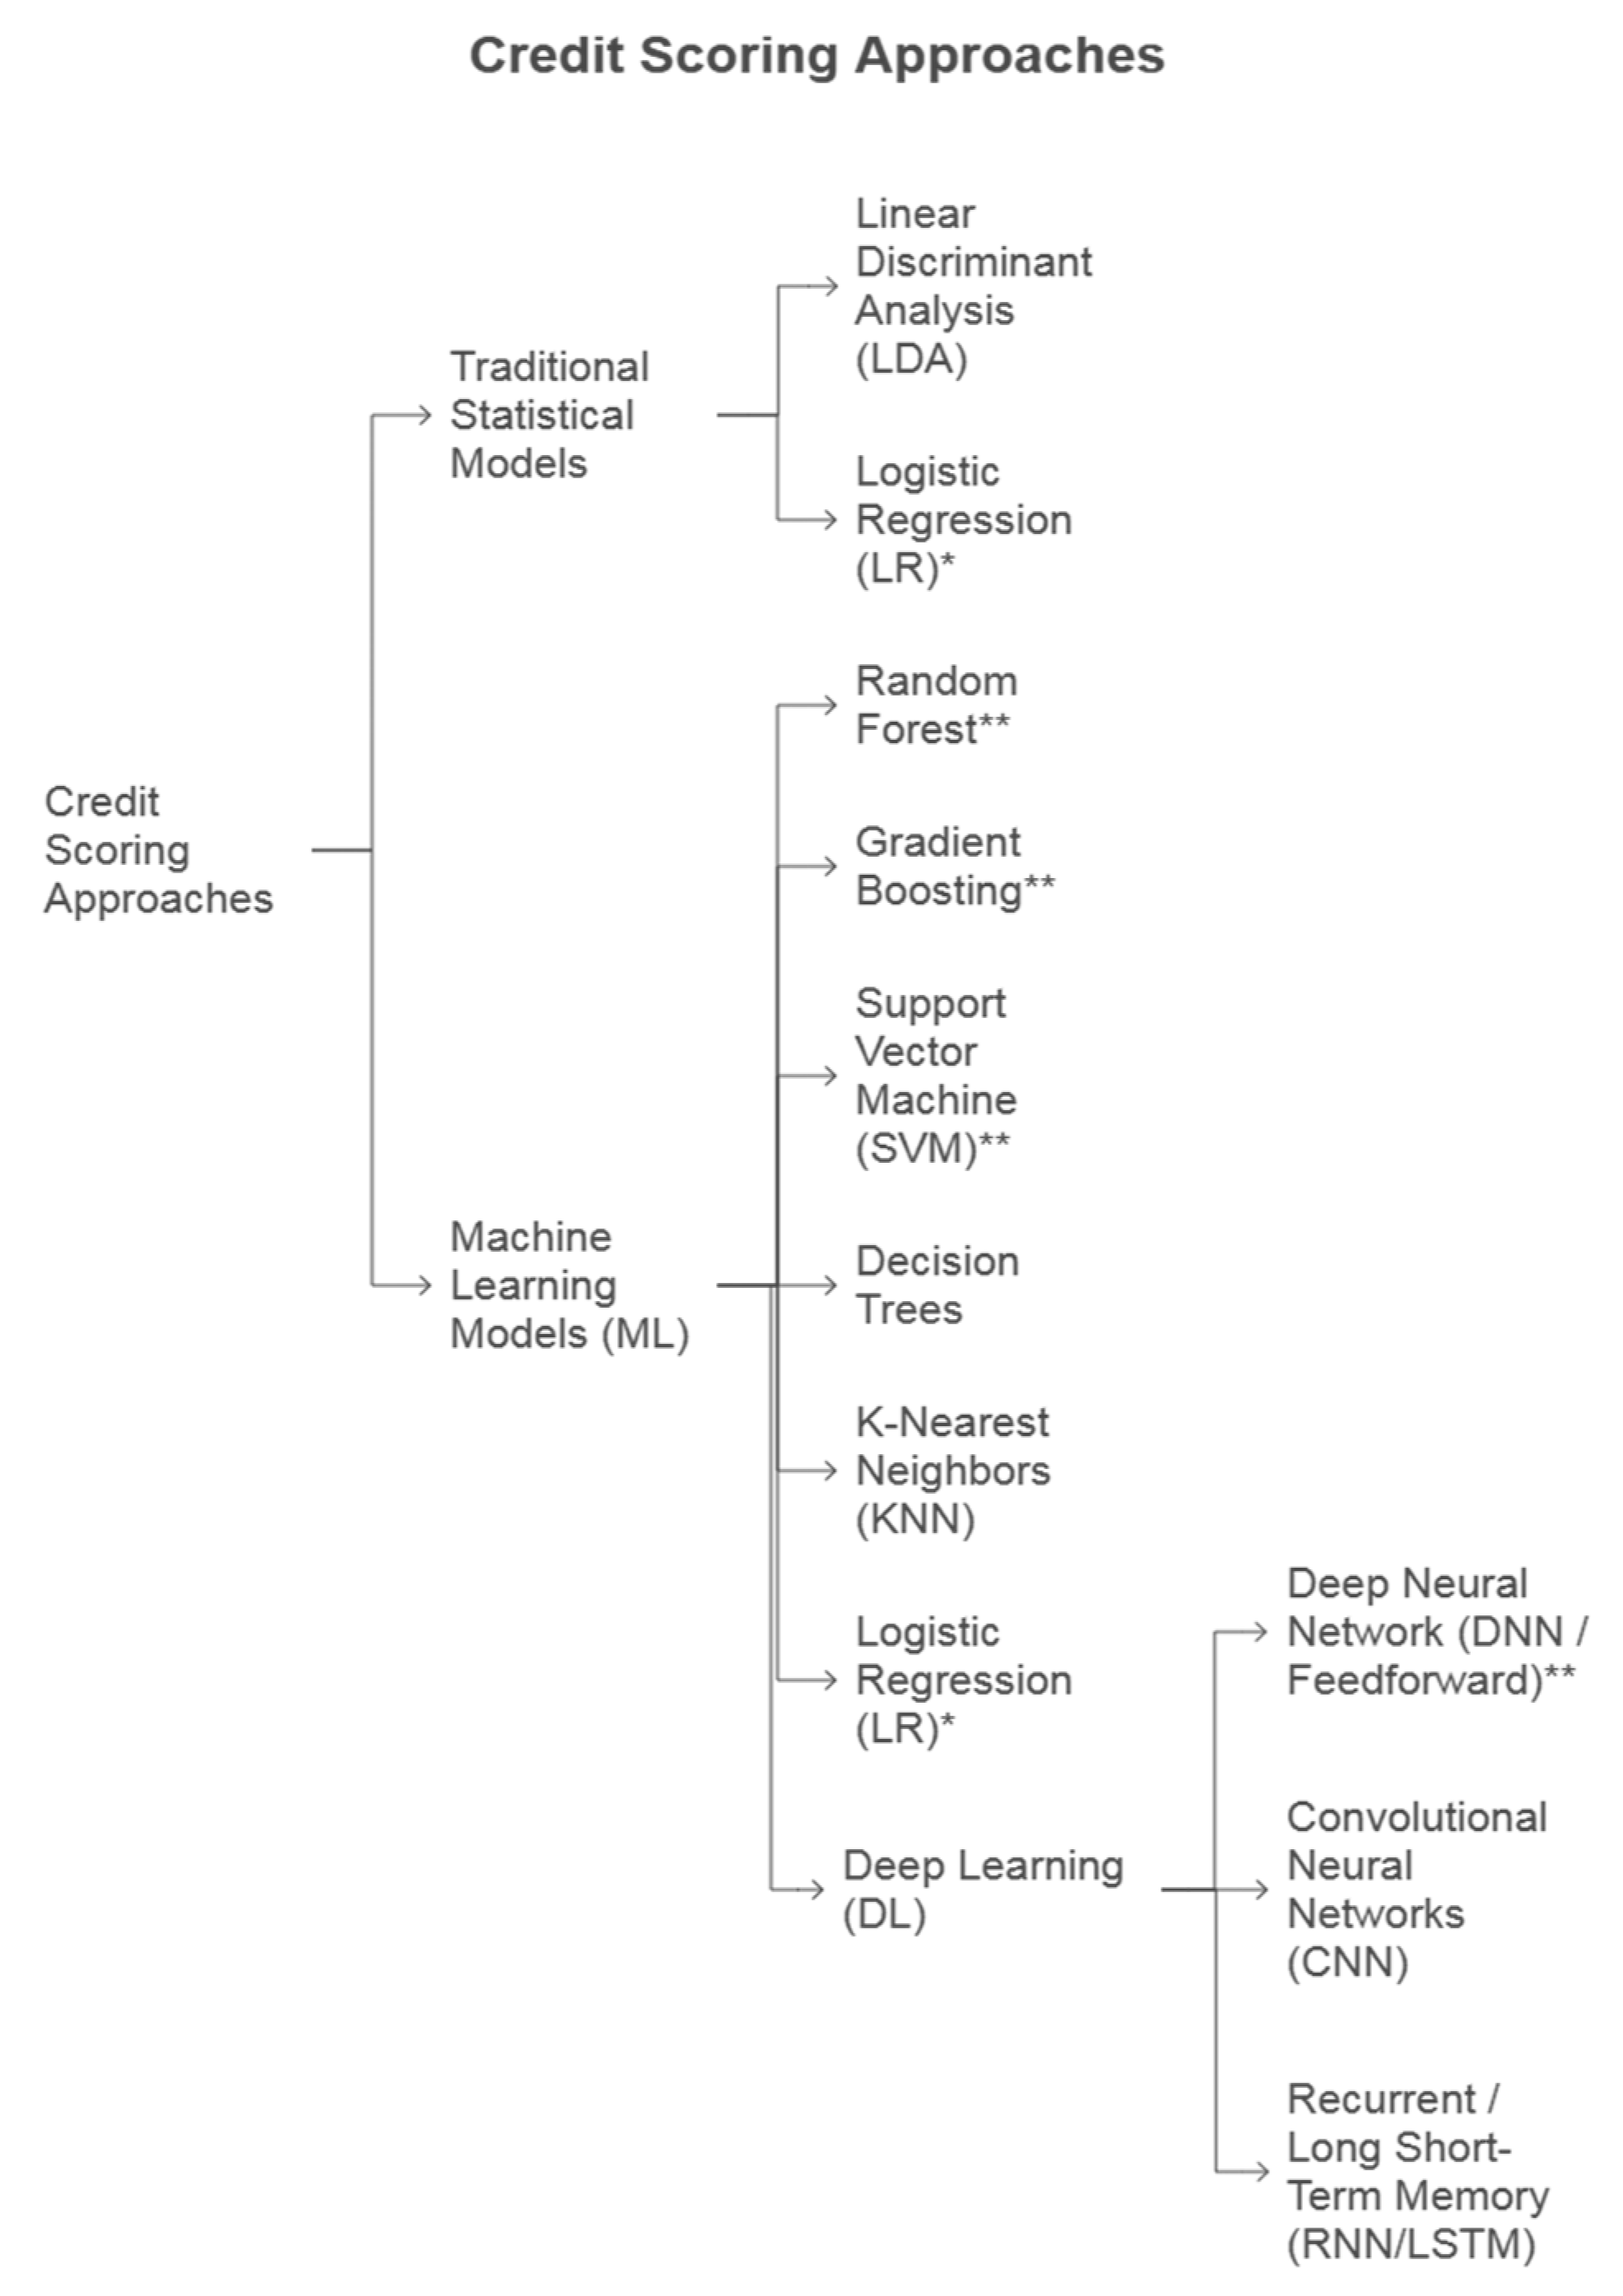
2.2. Traditional and Data-Driven Approaches in Credit Scoring

Credit scoring methodologies can be broadly categorized into traditional statistical approaches and more recent data-driven techniques leveraging ML and DL techniques (illustrated with details in Figure 1). While traditional methods rely on fixed assumptions and structured data, modern techniques allow for greater flexibility and predictive power through the use of complex, high-dimensional data.
Traditional methods, such as logistic regression and linear discriminant analysis, rely heavily on historical credit data and assume linear relationships, which often fail to capture complex borrower behavior (Adesanya 2024; Hussain et al. 2024). These models also struggle to adapt to changing economic conditions and borrowers’ circumstances, especially in cases with limited credit histories like students (Adesanya 2024; Hussain et al. 2024). While Logistic Regression originates from this statistical tradition, its widespread use and ability to provide probabilistic outputs often lead to its inclusion as a baseline model within ML comparisons, bridging the gap between traditional and algorithmic approaches.
In contrast, data-driven approaches leverage ML techniques, such as decision trees, ensemble methods, and neural networks, to analyze large-scale data and detect intricate patterns missed by traditional models (Hussain et al. 2024; Adesanya 2024). ML and DL systems enable real-time processing, allowing for timely and accurate credit evaluations, and can incorporate alternative data sources to dynamically update risk assessments (Adesanya 2024). While these approaches offer enhanced precision and adaptability, concerns regarding data privacy and algorithmic bias remain critical and must be addressed to ensure ethical implementation (Kotb and Proaño 2023). These advanced techniques enable financial institutions to assess credit risk more effectively, particularly in regulated environments (Shukla and Gupta 2024).
Beyond personal credit scoring, ML and DL techniques have also been applied in the domain of corporate credit rating. Several studies, such as that of Golbayani et al. (2020), have compared the predictive performance of models including Neural Networks, Support Vector Machine, and Decision Trees in the context of corporate credit evaluation.
Moreover, the shift towards complex ML/DL models necessitates more comprehensive evaluation frameworks. Recent literature highlights the need to assess models across multiple dimensions beyond predictive performance, often summarized by principles like Sustainability (Robustness), Accuracy, Fairness, and Explainability (SAFE) (Giudici 2024; Babaei et al. 2025).

2.3. Criteria in Personal Credit Scoring

2.3.1. General Criteria in Personal Credit Scoring Models

Traditional credit scoring models, significantly influenced by benchmarks like the FICO score, typically utilize established criteria derived from an individual’s financial history and behaviors. Commonly included demographic and status variables encompass gender, age, marital status, number of dependents, phone ownership, education level, occupation, duration of residency, and credit card possession (Šušteršič et al. 2009; Hand et al. 2005; Lee and Chen 2005; Sarlija et al. 2004; Banasik et al. 2003; Chen and Huang 2003; Lee et al. 2002; Orgler 1971; Steenackers and Goovaerts 1989). Financial and employment factors, such as employment duration, loan amount, loan term, homeownership, monthly income, bank account status, car ownership, existing mortgages, loan purpose, and collateral, are also frequently incorporated (Ong et al. 2005; Lee and Chen 2005; Greene 1997; Sarlija et al. 2004; Orgler 1971; Steenackers and Goovaerts 1989). Some models extend to spousal information (Orgler 1971), while less common criteria might include area codes or length of banking relationship (Bellotti and Crook 2009; Banasik and Crook 2007; Andreeva 2006; Banasik et al. 2003).
The number of criteria employed varies significantly, with no universally ideal number; selection often depends on data availability, context, and country-specific factors (Abdou and Pointon 2011). Many models build upon the five core FICO factors: payment history, amounts owed, length of credit history, new credit, and credit mix (Zhang et al. 2020).
Credit scoring data generally originate from two primary sources: traditional data (loan specifics, repayment behavior, and credit activity) collected by financial institutions or credit bureaus, and alternative data obtained from third parties (Knutson 2020). Alternative data sources are diverse, including utility payments, mobile device usage, social media activity, online transactions, and behavioral metrics, offering supplementary insights into lifestyle and potential creditworthiness (Knutson 2020). While traditional scoring predicts future financial behavior based on past actions, alternative scoring leverages non-financial data to infer creditworthiness. Utility bills and rental payment history are often considered to be “credit-like” alternative data due to their long-term nature (Knutson 2020). Public records and indicators of residential stability have also been utilized.

2.3.2. Credit Scoring Criteria in the Vietnamese Context

In Vietnam, as an emerging market with a rapidly expanding consumer finance sector, research specifically detailing the criteria used in personal credit scoring often centers on the framework established by the National Credit Information Center of Vietnam (CIC), which is sometimes augmented by the criteria used by commercial banks. CIC’s scoring process relies on classical statistical methods and utilizes nine indicators across three main groups: (i) Debt Balance and Status (total debt, number of lenders, highest debt group, and repayment term), (ii) Repayment History (months with substandard debt, years with bad debt, and lenders with bad debt), and (iii) Credit Relationship History (years of relationship and new loans taken) (Le and Dang 2016).
Vietnamese commercial banks typically adapt this CIC foundation. For instance, Dong A Bank adds factors like gender, education, employer type, and income (Mai 2014). Vietinbank incorporates job tenure, housing status, family structure, and bank relationship details (V. T. Le 2010). Asia Commercial Joint Stock Bank (ACB) uses personal data (age, education, residence, and income source) alongside loan specifics (V. T. Le 2010), while Agribank employs an extensive system for individual business customers (Huynh 2017). This demonstrates an adaptation of the standard model to specific institutional risk assessment needs.

2.3.3. Unique Considerations and Criteria for Student Credit Scoring

Assessing student creditworthiness poses unique challenges, largely due to their typically limited or non-existent formal credit history, often termed as a “thin file” (Baker and Montalto 2019; Baum and Steele 2010). This data scarcity diminishes the effectiveness of traditional models, necessitating the inclusion of criteria specific to the student experience.
Academic performance represents a critical category. Metrics such as Grade Point Average (GPA), field of study, educational institution prestige, and year of study serve as valuable proxies for discipline, future earning potential, and the likelihood of degree completion and subsequent loan repayment (Jackson and Reynolds 2013; Adams and Moore 2007). The research indicates a link between lower academic performance and higher-risk credit behaviors (Adams and Moore 2007), potentially making the academic data potent predictors for this segment.
Given students’ common reliance on external support, their socio-economic background, including familial aspects, is highly relevant. Parental income, assets, education level, and the number of household dependents can signal available financial support and baseline stability, influencing the student’s debt needs and management capacity (Addo et al. 2016; Houle 2014). Basic demographics, such as age and residency status, provide further context (Baker and Montalto 2019).
Alternative data and non-traditional financial indicators gain particular importance. Information on part-time employment (status, income, hours, and stability) offers a direct measure of current repayment ability (Robb and Pinto 2010; Mendes-Da-Silva et al. 2012). Data on living expenses, housing situation (dormitory, family home, and renting), tuition fees, and potentially utility or mobile phone payment patterns act as proxies for financial management skills, financial pressures, and payment discipline in the absence of formal credit records (Robb and Pinto 2010).
Finally, any existing borrowing history, however limited (including prior loan details like purpose, amount, term, and repayment), remains a vital input if available. Consequently, a robust student credit scoring model necessitates a multi-dimensional approach, integrating academic achievements, socio-economic context, employment details, alternative financial behaviors, and personal characteristics alongside any available traditional credit data. This holistic perspective is essential for accurately evaluating the unique risk profile of student borrowers.

2.4. Machine Learning Models and Deep Learning Models in Credit Scoring

Machine Learning has emerged as a powerful tool in credit scoring, offering enhanced predictive performance and the ability to model complex, nonlinear relationships in borrower data. A range of algorithms has been applied in credit risk assessment, each with distinct characteristics influencing their suitability for specific data contexts and regulatory requirements. Commonly used models include Logistic Regression, Decision Trees, Random Forest, Support Vector Machine, and advanced boosting techniques such as Extreme Gradient Boosting and Light Gradient Boosting Machine.
Logistic regression remains a widely used baseline model due to its simplicity and interpretability; however, its performance declines in the presence of nonlinear interactions (Meng et al. 2025). Random Forest offers improved accuracy and is robust against overfitting, while also providing useful insights into feature importance (Han 2024). Gradient boosting methods, particularly Extreme Gradient Boosting and Light Gradient Boosting Machine, have gained recognition for their strong performance in large-scale datasets and competitive results in real-world applications (Meng et al. 2025; Mukhanova et al. 2024). Neural networks, though capable of capturing intricate patterns, often face limitations in interpretability, which can hinder their deployment in highly regulated environments (Chen 2025).
Similarly, Lessmann et al. (2015) concluded that Support Vector Machine is competitive with Artificial Neural Networks in terms of predictive performance after evaluating 41 classification methods on multiple credit scoring datasets. In contrast, Teles et al. (2021), through a comparative analysis of Random Forest and Support Vector Machine, found Random Forest to be a promising option for personal credit risk management due to its speed and simplicity, whereas Support Vector Machine outperformed Random Forest in classification accuracy for credit recovery prediction tasks.
Overall, in the context of personal credit risk assessment, ML algorithms such as K-Nearest Neighbors, Support Vector Machine, Decision Trees, Random Forest, Adaptive Boosting, and Gradient Boosting have consistently demonstrated superior performance compared to traditional logistic regression models.
In terms of strengths, ML models generally surpass traditional statistical methods in predictive accuracy (Shukla and Gupta 2024). Their scalability allows for efficient processing of large and heterogeneous datasets, and their flexibility enables integration of various data types, including alternative and behavioral data sources (Shukla and Gupta 2024). However, these advantages are accompanied by notable challenges. A key concern is the lack of transparency in model decision-making, particularly in DL systems, which complicates model validation and regulatory compliance (Chen 2025). Additionally, many ML models are sensitive to data imbalance, which may distort risk predictions and reduce the reliability of outcomes in minority classes (Han 2024). Finally, computational complexity remains a barrier to deployment, especially in institutions with limited technical infrastructure (Shukla and Gupta 2024).
To address the lack of transparency, particularly in complex ensemble or deep learning models, Explainable AI (XAI) techniques have gained traction. Methods like Shapley values are increasingly applied post-hoc to quantify the contribution of each input feature to a model’s prediction for specific instances or globally (Babaei et al. 2023). Such techniques are vital for understanding model behavior, debugging, and meeting regulatory expectations for high-risk applications like credit scoring.
Deep learning has increasingly been adopted in credit scoring due to its capacity to model complex, nonlinear relationships and effectively utilize diverse data types (Bari et al. 2024; Mienye et al. 2024). Prominent architectures, such as Convolutional Neural Networks, Long Short-Term Memory Networks, and various hybrid models, have demonstrated strong performance in capturing hidden patterns and improving prediction outcomes, particularly for underrepresented borrower groups. Convolutional Neural Networks are particularly effective in detecting spatial correlations and have been applied to alternative data sources beyond traditional financial indicators (Mienye et al. 2024). Long Short-Term Memory Networks are designed to process sequential data and are well-suited to modeling temporal patterns in borrower behavior. Hybrid models, which integrate features from architectures such as Recurrent Neural Networks and Deep Neural Networks, have shown improved accuracy, especially in contexts involving sparse or incomplete credit histories (Kimani et al. 2024).
Key strengths of DL in credit risk assessment include superior predictive performance, driven by the ability to model intricate, nonlinear data relationships (Bari et al. 2024). These models are also highly flexible, capable of processing both structured and unstructured inputs, thereby enhancing the inclusivity of credit evaluations (Bari et al. 2024). Moreover, hybrid models often achieve higher evaluation metrics compared to single-architecture approaches, reflecting greater robustness in predictive tasks (Kimani et al. 2024).
Nonetheless, several challenges persist. DL models typically lack interpretability, which can hinder transparency and raise ethical concerns, particularly in high-stakes decision-making contexts like credit scoring (Bari et al. 2024). In addition, their computational demands are substantial, making large-scale deployment difficult for institutions with limited technological infrastructure (Kimani et al. 2024). Performance is also sensitive to data quality; inconsistencies or noise in the input data can significantly degrade model reliability (Mienye et al. 2024). Overall, while DL offers meaningful advancements in the accuracy and adaptability of credit scoring systems, its successful integration into financial services requires careful attention to interpretability, fairness, and operational feasibility.
In Vietnam, a representative developing economy, the adoption of ML and DL models in credit scoring has accelerated to meet the growing demand for inclusive and data-driven credit assessment. Limited credit history, evolving borrower behavior, and the rapid expansion of consumer finance have made traditional models less effective, prompting institutions to explore more adaptable and predictive approaches. ML models such as logistic regression continue to serve as baseline classifiers due to their simplicity and interpretability (Van Trung and Vuong 2024). However, more advanced methods like Random Forest have demonstrated higher accuracy by aggregating decision trees to reduce overfitting, making them suitable for diverse borrower profiles in the Vietnamese context (Tran et al. 2021). Gradient boosting frameworks—including Light Gradient Boosting Machine and CatBoost—have emerged as leading solutions in handling imbalanced datasets and capturing complex data structures, which are common in developing markets (Tran et al. 2021). By contrast, Support Vector Machines have shown relatively lower effectiveness compared to ensemble methods in local experiments (Tran et al. 2021). DL models have also gained traction. Sequential Deep Neural Networks offer enhanced representation learning and have outperformed traditional models in several local studies (Tai and Huyen 2019). Moreover, Convolutional Neural Networks, though originally designed for image analysis, have been adapted for structured credit data, showing potential in uncovering hidden patterns not easily captured by conventional models (Tai and Huyen 2019). Despite these advancements, concerns remain regarding transparency, fairness, and regulatory oversight. As Vietnam continues to digitalize its financial infrastructure, the adoption of ML and DL credit scoring must be accompanied by ethical and context-aware governance frameworks (Lainez and Gardner 2023).
Despite the growing application of ML and DL in credit scoring, especially in emerging markets like Vietnam, several important gaps remain. Research specifically focused on student credit scoring is limited, and direct comparisons between ML and DL models using real-world student loan data are scarce. While prior studies have explored ML and DL in both personal and corporate credit contexts (Lessmann et al. 2015; Teles et al. 2021; Golbayani et al. 2020), their application to student borrowers, with unique features such as academic performance and personal traits, remains underexamined.
Moreover, few studies address the practical feasibility of advanced models in educational finance, particularly regarding interpretability and deployment cost. This study seeks to fill these gaps by applying and comparing selected ML models (Random Forest, Gradient Boosting, and Support Vector Machine) and a DL model (PyTorch) to predict student loan eligibility in Vietnam, offering both performance insights and practical implications for data-driven lending in education.

3. Model Evaluation

3.1. Evaluation Metrics

To ensure a comprehensive and robust evaluation of model performance, this study adopts a multi-dimensional framework tailored to the specific nature of classification (Kuhn and Johnson 2018).
For binary classification models that predict whether a student is credit-eligible or not, the following metrics are applied: (i) Accuracy measures the overall proportion of correct predictions over total predictions. Though commonly used, it may be misleading with imbalanced data (James et al. 2013); (ii) Confusion Matrix provides a detailed breakdown of true positives, false positives, true negatives, and false negatives, helping to to identify specific misclassification patterns (Fawcett 2006); (iii) Precision evaluates the proportion of true positives among all predicted positives, making it particularly valuable in the contexts false positives incur high costs (Sokolova and Lapalme 2009); (iv) Recall (Sensitivity) captures the proportion of actual positives correctly identified, which is critical in credit scoring, when missing a high risk borrower (false negative) can have serious implications (Powers 2011); (v) F1-Score, the harmonic mean of Precision and Recall, offers a balanced metric particularly useful under class imbalance conditions (Géron 2019).
In the case of deep neural networks, performance monitoring during training is also conducted: Loss Function Tracking across training epochs provides insight into the learning process and potential overfitting. A significant gap between training and validation loss typically signals poor generalization performance (Bengio et al. 2013).
By integrating these evaluation metrics across different model types and training processes, this framework enables a well-rounded and data-driven comparison. It supports the identification of the most suitable algorithm for assessing student loan eligibility in the context of Vietnam’s higher education landscape.

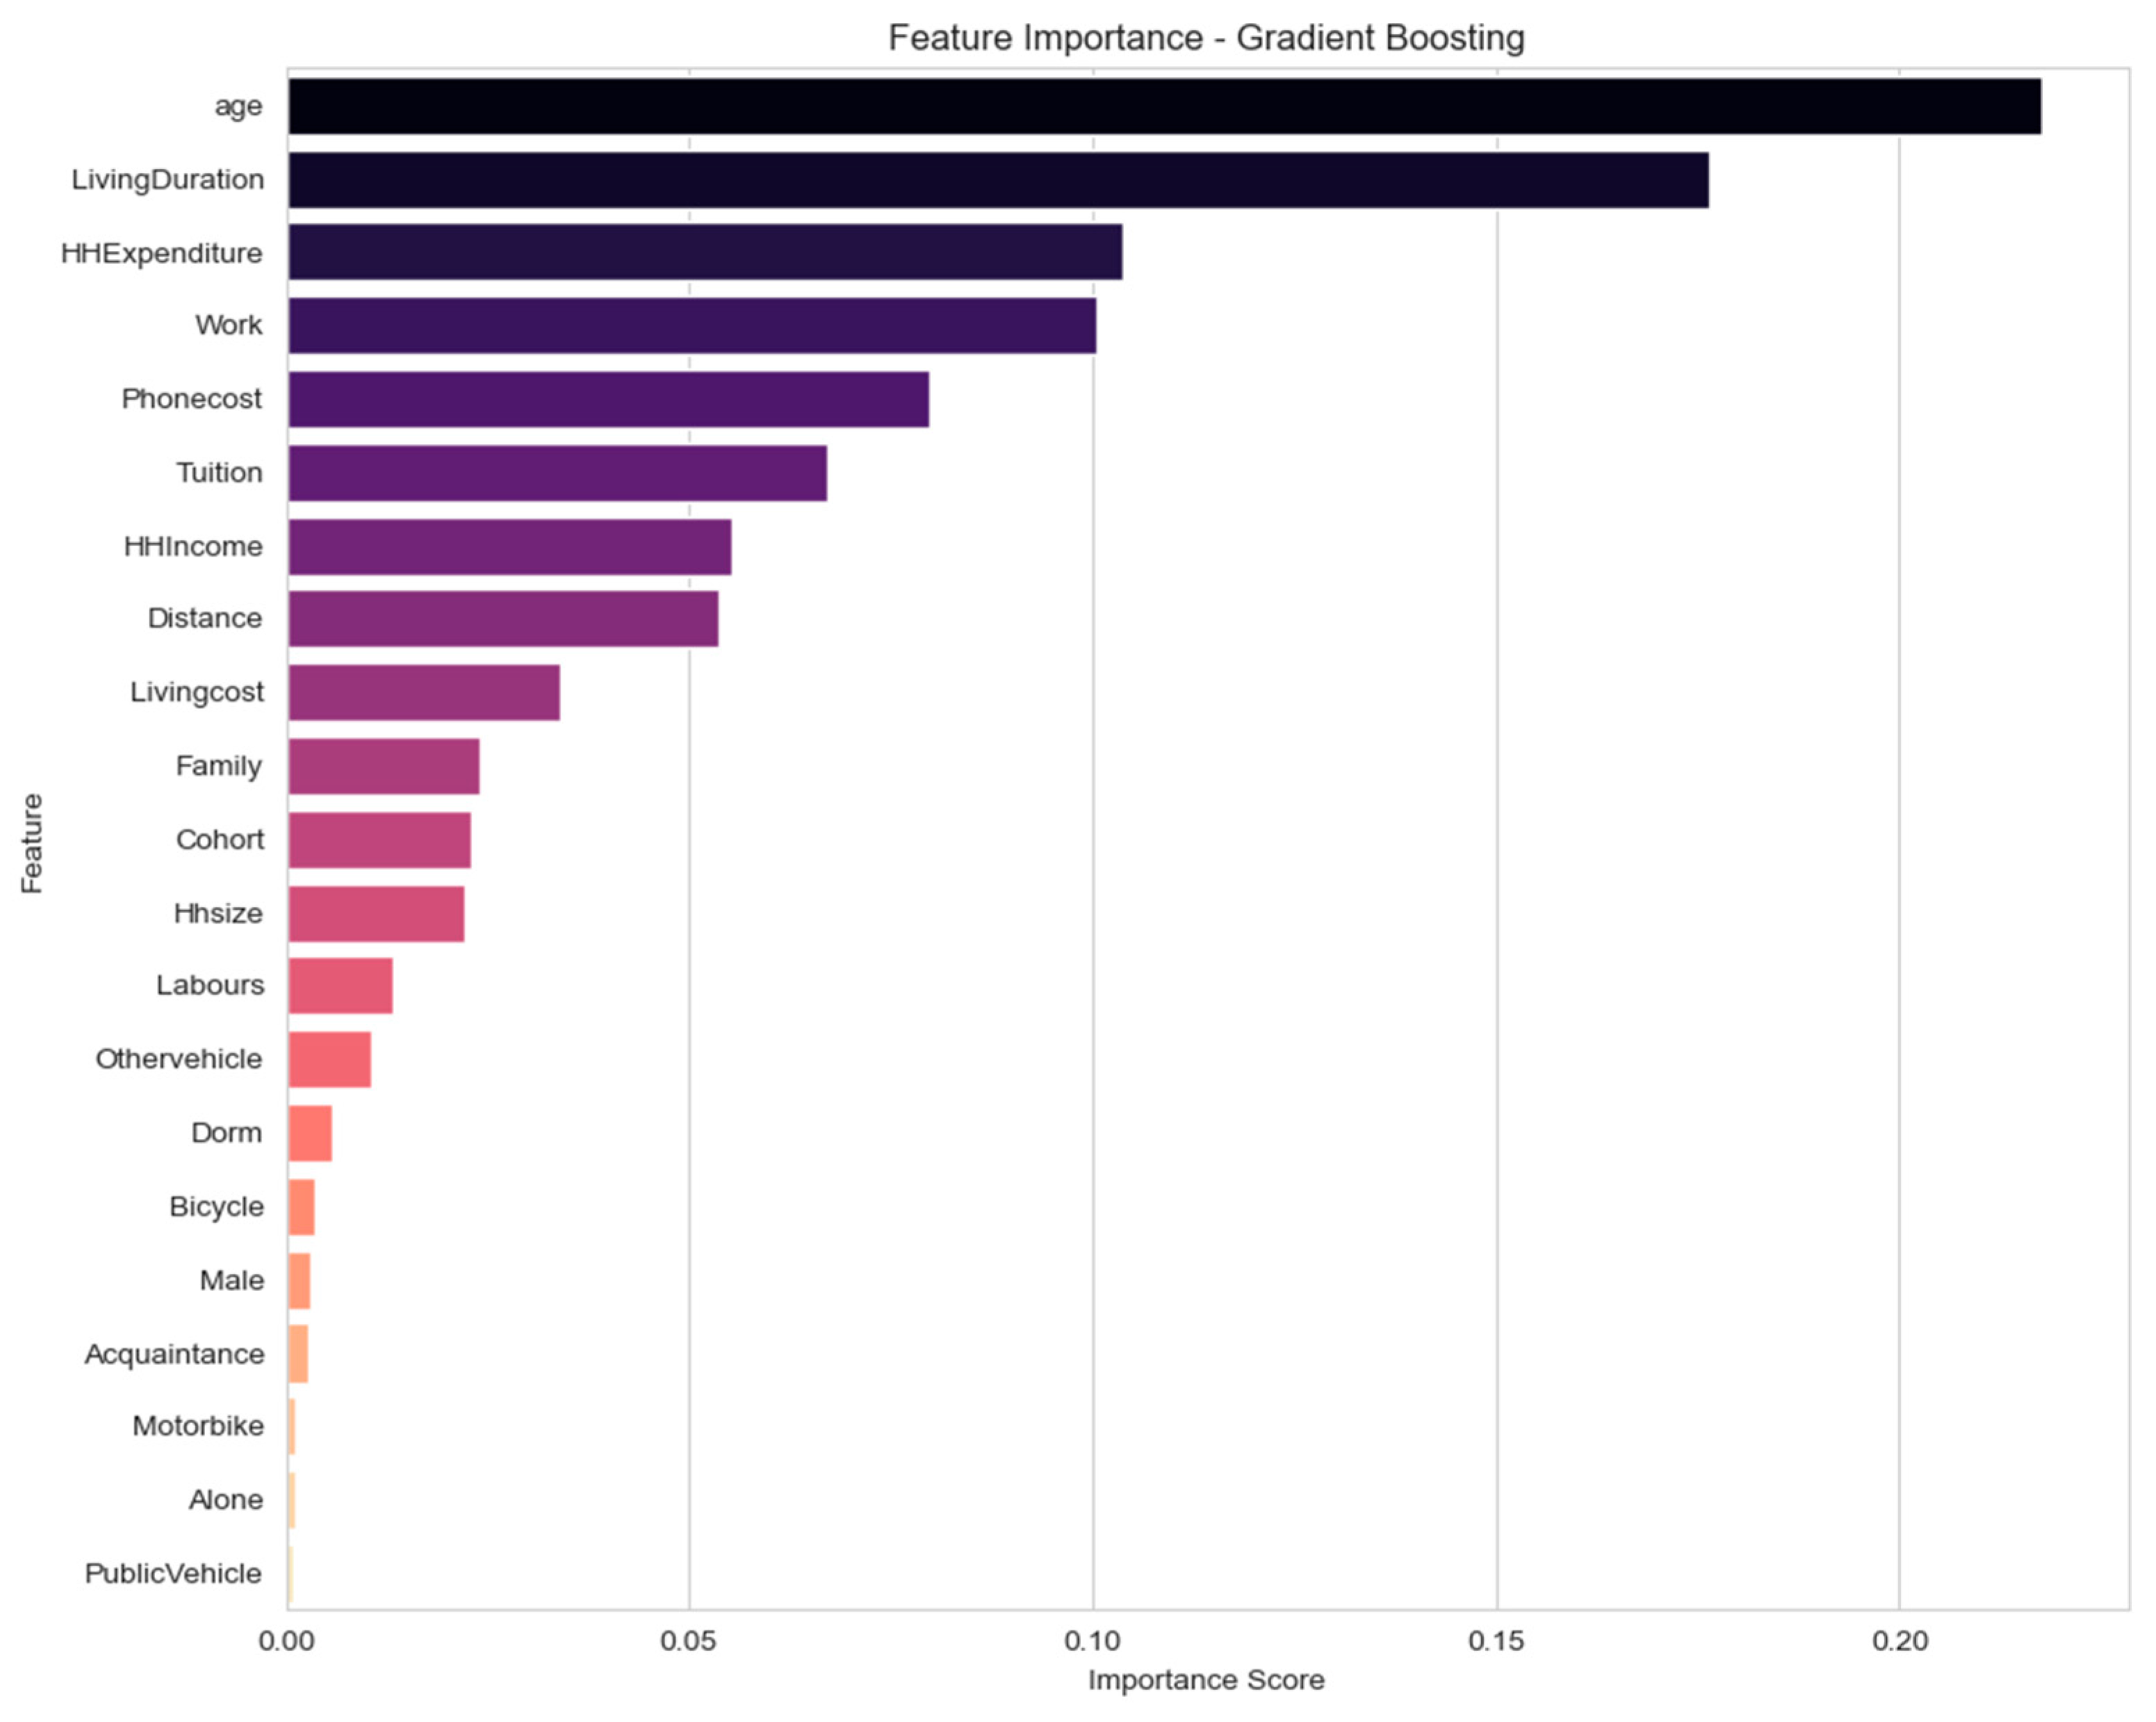
3.2. Results and Discussion
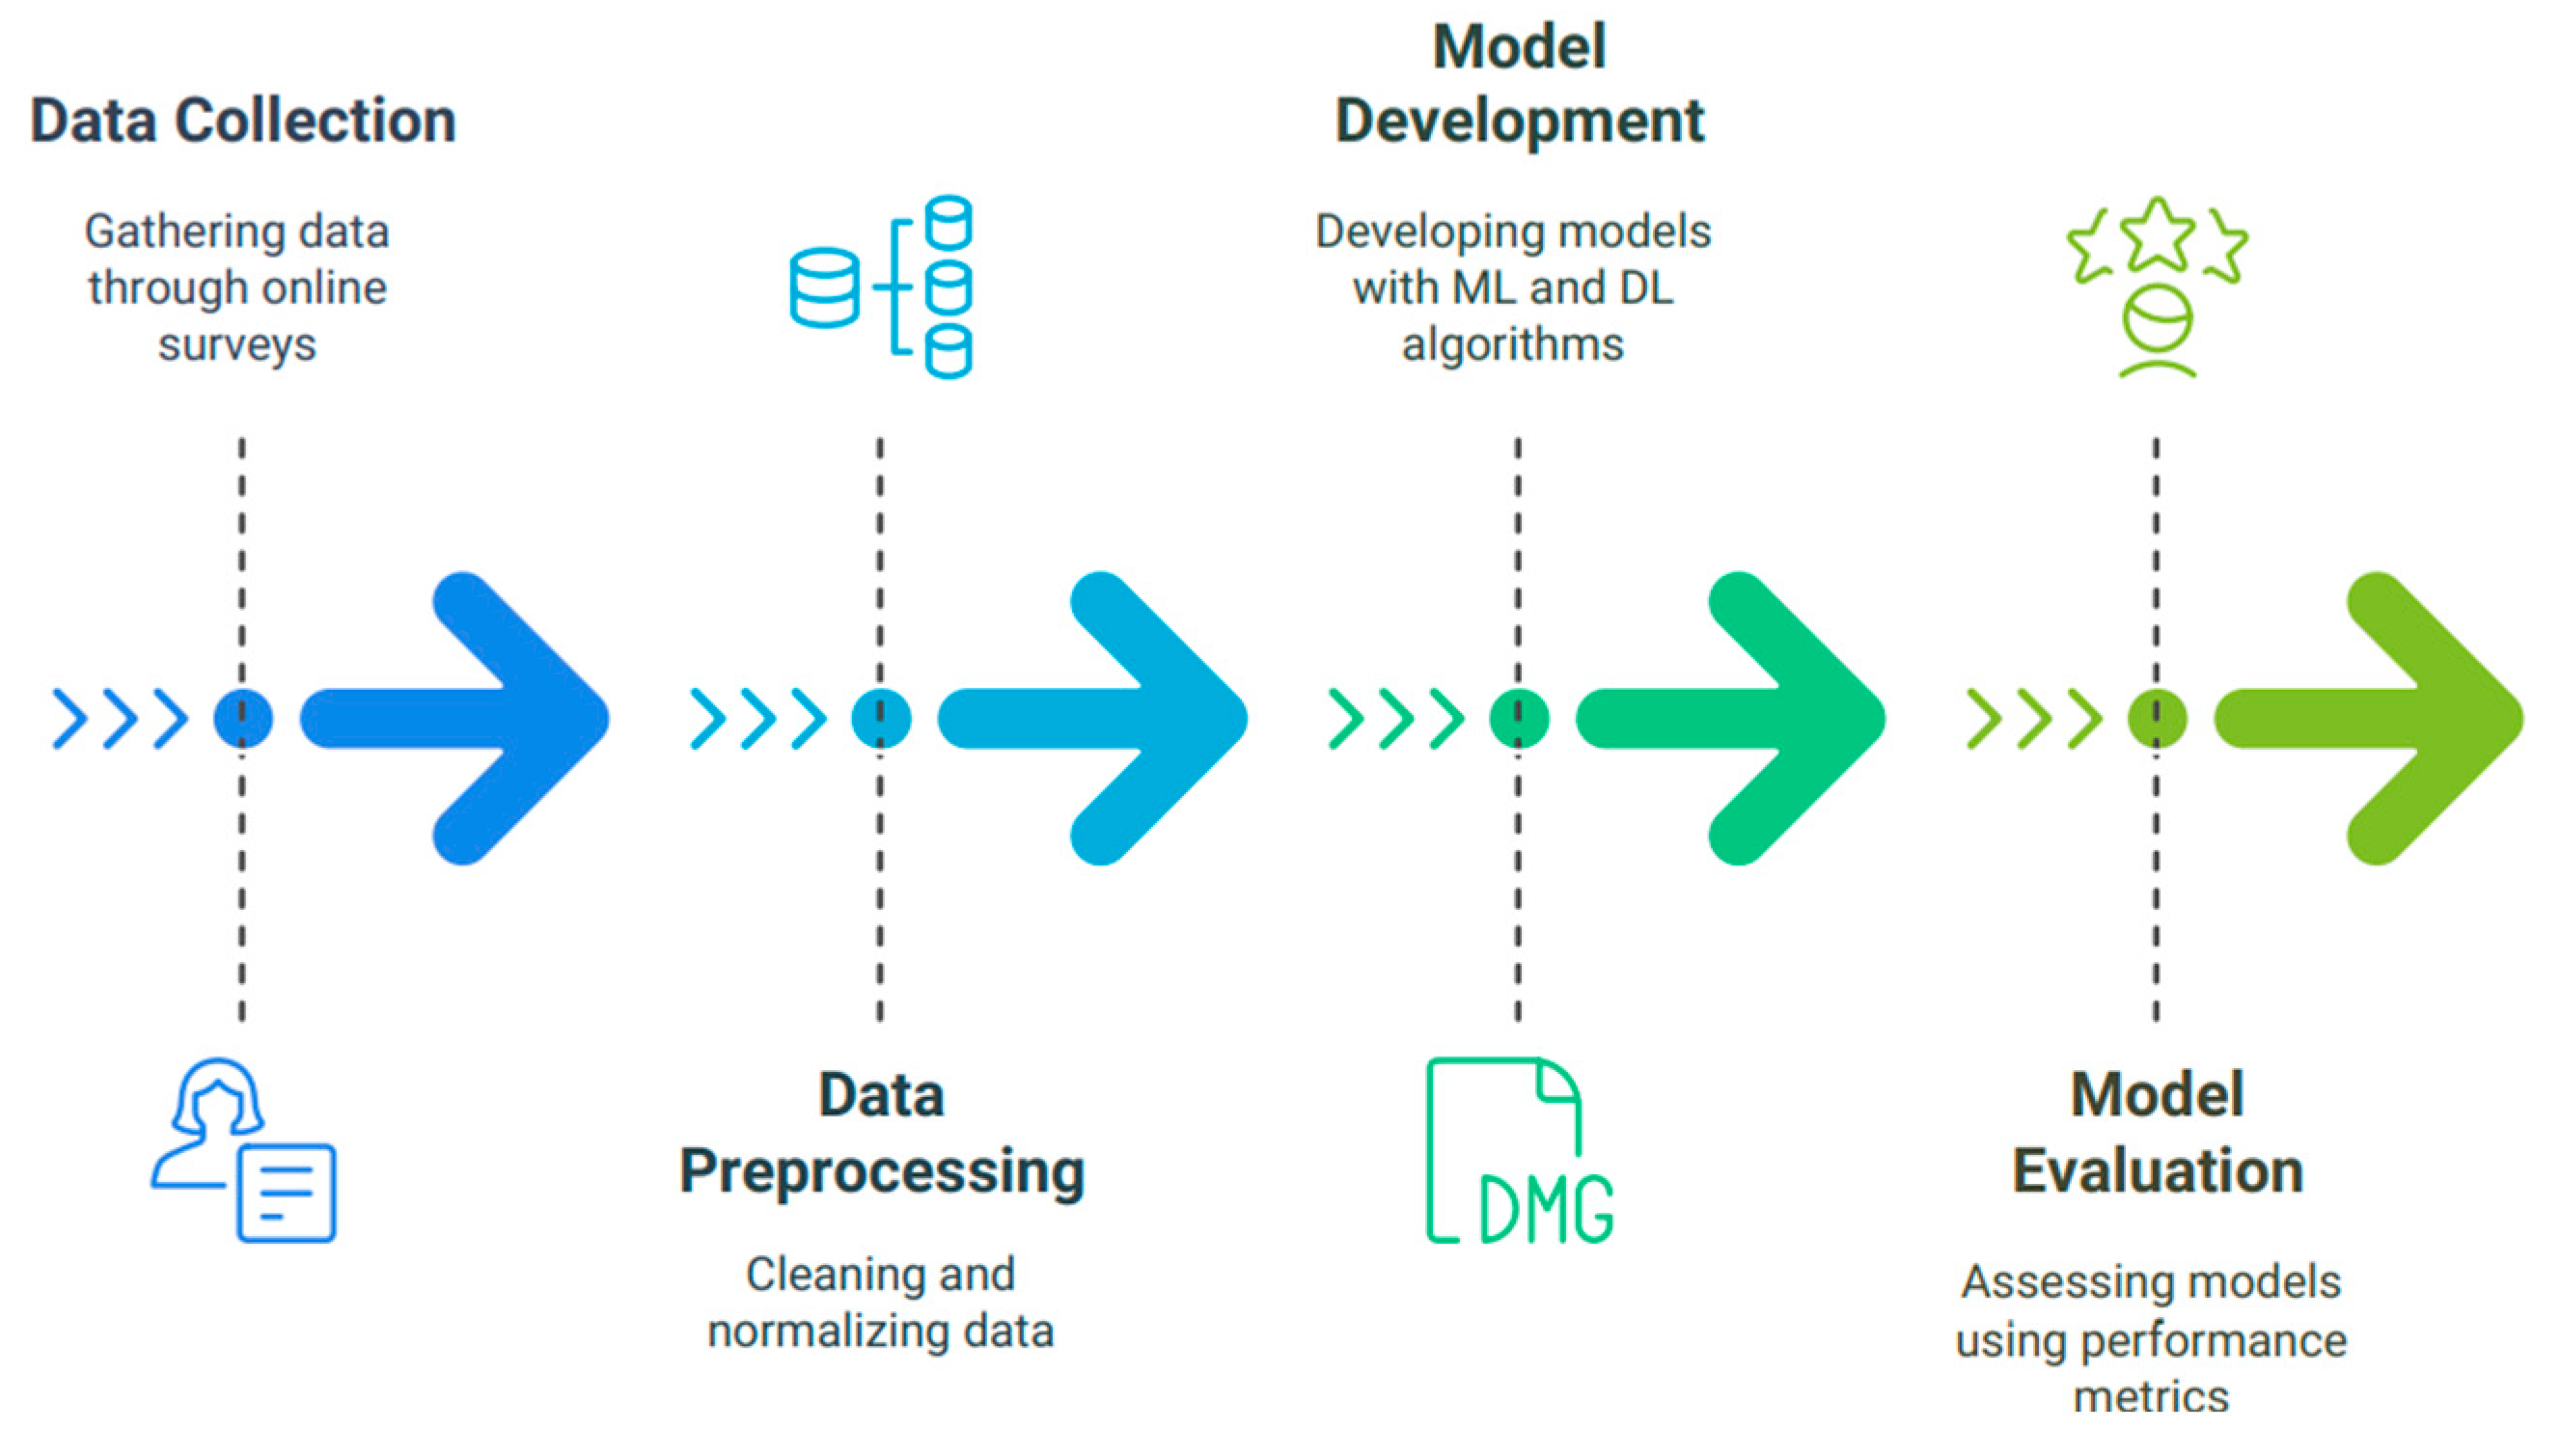
Table 1 summarizes the classification performance of all evaluated models. Among them, the Deep Neural Network (PyTorch) achieved the highest overall accuracy at 85.55%, indicating strong predictive capability compared to traditional ML models. Evaluating its performance in more detail reveals strong metrics for identifying non-eligible borrowers (Class 0 Precision: 86%, Recall: 90%, F1: 0.88). For predicting eligible borrowers (Class 1), the DNN demonstrated good Precision (77%) and Recall (70%), resulting in an F1-Score of 0.73. Its overall Macro Average F1-Score was 0.81, the highest among the models.
In comparison, the Random Forest model delivered robust and well-balanced results, with an overall accuracy of 82% and a Macro Average F1-Score of 0.79. A closer look at the class-specific metrics shows that it achieved a Precision of 86% and a Recall of 87% for class 0 (non-eligible borrowers), and a Precision of 72% and a Recall of 71% for Class 1 (eligible borrowers). These results suggest that Random Forest not only maintains high overall accuracy but also performs reliable discrimination between both target classes, making it a strong candidate for credit eligibility classification in practice.
The Support Vector Machine model achieved an overall accuracy of 80%, demonstrating relatively high Precision for Class 1 (75%) but a lower Recall (62%). This suggests that while Support Vector Machine is effective in minimizing false positives among creditworthy students, it tends to miss a considerable number of true positives. Therefore, it may be more appropriate in contexts where prediction confidence is prioritized over coverage, such as conservative credit approval processes.
The Gradient Boosting model yielded the lowest overall accuracy among the evaluated classifiers (75%). Nevertheless, it achieved 70% for Class 1, suggesting a stronger tendency to identify creditworthy students. However, its Precision for this class was only 59%, implying a higher rate of false positives. This trade-off may limit its practical applicability in contexts where misclassification costs are high.
Finally, the DL model (PyTorch) was trained over 20 epochs, during which the loss steadily decreased from 0.5446 to 0.2256 (see Table 2). This consistent reduction in loss indicates a stable learning process with no signs of overfitting, supporting the model’s high classification accuracy. These results underscore the potential of DL techniques in handling complex student credit data.
The analysis indicates that each model exhibits distinct strengths and trade-offs in the context of student loan eligibility prediction. Among them, Random Forest stands out as a robust and well-balanced model that achieved solid results, with balanced F1-Scores across both target classes, confirming its reliability in handling both types of predictive tasks.
The DL model implemented in PyTorch recorded the highest overall classification accuracy (85.55%), demonstrating a strong capacity to learn and represent complex, nonlinear relationships within the dataset. This result affirms the potential of DL techniques in modeling high-dimensional educational and financial features. Nevertheless, the effectiveness of this approach depends on the availability of sufficient computational resources, making it most suitable when predictive accuracy is prioritized over interpretability.
In contrast, Support Vector Machine showed reliable precision for Class 1 predictions (75%), indicating its suitability in contexts where minimizing false positives for creditworthy students is critical.
Gradient Boosting exhibited the lowest overall classification accuracy, yet it attained relatively high recall for Class 1 (70%). This result highlights its ability to identify students with loan eligibility but also reveals a trade-off in the form of lower precision (59%), suggesting a higher incidence of false positives. As such, the model may be better suited for cases where false negatives are more costly than false positives.
In summary, the selection of an optimal model should be guided by the specific objectives of the loan eligibility prediction task. When overall accuracy is the primary concern, DL emerges as the most effective solution. If a balance between predictive performance and model interpretability is desired, Random Forest represents an appropriate choice. In scenarios where misclassification costs are asymmetric, Gradient Boosting may be preferred for its recall-oriented strengths, while Support Vector Machine may be selected for its higher precision.
Vietnamese students, like many in developing economies, often lack formal credit histories due to limited or no prior engagement with banking institutions. Consequently, traditional credit scoring mechanisms, which are typically reliant on documented financial behavior, are inadequate for predicting loan eligibility in this population. In this context, non-traditional variables such as living costs, tuition fees, and part-time work status serve as proxy indicators of financial stability and repayment capacity. These features help bridge the informational gap left by the absence of formal credit records, rendering them particularly valuable in algorithmic models for identifying latent patterns of loan eligibility.
Vietnam’s formal lending system remains ill-equipped to serve individual, low-income borrowers such as students, as noted by Iwase (2011) and Malesky and Taussig (2009). Bureaucratic inefficiencies, relationship-based lending practices, and the lack of standardized credit evaluation frameworks contribute to the systematic exclusion of students from formal credit channels. As a result, data-driven models that incorporate broader socioeconomic indicators, particularly non-traditional features, are more effective in capturing the financial realities of students operating within a fragmented and unequal credit environment.
The inclusion of variables such as ‘TUITION’, ‘PHONECOST’, and ‘LIVINGCOST’ in the model underscores the considerable financial pressure faced by students amid rising education expenses and limited institutional support. These features indirectly reflect both the financial burden and the likelihood of students seeking loans to cover essential needs, which is consistent with Chapman and Liu’s (2013) analysis of the growing repayment burden among student borrowers. In contrast, variables such as ‘BICYCLE’ or ‘DORM’, while potentially relevant to lifestyle or living arrangements, may be too commonplace or culturally normalized to serve as meaningful predictors of credit behavior.
Given the lack of transparency and weak regulatory oversight in Vietnam’s credit system (Vu 2024), many students resort to informal lenders. These lenders often do not rely on formal documentation but instead evaluate borrowers based on observable indicators such as employment status or monthly expenditures. This practice mirrors the model’s reliance on non-traditional features, reinforcing the importance of such variables not only from a predictive standpoint but also in reflecting real-world financial decision-making in an underregulated credit market.
The findings from this study offer important implications for the design of student credit policies in developing economies, particularly in the context of Vietnam, where the formal lending infrastructure remains underdeveloped and poorly aligned with the financial realities of university students.
First, the demonstrated predictive power of both traditional and non-traditional variables underscores the need to develop alternative credit scoring frameworks tailored specifically to student borrowers. Most students lack formal credit histories, so conventional scoring methods based on prior financial behavior are insufficient. Policymakers and financial institutions should consider incorporating alternative data sources such as tuition fees, living costs, part-time employment status, and mobile phone expenses into risk assessment models. These indicators serve as practical proxies for students’ financial capacity and repayment behavior in the absence of conventional credit records.
Second, the high prevalence of informal lending practices among students calls for the development of targeted microcredit programs with flexible repayment terms. Such programs could offer small loan amounts, low interest rates, and deferred repayment schedules aligned with students’ academic calendars or post-graduation income streams. These features would reduce reliance on informal or exploitative lending channels, which often impose high interest rates and lack borrower protections.
Third, there is a strong case for institutional collaboration between universities, banks, and state agencies to improve credit access for students. Universities can play an important role in verifying student enrollment, academic progress, and financial need, thereby lowering the information asymmetry faced by lenders. In turn, banks can develop tailored financial products with simplified application processes and greater transparency.
Fourth, the study highlights the value of integrating behavioral and educational data into credit evaluations. Incorporating indicators such as academic performance, housing arrangements, and financial self-reliance may enhance the precision of credit assessments and provide a more holistic understanding of student borrowers.
Finally, to ensure sustainability and borrower protection, there is a pressing need to improve the regulatory framework governing student lending. Policies should establish clear criteria for student loan eligibility, cap interest rates for education-related loans, and offer legal mechanisms for debt restructuring or forgiveness in cases of post-graduation financial hardship. Transparent oversight mechanisms are also necessary to monitor both formal and informal credit activities targeting students. In sum, a comprehensive, data-informed, and student-centered approach to credit policy is essential for promoting financial inclusion in higher education. The integration of alternative data, institutional coordination, and regulatory reform can collectively enhance the accessibility, equity, and sustainability of student credit systems in Vietnam and similar developing contexts.

4. Methodology

4.1. Research Design

This study aims to evaluate and compare the predictive performance of traditional ML models, including Random Forest, Gradient Boosting, and Support Vector Machine, with a DL model built using the PyTorch framework, in the context of student loan eligibility prediction.
This research adopts a quantitative design comprising four main stages as visualized in Figure 2. First, primary data were collected through online surveys targeting university students. Second, the dataset was preprocessed through cleaning, encoding of categorical variables, and normalization to ensure consistency across features. Third, predictive models were developed using selected ML algorithms—Random Forest, Gradient Boosting, and Support Vector Machine—as well as a DL model implemented with PyTorch. Finally, model performance was evaluated using standard metrics, including Accuracy, Precision, Recall and F1-Score.
PyTorch is selected for the DL component due to its flexibility, ease of model customization, and alignment with current academic and industry practices in ML and DL development.

4.2. Data Collection and Processing

4.2.1. Data Collection

The study data were collected through a random survey of students using a questionnaire. The survey instrument included questions designed to capture key demographic, academic, financial, and behavioral attributes. For instance, students were asked about their age, gender, and cohort (year of admission). Financial information included categorical questions about household income (using ranges like ‘under 100 million VND’, ‘100–200 million VND’, etc.) and expenditure using predefined ranges (e.g., ‘5–10 million VND’, ‘10–15 million VND’, etc.), the number of working family members, and whether the student currently held a part-time job. Living situation details covered aspects like housing type (e.g., Dorm, Living with Family, Acquaintance, or Alone), duration at the current residence, and estimated monthly living (ranges such as ‘<VND 2 million, ‘VND 2–4 million’, etc.), etc. Major universities in Vietnam were randomly selected from large cities such as Hanoi, Da Nang, and Ho Chi Minh City. Table 3 presents the collected information.

4.2.2. Data Processing

The research sample consists of university students from institutions across Vietnam, representing a diverse range of academic disciplines, years of study, and household economic backgrounds. This diversity enhances the representativeness of the sample and increases the generalizability of the study’s findings to the broader student population.
A total of over 1200 responses were collected through the initial survey. After removing incomplete or invalid entries, the final dataset included 1024 valid observations. Each record contained 21 input attributes and one target variable representing student loan eligibility. Categorical variables were encoded into a numerical format to ensure compatibility with ML algorithms, and all features were normalized to maintain consistency in scale. The processed dataset was then used to train and evaluate the selected ML and DL models.

4.2.3. Research Variables

The dependent variable in this study represents whether a student has prior borrowing experience. Based on the survey question asking if the student had ever received a loan (‘Have you ever borrowed?’), this target variable (Loan) employs a binary classification: it is coded as 1 for students who reported having received any loan in the past, and 0 for students who reported no prior borrowing experience. The models developed aim to classify students into these two groups based on the collected independent variables.
The independent variables were extracted from the structured survey data and correspond to the major categories outlined in the questionnaire, including personal information, academic background, family financial status, part-time employment, credit and loan history, and living conditions. A detailed summary of these variables is provided in Table 4.
It is important to note that several variables initially collected were excluded from the final models due to practical data considerations encountered during preprocessing. For instance, variables like university, program, and major exhibited excessive unique values, making one-hot encoding infeasible and other encoding methods potentially uninformative without significant grouping efforts beyond the scope of this study. Meanwhile, enrollment year (Cohort) showed a high correlation with age and was retained as the primary temporal indicator related to academic progression. Finally, GPA and academic conduct scores suffered from significant missing values and inconsistencies in reporting scales across different institutions, preventing their reliable use as predictors for the entire dataset.

4.3. Model Development and Training

For the purposes of model development and evaluation, the dataset was split into a training set (80%) and a test set (20%). This split ensures that the models are not overfitted to the training data and are capable of making accurate predictions on previously unseen data. The same approach was applied consistently across all four models examined in this study. These models can be categorized into two main groups. The first group consists of traditional ML algorithms, including Random Forest, Gradient Boosting, and Support Vector Machines. The second group includes a DL model, specifically, a Deep Neural Network implemented using the PyTorch framework. (A detailed Exploratory Data Analysis (EDA) of the dataset, including variable distributions and relationships, is presented in Appendix A, while detailed model specifications are presented in Appendix B).
Random Forest (Ho 1995; Breiman 2001) is implemented as an ensemble of decision trees trained on bootstrap samples of the data with random feature selection at each split. In this study, the Random Forest model was trained using 80% of the dataset (training set), with the remaining 20% reserved for testing. The number of trees (estimators) was set to 100, and the maximum depth was tuned through cross-validation to prevent overfitting. The Gini index was used as the splitting criterion. Feature importance scores were extracted to assess the contribution of each variable to the credit prediction task. Performance was evaluated using Accuracy, Precision, Recall, and F1-Score on the test set.
To provide further insights into the relative influence of different input variables on the prediction outcomes, feature importance analysis from the trained Random Forest model was conducted, as detailed in Figure 3 below.
The analysis reveals a significant reliance on both traditional and non-traditional variables for model prediction, reflecting the importance of alternative data in the context of limited credit history (e.g., Knutson 2020; Robb and Pinto 2010). Among the most significant features are traditional demographic factors like AGE and HHLNCOME (Household Income), alongside several other non-traditional features. These non-traditional features include WORK (Student’s Work Status), TUITION, PHONECOST, and LIVINGCOST. However, not all these non-traditional features are significant, such as BICYCLE, DORM, ALONE, and PUBLIC_VEHICLE.
This mixture of traditional and non-traditional variables, on the one hand, highlights the necessity of incorporating factors beyond normal credit factors when assessing students’ credit, but on the other hand, it also notes that not all such variables contribute significantly to the predictive model. Regardless, overall, the prominence of non-traditional variables like specific educational and living costs may play a critical role in filling the information gap left by students' lack of formal credit history.
Gradient Boosting, introduced by Friedman (2001), was implemented using a decision tree-based ensemble with sequential learning. The model was trained on the same training set (80%) using a learning rate of 0.1, a maximum depth of 3, and 100 boosting iterations, following guidelines from Malohlava and Candel (2020). Loss minimization was performed using binary cross-entropy for the classification version and MSE for the score-based version. Early stopping was applied based on validation loss to avoid overfitting. Evaluation metrics included Accuracy, F1-Score, and MSE. Support Vector Machine (Vapnik 1998) was applied using a radial basis function kernel, selected for its ability to capture nonlinear boundaries. The data were scaled using standard normalization before training. A grid search was used to tune the regularization parameter (C) and kernel coefficient (gamma). The model was trained on 80% of the data and tested on the remaining 20%. Support Vector Machine was evaluated primarily for binary classification using Accuracy, Precision, Recall, and F1-Score. Although probabilistic outputs are not native to Support Vector Machine, probability calibration was applied post hoc using Platt scaling to enhance interpretability. Figure 4 presents the feature importance derived from the trained Gradient Boosting model. Consistent with the findings of the Random Forest, ‘age’ emerges as a primary predictor, alongside variables related to living situation and expenses, such as ‘LivingDuration’ and ‘HHExpenditure’. This provides further insight into the factors driving the Gradient Boosting model’s predictions.
A feedforward Deep Neural Network was developed using PyTorch to model the complex relationships among the 21 features. The architecture consisted of an input layer, two hidden layers with 64 and 32 neurons, respectively, Rectified Linear Unit activation functions, and a final sigmoid output layer for binary classification. The model was trained using the Adam optimizer, binary cross-entropy loss, a learning rate of 0.001, and mini-batch gradient descent (batch size = 32). Training ran for 100 epochs with early stopping based on validation loss. To evaluate generalization performance, the test set was used to compute Accuracy and F1-Score for classification.

5. Conclusions

This study has systematically analyzed and compared the performance of four distinct ML models—Random Forest, Gradient Boosting, Support Vector Machine, and DL using PyTorch—in addressing the problem of predicting student loan eligibility. The results reveal that no single model demonstrates consistent superiority across all evaluation metrics; instead, each model possesses unique strengths and limitations. Consequently, model selection should be guided by the specific objectives of the application, the nature of the available data, and the trade-offs between evaluation criteria such as accuracy, interpretability, and computational efficiency.
The study contributes to a deeper understanding of how ML techniques can be applied to student loan eligibility prediction, particularly for a population segment that typically lacks traditional credit history. These insights provide a practical foundation for financial institutions and educational organizations in selecting appropriate models for credit assessment. The study confirms the recurring observation that ensemble methods, such as Random Forest and Gradient Boosting, tend to outperform individual classifiers in handling the complexities of credit data, even with limited information, similarly to studies in diverse developing contexts like Pakistan (Abbas and Hussein 2024) and Indonesia (Malik and Hermawan 2018).
Based on the results, several recommendations can be made. First, the implementation of DL models shows strong potential in improving credit evaluation processes for students, a group that often lacks traditional credit histories. DL’s ability to capture complex, non-linear relationships makes it particularly well-suited for this purpose. Second, the integration of predictive modeling into financial advisory services at universities should be considered. Applications may include the use of loan scenario simulations, personalized financial planning tools, and the development of student-specific credit scoring systems, all of which can enhance financial decision-making and early risk identification.
Despite the promising results, this study is not without limitations. These include the limited representativeness of the sample, the absence of longitudinal (time-series) data, and the exclusion of potentially relevant socio-psychological variables. Addressing these limitations is essential for improving model generalizability and real-world applicability.
Future research should focus on extending the current models to incorporate temporal dynamics, integrating data from multiple sources (such as academic performance, behavioral indicators, and financial transactions), and evaluating the long-term impacts of predictive interventions. Such advancements will not only refine the precision and robustness of loan eligibility models but also inform the design of more inclusive and sustainable student loan policies.
Ultimately, by pursuing these directions, we aim to contribute to the development of intelligent, equitable, and resilient financial systems that support educational access and long-term financial well-being for students.

Author Contributions

Conceptualization, N.T.H.T. and N.T.V.H.; Methodology, N.N.T.; Validation, N.N.T. and V.T.T.B.; Formal analysis, N.N.T.; Resources, V.T.T.B.; Data curation, N.T.V.H., N.T.H. and V.T.B.; Writing—original draft, N.T.H.T. and N.N.T.; Writing—review & editing, N.T.V.H., V.T.T.B., N.T.H. and V.T.B.; Visualization, N.T.H.T., V.T.T.B. and N.T.H. All authors have read and agreed to the published version of the manuscript.

Funding

This research was funded by Vietnam National University, Hanoi, grant number QG.22.74.

Data Availability Statement

The data presented in this study are available on request from the corresponding author. The data are not publicly available due to privacy and confidentiality.

Conflicts of Interest

The authors declare no conflicts of interest.

Appendix A. Exploratory Data Analysis (EDA)

This appendix provides details of the exploratory data analysis conducted on the dataset (n = 1024) prior to model development. The analysis includes univariate examination of individual variables, bivariate analysis exploring relationships between variables (particularly predictors and the target variable ‘Loan’), and correlation analysis among numerical features.

Appendix A.1. Initial Data Overview

An initial inspection confirmed the dataset structure and data types.
The df.info() output (Table A1) shows 1024 entries and 23 initial columns, all with integer (int64) data types and no missing values in the loaded dataset. The ID column serves as an identifier, while the target variable is Loan.
Table A1. Summary of dataset variables, types, and non-null counts.
#ColumnNon-Null CountDtype
0ID1024non-nullint64
1Loan1024non-nullint64
2age1024non-nullint64
3Male1024non-nullint64
4Cohort1024non-nullint64
5Tuition1024non-nullint64
6Hhsize1024non-nullint64
7Labours1024non-nullint64
8HHIncome1024non-nullint64
9HHExpenditure1024non-nullint64
10Work1024non-nullint64
11Dorm1024non-nullint64
12Family1024non-nullint64
13Acquaintance1024non-nullint64
14Alone1024non-nullint64
15LivingDuration1024non-nullint64
16Livingcost1024non-nullint64
17Phonecost1024non-nullint64
18Distance1024non-nullint64
19Bicycle1024non-nullint64
20Motorbike1024non-nullint64
21PublicVehicle1024non-nullint64
22Othervehicle1024non-nullint64
As shown below, the descriptive statistics for the numerical columns provide an overview of their distributions.
Table A2 highlights the range and central tendency for variables like Age (mean ≈ 19.8 years, range 18–40), household size (Hhsize mean ≈ 2.35), and the categorical nature (coded as integers) of financial indicators like Tuition, HHIncome, HHExpenditure, Livingcost, Phonecost, and Distance.
Table A2. Descriptive statistics for numerical variables in the dataset.
CountMeanStdMin25%50%75%Max
Age102419.811521.4102761819202040
Hhsize10242.3544920.6333212234
Labours10241.8886720.52810412224
HHIncome10241.5664060.85021111124
HHExpenditure10242.8310551.11234612335
LivingDuration10242.9677731.07214612344
Livingcost10241.9775390.81678611224
Phonecost10242.1474610.82289712234
Distance10241.9833981.0372911234
For the binary categorical predictor variables (coded as 0 or 1), the primary descriptive statistics involve examining the frequency and proportion of observations in each category. Table A3 presents these counts and percentages for the key binary flags used in the models. For instance, it shows that 34.7% of the sample identified as male (Male = 1), and 48.9% reported having part-time work (Work = 1), while the mean of a 0/1 variable technically equals the proportion of the ‘1’ category, presenting counts and percentages is generally clearer for describing the composition of the sample regarding these attributes.

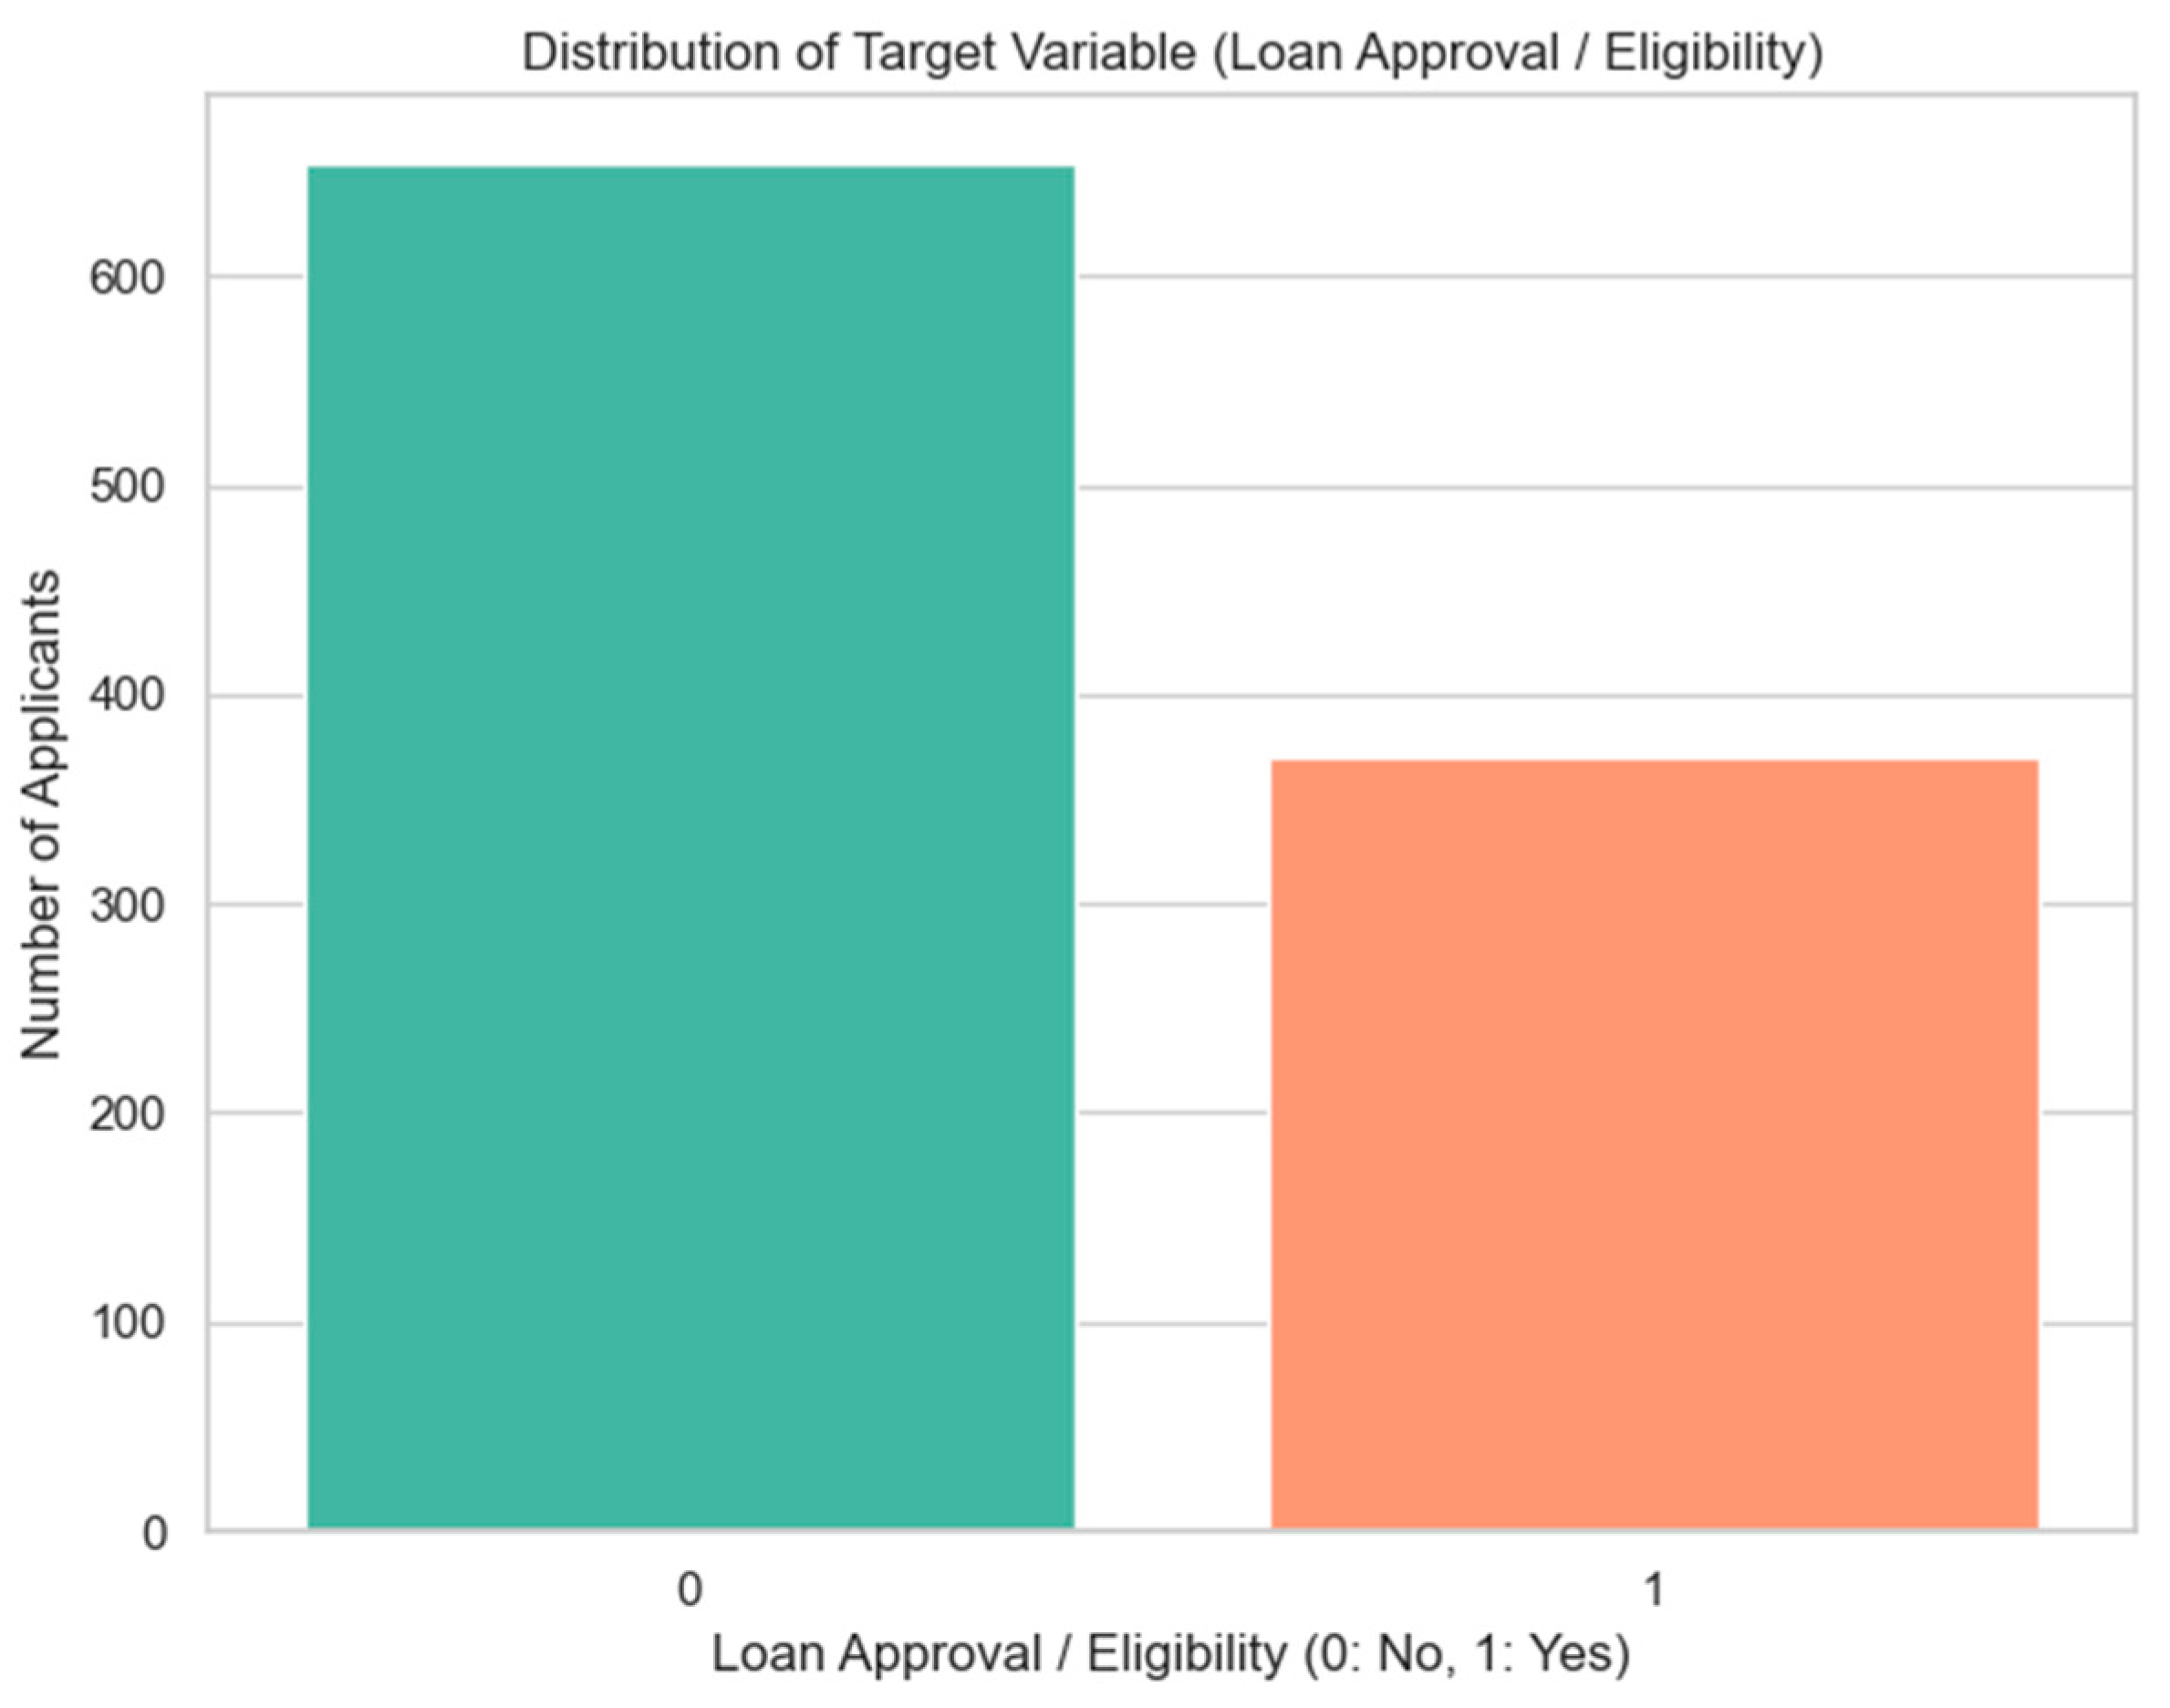
Appendix A.2. Target Variable Distribution

The primary target variable, Loan, indicates whether a student reported a prior borrowing experience (1 = Yes, 0 = No).
As shown in Figure A1, the dataset exhibits an imbalance: 653 students (approx. 63.8%) reported no prior borrowing experience (Loan = 0), while 371 students (approx. 36.2%) reported having borrowed previously (Loan = 1). This imbalance was considered during model evaluation using metrics like the F1-Score.
Figure A1. Distribution of the target variable ‘Loan’.
Risks 13 00099 g0a1

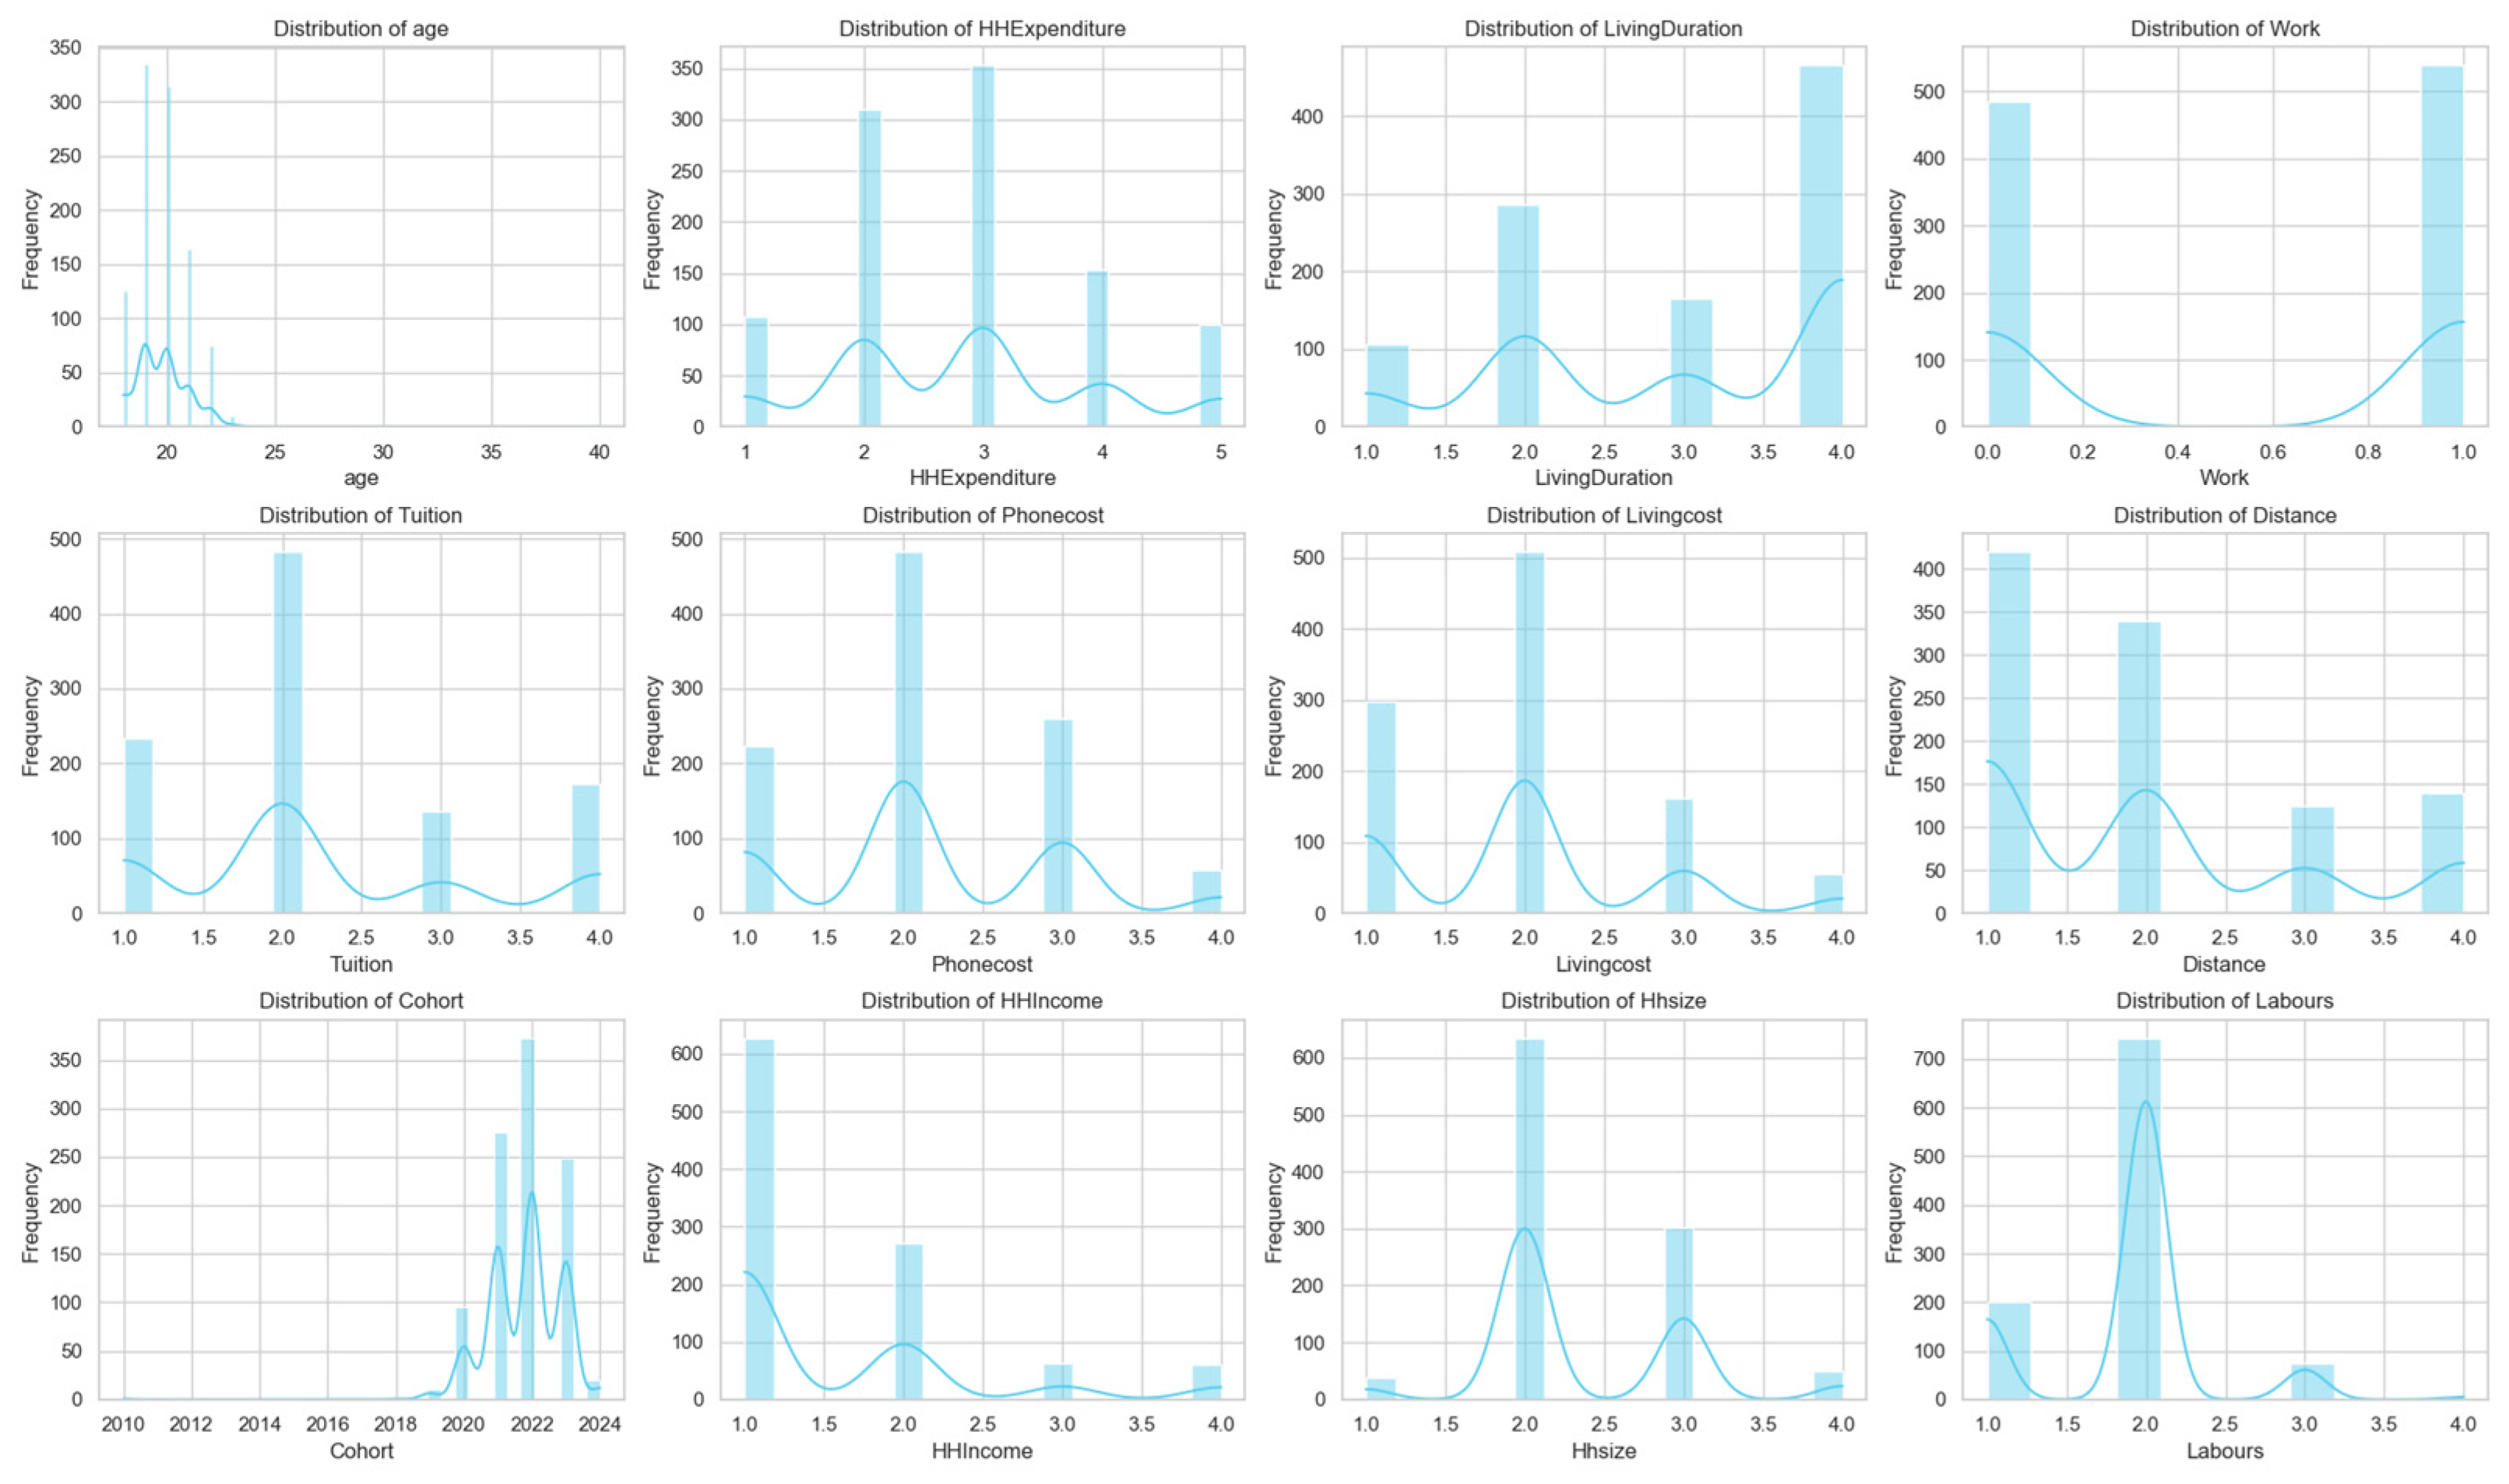
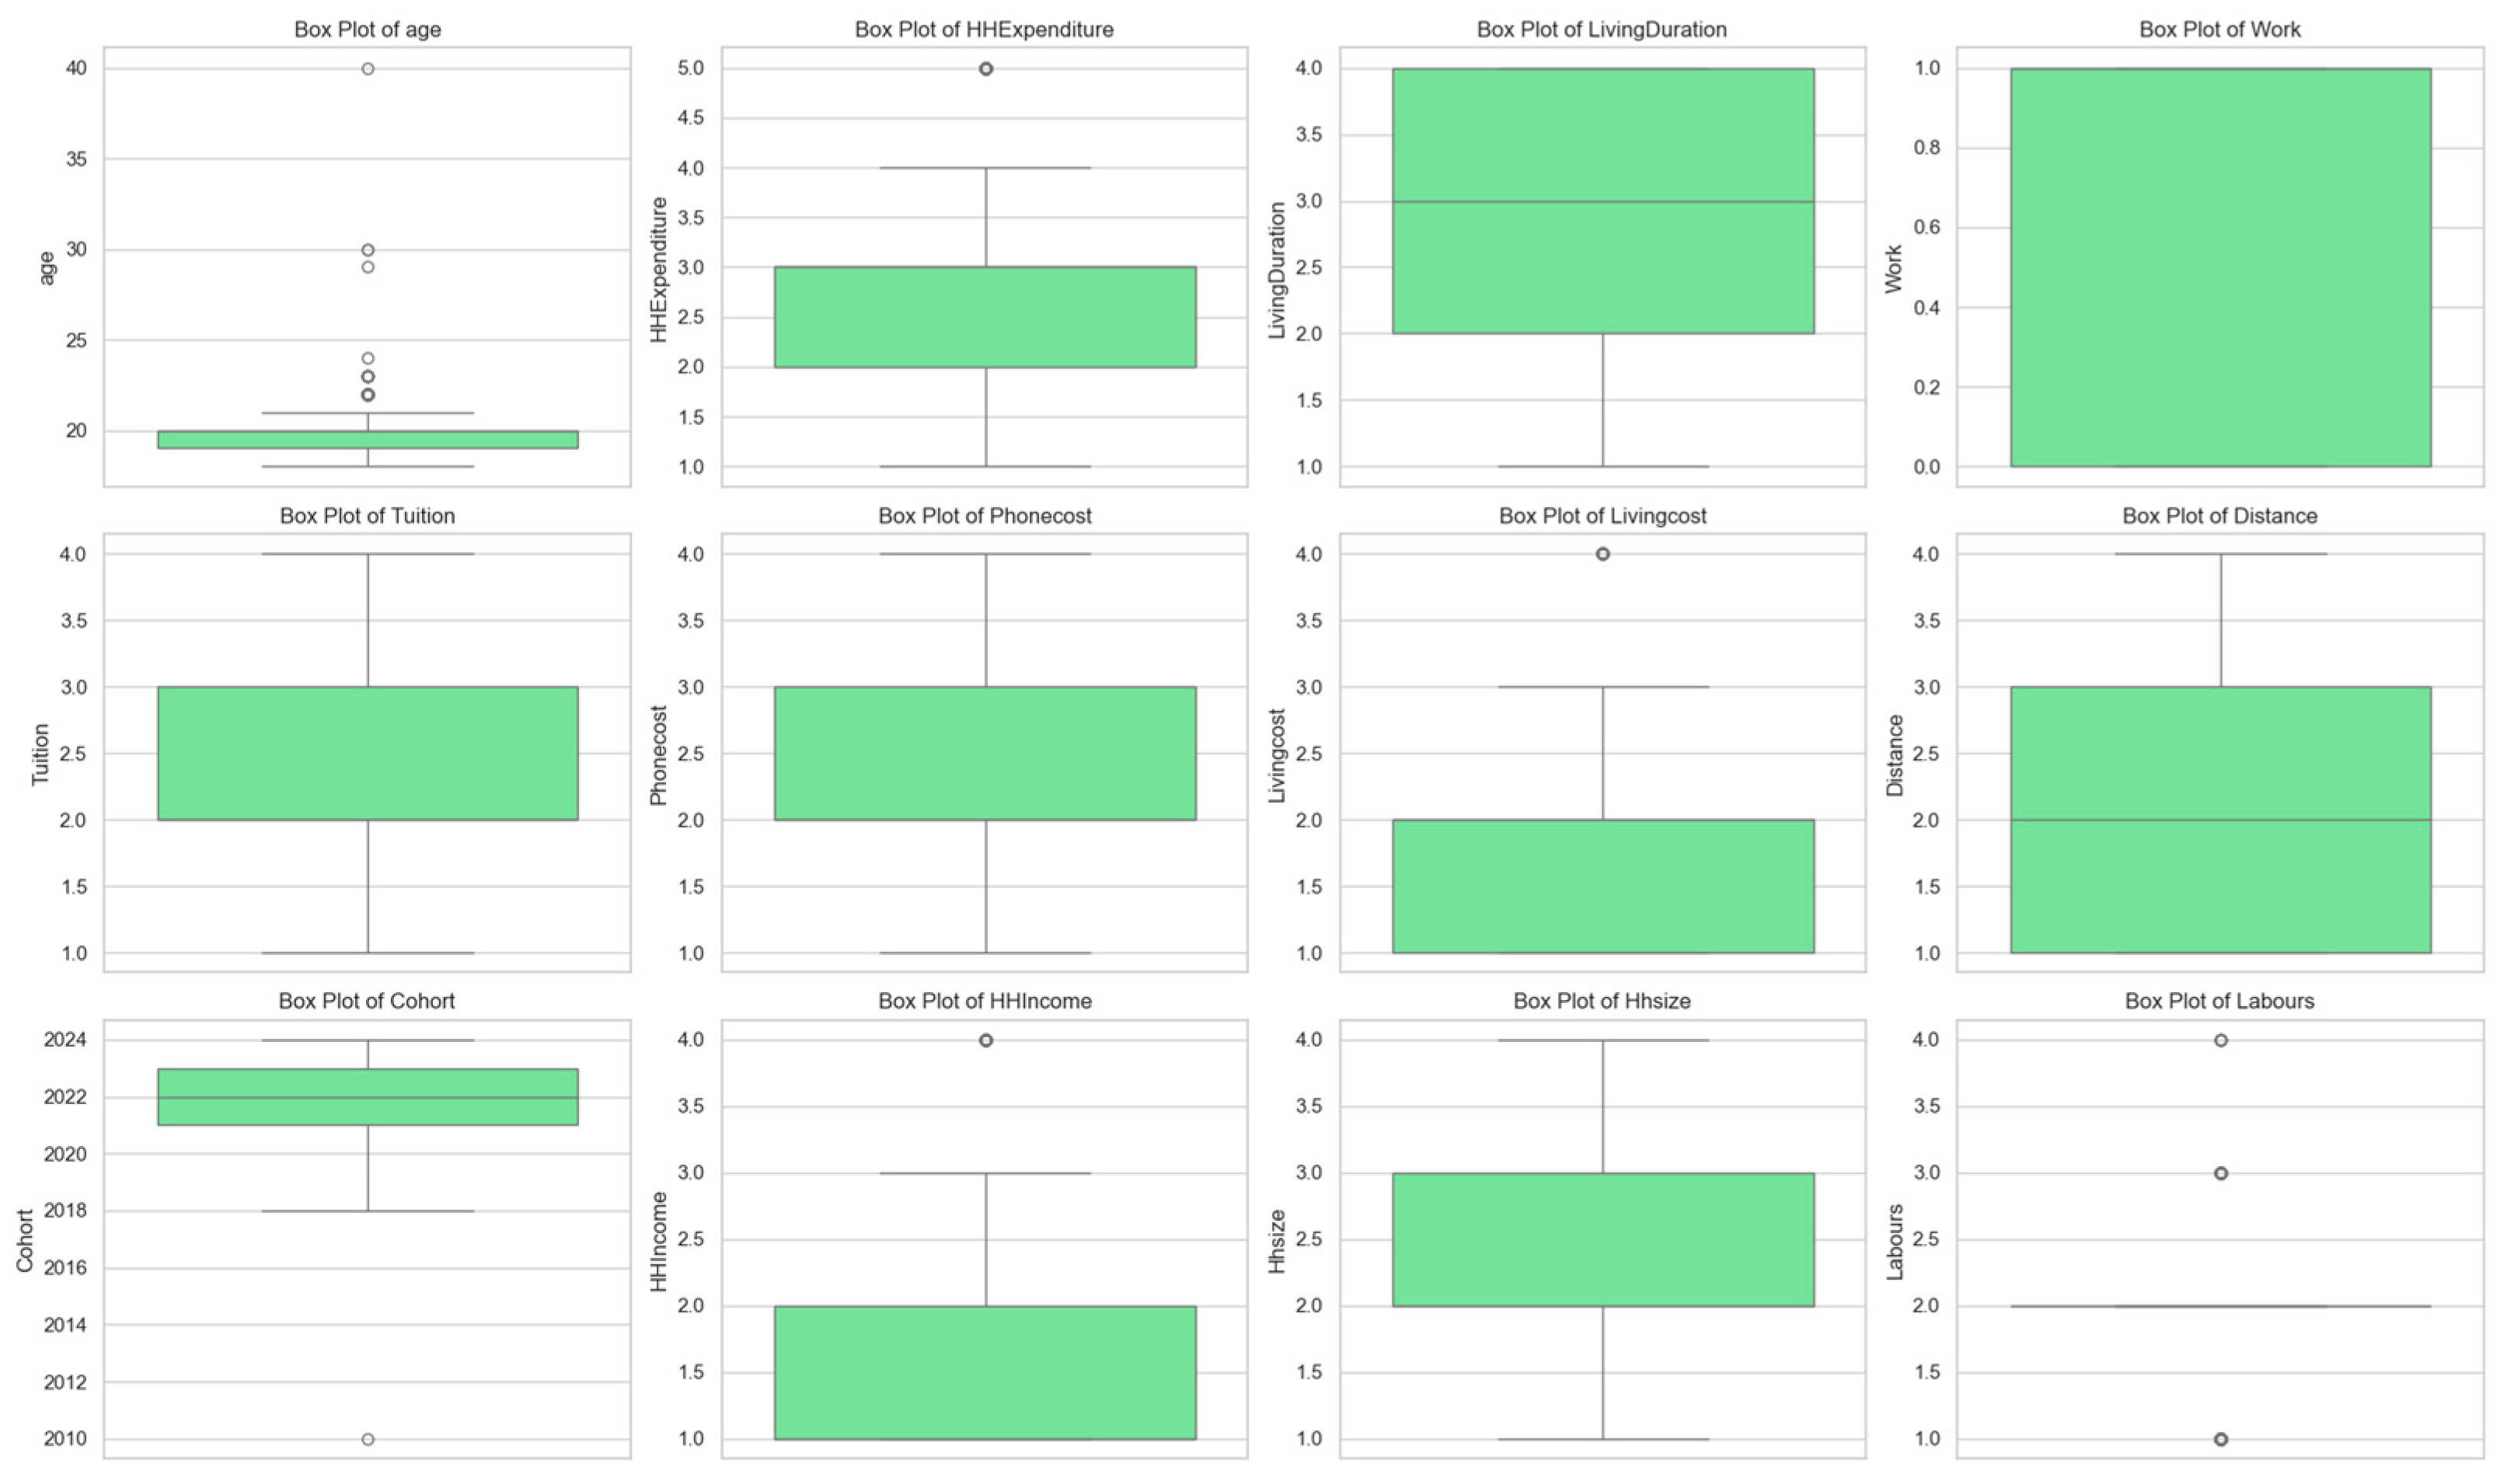
Appendix A.3. Univariate Analysis of Predictors

Key predictors were examined individually. Histograms and box plots were generated for key numerical/ordinal predictors identified from feature importance analysis (Figure 2 in the main text) and domain knowledge.
Figure A2 and Figure A3 illustrate the distributions. Age is concentrated around 19–21 years. Variables representing costs and expenditures (HHExpenditure, Livingcost, and Phonecost) show varying distributions reflecting the categorical ranges used in the survey. Cohort (enrollment year) is skewed towards more recent years, as expected in a university sample. Box plots help identify the median, interquartile range, and potential outliers for these variables.
Frequency analysis was performed on key binary categorical predictors.
Figure A2. Distribution histograms for key numerical/ordinal predictors.
Risks 13 00099 g0a2
Figure A3. Box plots illustrating the distribution and potential outliers (represented by circles beyond box plots) for key numerical/ordinal predictors.
Risks 13 00099 g0a3
Table A3. Frequency counts for key binary categorical predictors.
VariableCategory (Code = 1)Count (n = 1024)Percentage
MaleMale3550.347
WorkHas Part-time Job5010.489
DormLives in Dorm640.062
FamilyLives with Family4640.453
AcquaintanceLives with Acquaintance3460.338
AloneLives Alone1500.146
BicycleUses Bicycle280.027
MotorbikeUses Motorbike6620.646
PublicVehicleUses Public Transport1480.145
OthervehicleUses Other Transport1860.182
The analysis revealed the sample composition: approximately 34.7% were male (Male = 1). A significant portion reported having part-time work (Work = 1). Housing situations varied, with living with family or acquaintances being common. Transportation was dominated by motorbikes (Motorbike = 1), with public transport and other means being less frequent.

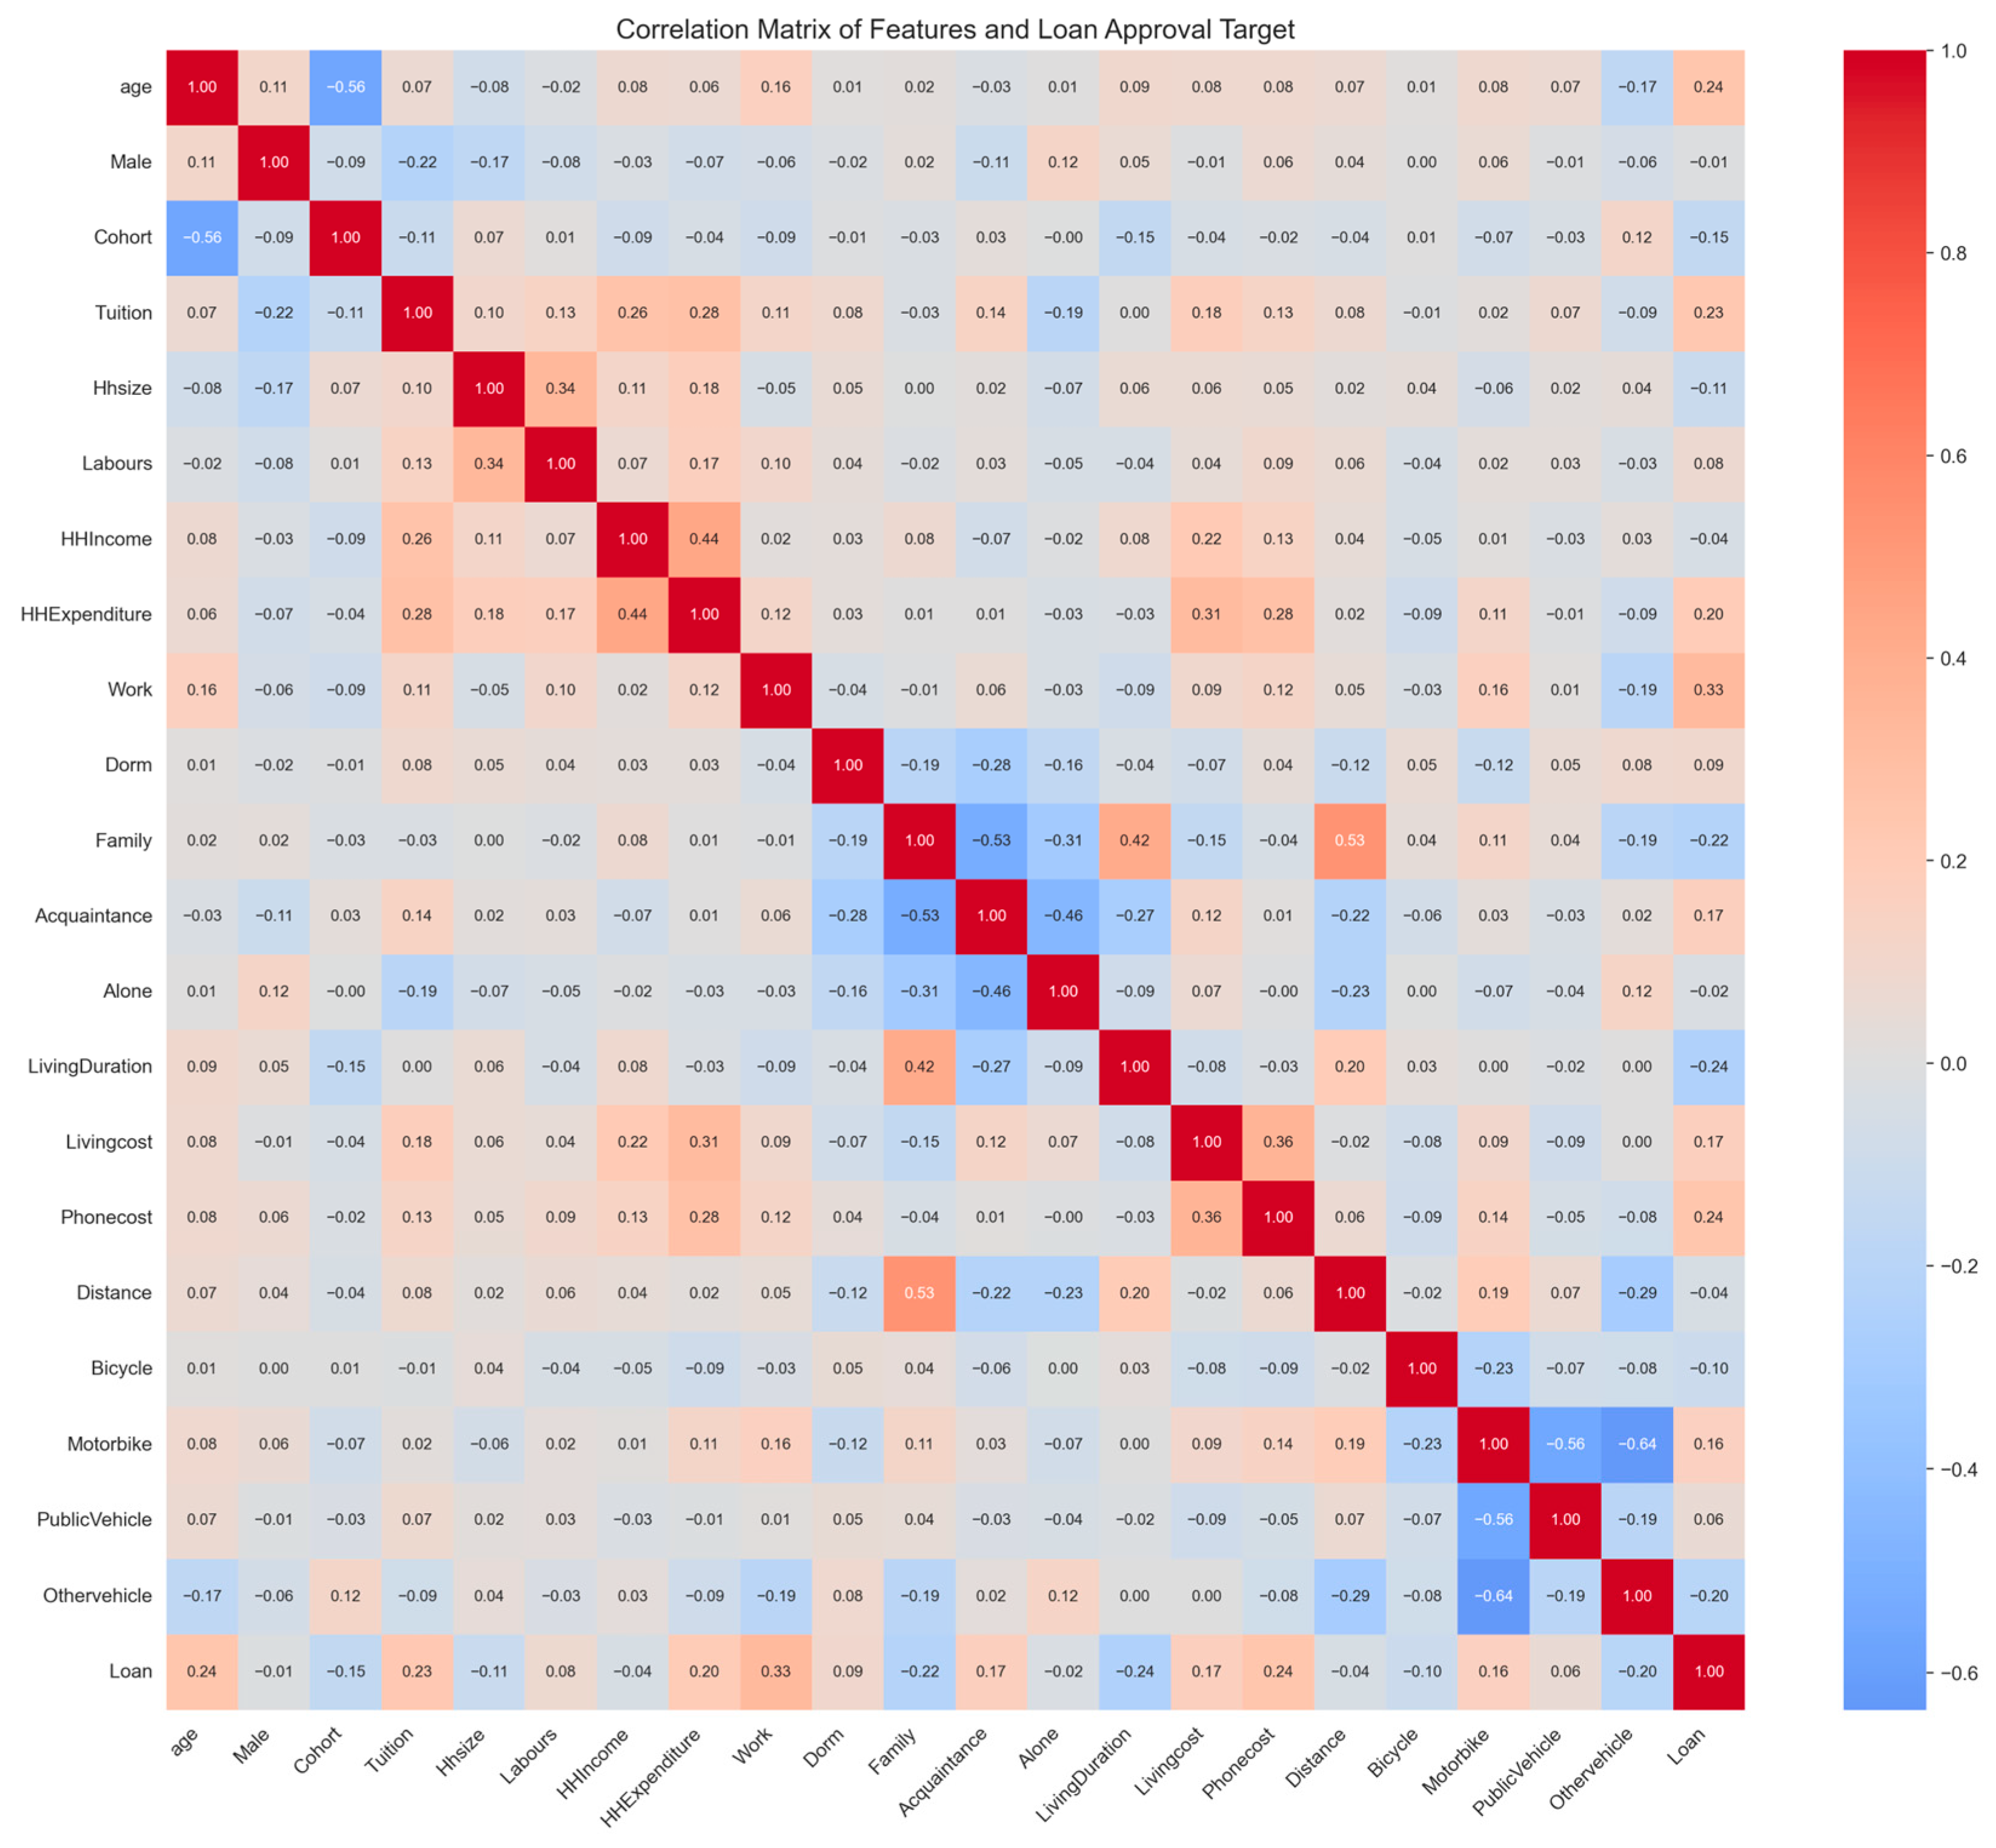
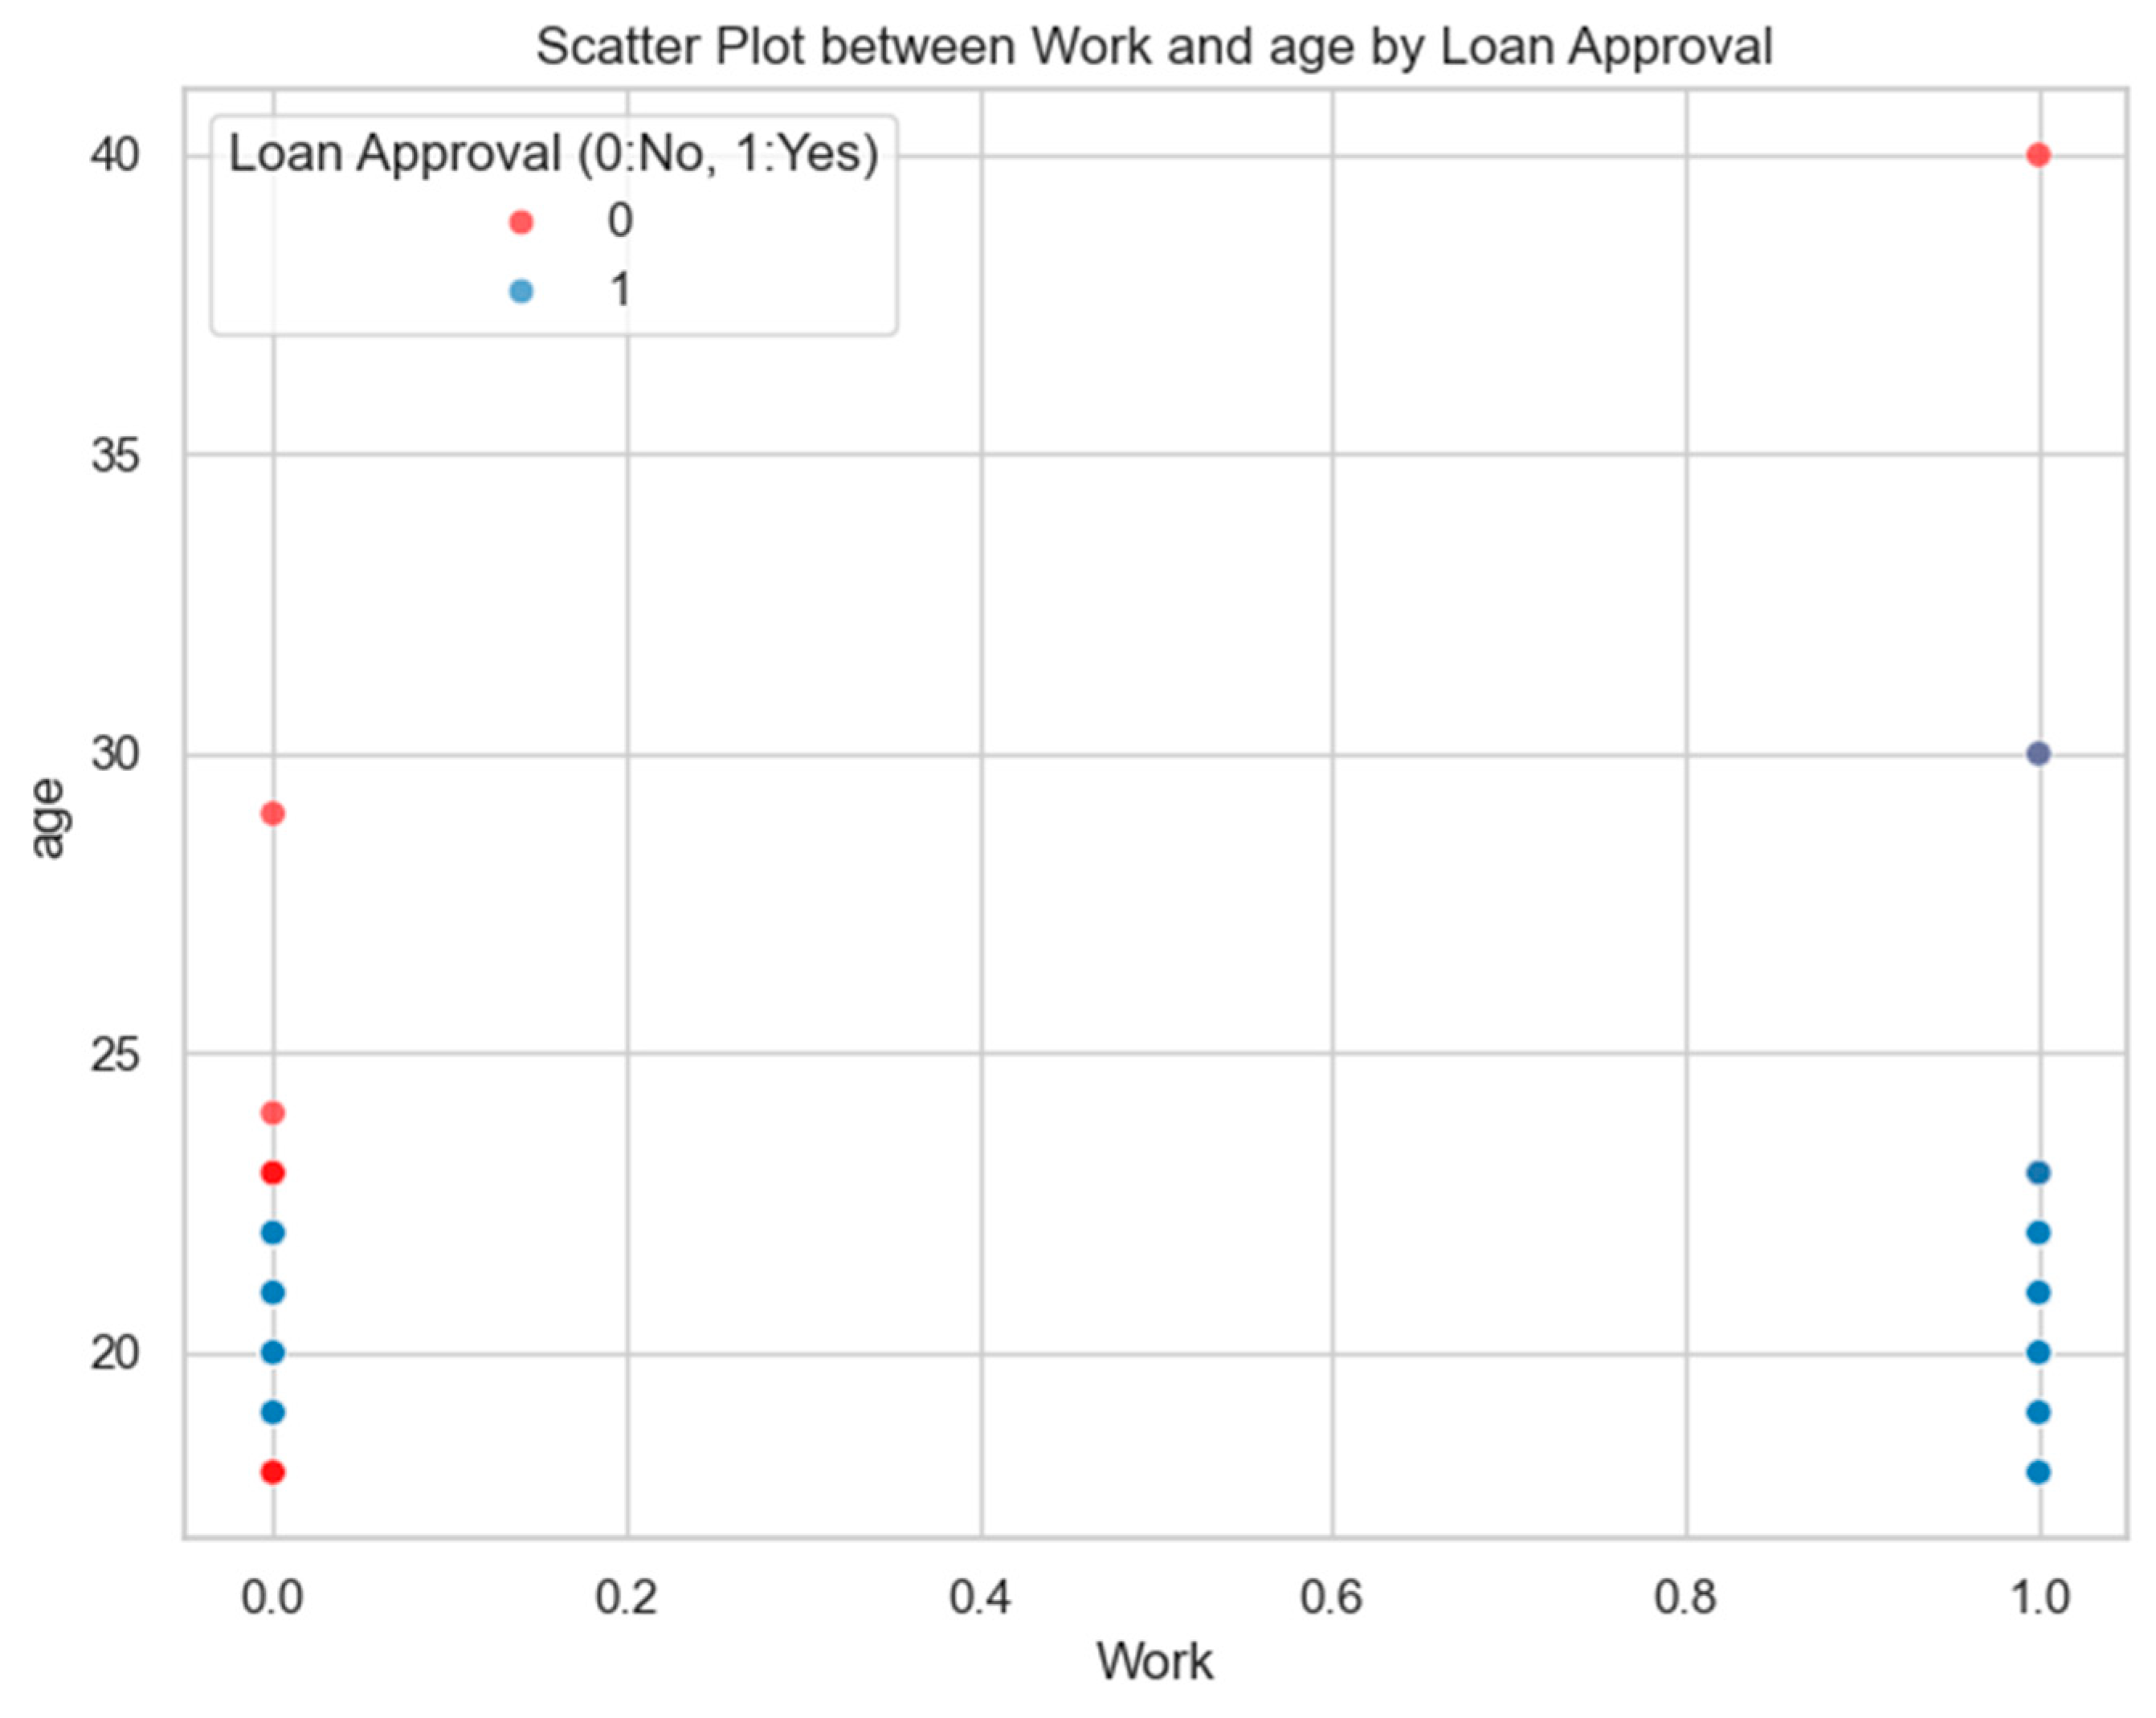
Appendix A.4. Bivariate Analysis

Relationships between variables were explored. A correlation heatmap was generated to visualize linear relationships between the numerical/ordinal predictors and the target variable Loan.
Figure A4 shows the pairwise correlations. Notable correlations with the target variable Loan include a positive correlation with Work (0.33) and Age (0.24), suggesting students who work part-time or are older are more likely to have borrowed. Negative correlations were observed, for instance, with Dorm (−0.22), indicating students in dorms were less likely to have borrowed. Correlations between predictors were generally low to moderate, mitigating major concerns about multicollinearity for models like Random Forest, although some relationships exist (e.g., Hhsize and Labours).
Figure A4. Correlation matrix heatmap for numerical/ordinal features and the target variable.
Risks 13 00099 g0a4
The relationship between the two predictors most correlated with Loan (Work and age) is visualized below and colored by Loan status.
Figure A5 visually confirms the trend that students who have borrowed (Loan = 1, typically shown in a different color) are more prevalent among those who work (Work = 1) and tend to be slightly older.
Figure A5. Scatter plot of part-time work status vs. age, colored by prior borrowing status.
Risks 13 00099 g0a5

Appendix B. Model Specifications

This appendix summarizes the key specifications and hyperparameter settings used for each of the four models evaluated in this study. Data preprocessing involved splitting the data (80% train, 20% test) and standard scaling for SVM and DNN models, as detailed in Section 3.
Table A4. Summary of Model Specifications and Hyperparameters.
ModelKey Parameters and Settings
Random Forest (RF)n_estimators: 100 trees
Splitting Criterion: Gini Index
max_depth parameter tuned via cross-validation
Gradient Boosting (GB)n_estimators: 100 iterations
learning_rate: 0.1
max_depth: 3
Strategy: Early stopping applied
Support Vector Machine (SVM)Kernel: RBF (Radial Basis Function)
Parameters C and gamma tuned via Grid Search
Input Data: Scaled
Probability obtained via Platt Scaling
Deep Neural Network (DNN)Framework: PyTorch
Architecture: Input → 2
Hidden Layers (64, 32 neurons, ReLU activation)
Optimizer: Adam (Learning Rate = 0.001)
Training: Max 100 Epochs with Early Stopping
Input Data: Scaled

References

  1. Abbas, Elaf Adel, and Nisreen Abbas Hussein. 2024. Algorithm comparison for data mining classification: Assessing bank customer credit scoring default risk. Jurnal Kejuruteraan 36: 1935–44. [Google Scholar] [CrossRef]
  2. Abdou, Hussein A., and John Pointon. 2011. Credit scoring, statistical techniques and evaluation criteria: A review of the literature. Intelligent Systems in Accounting, Finance and Management 18: 59–88. [Google Scholar] [CrossRef]
  3. Adams, Troy, and Monique Moore. 2007. High-Risk Health and Credit Behavior Among 18- to 25-Year-Old College Students. Journal of American College Health 56: 101–8. [Google Scholar] [CrossRef] [PubMed]
  4. Addo, Fenaba R., Jason N. Houle, and Daniel Simon. 2016. Young, black, and (still) in the red: Parental wealth, race, and student loan debt. Race and Social Problems 8: 64–76. [Google Scholar] [CrossRef]
  5. Adesanya, Mobolade E. 2024. Assessing credit risk through borrower analysis to minimize default risks in banking sectors effectively. International Journal of Research Publication and Reviews 5: 5479–93. [Google Scholar] [CrossRef]
  6. Andreeva, Ganila. 2006. European genetic scoring models using survival analysis. Journal of the Operational Research Society 57: 1180–87. [Google Scholar] [CrossRef]
  7. Babaei, Golnoosh, Paolo Giudici, and Emanuela Raffinetti. 2023. Explainable FinTech lending. Journal of Economics and Business 125–126: 106126. [Google Scholar] [CrossRef]
  8. Babaei, Golnoosh, Paolo Giudici, and Emanuela Raffinetti. 2025. A Rank Graduation Box for SAFE AI. Expert Systems With Applications 259: 125239. [Google Scholar] [CrossRef]
  9. Baker, Amanda R., and Catherine P. Montalto. 2019. Student loan debt and financial stress: Implications for academic performance. Journal of College Student Development 60: 115–20. [Google Scholar] [CrossRef]
  10. Banasik, John, and Johnathan Crook. 2007. Reject inference, augmentation, and sample selection. European Journal of Operational Research 183: 1582–94. [Google Scholar] [CrossRef]
  11. Banasik, John, Johnathan Crook, and L. Thomas. 2003. Sample selection bias in credit scoring models. Journal of the Operational Research Society 54: 822–32. [Google Scholar] [CrossRef]
  12. Bari, Hasanujamman, Shaharima Juthi, Asha Moni Mistry, and Md Kamrujjaman. 2024. A systematic literature review of predictive models and analytics in ai-driven credit scoring. Journal of Machine Learning, Data Engineering and Data Science 1: 1–18. [Google Scholar] [CrossRef]
  13. Baum, Sandy, and Patricia Steele. 2010. Who Borrows Most? Bachelor’s Degree Recipients with High Levels of Student Debt. The College Board Advocacy & Policy Center. Available online: https://trends.collegeboard.org/sites/default/files/trends-2010-who-borrows-most-brief.pdf (accessed on 28 March 2025).
  14. Bellotti, Tony, and Jonathan Crook. 2009. Support vector machines for credit scoring and discovery of significant features. Expert Systems with Applications 36: 3302–8. [Google Scholar] [CrossRef]
  15. Bengio, Yoshua, Aaron Courville, and Pascal Vincent. 2013. Representation learning: A review and new perspectives. IEEE Transactions on Pattern Analysis and Machine Intelligence 35: 1798–828. [Google Scholar] [CrossRef] [PubMed]
  16. Breiman, Leo. 2001. Random forests. Machine Learning 45: 5–32. [Google Scholar] [CrossRef]
  17. Chapman, Bruce, and Amy Y. C. Liu. 2013. Repayment Burdens of Student Loans for Vietnamese Higher Education, Crawford School Research Papers 1306, Crawford School of Public Policy, The Australian National University. Available online: https://ideas.repec.org/p/een/crwfrp/1306.html (accessed on 28 March 2025).
  18. Chen, Ziqeng. 2025. Machine learning in credit risk assessment: A comparative analysis of different models. Social Science Research Network. [Google Scholar] [CrossRef]
  19. Chen, Mu-chen, and Shih-Hsien Huang. 2003. Credit scoring and rejected instances reassigning through evolutionary computation techniques. Expert Systems with Applications 24: 433–41. [Google Scholar] [CrossRef]
  20. Fawcett, Tom. 2006. An introduction to ROC analysis. Pattern Recognition Letters 27: 861–74. [Google Scholar] [CrossRef]
  21. Fejza, Doris, Dritan Nace, and Orjada Kulla. 2022. The Credit Risk Problem—A Developing Country Case Study. Risks 10: 146. [Google Scholar] [CrossRef]
  22. Friedman, Jerome H. 2001. Greedy function approximation: A gradient boosting machine. The Annals of Statistics 29: 1189–232. [Google Scholar] [CrossRef]
  23. Géron, Aurélien. 2019. Hands-on machine learning with Scikit-Learn, Keras, and TensorFlow: Concepts, tools, and techniques to build intelligent systems (2nd ed.). O’Reilly Media. Physical and Engineering Sciences in Medicine 43: 1135–36. [Google Scholar] [CrossRef]
  24. Giudici, Paolo. 2024. Safe machine learning. Statistics 58: 473–77. [Google Scholar] [CrossRef]
  25. Golbayani, Parisa, Ionut Florescu, and Rupak Chatterjee. 2020. A comparative study of forecasting corporate credit ratings using neural networks, support vector machines, and decision trees. The North American Journal of Economics and Finance 54: 101251. [Google Scholar] [CrossRef]
  26. Greene, William H. 1997. Econometric Analysis, 3rd ed. Hoboken: Prentice Hall. [Google Scholar]
  27. Han, Bowen. 2024. Evaluating Machine Learning Techniques for Credit Risk Management: An Algorithmic Comparison. Applied and Computational Engineering 112: 29–34. [Google Scholar] [CrossRef]
  28. Hand, David J., So-Young Sohn, and Yoonseong Kim. 2005. Optimal bipartite scorecards. Expert Systems with Applications 29: 684–90. [Google Scholar] [CrossRef]
  29. Ho, Tin Kam. 1995. Random decision forests. Paper presented at 3rd International Conference on Document Analysis and Recognition, Montreal, QC, Canada, August 14–16; pp. 278–82. [Google Scholar] [CrossRef]
  30. Houle, Jason N. 2014. Disparities in debt: Parents’ socioeconomic resources and young adult student loan debt. Sociology of Education 87: 53–69. [Google Scholar] [CrossRef]
  31. Hussain, Abrar, Muddasir Ahamed Khan.N, Ayub Ahamed K S, and Kousarziya. 2024. Enhancing Credit Scoring Models with Artificial Intelligence: A Comparative Study of Traditional Methods and AI-Powered Techniques. In QTanalytics Publication (Books). Delhi: QTanalytics Publication, pp. 99–107. [Google Scholar] [CrossRef]
  32. Huynh, Thi Tu Trinh. 2017. Improving the Business Personal Credit Scoring Model at Vietnam Bank for Agriculture and Rural Development—Hai Chau Branch, Da Nang City. Master’s thesis, Business Administration, Economics University—Da Nang University, Da Nang, Vietnam. [Google Scholar]
  33. Iwase, Maomi. 2011. Current Situation on Consumer Credit in Vietnam: Legal Framework for Formal Financial Sector. Japan Social Innovation 1: 40–45. [Google Scholar] [CrossRef]
  34. Jackson, Brandon A., and John R. Reynolds. 2013. The Price of Opportunity: Race, Student Loan Debt, and College Achievement. Sociological Inquiry 83: 335–68. [Google Scholar] [CrossRef]
  35. James, Gareth, Daniela Witten, Trevor Hastie, and Robert Tibshirani. 2013. An Introduction to Statistical Learning. New York: Springer. [Google Scholar] [CrossRef]
  36. Kimani, Grace W., J.K Mwai, and E. Mwangi. 2024. A Deep Learning Based Hybrid Model Development for Enhanced Credit Score Prediction. International Journal of Research and Innovation in Applied Science IX: 250–62. [Google Scholar] [CrossRef]
  37. Kiviat, Barbara. 2019. The Moral Limits of Predictive Practices: The Case of Credit-Based Insurance Scores. American Sociological Review 84: 1134–58. [Google Scholar] [CrossRef]
  38. Knutson, Maelissa L. 2020. Credit Scoring Approaches Guidelines. World Bank Group. Available online: https://thedocs.worldbank.org/en/doc/935891585869698451-0130022020/CREDIT-SCORING-APPROACHES-GUIDELINES-FINALWEB (accessed on 28 March 2025).
  39. Kotb, Naira, and Chrstian R. Proaño. 2023. Capital-constrained loan creation, household stock market participation and monetary policy in a behavioural New Keynesian model. International Journal of Finance & Economics 28: 3789–807. [Google Scholar] [CrossRef]
  40. Kuhn, Max, and Kjell Johnson. 2018. Applied Predictive Modeling, 2nd ed. Berlin/Heidelberg: Springer. [Google Scholar]
  41. Lainez, Nicolas, and Jodi Gardner. 2023. Algorithmic Credit Scoring in Vietnam: A Legal Proposal for Maximizing Benefits and Minimizing Risks. Asian Journal of Law and Society 10: 401–32. [Google Scholar] [CrossRef]
  42. Le, Thi Thanh Tan, and Thi Viet Duc Dang. 2016. Personal customer credit rating at Vietnam National Credit Information Center. Journal of Finance 12: 42–46. [Google Scholar]
  43. Le, Thinh. 2017. An overview of credit report/credit score models and a proposal for vietnam. VNU Journal of Science: Policy and Management Studies 33: 36–45. [Google Scholar] [CrossRef]
  44. Le, Van Triet. 2010. Improving the Personal Credit Rating System of Asia Commercial Joint Stock Bank. Master’s thesis, University of Economics Ho Chi Minh City, Ho Chi Minh City, Vietnam. [Google Scholar]
  45. Lee, I-Fei Chen, Chih-Chou Chiu, Chi-Jie Lu, and I-Fei Chen. 2002. Credit scoring using the hybrid neural discriminant technique. Expert Systems with Applications 23: 245–54. [Google Scholar] [CrossRef]
  46. Lee, Tian-Shyug, and I-Fei Chen. 2005. A two-stage hybrid credit scoring model using artificial neural networks and multivariate adaptive regression splines. Expert Systems with Applications 28: 743–52. [Google Scholar] [CrossRef]
  47. Lessmann, Stefan, Bart Baesens, Hsin-Vonn Seow, and Lyn C. Thomas. 2015. Benchmarking state-of-the-art classification algorithms for credit scoring: An update of research. European Journal of Operational Research 247: 124–36. [Google Scholar] [CrossRef]
  48. Lochner, L., and A. Monge-Naranjo. 2016. Student loans and repayment. In Handbook of the Economics of Education. Edited by Eric Hanushek, Stephen Machin and Ludger Woessmann. Amsterdam: Elsevier, vol. 5, pp. 397–478. [Google Scholar] [CrossRef]
  49. Luo, Bin, Qi Zhang, and Somya D. Mohanty. 2018. Data-Driven Exploration of Factors Affecting Federal Student Loan Repayment. arXiv arXiv:1805.01586. [Google Scholar] [CrossRef]
  50. Mai, Nhat Chi. 2014. Building a Credit Rating Model for Individual Customers of DongA Commercial Joint Stock Bank. OSF Preprints, Center for Open Science. Available online: https://econpapers.repec.org/scripts/redir.pf?u=https%3A%2F%2Fosf.io%2Fdownload%2F622498921e399c02af600b78%2F;h=repec:osf:osfxxx:2z7uq (accessed on 28 March 2025).
  51. Malesky, Edmund J., and Markus Taussig. 2009. Where is credit due? Legal institutions, connections, and the efficiency of bank lending in Economics Vietnam. The Journal of Law, & Organization 25: 535–78. [Google Scholar] [CrossRef]
  52. Malik, Reza Firsandaya, and Hermawan. 2018. Credit Scoring Using CART Algorithm and Binary Particle Swarm Optimization. International Journal of Electrical and Computer Engineering (IJECE) 8: 5425. [Google Scholar] [CrossRef]
  53. Malohlava, Michal, and Arno Candel. 2020. Gradient Boosting Machine with H2O, 7th ed. H2O. ai. Available online: https://h2o-release.s3.amazonaws.com/h2o/rel-zahradnik/7/docs-website/h2o-docs/booklets/GBMBooklet.pdf (accessed on 28 March 2025).
  54. Mendes-Da-Silva, Wesley, Wilson Toshiro Nakamura, and Daniel Carrasqueira De Moraes. 2012. Credit card risk behavior on college campuses: Evidence from Brazil. BAR-Brazilian Administration Review 9: 351–73. [Google Scholar] [CrossRef]
  55. Meng, Xiaoqi, Lihan Jia, Shuo Chen, Yu Zhou, and Chang Liu. 2025. Comparative study of classical machine learning models in credit scoring. IET Conference Proceedings 2024: 220–26. [Google Scholar] [CrossRef]
  56. Mestiri, Samir. 2024. Credit scoring using machine learning and deep learning-based models. Data Science in Finance and Economics 4: 236–48. [Google Scholar] [CrossRef]
  57. Mienye, Ebikella, Nobert Jere, George Obaido, Ibomoiye Domor Mienye, and Kehinde Aruleba. 2024. Deep Learning in Finance: A Survey of Applications and Techniques. AI 5: 2066–91. [Google Scholar] [CrossRef]
  58. Mukhanova, Ayagoz, Madiyar Baitemirov, Azamat Amirov, Bolat Tassuov, Valentina Makhatova, Assemgul Kaipova, Ulzhan Makhazhanova, and Tleugaisha Ospanova. 2024. Forecasting creditworthiness in credit scoring using machine learning methods. International Journal of Power Electronics and Drive Systems 14: 5534–42. [Google Scholar] [CrossRef]
  59. Ong, Chorng-Shyong, Jih-Jeng Huang, and Gwo-Hshiung Tzeng. 2005. Building credit scoring models using genetic programming. Expert Systems with Applications 29: 41–47. [Google Scholar] [CrossRef]
  60. Organisation for Economic Co-Operation and Development. 2025. Recommendation of the Council on OECD Legal Instruments: Good Practices on Financial Education and Awareness Relating to Credit. Paris: OECD Publishing. Available online: https://legalinstruments.oecd.org/public/doc/78/78.en.pdf (accessed on 28 March 2025).
  61. Orgler, Yair E. 1971. Evaluation of bank consumer loans with credit scoring models. Journal of Bank Research 2: 31–37. [Google Scholar]
  62. Powers, David Martin Ward. 2011. Evaluation: From precision, recall and F-measure to ROC, informedness, markedness and correlation. Journal of Machine Learning Technologies 2: 37–63. [Google Scholar] [CrossRef]
  63. Robb, Cliff A., and Marry Beth Pinto. 2010. College students and credit card use: An analysis of financially at-risk students. College Student Journal 44: 823–35. [Google Scholar]
  64. Sarlija, Natasa, Mirta Benčić, and Zoran Bohacek. 2004. Multinomial model in consumer credit scoring. Paper presented at 10th International Conference on Operational Research (KOI 2004), Trogir, Croatia, September 22–24. [Google Scholar]
  65. Sayed, Eslam Husein, Amerah Alabrah, Kamel Hussein Rahouma, Muhammad Zohaib, and Rasha M. Badry. 2024. Machine learning and deep learning for loan prediction in banking: Exploring ensemble methods and data balancing. IEEE Access 12: 193997–4019. [Google Scholar] [CrossRef]
  66. Schmitt, Marc. 2022. Deep Learning vs. Gradient Boosting: Benchmarking state-of-the-art machine learning algorithms for credit scoring. arXiv arXiv:2205.10535. [Google Scholar] [CrossRef]
  67. Shukla, Deepak, and Sunil Gupta. 2024. A Survey of Machine Learning Algorithms in Credit Risk Assessment. Journal Electrical Systems 20: 6290–97. [Google Scholar] [CrossRef]
  68. Shukla, Rahul, Rupali Sawant, and Renuka Pawar. 2023. A Comparative Study of Deep Learning and Machine Learning Techniques in Credit Score Classification. International Journal of Innovative Research in Computer and Communication Engineering 11: 10004–10. [Google Scholar] [CrossRef]
  69. Sokolova, Marina, and Guy Lapalme. 2009. A systematic analysis of performance measures for classification tasks. Information Processing & Management 45: 427–37. [Google Scholar] [CrossRef]
  70. Steenackers, A., and M.J. Goovaerts. 1989. A credit scoring model for personal loans. Insurance: Mathematics and Economics 8: 31–34. [Google Scholar] [CrossRef]
  71. Šušteršič, Maja, Dusan Mramor, and Juze Zupan. 2009. Consumer credit scoring models with limited data. Expert Systems with Applications 36: 4736–44. [Google Scholar] [CrossRef]
  72. Tai, Le Quy, and Giang Thi Thu Huyen. 2019. Deep Learning Techniques for Credit Scoring. Journal of Economics, Business and Management 7: 93–96. [Google Scholar] [CrossRef]
  73. Teles, Germanno, Joel J. P. C. Rodrigues, Ricardo A. L. Rabêlo, and Sergei A. Kozlov. 2021. Comparative study of support vector machines and random forests machine learning algorithms on credit operation. Software: Practice and Experience 51: 2492–500. [Google Scholar] [CrossRef]
  74. Tran, Khanh Quoc, Binh Van Duong, Linh Quangc Tran, An Le-Hoai Tran, An Trong Nguyen, and Kiet Van Nguyen. 2021. Machine Learning-Based Empirical Investigation for Credit Scoring in Vietnam’s Banking. In Advances and Trends in Artificial Intelligence. From Theory to Practice. Cham: Springer, pp. 564–74. [Google Scholar] [CrossRef]
  75. Van Trung, Truong, and Ngoc Anh Nguyen Vuong. 2024. Development of a credit scoring model using machine learning for commercial banks in Vietnam. Advances and Applications in Statistics 92: 107–20. [Google Scholar] [CrossRef]
  76. Vapnik, Vladimir N. 1998. Statistical Learning Theory. New York: Wiley. [Google Scholar]
  77. Vu, Mai. 2024. Consumer credit in Vietnam from 2019 to 2023: Current situation and recommendations. Journal of Economics—Law and Banking 270. [Google Scholar] [CrossRef]
  78. Wang, Xiang, Min Xu, and Özgur Tolga Pusatli. 2015. A Survey of Applying Machine Learning Techniques for Credit Rating: Existing Models and Open Issues. In Neural Information Processing. ICONIP 2015. Lecture Notes in Computer Science. Edited by S. Arik, T. Huang, W. Lai and Q. Liu. Cham: Springer, vol. 9490. [Google Scholar] [CrossRef]
  79. Zhang, Haichao, Ruishuang Zeng, Linling Chen, and Shhangfeng Zhang. 2020. Research on personal credit scoring model based on multi-source data. Journal of Physics: Conference Series 1437: 012053. [Google Scholar] [CrossRef]
Figure 1. Credit Scoring Approaches. *—Often used as ML baseline. **—Model evaluated in this study.
Risks 13 00099 g001
Figure 2. Research process.
Risks 13 00099 g002
Figure 3. Feature Importance in the Random Forest Model.
Risks 13 00099 g003
Figure 4. Feature Importance in the Gradient Boosting Model.
Risks 13 00099 g004
Table 1. Comparison of models based on classification metrics.
ModelTrain AccuracyTest AccuracyConfusion MatrixClass 0 (Precision/Recall/F1)Class 1 (Precision/Recall/F1)Macro Avg F1
Random Forest95.8%82%[[121, 18], [19, 47]]86%/87%/0.8772%/71%/0.720.79
Gradient Boosting99.9%75%[[107, 32], [20, 46]]~84%/~77%/0.8059%/70%/0.640.72
Support Vector Machine98.3%80%[[125, 14], [25, 41]]83%/90%/0.8775%/62%/0.680.77
Pytorch DNN86.2%85.5%[[125, 14], [20, 46]]86%/90%/0.8877%/70%/0.730.81
Table 2. Training process metrics of the DL model.
ModelInitial LossFinal LossNumber of Epochs
DL (PyTorch)0.54460.225620
Table 3. Information Attributes.
CategoryInformation AttributesRelevant Literature
Personal InformationAge, gender, hometown, current residence, and duration of stayBaker and Montalto (2019)
Academic BackgroundUniversity, program, major, enrollment year (admission year), Grade Point Average, academic conduct scores, and TuitionJackson and Reynolds (2013); Adams and Moore (2007)
Family Financial StatusHousehold income, monthly expenses, number of dependents, and number of working-age family membersAddo et al. (2016); Houle (2014)
Part-time EmploymentJob type, working hours, income, and job stabilityRobb and Pinto (2010); Mendes-Da-Silva et al. (2012)
Credit and Loan HistoryMost recent loan, lending institution, loan amount, term, interest rate, and loan purposeBaker and Montalto (2019); Baum and Steele (2010)
Living Conditions and TransportationHousing type, living expenses, main means of transportation, and travel costsRobb and Pinto (2010)
Table 4. Variable descriptions used in the model.
CategoryVariablesDescription
Personal InformationIDIdentifier
AgeAge
GenderMale, female
AcademicCohortCohort group (e.g., year of admission)
TuitionTuition fee
Families FinanceHhsizeNumber of family members
LaboursNumber of working members in the family
HHIncomeHousehold income
HHExpenditureHousehold expenditure
Employment and housingWorkHaving a part-time job or not
DormLiving in a dormitory
FamilyLiving with family
AcquaintanceLiving with acquaintances
AloneLiving alone
LivingDurationDuration of residence at current place
Personal expenditureLivingcostTotal living expenses
PhonecostMobile phone expenses
TransportationDistanceDistance from residence to school
BicycleTraveling by bicycle
MotorbikeTraveling by motorbike
PublicVehicleUsing public transportation
OthervehicleOther means of transportation
Disclaimer/Publisher’s Note: The statements, opinions and data contained in all publications are solely those of the individual author(s) and contributor(s) and not of MDPI and/or the editor(s). MDPI and/or the editor(s) disclaim responsibility for any injury to people or property resulting from any ideas, methods, instructions or products referred to in the content.

