Article

The Role of Digital Financial Services in Narrowing the Gender Gap in Low–Middle-Income Economies: A Bayesian Machine Learning Approach

by
Alicia Fernanda Galindo-Manrique
* and
Nuria Patricia Rojas-Vargas
Acounting and Finance Academic Department, Tecnologico de Monterrey, Monterrey 64700, Mexico
*
Author to whom correspondence should be addressed.
Risks 2025, 13(5), 96; https://doi.org/10.3390/risks13050096
Submission received: 16 March 2025 / Revised: 15 April 2025 / Accepted: 22 April 2025 / Published: 14 May 2025

Abstract

:
Women in emerging economies face unique constraints rooted in cultural norms, socio-economic disparities, and limited access to education and technology. Narrowing the digital gender gap by ensuring access to financial services may reduce the economic inequalities for women in these countries. This study examines the influence of digital finance in narrowing the gender gap, guided by the research question: To what extent do digital financial services contribute to narrowing the gender gap in access to and usage of financial services in low-and middle-income economies? Gender inclusion was measured by the ratio of accounts owned by women over the total number of accounts. Digital financial inclusion was constructed based on eight components: mobile money account, storing money in financial institutions, Internet access, mobile phone owned, savings, savings in financial institutions, making or receiving a digital payment, and mobile phone or use of the Internet for shopping. A Bayesian regression approach was computed using the Global Findex Database data for 73 countries classified as low and lower-middle-income economies from 2011 to 2022. The Machine Learning approach evaluates the model’s ability to predict women’s autonomy and the role of digital finance. The results show that digital financial services would reduce the gender gap in low-income economies while augmenting the number of open accounts, especially for women. The results aid in the establishment of policies to reduce the gender gap. These results are relevant to the UNSDG agenda, mainly Goal 5 and Goal 10.

1. Introduction

Mobile money has become a crucial enabler of financial inclusion, particularly for women, as it drives account ownership and the usage for mobile payments, savings, and borrowing (Demirgüç-Kunt et al. 2022). The Global Findex survey (Demirgüç-Kunt et al. 2022) highlighted that the lack of funds, the distance to the nearest financial institution, and inadequate documentation were consistently cited by the 1.4 billion unbanked adults as some of the main reasons they did not have an account. Therefore, governments and financial service providers, such as fintechs, can help expand financial access, reduce barriers, and enhance infrastructure.
According to the Global Findex survey (Demirgüç-Kunt et al. 2022), 76 percent of adults had an account at a bank or a regulated institution such as credit unions, microfinance institutions, or mobile money service providers. Mobile money refers to financial services that allow individuals to store, send, and receive money using a mobile phone without needing a traditional bank account. It is especially impactful in emerging economies, where it serves as a tool for financial inclusion by reaching unbanked and underbanked populations (Donovan 2012; Jack and Suri 2014)
From 2011 to 2021, account ownership increased by 50 percent. In developing economies, the average rate of account ownership has increased by eight points, from 63 percent of adults to 71 percent of adults. In developing economies, the share of account owners using digital payments has grown from 35 percent in 2014 to 57 percent in 2021.
Digital financial services (DFS) are financial services that are accessed and delivered through digital channels (Ebong and George 2021). DFS includes e-money, digital wallets and payment platforms, loans, savings, insurance, and investment. The proliferation of mobile money and technological innovations in banking has significantly transformed traditional banking services, expanding opportunities for unbanked individuals and marginalized groups, including women. Women encounter challenges accessing financial services due to lower literacy, digital exclusion, and limited technology access.
The enhancement in women’s financial inclusion is contingent upon the empowerment of women (Khare et al. 2024), which in turn influences their growth and productivity. Empowering women to unlock their earning potential can reduce income disparity, increase growth, and improve development outcomes (Women’s World Banking 2017). According to Ahang (2014), achieving parity in the female labor force participation rate with males could potentially inject an additional $28 trillion into the global GDP. However, fulfilling gender parity remains an arduous attempt. Projections of UN Women (2024) suggest gender parity could span an extensive time frame of approximately 130 years.
The main objective of providing financial services through digital platforms is to ease access, reduce poverty, and increase economic growth. In recent years, numerous governments and central banks worldwide have embarked on initiatives towards financial inclusion as a driver to shift economic growth and reduce gender inequity (World Bank Group 2014). Technological advancements have catalyzed an increase in Financial Inclusion, heralding the era of Digital Financial Inclusion (Khera et al. 2021; Oanh and Dinh 2024). Digital Financial Inclusion leverages the Internet and mobile devices to deliver financial services, improving the conventional infrastructure such as bank branches or Automated Teller Machines (ATMs) (Le Quoc 2024). Ozili (2018) argues that digital finance empowers economic actors, such as women, who may encounter barriers to formal financial services, providing more options for capital provision and utilization and optimizing economic resources.
In low-income economies, women’s restricted access to digital technologies has widened the gender gap. Women in these regions are disproportionately excluded from formal financial services due to systemic barriers such as lack of documentation, restricted mobility, and sociocultural norms (Suri and Jack 2016). Studies indicate that mobile money via DFS and technology helps bridge the gender gap and drives innovation in the financial sector, particularly in developing economies. (Demirgüç-Kunt et al. 2022). Although low- and lower-middle-income economies have significantly improved, much work remains. Figure 1 presents the comparative evolution of population reporting using mobile money, measured in percentage.
According to the World Bank’s Global Findex Database (Demirgüç-Kunt et al. 2022), women are 7% less likely than men to have a bank account in developing regions. This exclusion perpetuates cycles of poverty, limits entrepreneurial opportunities, and curtails women’s agency in household and community decision-making. The United Nations Sustainable Development Goal (SDG) number 5 establishes the importance of gender equality, highlighting the pivotal role of economic empowerment in achieving broader developmental objectives (Canton 2021). Therefore, digital financial services emerge as a beacon of hope, offering scalable, cost-effective, and accessible solutions to bridge this gap. Figure 2 presents the essential components of DFS: Introducing new services, the infrastructure, the benefits, and the risks.
This article examines the potential of DFS in narrowing the gender gap in emerging economies. Specifically, it explores the hypothesis that increasing women’s access to digital financial tools enhances their economic participation and fosters broader social and developmental outcomes. Drawing on empirical evidence and theoretical frameworks, the article addresses the following question: To what extent do digital financial services contribute to narrowing the gender gap in access to and usage of financial services in low-income and middle-income economies?
The hypothesis underpinning this article is that when effectively designed and deployed, digital financial services can serve as catalysts for reducing the gender gap in low-income economies. This assertion is supported by emerging evidence from countries such as Zimbabwe and Niger, where mobile money and digital platforms have empowered women to participate more actively in the economy (Aker et al. 2016; Siwela and Njaya 2021). However, the extent to which these outcomes can be generalized across diverse contexts still needs to be explored, requiring a deeper investigation.
This research is significant because it has the potential to provide evidence-based strategies for promoting gender equity through financial innovation in low-income and lower-middle-income economies. This article identifies best practices and contextual factors and contributes to the growing literature advocating for gender-responsive financial inclusion policies (Chirwa and Chiwaula 2022). Moreover, the findings presented here have implications for various stakeholders, from financial institutions and technology providers to development organizations and policymakers.
The role of DFS in addressing the gender gap in financial inclusion is an urgent and promising area of study. This article will argue that leveraging digital technologies to empower women financially is a matter of economic justice and a crucial step toward achieving inclusive and sustainable development in emerging economies. This article is divided into five sections. Section 2 presents the theoretical foundation and previous studies. Section 3 describes the methodology and introduces the Machine Learning Approach, while Section 4 presents the Bayesian Logistic Regression analysis results. Section 5 provides conclusions and policy implications.

2. Review of the Existing Literature

2.1. Theoretical Frameworks

Gender inequality is a barrier in many countries, especially in developing ones. As stated in the work of Cuberes and Teignier (2014), disparities in outcomes and opportunities between men and women are showcased across various dimensions, including education, earnings, occupations, access to formal employment, access to entrepreneurship, access to productive inputs, political representation, or bargaining power inside the household. Financial ecosystems play a crucial role. Ross (2004) argued that reducing asymmetric information results from available investment opportunities and capital through the financial sector.
From a production–function perspective, defined as a tool for measuring economic development through the relationship between maximum technically feasible output and the inputs required to produce that output (Shephard 1970), the transformation of investments and savings into economic output necessitates financial development and technological advancement (Schumpeter 1912). Furthermore, Schumpeterian Growth Theory establishes the notion of creative destruction as the process by which innovations replace older technologies and create growth. Schumpeter (1912) underscored the necessity of a strong financial sector for fostering entrepreneurial innovation. Without access to financing, innovation would not happen, impeding sustained economic growth and technological advancements in the long term (Le Quoc 2024). Digital Financial inclusion represents the evolution of creative destruction by introducing innovative financial services that promote savings among low-income individuals (Odeniran and Udeaja 2010).
Another theory contributing to sustained economic growth is the productivity theory (Sen 1995), which states that economic growth is influenced by the uneven distribution of power, including education, politics, labor, and gender equality. However, improvements in gender parity in aspects such as education, labor market, and institutional representation contribute more to growth (Altuzarra et al. 2021). The equitable participation of women in the economy contributes to creating an environment conducive to innovation, diversification, and sustainable development (Le Quoc 2024). Although women play a crucial role in developing economies, the lack of access to financial services prohibits women in many nations from improving their welfare, resulting in overrepresentation in low-skilled and undervalued occupations such as domestic work (Eagly and Karau 2002). Therefore, deploying digital technologies in the financial sector is crucial to narrowing the gender gap.
Additionally, the human capital theory, initially formulated by Becker (1962) and Rosen (1976), argues that workers possess various abilities that can be enhanced through training and education. By excluding women from opportunities such as education and labor market participation, gender inequality increases, leading to a lower return on human capital. On the other hand, women in the labor market increase the bargaining power within the family. This results in economic growth and increased savings (Klasen and Wink 2003). Seguino and Floro (2003) note that women prioritize investments in their children’s health and education. This focus, in turn, develops human capital for future generations, further fueling economic growth.
The theories discussed above offer various perspectives on the contribution of digital financial inclusion, gender inequality, and economic growth. Education, technology advancements, access to the labor market, and opportunities are some factors that contribute to gender equality and foster economic growth, as well as the level of financial development. The degree of financial development in emerging economies is crucial in influencing the accessibility and effectiveness of adopting digital financial services. The following section explores this relationship in applied studies across different countries.

2.2. Gender Gap in Emerging Economies

The gender gap in financial inclusion remains a critical global challenge, with systemic barriers limiting women’s access to financial services. Women in emerging markets and developing economies face unique constraints rooted in cultural norms, socio-economic disparities, and limited access to education and technology. Studies such as Roy and Patro (2022) emphasize that structural factors such as inadequate credit access and societal biases perpetuate gendered inequities in financial systems. These disparities have far-reaching implications for economic development, as financial inclusion is a key driver of empowerment and poverty alleviation.
Digital financial tools offer a promising avenue for reducing the gender gap, yet disparities persist. Several studies highlight the level of inequality in countries. Ghosh and Chaudhury (2022) found that in India, men are more likely to use digital finance, while women face obstacles like limited financial literacy and technology access. These barriers exacerbate existing inequalities, underscoring the need for policies that enhance digital inclusion for women. Integrating gender-sensitive approaches in digital finance can empower women by providing them with safer, more convenient, and autonomous access to financial services.
Lee et al. (2021) examined this issue in Bangladesh, highlighting the importance of gender-specific interventions. Their findings show that tailored programs addressing barriers such as financial literacy and economic constraints significantly increase women’s engagement with mobile banking. By providing tools and resources that directly address the challenges faced by women, these interventions enable broader adoption and empower women to participate more actively in the financial system.
Financial inclusion efforts in India face several structural and individual-level barriers, particularly for women. Goel (2023) explored the trends and reforms in this area, identifying low earnings and inadequate financial literacy as key obstacles. The study emphasizes that reforms in microfinance and access to financial services are essential to overcoming these challenges. Addressing these issues can bridge the gender gap by equipping women with the knowledge and tools to access and utilize financial systems effectively.
Socio-economic and cultural constraints significantly hinder women’s financial inclusion. Research by Cicchiello et al. (2021) highlights how societal norms and economic barriers limit women’s participation in financial markets across emerging economies. Factors such as lower income levels, rural residency, and restricted mobility are identified as key obstacles. Addressing these issues requires a holistic approach that combines policy reform, community engagement, and education to dismantle the entrenched norms restricting women’s financial agency.
The study by Armand et al. (2020) sheds light on the critical role of financial inclusion in reducing gender disparities in economic participation, focusing on the structural barriers that women face. Their research identifies that women in developing countries are significantly underrepresented in formal financial systems due to factors such as limited access to credit, lack of collateral, and discriminatory practices. Furthermore, the study highlights that financial inclusion has a transformative impact on women’s economic empowerment, particularly when combined with targeted policies that address gender norms and support small business development. The authors argue that promoting gender equality in financial systems enhances individual well-being and fosters broader economic growth, making gender-inclusive financial reform a priority for policymakers worldwide.
The gender gap in financial inclusion is also pronounced in Sub-Saharan Africa, as evidenced by Reynolds et al. (2023), who studied mobile money usage in countries like Kenya and Nigeria. Their findings indicate that education levels, marital status, and societal perceptions influence gender gaps in awareness and adoption of mobile money. Women often need more resources and support to engage with financial technologies, further marginalizing them in a rapidly digitizing economy. To bridge this gap, initiatives to increase women’s financial literacy and access to mobile technology are essential.
The research of Mukong and Amadhila (2021) examines the interplay between financial inclusion and economic inequality, focusing on gender disparities in Sub-Saharan Africa. Their research highlights that women face substantial barriers to financial inclusion due to limited access to credit, lower financial literacy, and structural inequalities in labor markets. The findings indicate that gender gaps in financial inclusion not only perpetuate economic disparities but also hinder broader economic growth and poverty reduction efforts. The authors emphasize that targeted interventions—such as promoting financial literacy and creating women-focused financial products—can significantly enhance women’s participation in formal financial systems and contribute to closing the gender gap in economic opportunities.
Financial inclusion has far-reaching benefits beyond economic empowerment, as evidenced by its impact on household well-being. In Rwanda, Bali Swain and Nsabimana (2024) demonstrated that improved financial access, such as through tontine savings models, positively influences nutrition among rural households. This connection highlights the broader socio-economic benefits of financial inclusion, suggesting that empowering women financially not only addresses gender disparities but also enhances overall household welfare and resilience.
The study by Balliester Reis (2022) explores the critical role of financial inclusion in addressing gender inequality, emphasizing how improving women’s access to financial services can foster economic empowerment. The research highlights that women often face systemic barriers, such as limited financial literacy, lack of access to credit, and restrictive societal norms, which hinder their participation in financial systems. Reis underscores the transformative impact of tailored financial tools and education programs in helping women manage resources, invest in opportunities, and achieve greater economic independence. The study concludes that promoting gender-sensitive financial policies reduces inequality and creates more inclusive and equitable economic systems.
Cultural norms often exacerbate these disparities, restricting women’s mobility and decision-making autonomy, which are critical for engaging with financial services. Cicchiello et al. (2021). Moreover, digital financial technologies, while promising, often widen the gap due to unequal access to technology and education. Addressing the economic gender gap in emerging economies requires targeted interventions that combine digital inclusion strategies, services and policy reforms to ensure equitable access and community-based initiatives to challenge entrenched biases and empower women economically.
Across various contexts, the studies illustrate that financial inclusion is a multi-dimensional challenge, requiring targeted strategies to address gender-specific barriers. Interventions in mobile banking, microfinance reforms, and financial literacy promotion emerge as critical tools in reducing the gender gap. Moreover, the findings highlight the intersection between financial access and broader socio-economic outcomes, such as nutrition and household well-being in the long run. Based on this theoretical framework, the hypothesis of this study is posited as follows:
H: Digital finance services narrow the gender gap in low–middle-income economies.

3. Methodology

3.1. Data Source and Sample Selection

To verify the hypothesis, this study used data from the World Bank Group Gender Data Portal from 2011 to 2022. Digital Finance Inclusion measured by CPIA gender equality rating was obtained from the World Bank Group, CPIA database (http://www.worldbank.org/ida (accessed on 1 November 2024)). To compare the level of education in these countries, this study presents the variable of literacy rate. The UNESCO Institute for Statistics (UIS) compiled the literacy rate based on national censuses and household surveys. The Global Age-Specific Literacy Projection Model (GALP) was used for countries without recent literacy data. In the next section, the concepts and variables will be defined. The database was filtered by income groups.
Table 1 shows 70 countries by Income Classification, Global Gender Equality Rating, and Literacy Rate. Data are also aggregated using the World Bank classification for low-income and lower-middle-income in developing regions. For the 2025 fiscal year, low-income economies are defined as those with a GNI per capita, calculated using the World Bank Atlas Method, of $1145 or less in 2023. Lower middle-income economies have a GNI per capita between $1146 and $4515 (World Bank Group 2024, CPIA database).
The CPIA Gender Equality Rating equality, shown in Table 1, assesses how the country has installed institutions and programs to enforce laws and policies that promote equal access for men and women in education, health, the economy, and protection under the law. This indicator integrates 16 criteria grouped into four clusters: economic management, structural policies, policies for social inclusion and equity, and public sector management and institutions. Countries are rated on a scale of 1 (low) to 6 (high). More specifically, the CPIA measures the extent to which a country’s policy and institutional framework supports sustainable growth and poverty reduction and, consequently, the effective use of development assistance (World Bank Group 2024, CPIA database). Low–middle-income countries present a better score than low-income economies.
The last column of Table 1 presents the literacy rate as part of the Gender Parity Index. The gender parity index for youth literacy rate is the ratio of females to males aged 15–24 who can read and write with understanding a short, simple statement about their everyday life. Literacy statistics for most countries cover the population ages 15 and older. It measures the accumulated outcomes of primary education over the previous 10 years by indicating the proportion of the population who have passed through the primary education system and acquired basic literacy and numeracy skills. A literacy rate of less than 1 suggests women are more disadvantaged than boys in learning opportunities, and a rate greater than 1 indicates the contrary. Literate women can seek better economic opportunities and are empowered to play a meaningful societal role.

3.2. Variables

This research tests the hypothesis that access to digital finance services decreases the gender gap in low-income and lower-middle-income economies. To test the hypothesis, the Gender Equality Rating is regressed on digital inclusion while controlling for other variables.
Gender_Inclusion = Digital_Financial_Services + Literacy_Rate + Account + Population_Growth
The dependent variable, Gender Inclusion (GI), was measured by computing the ratio of accounts owned by women over the total number of accounts as a proxy for gender financial inclusion. Binsuwadan et al. (2024) state that the relationship between financial inclusion and gender equality can be measured with data on account ownership to assess the impact on women’s financial empowerment for the Kingdom of Saudi Arabia. Access to financial services strongly influences women’s financial empowerment. According to Ghosh (2022) and Kazemikhasragh et al. (2022), the account variable was measured by participants to indicate having an account (by themselves or jointly with another person) at a bank or other type of financial institution and whether they have used a mobile money service during the previous year.
The explanatory variable of interest is Digital Financial Services (DI). As discussed in the Review of The Existing Literature section, measuring DI is complex due to its multifaceted nature. Relying on a single variable is inadequate. Hence, the construction of indexes is employed to capture financial inclusion. Following the work of Khera et al. (2021) and Oanh (2024), our study constructs DI using eight components: Mobile money account, Store money in Financial Institutions, Internet access, Mobile phone owned, Savings, savings in Financial Institutions, Made or received a digital payment, and Mobile phone or use of the Internet for shopping. This is also aligned with the studies of Adegbite and Machethe (2020). Their research used mobile money awareness and mobile phone ownership to measure digital inclusion in Nigeria. Duvendack et al. (2023) also added mobile Internet users to measure India’s advances in promoting digital financial inclusion.
Social and cultural barriers, as well as education, are factors that affect gender disparities. Based on the research of Le Quoc (2024), our study uses literacy rate to capture the level of inequities in gender. Hasler and Lusardi (2017) highlighted that women exhibit lower literacy rate levels than men, and they emphasize how education can influence gender participation in financial systems. According to the Global Findex Database, the literacy rate is an outcome indicator used to evaluate educational attainment. These data can predict the quality of the future labor force and can be used to ensure policies for life skills for men and women. Literacy is part of the Gender Parity Index (GPI). A GPI of less than 1 suggests women are more disadvantaged in learning opportunities. Eliminating gender disparities in education would help increase the status and capabilities of women. Literate women imply that they can seek and use information for the betterment of the health, nutrition, and education of their household members. Literate women are also empowered to play a meaningful role.
Other instrumental variables of the model include the percentage of the population who report having an account at a bank or other formal financial institution and the rate of the population who report having an account at a bank or another type of financial institution (Acc). Osei-Tutu and Weill (2021) measured financial inclusion by examining three main variables: the number of accounts, credits, and savings in financial institutions.
As a control variable, we employ the annual population growth rate (Pop_G) following the research of Khera et al. (2021). This variable allows an understanding of the evolution of financial digital inclusion over time in low-income and lower-middle-income countries. Table 2 shows the sources of the variables/series from where data were gathered, the unit of measure, and the aggregation method.

3.3. Method

The main variable GI was computed as follows:
G I j = W j 1 X 1 + W j 2 X 2 + W j 3 X 3 + W j 4 X 4 W j 8 X 8
where weights ( W j 1 ,   W j 2 ,   W j 3 ,   W j 4 ,   W j 5 ,   W j 6 ,   W j 7   a n d   W j 8 ) are assigned to each component. X 1 , X 2 ,   X 3 , X 4 ,   X 5 ,   X 6 ,   X 7   a n d   X 8 , represent the measured variables. Following established practices in composite index construction (OECD 2008; Greco et al. 2019), we adopt an equal weighting approach to ensure transparency, interpretability, and comparability across countries. This method is especially useful when all indicators are conceptually distinct and of equal theoretical relevance and when the goal is to avoid arbitrary data-driven biases that may arise from empirical weighting methods such as PCA.
To mitigate biases due to measurement unit differences, the normalization technique using scaling data between 0 and 1 is crucial. This study followed the method using min–max normalization suggested by Jain and Bhandare (2011) and Oanh (2024). To ensure the index falls within the range of 0–1, we normalized GI using the next formula:
G I i = G I i G I m i n G I m a x G I m i n
In this study, we employ Bayesian logistic regression due to its advantages in modeling binary outcomes under uncertainty. This approach allows us to estimate a full posterior distribution for the model parameters, enabling a more comprehensive understanding of uncertainty in both the estimates and predictions (Gelman et al. 2013). Unlike frequentist methods, the Bayesian framework facilitates the incorporation of prior knowledge, which is particularly relevant when dealing with small or noisy datasets (Van de Schoot et al. 2021). Furthermore, the use of priors introduces a natural form of regularization, mitigating the risk of overfitting in models with many predictors (McElreath 2020). The probabilistic nature of Bayesian modeling also enhances interpretability and transparency, which is essential for applications where decision-making must be justified with credible intervals rather than point estimates. These features make Bayesian logistic regression a suitable and robust choice for our research objectives.
Bayesian logistic analysis was computed to analyze the dataset variables from 2011 to 2022. Bayesian analysis is a statistical analysis that answers research questions about unknown parameters of statistical models by using probability statements. Bayesian analysis rests on the assumption that all model parameters are random quantities and thus can incorporate prior knowledge. In the Bayesian approach, the statistics are not only based on the current data but also on prior information. Prior information represents the theoretical basis, such that the results depend on the known facts combined with observed data (Van de Schoot and Depaoli 2014).
Bayesian analysis begins with specifying a posterior model. The posterior model outlines the probability distribution of all model parameters based on the observed data and existing prior knowledge. It consists of two components: a likelihood, which reflects information about the model parameters derived from the observed data, and a prior, which incorporates prior knowledge (before observing the data) concerning the model parameters. The likelihood and prior models are combined using Bayes’ rule to generate the posterior distribution:
Theorem 1.
P o s t e r i o r   L i k e l i h o o d × P r i o r
The posterior probability has two components: a likelihood function, which gives information on model parameters based on observed data, and prior information, which includes prior information on the model parameters. Posterior probability could be estimated using the following methods: Markov Chain Monte Carlo (MCMC), Metropolis–Hasting (MH), and Gibbs. In this study, the MH algorithm was performed to identify determinants of gender gap financial inclusion for low-income and lower-middle economies. Trung and Quynh (2022) used the same methodology to study the financial inclusion determinants in Asian countries. Regarding posterior probability, Metropolis et al. (1953) were the first to propose the Metropolis algorithm, and Hastings (1970) developed a more efficient algorithm. According to Gelfand and Smith (1990), the Gibbs sample method is a special case of the MH algorithm.
The general econometric model is presented as follows:
G I i = α 0 + α 1 D I _ R a t e i + α 2 L i t _ R a t e i + α 3 A c c i + α 4 P o p _ G i + ε i
where i refers to the country, α 0 is constant, α i (i = 1;…;4) are the regression coefficients of the explanatory variables, and ε i is the error. The measurements for the variables are presented in Table 2. The descriptive statistics are presented in Table 3. Table 4 shows the matrix of correlation. The correlation matrix analysis aims to evaluate the degree of correlation between the independent variables in the model to avoid possible multicollinearity in the estimation (Gujarati 2002). Gujarati (2002) argues that multicollinearity occurs when the correlation coefficient between the independent variables is greater than or equal to 0.85.
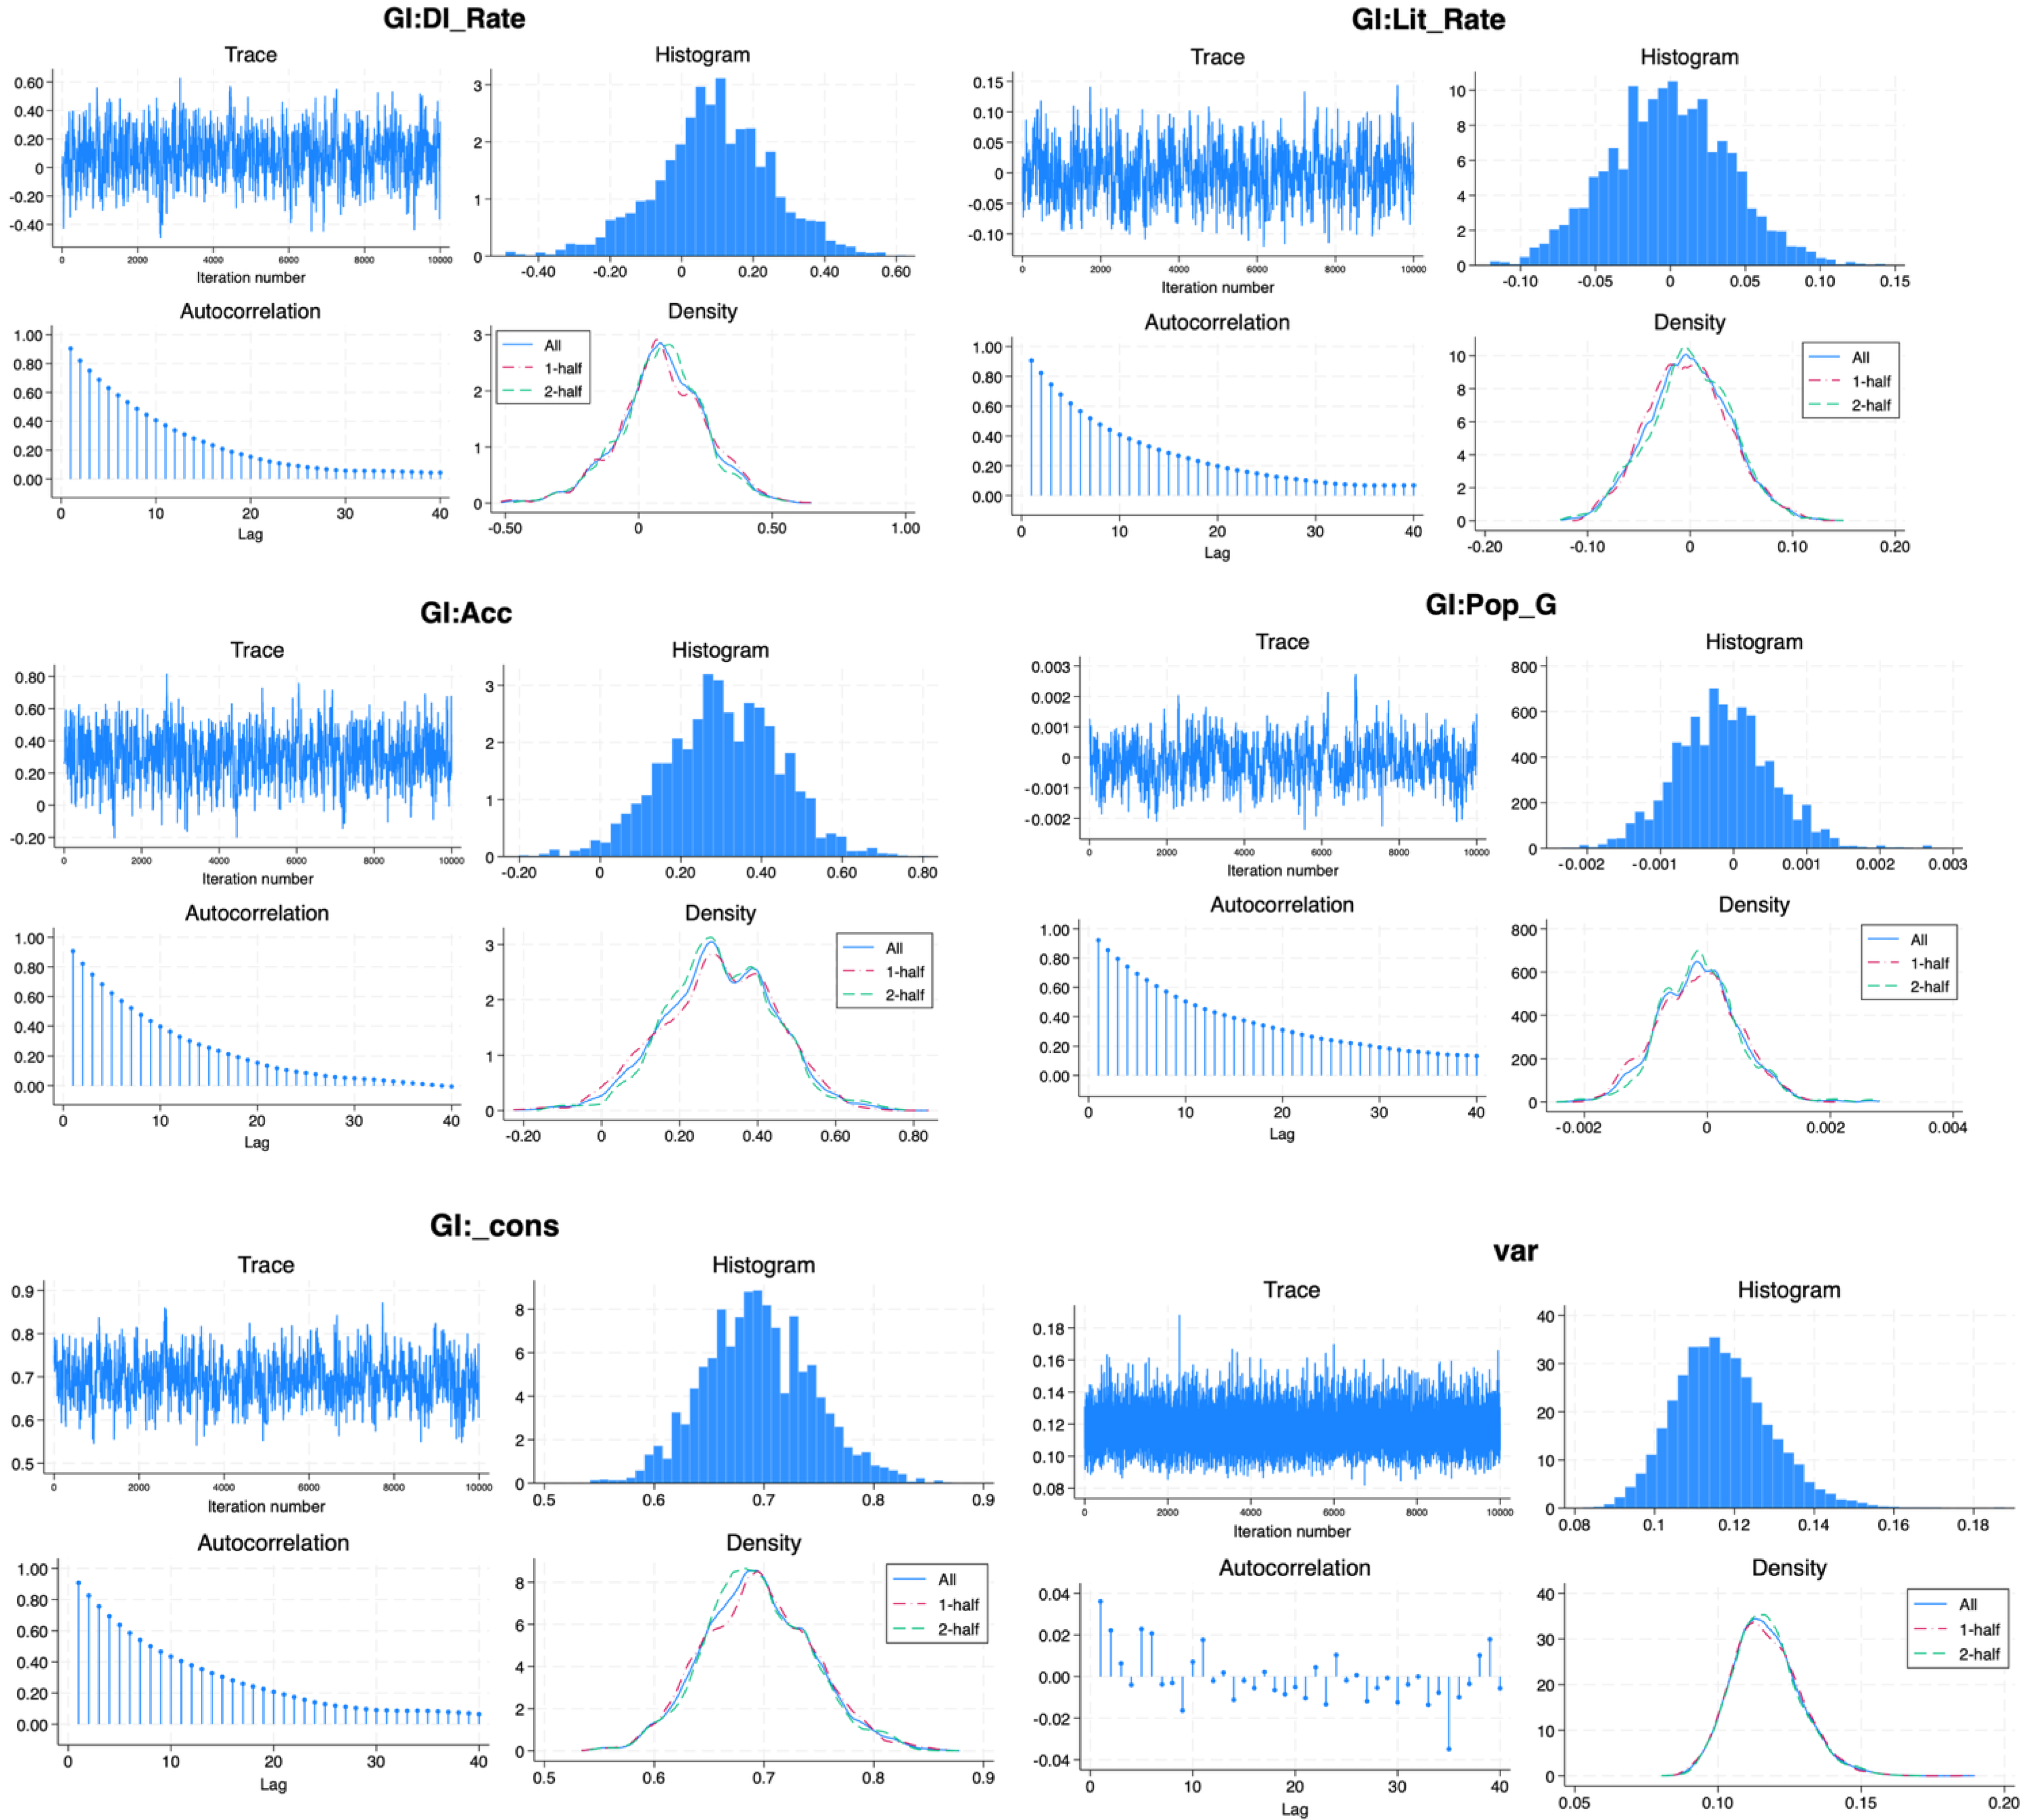
Before proceeding with the Bayesian inference, this study must employ several tests to ensure Bayesian inference is efficient. In the Bayesian approach, two kinds of tests need to be conducted: autocorrelation histograms and adequate sample size (ESS), in which the fundamental indicators, such as acceptance and efficiency rate, impact chain convergence. First, to visually check the convergence of MCMC of parameter estimates, we conduct a graphic diagnostic including a trace plot, an autocorrelation plot, a histogram, and a kernel density overlaid with densities estimated using the first and the second halves of the MCMC sample.
In Figure 3, we can observe the trace plot of the variables in the sample. The trace plot of a well-mixing parameter should traverse the posterior domain rapidly and have a nearly constant mean and variance. Well-mixing chains for all the variables are observed. The next graphic analysis is the autocorrelation plot; the smaller the correlation, the more efficient the sampling process. For the Digital Financial Services Rate (DI_Rate) and Population Growth (Pop_G), the autocorrelation dies off after the 20 lags. Literacy Rate (Lit_Rate) shows higher autocorrelation and decreases after the 20 lags. Finally, the variable Account (Acc) presents a decreasing autocorrelation and dies off after the 30 lags.
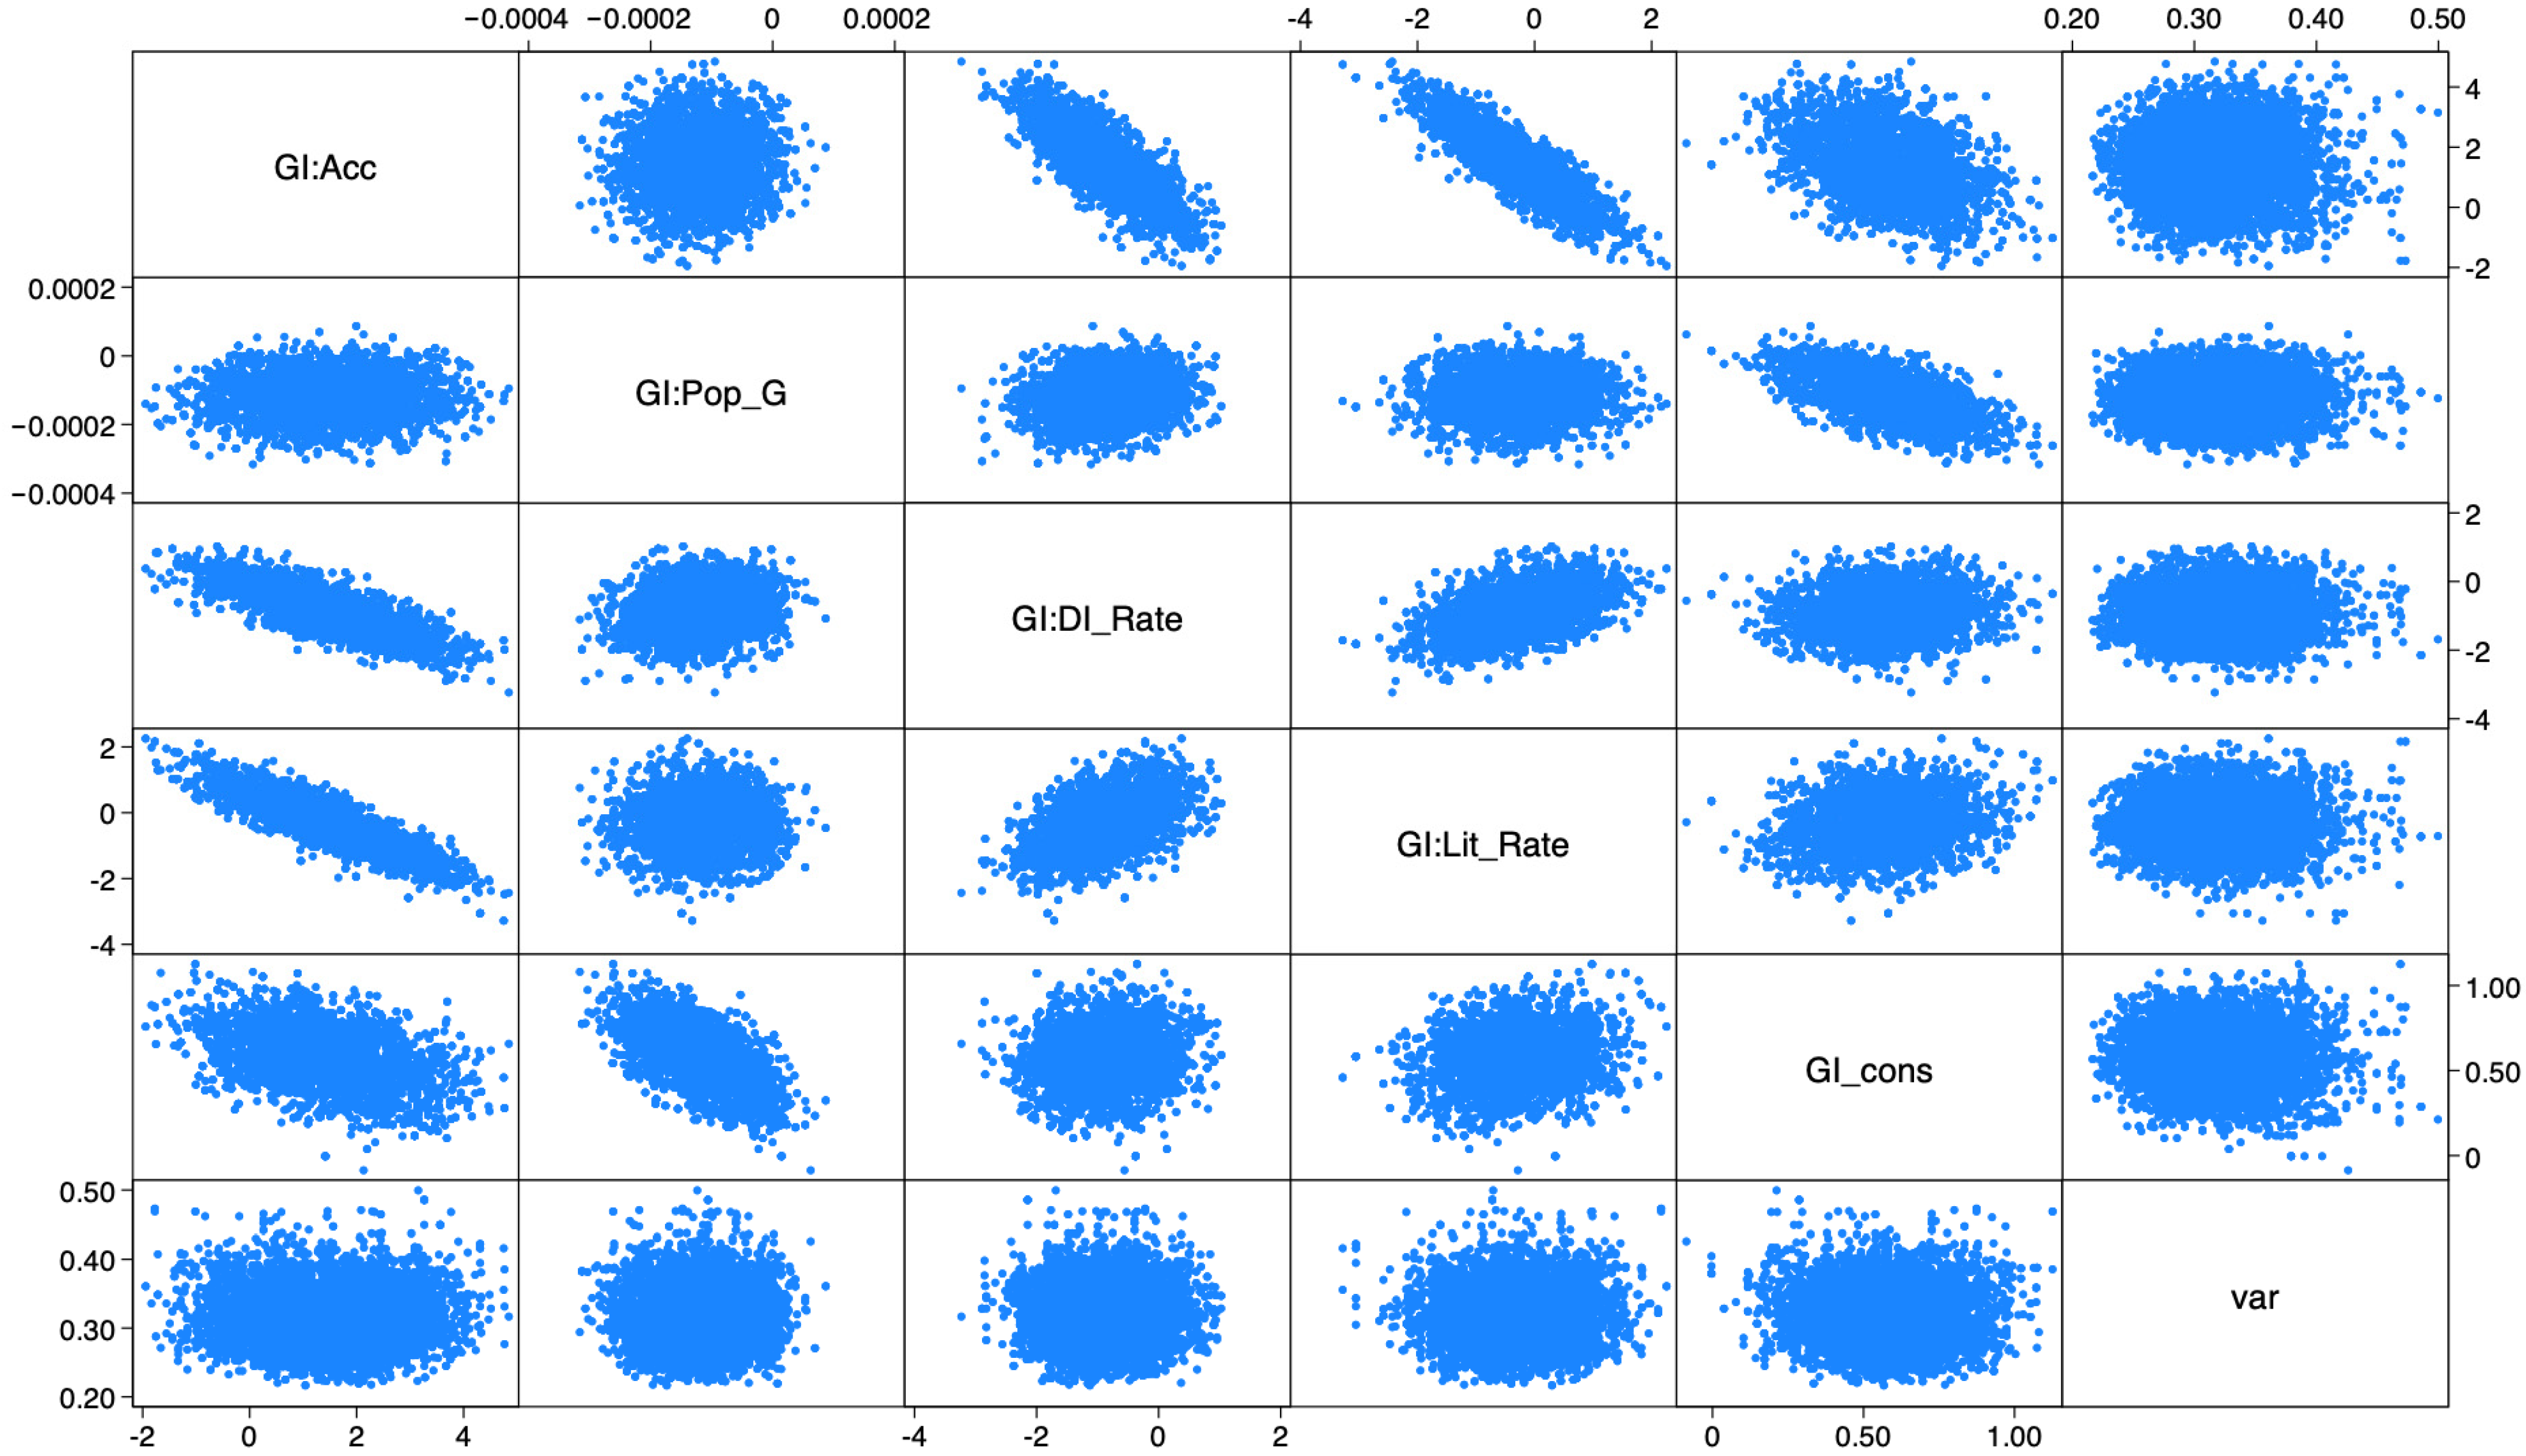
Figure 4 shows the autocorrelation scatterplots. The variables Acc and DI_Rate revealed some autocorrelation. The histogram plots shape is unimodal, and the kernel density plots have graphs that resemble the model parameters’ posterior distributions. In summary, there is no sign of issues in the sample.
In addition to diagnostic evaluation by MCMC chain convergence, an Effective Sample Size (ESS) chain convergence benchmark was performed to evaluate the MCMC convergence. Using the Metropolis–Hastings (MH) algorithm, we cannot expect ESS estimates to be closer to the MCMC sample size (10,000). ESS estimates are more significant than 2% of the sample size. Thus, it is possible to conclude that the parameters of the research model have converged to reasonable values. The next step is the Bayesian inference.
As stated in the previous paragraph, the study performs the Metropolis–Hastings (MH) algorithm and a Gibbs sample method. This research considers an informative conjugative prior1 distribution for our model. Continuing with informative priors, we use Zellner’s g-prior (Zellner 1986). The mathematical formulation of the priors is the following:
β σ 2 ~ M V N ( 0 , g σ 2 ( X X ) 1 )
σ 2 ~ I n v G a m m a ( v 0 / 2 , v 0 σ 0 2 / 2 )
where g reflects the prior sample size, v 0 is the prior degrees of freedom for the inverse gamma distribution, and σ 0 2 is the prior variance for the inverse gamma distribution. The prior incorporates dependencies between coefficients. We use the work of Hoff (2009) as a reference for g = 12 , v 0 = 1 , and σ 0 2 = 8 . Using Zellner’s g-prior, the first argument is the dimension of the distribution, which is 6 in our model, and the second argument is the prior degrees of freedom, 182. The last argument is the variance parameter, which is {var}. The mean is assumed to be a zero vector of the corresponding dimension.
The priors used in the model are presented as follows:
  • {afa:account} ~ zellnersg(6,182,0,{var})
  • {afa:diinorm} ~ zellnersg(6,182,0,{var})
  • {afa:literacyrate} ~ zellnersg(6,182,0,{var})
  • {afa:popgrowth} ~ zellnersg(6,182,0,{var})
  • {afa:_cons} ~ zellnersg(6,182,0,{var})
{var} ~ igamma(0.5,4)
Although the MH algorithm is very general and can be applied to the Bayesian model, it is not the most optimal sampler and may require achieving higher efficiency. Efficiency describes the mixing properties of the Markov chain. High efficiency means low autocorrelation in the MCMC sample. Another key element is the Acceptance Rate. This is the number of accepted proposals of model parameters relative to the total number of proposals. According to Roberts and Rosenthal (2001), an efficient MH sampler has an Acceptance Rate between 15% and 50%, low autocorrelation, and thus a relatively large efficient sample size (ESS) for all model parameters.
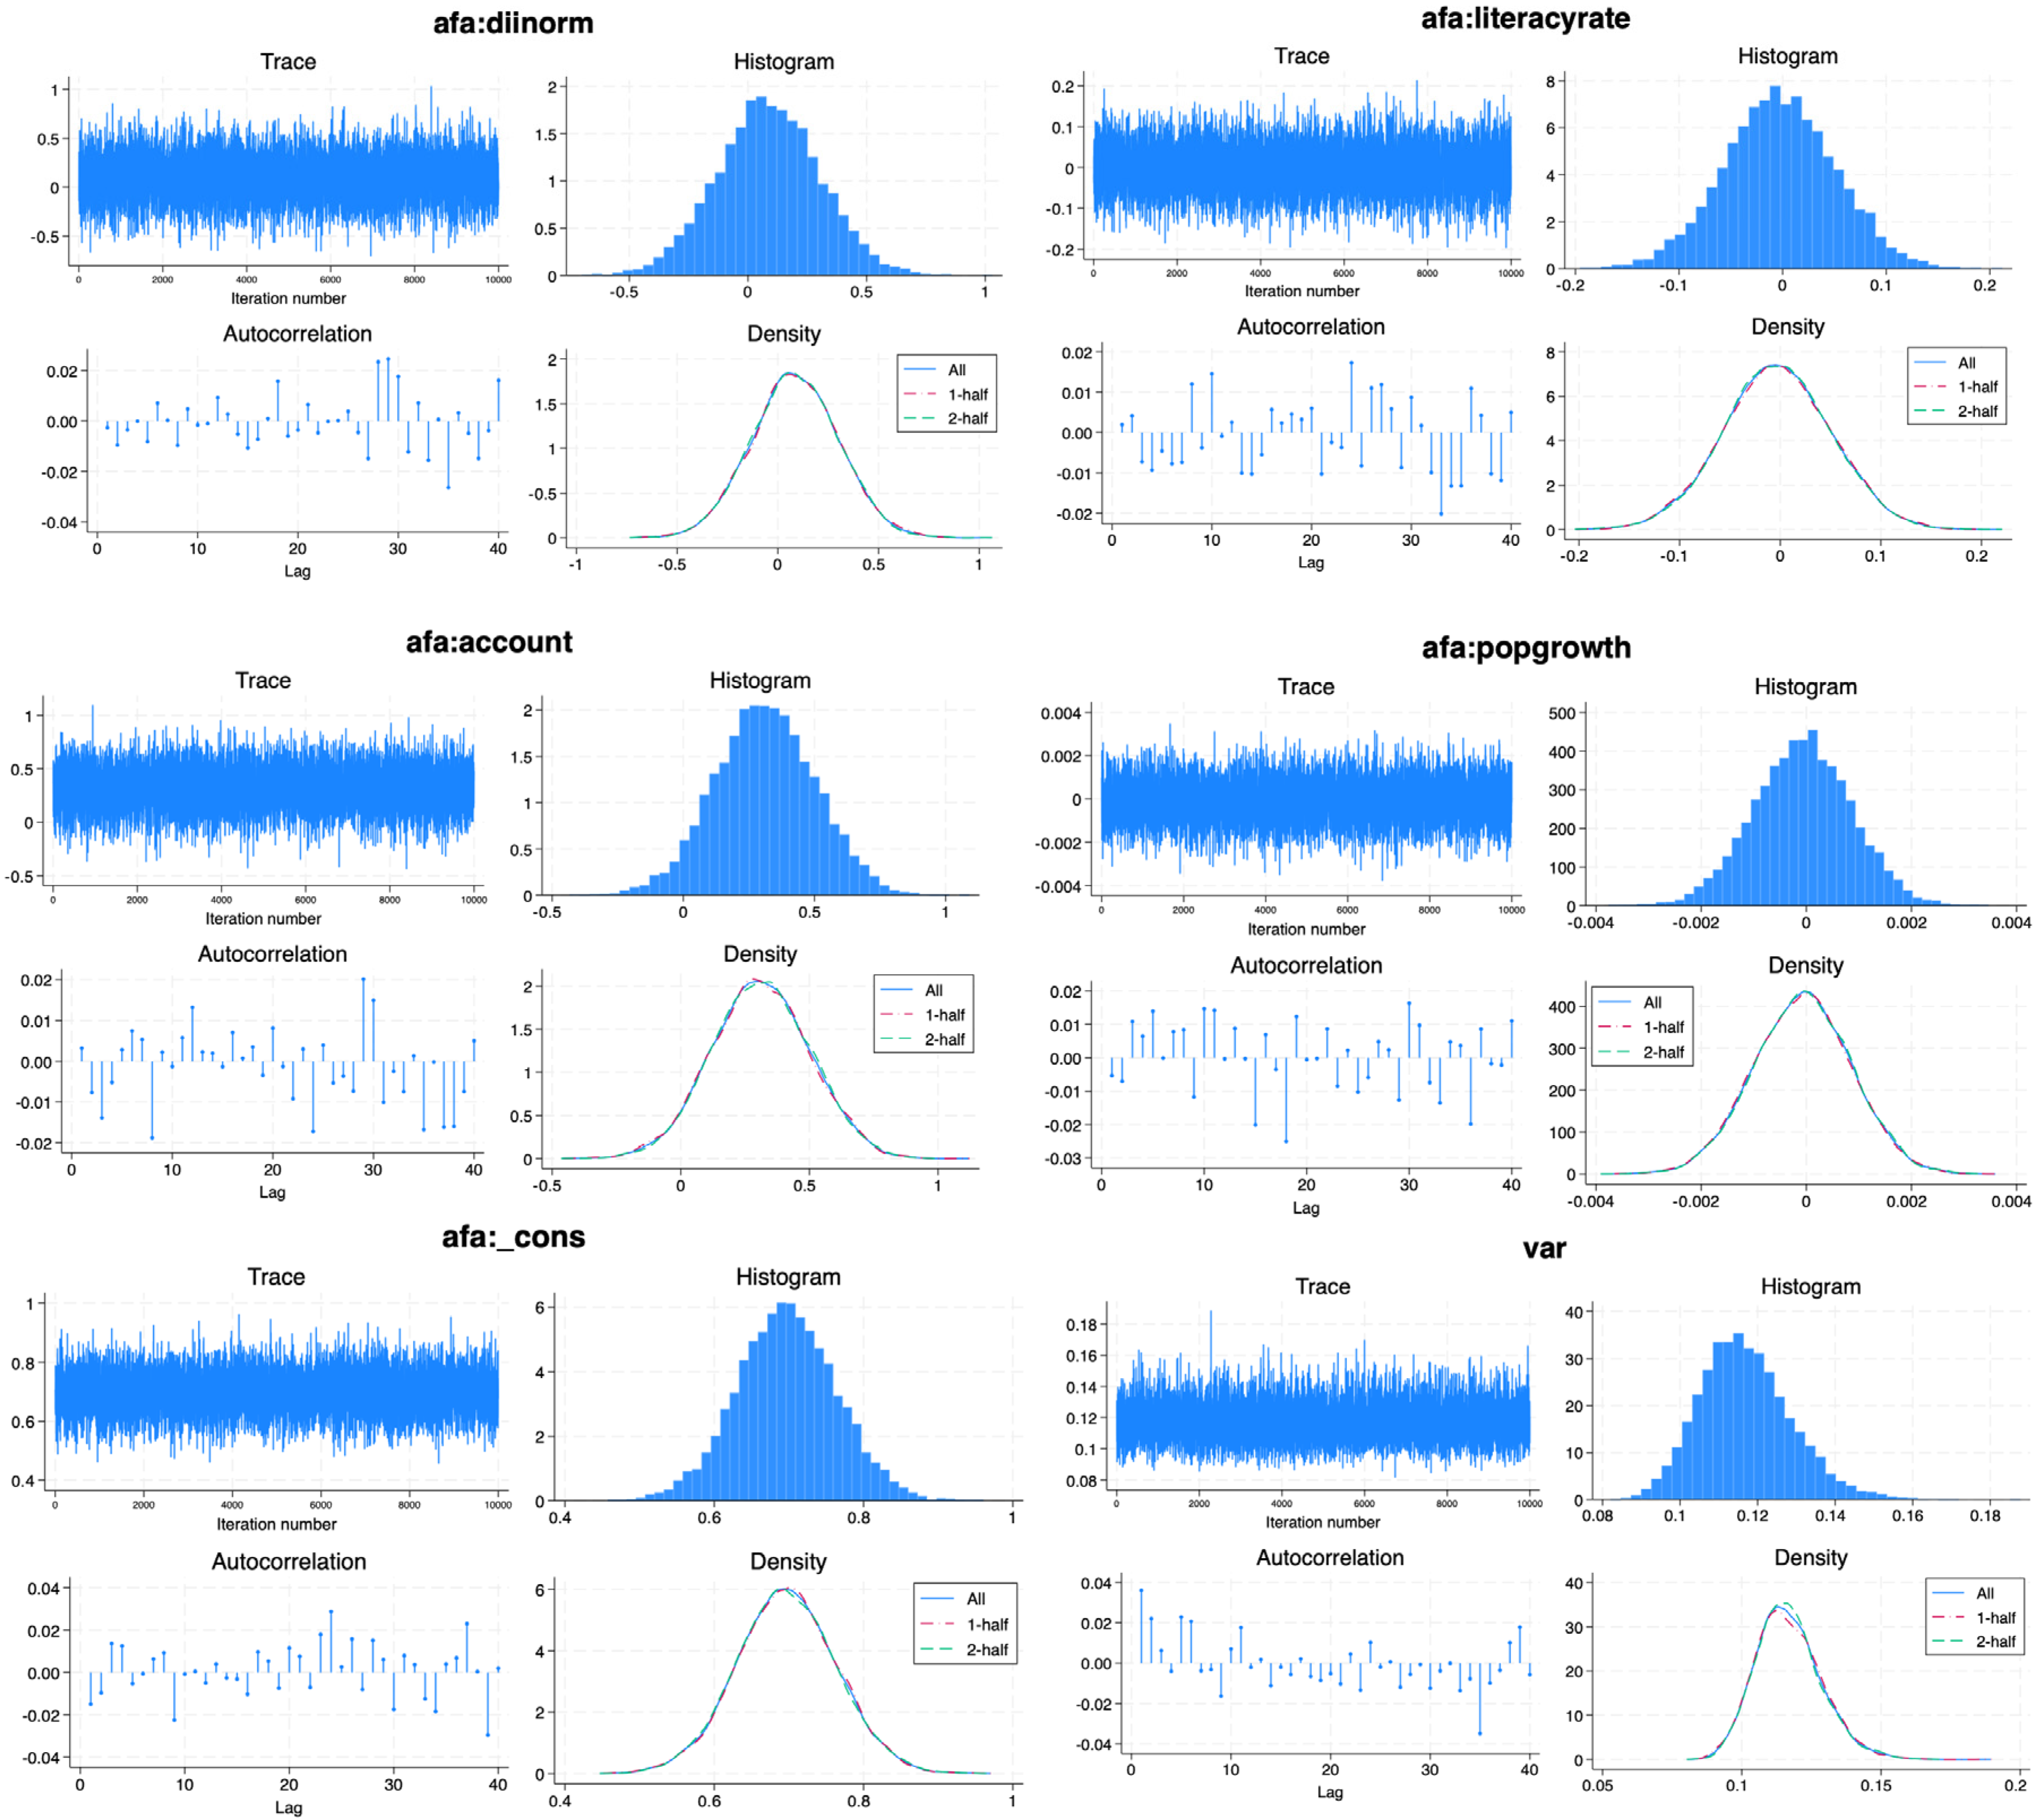
Gibbs sampling is the most efficient sampling method, achieving an AR of one and often exhibiting high efficiency. Utilizing Gibbs sampling for specific parameter blocks generally results in greater efficiency in hybrid MH sampling compared to standard MH sampling. In Figure 5, we can observe the trace plot of the variables in the hybrid MH sampling using the Gibbs method.

4. Empirical Results

The Bayesian method provides Markov Chain Monte Carlo (MCMC) iterations. In the model, there are 12,500, including the default 2500 burn-in iterations, which are discarded from the analysis MCMC sample. The acceptance rate is 29.56%. It means that the algorithm accepted 29.56% of 10,000 proposal parameter values. The Monte Carlo standard error (MCSE) describes the precision of the posterior means estimates. We observe small numbers close to zero, and they are relative to the scale of the parameters. The estimates of posterior means and medians are close to the regression coefficients. This is an indicator of the symmetry of their posterior distributions.
As shown in Table 5, the variables Account (Acc) and Digital Financial Services Rate (DI_Rate) relate positively to the Gender Inclusion (GI) variable as a proxy for the financial inclusion indicator. In contrast, Literacy Rate (Lit_Rate) and Population Growth (Pop_G) relate negatively. Applying the Gibbs sampling method with three chains showed a higher acceptance rate and efficiency. The simulation results indicate that the Max Gelman–Rubin Rc value is lower than 1.1 in both models, implying the MCMC convergence.
Table 6 presents the empirical results for the hybrid MH model with the same relationships between the independent variables with Gender Inclusion. The acceptance rate is 1, which means that the algorithm accepted 100% of 10,000 proposal parameter values. The hybrid model outperformed the standard model. The Monte–Carlo Standard Error (MSCE) has a minimal value, showing the high accuracy of the estimated parameter in the model. Therefore, the model results are reliable.
Finally, we compute Bayesian predictions, which are outcome values simulated from the posterior predictive distribution, which is the distribution of the future data for the observed data. This computation is relevant for checking the model goodness of fit. We compare the histograms of the replicated data (blue) with the observed data. Figure 6 shows histograms and the distributions, which appear to be similar.
Posterior predictive p-value P(T >= Tobs) is the probability that the test statistics in the replicated data T is as or more extreme as the same statistic in the observed data, T_obs. When this probability is close to 0.5, the replicated and observed data are considered to agree with the test statistics of interest. In our research, the mean and the maximum statistics are in agreement with the observed and replicated data, but not in the minimum statistics. We can observe these results in Table 7 and Table 8.

5. Discussion

While some estimated effects seem to have weak statistical significance, the Bayesian framework allows us to move beyond binary significance testing. Instead, we interpret the results based on the posterior distribution and the directionality of effects. For example, the posterior mean estimates and their credible intervals indicate consistent trends aligned with theoretical expectations, even when intervals slightly cross zero. This probabilistic interpretation provides a more nuanced understanding of the uncertainty associated with the predictors, particularly in complex social contexts such as gender financial inclusion. As Kruschke (2015) noted, Bayesian methods enable researchers to assess the credibility of parameter values, which is especially important when exploring real-world phenomena with subtle or context-dependent effects.
Research results show that DI_Rate positively impacts GI Gender Inclusion for low-income and lower-middle-income economies. Countries that increase digital financial services to serve economic development will positively impact gender inclusion. This finding is consistent with Le Quoc (2024), which shows that digital financial inclusion fosters economic growth and mitigates gender inequality in nations. Biswas (2021) showed evidence that access to mobile financial services is potentially able to bridge the gender gap. Muchandigona and Kalema (2023) argued that the development of the financial sector, which includes mobile banking and digital payment systems, can enhance access to financial services for rural and underserved populations.
The variable Acc also has a positive relation with GI. This is aligned with the results of Osei-Tutu and Weill (2021) and the study titled: “The Global Findex Database 2021: Financial Inclusion, Digital Payments, and Resilience in the Age of COVID-19” by Demirgüç-Kunt et al. (2022). It highlighted that 76% of adults worldwide have an account, up from 51% a decade earlier. Notably, the share of women with accounts increased from 45% in 2011 to 74% in 2021, indicating substantial progress toward gender financial inclusion. Moreover, studies indicate that effective macroeconomic management can boost confidence in the financial system, prompting people to open bank accounts and access financial services (Demirgüç-Kunt et al. 2022).
On the other hand, the literacy rate shows a negative relationship with gender inclusion for low- and lower-middle-income economies. These findings contrast with the results of Dinh Le Quoc (2024) and Hasler and Lusardi (2017), who suggest a positive link between education and financial inclusion. However, our results suggest that literacy alone may not be sufficient to improve financial inclusion among women in these contexts. This may be due to persistent sociocultural barriers, such as restrictive gender norms, unequal access to technology, lack of mobility, or limited financial decision-making power within households, which can prevent women from accessing or using formal financial services—even when they have a certain level of education. Peng et al. (2024), for instance, highlight how social and cultural rights can mediate the impact of gender equality on financial inclusion in Pakistan. Similarly, Trung and Quynh (2022) found that individuals with lower levels of education and no financial literacy are more likely to rely on informal financial products, often at higher risk. These insights emphasize that improving literacy must be accompanied by broader interventions to remove structural barriers that hinder women’s full financial participation.
Finally, population growth has a negative relationship with gender inclusion. This finding is aligned with Baliamoune-Lutz’s (2007) research. Reducing gender disparities can lead to lower fertility rates and improved economic performance. The negative relation is also found in the work of Khera et al. (2021). However, this research used other control variables, and the negative sign of population growth persists to explain the level of economic growth through financial access. As noted by Le Quoc (2024), when the market places a low value on women in the labor force, they tend to shoulder household responsibilities within the family. This, in turn, leads to rising population levels that adversely affect long-term economic activity.
In summary, this research finds that the determinants of gender financial inclusion include digital financial services and the number of accounts. In low-income and lower-middle-income countries, literacy rate and population growth variables negatively affect gender financial inclusion. Further research needs to be conducted, including country-specific factors such as economic development (GDP per capita), private credit by country, and government consumption as a percentage of GDP (Khera et al. 2021; Cicchiello et al. 2021). Additionally, individual socio-economic factors are significant, including age, income, and employment status (Andaregie et al. 2024).

6. Conclusions

Achieving women’s equality and empowerment is a key sustainable development goal that is central to inclusive and sustainable development. Gender disparities create economic obstacles that restrict women’s opportunities, particularly in developing economies. Financial markets are crucial in allocating capital, connecting investments, and providing digital financial services to promote economic development in developed economies. While earlier research has highlighted how Digital Financial Inclusion throughout services helps reduce gender disparities, applying Bayesian statistical methods to analyze this relationship appeared to be less explored, particularly for low-income and lower-middle-income economies.
This research has concluded the impact of digital financial services on reducing the gender gap, highlighting the complex relationships among financial inclusion, gender equality, literacy rates, and population growth in low-income and lower-middle-income countries. Thus, our research significantly contributes to the existing literature by introducing Bayesian methodologies for studying gender digital inclusion, which can be advantageous for addressing uncertainties, especially in complex socio-economic analysis. Our scope encompassed information for the period from 2011 to 2022.
While technological advancements accelerated in the early 21st century, this study centers on the years 2011–2022 (non-consecutive) due to data limitations, particularly in emerging economies. Additionally, it is essential to include variables related to Digital Financial Inclusion from the World Bank alongside individual characteristics and country-level factors.
This study offers new insights into the relationship between digital financial services, literacy, and gender inclusion in low- and lower-middle-income countries; it also has certain limitations. One notable limitation is the absence of a heterogeneity analysis to explore regional or context-specific differences. Although our model provides a generalized understanding across the selected countries, we recognize that socio-economic, cultural, and institutional factors may vary significantly by region and influence the effectiveness of digital financial inclusion initiatives. The lack of disaggregated regional analysis was due to constraints in data availability and the study’s focus on building a robust overall model. Future research could address this limitation by incorporating interaction terms or conducting subgroup analyses by region, income level, or institutional context to capture these nuanced effects better.
The proposed Bayesian logistic regression model’s results indicate that in low-income economies, digital financial services contribute to reducing the gender gap in account ownership, especially among women. However, the literacy rate alone does not fully explain access disparities, suggesting that broader socio-economic and structural barriers, such as unpaid care responsibilities and limited digital infrastructure, play a significant role.
Based on these findings, we propose the following targeted policy recommendations:
a.
Promote financial literacy initiatives integrated with gender empowerment strategies.
Empirical results support the need for tailored financial education programs, especially for young women in low-income countries. Governments and NGOs should embed financial literacy modules within national curricula and vocational training programs, emphasizing entrepreneurship, budgeting, and digital tools.
b.
Design inclusive digital financial products that reflect women’s needs.
Given the gendered impact of digital financial inclusion, public-private partnerships should develop mobile-based financial services (e.g., micro-loans, savings tools) designed for time-constrained women, especially those in informal or unpaid work. Features like voice-enabled navigation, low-data usage apps, and flexible repayment schedules can improve adoption.
c.
Strengthen the capacity of financial institutions to support gender-inclusive digital services.
Findings show that greater access to digital financial services correlates with higher account ownership among women. Regulators and central banks should incentivize financial institutions to eliminate account opening fees, simplify Know Your Customer (KYC) requirements, and expand agent banking networks in rural and underserved areas.
d.
Expand gender-sensitive technological infrastructure in underserved regions.
Infrastructure gaps, such as limited mobile coverage or poor Internet connectivity, disproportionately affect women’s access to digital services. Policymakers should prioritize investments in ICT infrastructure in areas with high gender disparities, using geospatial data to align with demographic patterns.
e.
Align national digital financial inclusion strategies with gender equality goals.
Finally, the study highlights the importance of intersectoral coordination. Governments should ensure their financial inclusion policies are aligned with broader gender equality frameworks (e.g., SDG 5) and supported by data disaggregated by gender, age, and income.
These recommendations respond directly to the empirical findings, aiming to translate statistical evidence into actionable steps that policymakers, financial institutions, and development agencies can implement.

Author Contributions

Conceptualization, A.F.G.-M.; Methodology, A.F.G.-M.; Validation, N.P.R.-V.; Formal analysis, A.F.G.-M. and N.P.R.-V.; Investigation, A.F.G.-M. and N.P.R.-V.; Writing—original draft, A.F.G.-M.; Writing—review & editing, N.P.R.-V. and A.F.G.-M. All authors have read and agreed to the published version of the manuscript.

Funding

This research received no external funding.

Data Availability Statement

The raw data supporting the conclusions of this article will be made available by the authors on request.

Acknowledgments

This project research would not have been possible without the exceptional support of the Accounting and Finance Academic Department in the School of Business of Tecnológico de Monterrey and EGADE Business School. In addition, we would like to thank Luis Alberto García Beltrán, Emilio Alejandro Carranza Murillo, Oscar Eduardo González Valenzuela and Mauricio Morán Morales, and other research assistants for their valuable contributions to the literature review.

Conflicts of Interest

The authors declare no conflicts of interest.

Note

1
A prior distribution is conjugate for a family of likelihood distributions if the prior and posterior distributions belong to the same family of distributions. For example, the gamma distribution is a conjugate prior to the Poisson likelihood. Conjugacy may provide an efficient way of sampling from posterior distributions and is used in Gibbs sampling (Stata 2023).

References

  1. Adegbite, Olayinka, and Charles. L. Machethe. 2020. Bridging the financial inclusion gender gap in smallholder agriculture in Nigeria: An untapped potential for sustainable development. World Development 127: 104755. [Google Scholar] [CrossRef]
  2. Ahang, Mohammadreza. 2014. The impact of gender inequality on economic growth in developed countries. Advances in Environmental Biology 8: 508–13. [Google Scholar]
  3. Aker, Jenny C., Richard Boumnijel, Amanda McClelland, and Niall Tierney. 2016. Payment mechanisms and antipoverty programs: Evidence from a mobile money cash transfer experiment in Niger. Economic Development and Cultural Change 65: 1–37. [Google Scholar] [CrossRef]
  4. Altuzarra, Amaia, Catalina Gálvez-Gálvez, and Ana González-Flores. 2021. Is gender inequality a barrier to economic growth? A panel data analysis of developing countries. Sustainability 13: 367. [Google Scholar] [CrossRef]
  5. Andaregie, Adino, Gumataw Kifle Abebe, Prashant Gupta, Gardachew Worku, Hideyuki Matsumoto, Tessema Astatkie, and Isao Takagi. 2024. Exploring individuals’ socioeconomic characteristics and digital infrastructure determinants of digital payment adoption in Ethiopia. Digital Business 4: 100092. [Google Scholar] [CrossRef]
  6. Armand, Alex, Orazio Attanasio, Pedro Carneiro, and Valérie Lechene. 2020. The effect of gender-targeted conditional cash transfers on household expenditures: Evidence from a randomized experiment. The Economic Journal 130: 1875–97. [Google Scholar] [CrossRef]
  7. Bali Swain, Ranjula, and Aloys Nsabimana. 2024. Financial inclusion and nutrition among rural households in Rwanda. European Review of Agricultural Economics 51: 506–32. [Google Scholar] [CrossRef]
  8. Baliamoune-Lutz, Mina. 2007. Globalisation and gender inequality: Is Africa different? Journal of African Economies 16: 301–48. [Google Scholar] [CrossRef]
  9. Balliester Reis, Tatiana. 2022. Socio-economic determinants of financial inclusion: An evaluation with a microdata multidimensional index. Journal of International Development 34: 587–611. [Google Scholar] [CrossRef]
  10. Becker, Gary S. 1962. Investment in human capital: A theoretical analysis. Journal of Political Economy 70: 9–49. [Google Scholar] [CrossRef]
  11. Binsuwadan, Jameel, Mohammed Elhaj, Jamal Bousrih, Fatma Mabrouk, and Huda Alofaysan. 2024. The Relationship between Financial Inclusion and Women’s Financial Worries: Evidence from Saudi Arabia. Sustainability 16: 8317. [Google Scholar] [CrossRef]
  12. Biswas, Sutapa. 2021. Effect of mobile financial services on financial behavior in developing economies-Evidence from India. Working Paper arXiv arXiv:2109.07077. [Google Scholar]
  13. Canton, Helen. 2021. United Nations entity for gender equality and the empowerment of women—UN women. In The Europa Directory of International Organizations 2021. London: Routledge, pp. 185–88. [Google Scholar]
  14. Chirwa, Gowokani Chijere, and Lucky Chiwaula. 2022. Socioeconomic inequalities in household resilience capacity in the context of COVID-19 in the fisheries sector in Malawi. Agrekon 61: 266–81. [Google Scholar] [CrossRef]
  15. Cicchiello, Cicchiello, Antonella Fiorella, Amir Kazemikhasragh, Simona Monferrá, and Alicia Girón. 2021. Financial inclusion and development in the least developed countries in Asia and Africa. Journal of Innovation and Entrepreneurship 10: 1–13. [Google Scholar] [CrossRef]
  16. Cuberes, David, and Marc Teignier. 2014. Gender inequality and economic growth: A critical review. Journal of International Development 26: 260–76. [Google Scholar] [CrossRef]
  17. Demirgüç-Kunt, Asli, Leora Klapper, Dorothe Singer, and Saniya Ansar. 2022. The Global Findex Database 2021: Financial Inclusion, Digital Payments, and Resilience in The Age of COVID-19. Washington, DC: World Bank Publications. [Google Scholar]
  18. Donovan, Kevin P. 2012. Mobile money for financial inclusion. In Information and Communications for Development 2012: Maximizing Mobile. Washington, DC: The World Bank, pp. 61–73. [Google Scholar] [CrossRef]
  19. Duvendack, Maren, Lina Sonne, and Supriya Garikipati. 2023. Gender inclusivity of India’s digital financial revolution for attainment of SDGs: Macro achievements and the micro experiences of targeted initiatives. The European Journal of Development Research 35: 1369–91. [Google Scholar] [CrossRef]
  20. Eagly, Alice H., and Steven J. Karau. 2002. Role congruity theory of prejudice toward female leaders. Psychological Review 109: 573. [Google Scholar] [CrossRef]
  21. Ebong, Justine, and Babu George. 2021. Financial inclusion through digital financial services (dfs): A study in uganda. Journal of Risk and Financial Management 14: 393. [Google Scholar] [CrossRef]
  22. Gelfand, Alan E., and Adrian F. M. Smith. 1990. Sampling based approaches to calculating marginal densities. Journal of the American Statistical Association 85: 398–409. [Google Scholar] [CrossRef]
  23. Gelman, Andrew, John B. Carlin, Hal S. Stern, Donald B. Dunson, Aki Vehtari, and Donald B. Rubin. 2013. Bayesian Data Analysis, 3rd ed. Boca Raton: CRC Press. [Google Scholar]
  24. Ghosh, Saibal. 2022. Gender and financial inclusion: Does technology make a difference? Gender, Technology and Development 26: 195–213. [Google Scholar] [CrossRef]
  25. Ghosh, Chandreyee, and Ranjan Hom Chaudhury. 2022. Determinants of digital finance in India. Innovation and Development 12: 343–62. [Google Scholar] [CrossRef]
  26. Goel, Abhishek. 2023. Trends and reforms of financial inclusion in India. International Review of Applied Economics 37: 275–85. [Google Scholar] [CrossRef]
  27. Greco, Salvatore, Alexis Ishizaka, Maria Tasiou, and Giuseppe Torrisi. 2019. On the methodological framework of composite indices: A review of the issues of weighting, aggregation, and robustness. Social Indicators Research 141: 61–94. [Google Scholar] [CrossRef]
  28. Gujarati, Damodar N. 2002. Basic Econometrics, 4th ed. Available online: https://zalamsyah.staff.unja.ac.id/wp-content/uploads/sites/286/2019/11/7-Basic-Econometrics-4th-Ed.-Gujarati.pdf (accessed on 10 January 2025).
  29. Hasler, Andrea, and Annamaria Lusardi. 2017. The Gender Gap in Financial Literacy: A Global Perspective. Washington, DC: Global Financial Literacy Excellence Center, The George Washington University School of Business, pp. 2–16. [Google Scholar]
  30. Hastings, W. Keith. 1970. Monte Carlo Sampling Methods Using Markov Chains and Their Applications. Biometrika 57: 97–109. [Google Scholar] [CrossRef]
  31. Hoff, Peter. 2009. A First Course in Bayesian Statistical Methods. New York: Springer, vol. 580. [Google Scholar]
  32. Jack, William, and Tavneet Suri. 2014. Risk sharing and transactions costs: Evidence from Kenya’s mobile money revolution. American Economic Review 104: 183–223. [Google Scholar] [CrossRef]
  33. Jain, Yogendra Kuma, and Santosh Kumar Bhandare. 2011. Min max normalization based data perturbation method for privacy protection. International Journal of Computer and Communication Technology 2: 45–50. [Google Scholar] [CrossRef]
  34. Kazemikhasragh, Amir, Antonella F. Cicchiello, Simona Monferrá, and Alicia Girón. 2022. Gender inequality in financial inclusion: An exploratory analysis of the Middle East and North Africa. Journal of Economic Issues 56: 770–81. [Google Scholar] [CrossRef]
  35. Khare, Shweta, Vikas Bharti, and Pooja Jain. 2024. Impact Of Digital Financial Inclusion on Women Empowerment: A Study of Satna District. Educational Administration: Theory and Practice 30: 5849–59. [Google Scholar]
  36. Khera, Purva, Megumi S. Ogawa, and Ratna Sahay. 2021. Is Digital Financial Inclusion Unlocking Growth? Washington, DC: International Monetary Fund. [Google Scholar]
  37. Klasen, Stephan, and Claudia Wink. 2003. “Missing women”: Revisiting the debate. Feminist Economics 9: 263–99. [Google Scholar] [CrossRef]
  38. Kruschke, John K. 2015. Doing Bayesian Data Analysis: A Tutorial with R, JAGS, and Stan, 2nd ed. Cambridge, MA: Academic Press. [Google Scholar]
  39. Le Quoc, Duy. 2024. The relationship between digital financial inclusion, gender inequality, and economic growth: Dynamics from financial development. Journal of Business and Socio-Economic Development 4: 370–88. [Google Scholar] [CrossRef]
  40. Lee, Jean N., Jonathan Morduch, Saravana Ravindran, Abu Shonchoy, and Hussain Zaman. 2021. Poverty and migration in the digital age: Experimental evidence on mobile banking in Bangladesh. American Economic Journal: Applied Economics 13: 38–71. [Google Scholar] [CrossRef]
  41. McElreath, Richard. 2020. Statistical Rethinking: A Bayesian Course with Examples in R and Stan, 2nd ed. Boca Raton: CRC Press. [Google Scholar]
  42. Metropolis, Nicholas, Arianna W. Rosenbluth, Marshall N. Rosenbluth, Augusta H. Teller, and Edward Teller. 1953. Equations of state calculations by fast computing machines. Journal of Chemical Physics 21: 1087–92. [Google Scholar] [CrossRef]
  43. Muchandigona, Anthony K., and Benjamin M. Kalema. 2023. The catalytic role of mobile banking to improve financial inclusion in developing countries. International Journal of E-Services and Mobile Applications (IJESMA) 15: 1–21. [Google Scholar] [CrossRef]
  44. Mukong, Anthony K., and Emma M. Amadhila. 2021. Financial inclusion and household wellbeing in Namibia. Southern African Business Review 25: 1–21. [Google Scholar] [CrossRef]
  45. Oanh, Tran Thi Kim. 2024. Digital financial inclusion in the context of financial development: Environmental destruction or the driving force for technological advancement. Borsa Istanbul Review 24: 292–303. [Google Scholar] [CrossRef]
  46. Oanh, Tran Thi Kim, and Le Quang Dinh. 2024. Digital financial inclusion, financial stability, and sustainable development: Evidence from a quantile-on-quantile regression and wavelet coherence. Sustainable Development 32: 6324–38. [Google Scholar] [CrossRef]
  47. Odeniran, Solomon O., and Emmanuel A. Udeaja. 2010. Financial sector development and economic growth: Empirical evidence from Nigeria. Economic and Financial Review 48: 91–124. [Google Scholar]
  48. OECD. 2008. Handbook on Constructing Composite Indicators: Methodology and User Guide. Paris: OECD Publishing. [Google Scholar] [CrossRef]
  49. Osei-Tutu, Frederick, and Laurent Weill. 2021. Sex, language and financial inclusion. Economics of Transition and Institutional Change 29: 369–403. [Google Scholar] [CrossRef]
  50. Ozili, Peterson K. 2018. Impact of digital finance on financial inclusion and stability. Borsa Istanbul Review 18: 329–40. [Google Scholar] [CrossRef]
  51. Peng, Xiaoyan, Yuhan Fu, and Xinyi Zou. 2024. Gender equality and green development: A qualitative survey. Innovation and Green Development 3: 100089. [Google Scholar] [CrossRef]
  52. Reynolds, Travis W., Paul E. Biscaye, Leigh Anderson, Cally O’Brien-Carelli, and Jennifer Keel. 2023. Exploring the gender gap in mobile money awareness and use: Evidence from eight low and middle income countries. Information Technology for Development 29: 228–55. [Google Scholar] [CrossRef]
  53. Roberts, Gareth O., and Jeffrey S. Rosenthal. 2001. Optimal scaling for various Metropolis-Hastings algorithms. Statistical Science 16: 351–67. [Google Scholar] [CrossRef]
  54. Rosen, Sherwin. 1976. A theory of life earnings. Journal of political Economy 84 (Part 2): S45–S67. [Google Scholar] [CrossRef]
  55. Ross, Stephen A. 2004. Compensation, incentives, and the duality of risk aversion and riskiness. The Journal of Finance 59: 207–25. [Google Scholar] [CrossRef]
  56. Roy, Pratibha, and Bibhunandini Patro. 2022. Financial inclusion of women and gender gap in access to finance: A systematic literature review. Vision 26: 282–99. [Google Scholar] [CrossRef]
  57. Schumpeter, Joseph A. 1912. The Theory of Economic Development. Cambridge, MA: Harvard University Press. [Google Scholar]
  58. Seguino, Stephanie, and Maria S. Floro. 2003. Does gender have any effect on aggregate saving? An empirical analysis. International Review of Applied Economics 17: 147–66. [Google Scholar]
  59. Sen, Amartya. 1995. Gender inequality and theories of justice. In Women, Culture and Development: A Study of Human Capabilities. Oxford: Clarendon Press, pp. 259–73. [Google Scholar] [CrossRef]
  60. Shephard, Ronald. W. 1970. Proof of the law of diminishing returns. Zeitschrift für Nationalökonomie 30: 7–34. [Google Scholar] [CrossRef]
  61. Siwela, Gift, and Tauya Njaya. 2021. Opportunities and challenges for digital financial inclusion of females in the informal sector through mobile phone technology: Evidence from Zimbabwe. International Journal of Economics, Commerce and Management 9: 60–78. [Google Scholar]
  62. Suri, Tavneet, and William Jack. 2016. The long-run poverty and gender impacts of mobile money. Science 354: 1288–92. [Google Scholar] [CrossRef]
  63. Trung, Nguyen Duc, and Nguyen Thi Ngoc Quynh. 2022. The Determinants of Financial Inclusion in Asia—A Bayesian Approach. Paper presented at International Econometric Conference of Vietnam, Ho Chi Minh City, Vietnam, January 10–12; Cham: Springer International Publishing, pp. 531–46. [Google Scholar]
  64. UN Women. 2024. Facts and Figures: Women’s Leadership and Political Participation. Available online: https://www.unwomen.org/en/what-we-do/leadership-and-political-participation/facts-and-figures#_edn2 (accessed on 10 January 2025).
  65. Van de Schoot, Rens, and Sarah Depaoli. 2014. Bayesian analyses: Where to start and what to report. European Health Psychologist 16: 75–84. [Google Scholar]
  66. Van de Schoot, Rens, Sarah Depaoli, Ruth King, Bernd B. Kramer, Krista Märtens, Mulugeta G. Tadesse, Marina Vannucci, Andrew Gelman, Don Veen, Janneke Willemsen, and et al. 2021. Bayesian Statistics and Modelling. Nature Reviews Methods Primers 1: 1–26. [Google Scholar] [CrossRef]
  67. Women’s World Banking. 2017. Accelerating Women’s Opportunity: Women’s World Banking’s 2016 Annual Report. Available online: https://www.womensworldbanking.org/insights/accelerating-womens-opportunity-womens-world-bankings-2016-annual-report/ (accessed on 10 January 2025).
  68. World Bank Group. 2014. Digital Financial Inclusion. Available online: https://www.worldbank.org/en/topic/financialinclusion/publication/digital-financial-inclusion (accessed on 10 January 2025).
  69. World Bank Group. 2024. CPIA Database. Interactive Data. World Bank Group. Available online: http://www.worldbank.org/ida (accessed on 1 November 2024).
  70. Zellner, Arnold. 1986. On Assessing Prior Distributions and Bayesian Regression Analysis with g-Prior Distributions. The American Statistician 49: 327–35. [Google Scholar]
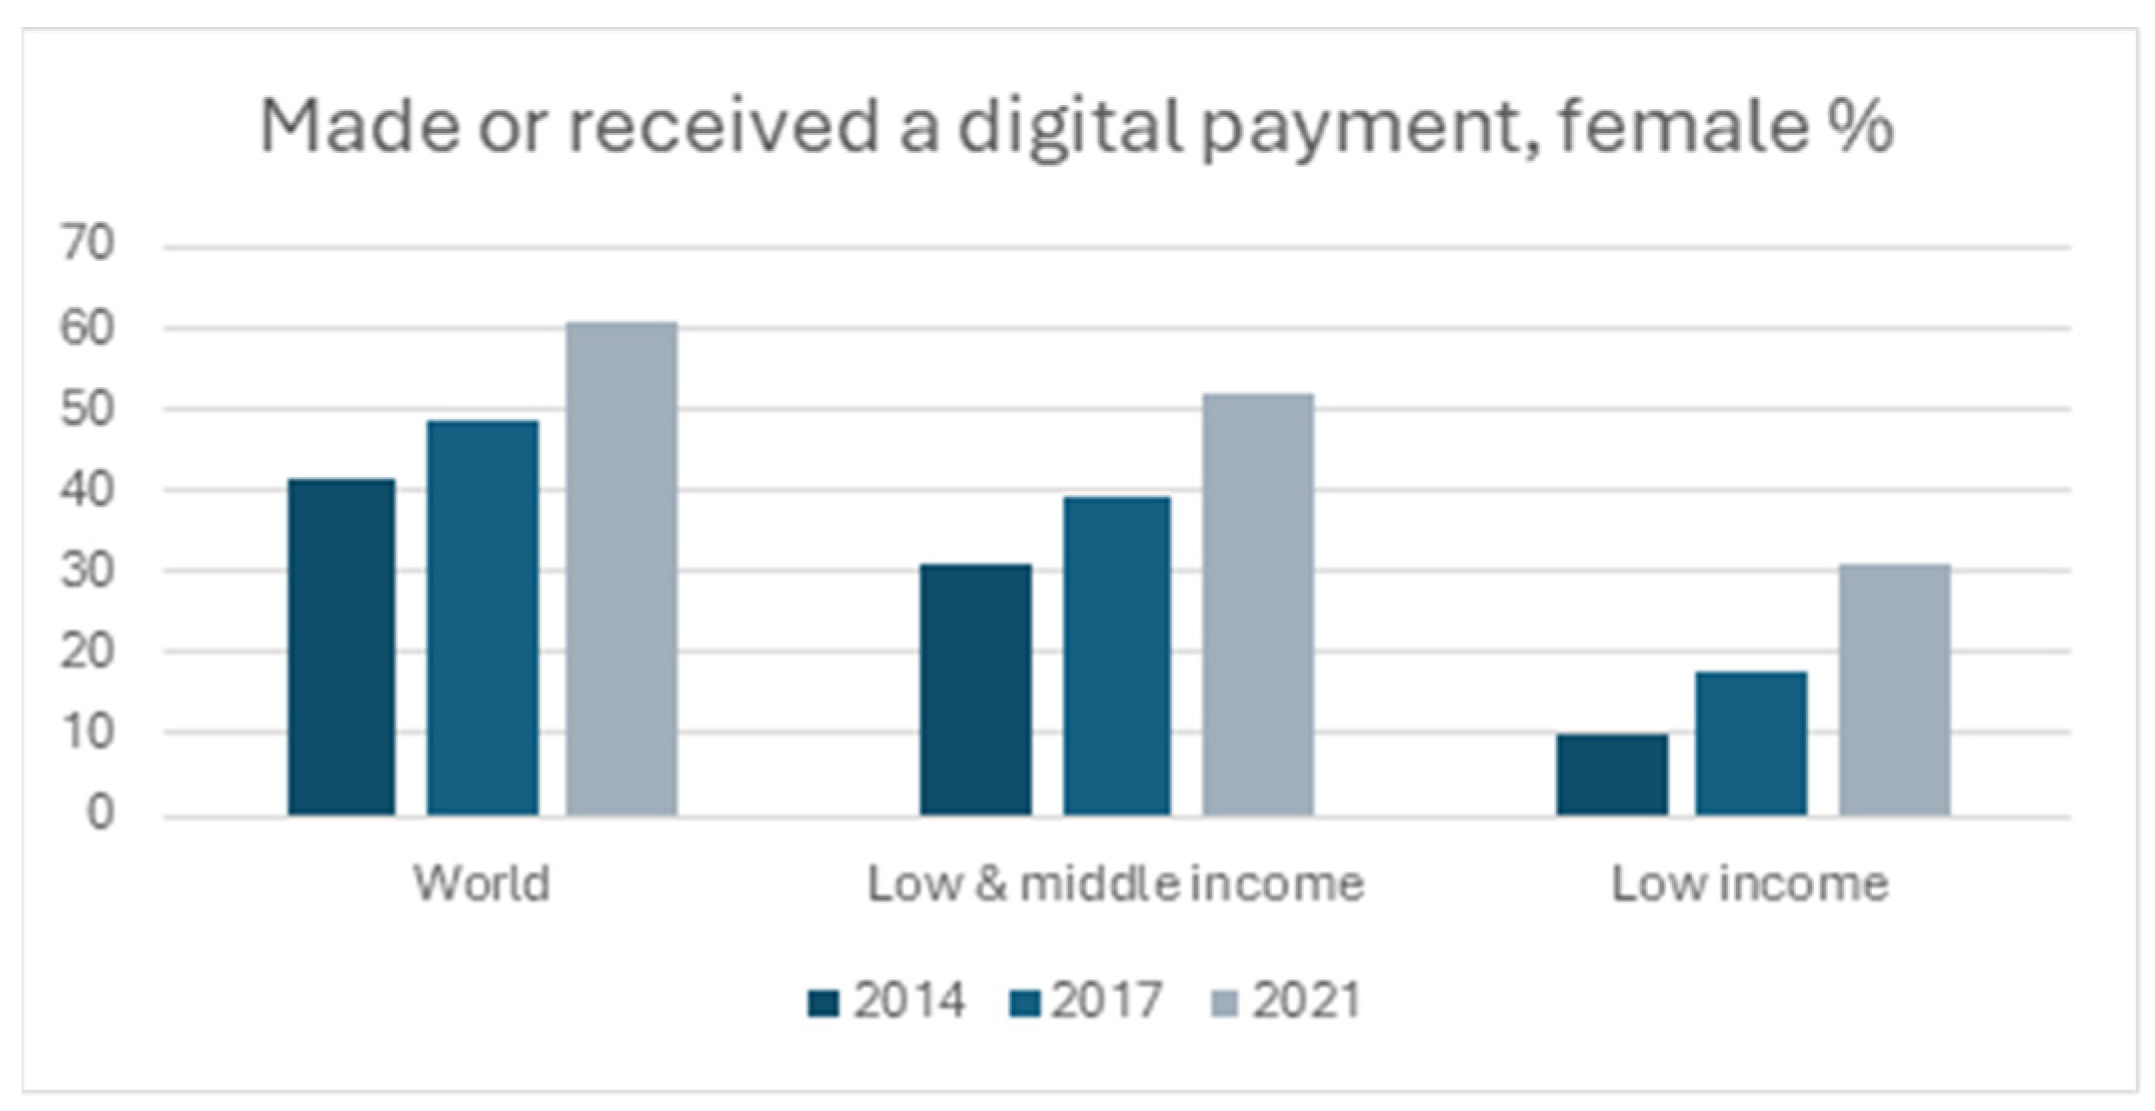
Figure 1. Digital payments made or received by females. Source: Authors’ computation based on Global Financial Inclusion (Global Findex Databases).
Risks 13 00096 g001
Figure 2. Digital Financial Services Infrastructure, Benefits and Risks. Source: Elaborated by the authors based on information from the World Bank Group (2014).
Risks 13 00096 g002
Figure 3. Tests for MCMC convergence: Standard model. Source: Processed by the authors using SataSE 18.0 software.
Risks 13 00096 g003
Figure 4. Autocorrelation scatterplots: Standard model. Source: Processed by the authors using SataSE 18.0 software.
Risks 13 00096 g004
Figure 5. Tests for MCMC convergence: Hybrid MH model. Source: Processed by the authors using SataSE 18.0 software.
Risks 13 00096 g005
Figure 6. Histogram of the predictive distribution. Source: Processed by the authors using SataSE 18.0 software.
Risks 13 00096 g006
Table 1. Countries by income classification.
Income
Classification
CountryCPIA Gender Equality RatingLiteracy Rate
Low incomeAfghanistan
Burkina Faso
Burundi
Central African Republic
Chad
Congo, Dem. Rep.
Ethiopia
Gambia
Guinea
Liberia
Madagascar
Malawi
Mali
Mozambique
Niger
Rwanda
Sierra Leone
Somalia
South Sudan
Sudan
Syrian Arab Republic
Togo
Uganda
Yemen, Rep.
Nigeria
Pakistan
Philippines
Senegal
Sri Lanka
Tajikistan
Tanzania
Tunisia
Ukraine
Uzbekistan
Vietnam
West Bank and Gaza
Zambia
Zimbabwe
2.970.91
Lower-Middle incomeAlgeria
Angola
Bangladesh
Belize
Benin
Bhutan
Bolivia
Cambodia
Cameroon
Comoros
Congo, Rep.
Cote d’Ivoire
Djibouti
Egypt, Arab Rep.
El Salvador
Eswatini
Ghana
Haiti
Honduras
India
Indonesia
Iran, Islamic Rep.
Kenya
Kyrgyz Republic
Lao PDR
Lesotho
Mauritania
Mongolia
Morocco
Myanmar
Nepal
Nicaragua
3.420.96
Source: Compiled by the authors.
Table 2. Variable description.
VariableSymbolMeasurementsStudiesData Source
Gender InclusionGIFemale Account per total Account (%)Binsuwadan et al. (2024)
Ghosh (2022)
Kazemikhasragh et al. (2022)
Global Findex Database
Digital Financial ServicesDI_RatedataKhera et al. (2021)
Oanh (2024)
(+) Mobile money account Store money using a mobile money account (% age 15+) Global Findex Database
(+) Store money in Financial Institutions Store money using a financial institution or a mobile money account (% age 15+)
(+) Internet access Number of respondents who have access to the Internet (% age 15+)Duvendack et al. (2023)Global Findex Database
(+) Mobile phone owned Number of respondents who report having a mobile phone (% age 15+)Adegbite and Machethe (2020)Global Findex Database
(+) Savings Number of respondents to report saved any money (% age 15+) Global Findex Database
(+) Savings in Financial Institutions Saved at a financial institution (% age 15+) Global Findex Database
(+) Made or received a digital payment Number of respondents who report using a mobile phone to make an in-store purchase (% age 15+) Global Findex Database
(+) Mobile phone or Internet for buying Number of respondents who report using a mobile phone or the Internet to buy something online (% age 15+) Global Findex Database
Literacy Rate-GPILit_RateFemale youth literacy rate by male youth literacy rate (%)Dinh Le Quoc (2024)Global Findex Database/UNESCO UIS
AccountAccThe percentage of respondents who report having an account (% age 15+)Osei-Tutu and Weill (2021)Global Findex Database
Population GrowthPop_GGrowth rate of population (%)Khera et al. (2021)Global Findex Database
Source: Compiled by the authors.
Table 3. Descriptive Statistics.
VariableMeanSt. DevMinMax
GI0.84705230.15321260.25920671.269537
DI_Rate0.34168720.200890700.99
Lit_Rate0.3586560.467443501.12797
Acc0.34259260.20800770.020.98
Pop_G4.2352924.235292−0.9992877277.0795
Source: Processed by the authors using SataSE 18.0 software.
Table 4. Matrix of correlation.
VariableGIDI_RateLit_RateAccPop_G
GI1
DI_Rate0.43371
Lit_Rate0.00750.01951
Acc0.51390.75050.03911
Pop_G−0.0073−0.08020.03160.02621
Source: Processed by the authors using SataSE 18.0 software.
Table 5. Bayesian simulation results: Standard MH model.
VariableMeanDI_RateMCSEMedianEqual-Tailed [95% Cred. Interval]
GI
DI_Rate0.09199530.16216340.0043190.0953441−0.2319634   0.4024003
Lit_Rate−0.00432910.03879260.001162−0.0041637−0.0820125   0.0714688
Acc0.30218880.13943910.0038940.29708420.0446531   0.5884508
Pop_G−0.00005940.00068830.000019−0.000055−0.001413   0.0012678
_cons0.69414850.04904710.0012630.69500460.5979605   0.7879403
var0.06329170.00671350.0000880.06285430.0514982   0.0776233
Acceptance rate0.2956
Efficiency: min0.03715
Max Gelman–Rubic Rc1.004
Source: Author’s calculations.
Table 6. Bayesian simulation results: Hybrid MH model.
VariableMeanStd. dev.MCSEMedianEqual-Tailed [95% Cred. Interval]
GI
DI_Rate0.08809050.08022860.0004650.088698−0.0702587   0.245884
Lit_Rate−0.00332750.01999370.000115−0.0033316−0.0425002   0.0356738
Acc0.30836260.07041960.0004090.30857980.1699415   0.445755
Pop_G−0.00004690.00034590.000002−0.0000464−0.0007282   0.0006282
_cons0.69715720.0246340.0001440.69704530.6491998   0.7457561
var0.0158370.00170850.000010.01572860.0128338   0.0195375
Acceptance rate1
Efficiency: min0.9482
Max Gelman–Rubic Rc1
Source: Author’s calculations.
Table 7. Posterior model summary statistics.
VariableMeanStd. dev.MCSEMedianEqual-Tailed [95% Cred. Interval]
GI
DI_Rate0.08720830.0808060.0004670.0871589−0.0718764   0.2457907
Lit_Rate−0.0035450.02009140.000116−0.0035696−0.0430178   0.0361962
Acc0.30836260.07041960.0004090.30857980.1699415   0.445755
Pop_G−0.00004910.00034310.000002−0.0000496−0.0007276   0.0006253
_cons0.69714090.02481320.0001430.69707740.6486775   0.7460495
var0.01582750.00170060.000010.01570970.0128278   0.0195195
Source: Processed by the authors using SataSE 18.0 software.
Table 8. Posterior predictive statistics.
TMeanSt. DevE(T_obs)P(T > = T_obs)
mean0.85130270.01316870.84705230.6268333
ymin0.46608530.05923680.25920670.9965
ymax1.2675830.06707591.2695370.4440333
Source: Processed by the authors using SataSE 18.0 software.
Disclaimer/Publisher’s Note: The statements, opinions and data contained in all publications are solely those of the individual author(s) and contributor(s) and not of MDPI and/or the editor(s). MDPI and/or the editor(s) disclaim responsibility for any injury to people or property resulting from any ideas, methods, instructions or products referred to in the content.