Abstract
This study aims to rate the impact of the three major risks (credit, capital adequacy, and liquidity) on three financial performance measures (return on equity (ROE), earnings per share (EPS), and price-earnings ratio (PER)). This study stands out as one of the few in its field, and the only one focusing on banks in the Middle East and Africa, to employ the adaptive neural network-based fuzzy inference system (ANFIS) that combines neural networks and fuzzy logic systems. The significance of this study lies in its comprehensive coverage of major risks and performance variables and its application of highly technical, sophisticated, and precise AI techniques (ANFIS). The main findings indicate that credit risk, as measured by the non-performing loans (NPL) has significant impact on both ROE and EPS. Liquidity risk comes second in importance for ROE and EPS, with the loan-deposit ratio (LDR) being the dominant component. In contrast, liquidity risk is the most significant determinant of PER, followed by capital adequacy. Our results also show that CAR, LDR, and NPL are the most significant risk components of capital adequacy, liquidity, and credit risks, respectively. The study contributes to business knowledge by applying the ANFIS technique as an accurate predictor of risk rating. Future research will explore the relationship between risks and macroeconomic indicators and differences among countries.
1. Introduction
Risk measurement represents a major challenge that influences the banking sector’s performance. Adopting advanced analytical techniques is necessary to address these challenges and provide accurate measures of risks. Analyzing and rating the impact of banking risks on their financial performance helps many stakeholders, such as management, depositors, shareholders, regulators, and analysts, predict the bank’s future and how to deal with it. Adopting sophisticated and accurate AI techniques such as the adaptive neural network-based fuzzy inference system (ANFIS) that combines neural networks and fuzzy logic systems will be useful in measuring the association between banking risk and performance (Liu et al. 2022; Neshat et al. 2012; Yeom and Kwak 2018).
The study aims to explain the impact of banking risks on the financial performance of the Middle East and Africa (MEA) banks. This is to investigate the relationship between each of the elements of the three major risk variables and the measures of financial performance in terms of return on equity (ROE), earnings per share (EPS), and price-earnings ratio (PER). Banks encounter different types of risks, including credit risk, capital adequacy risk, liquidity risk, interest rate risk, market risk, technology risk, operational risk, foreign exchange risk, country risk, and insolvency risk. The adept and efficient management of these risks is crucial for a bank’s survival and performance.
Many previous studies have explored the relationship between risk and performance in the banking sector such as (Erasmus 2022; Walker et al. 2023; Pham et al. 2024). However, some research gaps still exist. First, unlike previous studies that investigated the relationship between one risk variable and one or two performance measures, this study covers many types of risks and different performance measures. Second, this study selects the 100 largest banks in the Middle East and Africa (MEA) as they dominate 80% share of the banking sector in the region and represent the rest of the banks. Most of the previous studies were done on a country basis with a very small size of banks. Third, to have an accurate measure and rating of the impact of risks on banking performance, the study is the first to apply a sophisticated AI technique, which is different from previous ones as all previous studies that applied regression analysis. Based on the AI techniques applied by Mohamed et al. (2021) the ANFIS model provided an efficient and accurate estimation technique that can adapt to changing conditions. Therefore, the ANFIS is applied as it shows high accuracy in measuring such relationships. Another significant aspect of this study is its timeliness, as it addresses the recent shift where risk variables have become the main concern for banking management, banks’ survival, and performance. Unlike previous studies conducted mostly over the past decade, risks were not the primary issue before then. In addition, this study will have great implications for knowledge as it helps academicians and research scholars to study the banking sector in the Middle East and Africa (MEA) in detail and also assist practitioners and decision-makers in understanding and rating the impact of risk on performance and formulating plans and strategies.
Managers and policymakers are highly interested in understanding and measuring the causal relationship between banking risks and performance. Investigating the non-linear nature of the risk and performance and identifying the threshold beyond which risk becomes detrimental to bank performance is a real research gap. Many of the previous studies have found a significant impact of contextual factors, such as the banks’ size on the banking risk and performance relationship. This study primarily focuses on various risk variables and investigates the top 100 African and Middle Eastern banks. It aims to mitigate the impact of bank size on performance, which was a primary factor in many previous studies. Many previous studies defined the individual relationships but didn’t rank which is the most influential risk and on which performance indicator. Alam et al. (2021) expected that future research should explore the relationship between risks and performance variables. Addressing such research gaps will enhance the understanding of this complicated relationship between banking risk and performance, contribute to the development of effective risk management, and inform policymakers to ensure a sound and stable banking system. Rastogi et al. (2022) discovers that factors such as concentration in banking, market power, the presence of large banks, and lower levels of competition have a significant impact on the financial stability, profitability, and risk of banks. Nevertheless, this impact has not been evaluated. Therefore, we are motivated to undertake this study.
The study is structured as follows: Section 1 contains the introduction, highlighting the rationale, significance, and objectives of the study. Section 2 explores the relevant literature, while Section 3 encompasses the data collection and analysis method details. Section 4 presents the results and subsequent discussion. Lastly, Section 5 offers conclusions and recommendations for future research.
2. Literature Review
Numerous studies have been proposed in recent years to investigate the risk factors that affect bank performance. Identifying and quantifying the risk factors impacting the bank’s performance is imperative as they directly affect the bank’s continuity. Measuring the association between risk and performance is derived from the risk-return tradeoff theory, which is supported by the capital asset pricing model framework. In this section, the study highlights the literature related to the relationship between the three major financial risks (credit, liquidity, and capital adequacy) and the banking performance measures to address the research gaps.
2.1. Credit Risk and Performance
During this risky era, banks need to identify, measure, manage, and control credit risk and keep the required levels of adequate capital to be adequately compensated for expected and incurred risks. Bhattarai (2016) identified the impact of the credit risk of 14 Nepalese banks and stated that the ‘ratio of non-performing loans’ negatively impacts the banking profitability, whereas the ‘cost per loan’ positively impacts the banking performance. Moreover, the bank size has a positive effect on bank performance. The credit risk significantly impacts the banks’ profitability as stated by Kodithuwakku (2015); Zou and Li (2014), and Kwashie et al. (2022). Hamza (2017) investigated the impact of credit risk on Pakistani banks’ performance and concluded that loan loss provision, liquidity, and Non-performing loans hurt the performance, whereas capital adequacy, loan provisions, and bank size have a positive impact on the return on assets. On the other side, all the investigated variables significantly affect return on equity. Poudel (2012) also found a significant positive relationship between effective credit risk management and the performance of Nepal commercial banks. Abiola and Olausi (2014) explored the influence of credit risk on the performance of commercial banks in Nigeria. Ekinci and Poyraz (2019) examine the correlation between credit risk and the profitability of Turkish deposit banks. The findings suggest a noteworthy adverse relationship between credit risk and both ROA and ROE. All the mentioned studies investigated the association between credit risk and one performance variable based on conventional statistical techniques. Hence, this study goes beyond association to rate the impact of all the risks on different performance variables as well as adopting sophisticated machine learning techniques.
2.2. Liquidity Risk and Performance
The impact of liquidity risk on profitability has been investigated by many previous studies. Siddique et al. (2022) indicated that liquidity, non-performing loans, and cost efficiency ratio have a significant negative relationship with financial performance (ROA and ROE) while lending amount and capital adequacy ratio have a significant positive relationship with the performance of the commercial banks in Asia. Li et al. (2025) pointed out that liquidity has a significant negative relationship with ROA and ROE. Alshatti (2015) has investigated the impact of risk management on the financial performance of Jordanian banks using the capital adequacy ratio, credit interest ratio, provision for loss ratio, leverage ratio, and non-performing loans ratio as independent variables and found controversial results. Conversely, Meliza and Hermilasari (2024) found that more liquidity risk increases bank profitability. Eltweri et al. (2024) stated that the liquidity risk and profitability association is non-linear as both low and high levels of liquidity lower performance.
Al-Khouri (2011) explored the impact of specific risk characteristics in six Gulf Cooperation Council (GCC) countries banks from 1998 to 2008. The study applied regression analysis and found that liquidity risk is the only factor affecting profitability when measured by return on equity. One of the limitations of Al-Khouri (2011) is the focus on limited variables of risks and performance in the GCC banking sector. The negative relationship between liquidity and profitability has been identified by Saâdaoui and Khalfi (2024).
The contradictory relationship between liquidity risk and banking performance requires the adoption of advanced analytical techniques to measure and rate the impact of liquidity on the different measures of performance.
2.3. Capital Adequacy and Performance
Research investigating the risk factors related to bank performance continues to be introduced. For example, Wanjiru et al. (2024) find that capital adequacy has positively influenced the financial performance of banks. Erasmus (2022) explored the influence of tailor-made internal risk control systems on bank performance. The study revealed that the customized control environment, risk assessment, control activities, monitoring, net interest margin, and tailored information and communication positively affect the return on assets, indicating enhanced profitability. One of the limitations of his study is that he used only one performance factor, ROA. Other performance factors similar to ROE and net interest margin need to be included in his study. Al-Sharkas and Al-Sharkas (2022) stated that core capital has a positive impact on ROE, but hurts stock returns.
Similarly, Zhao et al. (2022) indicated that free marketing and banks’ capital adequacy positively influence banking financial performance, while banks’ loaning efficiency and NPL have a negative linkage with the G20 banking performance. Hersugondo et al. (2021) examined the influence of bank-level factors similar to non-performing assets, capital adequacy, and the risk of insolvency on bank performance. Their results found that NPA has an important negative effect on bank performance. Also, they have found that capital adequacy significantly negatively influences the bank’s performance. In addition, they have shown that insolvency risk for a bank has a significant impact on bank performance. An interesting study that aimed to determine the key effect of macroeconomic variables and risk management on bank performance is given by (Areghan et al. 2021). Their result indicated a positive link between the capital adequacy ratio and the GDP on the ROA. Kacem and Harbi (2022) examined the effect of risk corporate governance techniques related to management on bank performance. Some findings demonstrate the consequence of the risk management committee in improving the bank’s performance (Hersugondo et al. 2021; Areghan et al. 2021). Walker et al. (2023) used profitability and solvency as two measures of performance and observed a substantial impact on equity ratio and tier-1 capital ratio.
The bank size and oil price impact on bank performance has been investigated by (Colesnic et al. 2020). In terms of efficiency, they have found that, on average, small banks are better than large banks. Moreover, their size has a lower negative effect on technical risk management.
The reviewed literature that discussed the risk factors impacting bank performance used conventional statistical approaches (Mirashk et al. 2024; Nguyen et al. 2025). With the recent development in data mining and data analysis, machine learning (ML) approaches were introduced to evaluate these factors impacting bank performance. Machine learning (ML) explores computers’ capacity to enhance their performance through data, as discussed by Han et al. (2012), Liu et al. (2022), Huang (2012), Himeur et al. (2023), Yue Qiu et al. (2025), Nallakaruppan et al. (2024), and Veryzhenko (2021). ML is a subfield of artificial intelligence (AI) that includes numerous algorithms similar to classification algorithms (supervised learning) and clustering algorithms (unsupervised learning).
Many researchers have investigated and compared the applications of ML and conventional statistical methods in the banking sector. For example, Alonso-Robisco and Carbó (2022) study indicates that ML approaches surpass conventional statistical models in predictive power for numerous financial applications, like forecasting defaults. The ML algorithms compared include Deep learning, Extreme Gradients Boosting (XGBoost), Random forest, Trees (CART), and Logistic Lasso. They were compared with a prominent model like Logit. The application of ML in text analysis opens the door to being implemented in numerous financial applications like credit risk prediction. ML can be used to analyze vast unstructured documents such as media reports and other forms of unstructured data.
ML approach was recently used to investigate the linkage between bank profit performance and business model (Bolívar et al. 2023). This indicates a shift from the traditional statistical approach to the most recent ML techniques. ML methods have been proven viable for predicting and measuring bank failure risk. For example, Kristóf and Virág (2022) used these techniques to predict the failure risk of many European Union banks. Their results indicate that the proposed models achieved remarkable forecasting power, with the C5.0 decision tree model producing the top performance.
ANFIS, a very powerful AI technique with great prediction power, has been used in various areas, including finance. This can be documented with the research conducted by Rajab and Sharma (2018), which identified several areas, among them finance, that have used neuro-fuzzy systems. ANFIS has also been used to assess credit risk in Chinese-listed corporations (Xiong and Li 2005). Their results indicate that the predictive accuracies of ANFIS surpass those of many machine learning models. Further applications of ANFIS in finance are shown in several research papers. For example, Wan and Si (2017) used ANFIS to identify matching patterns in financial time series. ANFIS has also been used by Jovic et al. (2019) and AbouElaz et al. (2025).
Among the studies that used ANFIS in finance is the work discussed in (Vella and Ng 2014), in which they have applied ANN and ANFIS to improve the time-varying risk-adjusted performance of trading systems. They have indicated that ANFIS revealed more stable performance across many market regimes, which underlines the viability of the technique in finance. Furthermore, Luthfi and Wibowo (2017) built a model based on ANFIS, which is capable of accurately predicting and analyzing customer loan payments.
An interesting research that investigated the viability of ANFIS in finance is discussed in (Boyacioglu and Avci 2010). They examined the predictability of stock market returns with ANFIS. They have indicated that ANFIS has produced results with 98.3% accuracy, which is far better than any regression model. ANFIS is implemented by Chen (2022) to predict the index closing price. The result obtained reveals that the average relative error about the closing price in the Shanghai index is 6.56%.
This study adopts ANFIS based on the high accuracy indicated by previous studies, its usefulness in predicting the nonlinear relationship between inputs and outputs, as well as the continuous update based on new data signals to adapt to changing conditions and improve control performance (AbouElaz et al. 2025).
The literature reviewed in this paper discussed the risk factors affecting bank performance using both traditional statistical techniques and the most recent ML approaches. The literature indicates that the ML approaches are far better than the traditional statistical techniques in terms of predicting power and finding an accurate link between risk factors and bank performance. However, very few studies tried to find a link between risk factors and bank performance, the authors believe that there is still a research gap that needs to be bridged. For example, using more than two performance measures and using neuro-fuzzy, prominent ML technique is expected to find a more accurate relation between risk factors and bank performance.
3. The Research Methodology and Analysis
The economies of the Middle East and many other African countries share several similarities. This region’s countries are rich in natural resources such as oil, minerals, fertile land, and animals. Similarities in economic structure suggest shared sources of their financial systems’ strengths and vulnerabilities. The recent economic growth in many countries in the Middle East and Africa has been significantly supported by the banking sector’s remarkable expansion and increasing influence. The banking industry is the largest component of the MEA’s financial system, and MEA financial institutions have expanded significantly over the past two decades. The Middle East and Africa 100 largest commercial banks (MEA100) 2022 is the population of this study. The 2022 evaluation covers banks from 15 countries, namely Bahrain, Jordan, Kuwait, Lebanon, Oman, Qatar, Saudi Arabia, UAE, Algeria, Egypt, Ghana, Kenya, Morocco, Nigeria, and South Africa in MEA. This ranking indicates that 69 banks from Middle East and African collectively held $5.1 trillion in total assets, $2.8 trillion in net loans, $3.5 trillion in customer deposits, and generated a total net profit of $69.2 billion. The report indicates that nations with a strong economy dominate the list of the largest 100 banks, as the GCC has 43 out of the 62 largest MEA banks (69%).
3.1. Data Collection
The study collects data on three major types of risks (capital adequacy, liquidity, and credit risks) that include seven measures allocated among the three risk factors for 62 MEA banks operating in the Middle East and Africa (MEA). The population of the study is the 100 largest banks in MEA. Few studies have been conducted in the banking sector of this region. The study selects 62 banks from the largest MEA100 banks as ranked by TAB Insights (2022). Given the region’s high-income levels and substantial private wealth, banking services are in high demand. They include asset management, private banking, and investment advisory services. Many MEA banks have expanded their operations regionally and internationally. In addition, the data is collected for three target variables related to financial performance. Input predictors and target variables with their measurements are shown in Table 1. The dataset covers the last ten years (2013 to 2022), resulting in a total of 620 records. The dataset was divided into 496 and 124 training and testing data subsets using 80:20, respectively. The model was trained using 10-fold cross-validation due to its relatively low bias and variance (Han et al. 2012) to prevent overfitting and improve generalization performance. The secondary data is primarily derived from the financial statements and reports of the MEA banks accessible via DataStream and the banks’ websites.

Table 1.
Input Predictors and Target Variables with Their Measurement.
The population of this study is the largest 100 banks in the MEA region. The bank size is typically used to capture potential economies or diseconomies of scale in the banking industry. This parameter explains the variances in product and risk diversification costs based on the organization’s size. This is included to account for the probability that large institutions are more likely to have a diversified product and loan portfolio (Goddard et al. 2004). To mitigate the influence of a bank’s size on its performance, only the largest banks, based on total assets, have been included in this study. The sample comprises the top 100 largest banks as ranked by TAB Insights in 2022. Specifically, data from the largest 62 banks have been included, while the remaining 38 banks among the top 100 MEA banks have been excluded due to data availability constraints over the past decade. Banks that did not commence operations or report financial data before 2013 have been omitted. Additionally, investment banks, government-owned banks, and those lacking sufficient risk data have been excluded from the analysis. The largest 62 banks with adequate data are from 15 MEA countries, distributed as follows: South Africa (4), Ghana (2), Nigeria (2), Morocco (3), Kenya (2), Egypt (2), Algeria (1), Lebanon (2), Jordan (1), Kuwait (9), UAE (8), KSA (7), Qatar (7), Bahrain (6), and Oman (6).
3.2. Fuzzy Inference System Based on Adaptive Neural Networks
Neuro-fuzzy inference systems, where a fuzzy inference system (FIS) integrates an artificial neural network, have been classified into the Mamdani system (Mamdani 1974; Mamdani and Assilian 1975; Dubois et al. 1997) and the Takagi–Sugeno system (Takagi and Sugeno 1985). Whereas a Takagi-Sugeno FIS employs linear or constant functions, a Mamdani FIS represents the consequent using fuzzy membership functions. When dealing with noisy input data, a Sugeno FIS performs better than a Mamdani FIS in computing accuracy, effectiveness, and robustness in processing vague and incomplete information. Takagi-Sugeno FIS is also a good fit for mathematical analysis since it functions well with optimization and adaptive techniques to guarantee the continuity of the output surface (Subhedar and Birajdar 2012; Hamam and Georganas 2008; MathWorks 2023a).
Jang (1991) proposed a neural network that is functionally equivalent to a Takagi-Sugeno fuzzy inference model, which he called an Adaptive Neuro-Fuzzy Inference System (ANFIS). ANFIS can combine the advantages of neural networks and fuzzy logic in a single architecture (Negnevitsky 2017). Its inference mechanism corresponds to a set of fuzzy if-then rules with the learning capability to approximate nonlinear functions to any degree of accuracy, and as such, ANFIS is regarded as a universal estimator (Abraham 2005; Jang et al. 1997). Using this methodology, the authors have already investigated the impact of business performance on stock price forecasts in UAE markets (Mohamed et al. 2021). Consequently, the ANFIS methodology based on the Sugeno FIS model is used in this study. ANFIS architecture and learning mechanism are described in Section 3.3 and Section 3.4, respectively. Detailed information on ANFIS can be found in Negnevitsky (2017), Jang (1993), and Mitra and Hayashi (2000).
3.3. ANFIS Architecture
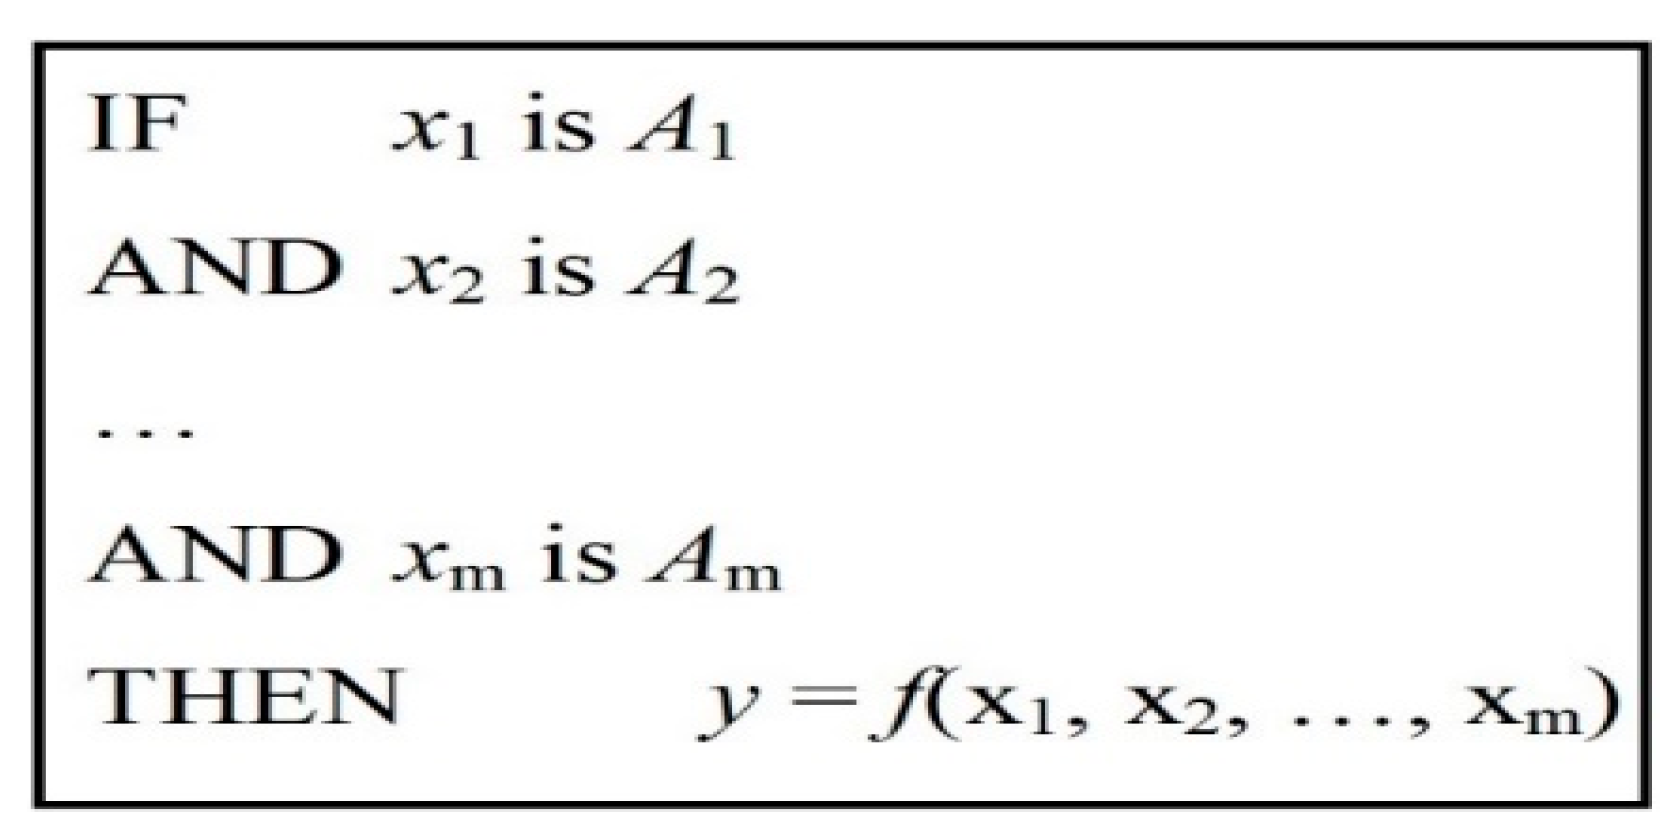
A typical Sugeno fuzzy rule can be expressed in the form shown in Figure 1 where x1, x2, …, xm are input variables; A1, A2, …, Am are fuzzy sets, and y is either a constant or a linear function of the input variables. When y is constant, we have a zero-order Sugeno fuzzy model in which the consequent of a rule is specified by a singleton, a single term. When y is a first-order polynomial shown in Equation (1),
we have a first-order Sugeno fuzzy model (Negnevitsky 2017).

Figure 1.
Sugeno Fuzzy Rule.
ANFIS is normally represented as a five-layer feedforward neural network, excluding input; Figure 2 shows a two-input (x1 and x2) and one output (y) ANFIS architecture that corresponds to a first-order Sugeno fuzzy model (Negnevitsky 2017). Figure 2 depicts that the five computational layers are fuzzification, product (or rule), normalization, defuzzification, and summation (Yeom and Kwak 2018).
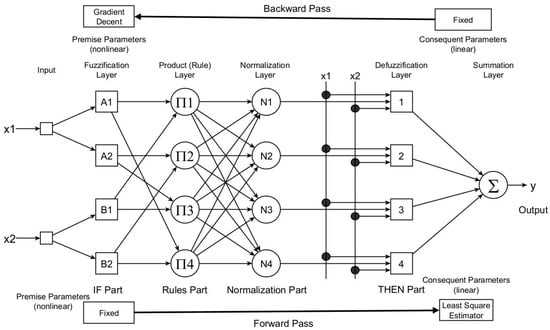
Figure 2.
An architecture for an adaptable Sugeno neuro-fuzzy inference system.
In Figure 2, each input is represented by two fuzzy sets, and the output by a first-order polynomial. ANFIS implements four rules in this case, as shown in Figure 3. The coefficients ki0, ki1, and ki2 are a set of parameters for rule i.

Figure 3.
The ANFIS rules for two input variables are represented by two fuzzy sets each.
Neurons in the fuzzification layer perform fuzzification using a bell-shaped (Gaussian) activation function specified in Equation (2).
where is the input and is the output of neuron i in the fuzzification layer; and ai, bi and ci are parameters that control, respectively, the centre, width, and slope of the bell activation function of neuron i.
The second layer is the product layer, where each neuron in this layer corresponds to a single Sugeno-type fuzzy rule. For this reason, it is also referred to as the rule layer. Assuming all inputs are represented by the same number of fuzzy sets, m, the number of neurons in this layer is mn, where n is the number of inputs. A neuron in this layer receives inputs from the respective fuzzification neurons and calculates the rule’s firing strength. In an ANFIS, the product operator evaluates the conjunction of the rule premises. Thus, the output of neuron i in layer 2 is obtained as in Equation (3),
where are the inputs and is the output of rule neuron i in layer 2.
Layer 3 is the normalization layer. Each neuron in this layer receives inputs from all the neurons in the rule layer, and the normalized firing strength of a given rule is calculated. The normalized firing strength is the ratio of the firing strength of a given rule to the sum of the firing strengths of all the rules. It represents the contribution of a given rule to the final result. Thus, the output of neuron i in layer 3 is determined as in Equation (4),
where is the input from neuron j in layer 2 to neuron i in layer 3.
Layer 4 is the defuzzification layer. Each neuron in this layer is connected to the respective normalization neuron in the rule layer and also receives the initial inputs, x1 and x2. A defuzzification neuron calculates the weighted consequent value of a given rule as,
where is the input and is the output of defuzzification neuron i in layer 4, and , and is the set of consequent parameters of rule i.
Layer 5 is represented by a single summation neuron. This neuron calculates the sum of outputs of all defuzzification neurons and produces the overall ANFIS output y as in Equation (6),
Equation (6) shows that ANFIS is functionally equivalent to the first-order Sugeno fuzzy model. However, specifying a rule consequence in a polynomial form is often difficult; in ANFIS, this is not required as ANFIS learns these parameters and tunes the membership functions from the data using the neural networks’ learning capability (Negnevitsky 2017). It can be observed that the ANFIS architecture consists of two adaptive layers, namely the first layer and the fourth layer. The three modifiable parameters (ai, bi, ci) are referred to as premise parameters in the first and fourth layers; there are also three modifiable parameters (ki0, ki1, ki2) relating to the first-order polynomial. These parameters are so-called consequent parameters (Negnevitsky 2017).
3.4. ANFIS Learning
For parameter learning, ANFIS applies a hybrid gradient descent algorithm and the least-squares estimator as optimization techniques (Jang et al. 1997). A bell-shaped activation function is initially assigned to each neuron’s membership function with three Gaussian membership functions per input variable. For every epoch, there are two phases of training: a forward and a backward pass, as depicted in Figure 2. Using training data, the ANFIS learning algorithm uses a least-squares algorithm to estimate and tune the rules’ consequent parameters during the forward pass while the premise parameters remain fixed. Once the neural network has established the consequent parameters of the rules, it can determine the error. As errors propagate backward during the backward pass, the back-propagation learning technique tunes the premise (membership function) parameters while the consequent parameters are fixed (Jang et al. 1997; Negnevitsky 2017). Increasing the number of epochs can help ANFIS perform better, but assigning three membership functions to each input variable yields significantly better results (Azadeh et al. 2015; Negnevitsky 2017; Talpur et al. 2023; Ontiveros et al. 2024; Castillo et al. 2023; Chang et al. 2024).
Training is stopped when one of three conditions is satisfied: a maximum of 300 epochs is reached, a training error tolerance of 0.1 × 10⁻⁶ is reached, or the validation error increases continuously for five consecutive epochs to allow for early training termination.
3.5. Building the Fuzzy Model
A fast and robust method for the identification of fuzzy models from input-output data was proposed by Chiu (1996) in two steps. In the first step, an initial fuzzy model has to be derived. This model is required to find the number of inputs, the number of linguistic variables, and hence the number of rules in the final fuzzy model. The initial model is also required to select the input variables for the final model and the model selection criteria before the final optimal model can be derived. This initial fuzzy model can be selected based on the fuzzy rules generated by either using the subtractive clustering technique or the grid partitioning method (Jang 1993). In this work, the rules were generated using the subtractive clustering method. Clustering techniques can divide the input data space into clusters to decrease the number of rules (Yazdani-Chamzini et al. 2013; Kaur and Klair 2012). Efficiently estimating the cluster centers yields the best ideal rule basis for ANFIS. Each cluster ascertains the premise part of each rule that represents it. The consequent part is a linear equation that the optimization algorithm can adjust by applying any least squares technique (Hussain et al. 2015; Abu Huson et al. 2023). An important advantage of using a clustering method to find rules is that the resultant rules are more tailored to the input data than in an FIS generated without clustering (Kaur and Klair 2012). This reduces the problem of a combinatorial explosion of rules when the input data has a high dimension relative to the available input data. Through experimentation, we discovered that six clusters (rules) provided the best results when measured using the Root Mean Square Error (RMSE) criteria. We utilized MATLAB 2018a functions to implement the Sugeno-type neuro-fuzzy system (MathWorks 2023b, 2023c).
The second step is to remove all unimportant input variables from each rule and generate the final fuzzy model (Chiu 1996). This is done by removing the antecedent clause associated with an input variable from the rule and evaluating the model’s performance by applying a checking error criterion. If removing an input variable decreases the modeling error, the process is repeated by eliminating another input variable. If the modeling error increases, the eliminated variable is retained, and another variable is examined. This process continues until the modeling error cannot be further decreased by eliminating more input variables. The criterion used for selecting the final fuzzy model is the Root Mean Squared Error (RMSE). The ANFIS structure of the system, which is being modeled, is considered the final model for which the RMSE is the minimum.
3.6. Predictive and Explanatory Performance of the Model
The process of creating and applying a data-mining algorithm or numerical model to a dataset to make predictions about fresh or upcoming observations is known as predictive modeling. The primary objective is to predict the output for a new instance from its input values (Geisser 1993). However, it should be noted that the explanatory component of the model does not show its predictive ability; instead, it only shows how strongly the input and output variables are causally related to one another (Shmueli 2010). Determining the causal effect of every input variable is not essential since predictive modeling concentrates on the relationship between the input and dependent variables rather than on causation (Shmueli 2010). The primary difference between the two performance measurement metrics is the data source used to calculate the explanatory and predictive metrics (Stone 1974; Geisser 1975). The accuracy of the model’s predictions is frequently overstated by metrics derived from the data used to create it. Accordingly, evaluating a model’s prediction power in a more realistic situation is the testing data subset (Huang et al. 2024). Accuracy measures generated from data that are not part of the model creation process are used to evaluate the performance of predictive models.
In contrast, metrics computed from training datasets assess the explanatory strength of a particular input variable (Stone 1974; Geisser 1975). The accuracy measure used in this work is called “Variance Explained by Predictive Models based on Cross-Validation” (VEcv) (Li 2016). VEcv is a measure of how well the model fits the data. It is calculated by dividing the sum of squared differences between the observed and the predicted values by the total sum of squared differences between the observed values and the mean of the dependent variable. Unlike other precision measurements, the VEcv precision measure is unaffected by factors like applicability to non-linear models and sensitivity to the number of independent variables (Li 2016, 2017).
3.7. Significance of the Input Variables in Prediction
Backward elimination is a widely used method for assessing the relative predictive power of an input variable (Kohavi and John 1997). Having trained the ANFIS model with all input variables included, the testing data was used to compute the corresponding VEcv. Then, the model was retrained multiple times by removing one input variable at a time and calculating the difference in the VEcv using the testing dataset. According to Kohavi and John (1997), an input variable’s relative predictive influence increases with the size of the change in VEcv after the removal of that input predictor.
3.8. Model’s Explanatory Performance
The causal significance of each input parameter on market value and share price was determined through a sensitivity analysis. Many methods have been developed for sensitivity analysis using neural networks (Cao et al. 2016). It has been shown that the input perturbation technique (Zeng and Yeung 2003) and the partial derivative algorithm (Dimopoulos et al. 1995) give better results than other approaches (Gedeon 1997; Wang 2000). Despite this, there are two important problems with the partial derivatives method. Cheng and Yeung (1999) have shown that it is insufficient to determine the size of the input variable’s effect on the output sensitivity ratio without determining its direction. Secondly, it cannot work with neural networks that have an activation function that is not differentiable. For the above reasons, we used the perturbation approach in this investigation. By introducing noise, this process modifies one of the input variables but leaves the other inputs unchanged. For each input variable, the change ratio of the output concerning the input variable’s perturbation level is computed for multiple noise levels. The input variable with the most explanatory power on the system’s output is the one with the largest change ratio (Lamy 1996; Bai et al. 2011). The sensitivity ratio values for input perturbation levels ranging from 1% to 20% noise levels were computed in increments of 1% after the neuro-fuzzy model had been fully trained.
4. Discussion
In this section of the study, the usefulness of the model as a tool for identifying the most significant predictors and input parameters that explain variations in each of the three performance indicators (ROE, EPS, and PER) is discussed.
4.1. Return on Equity (ROE)
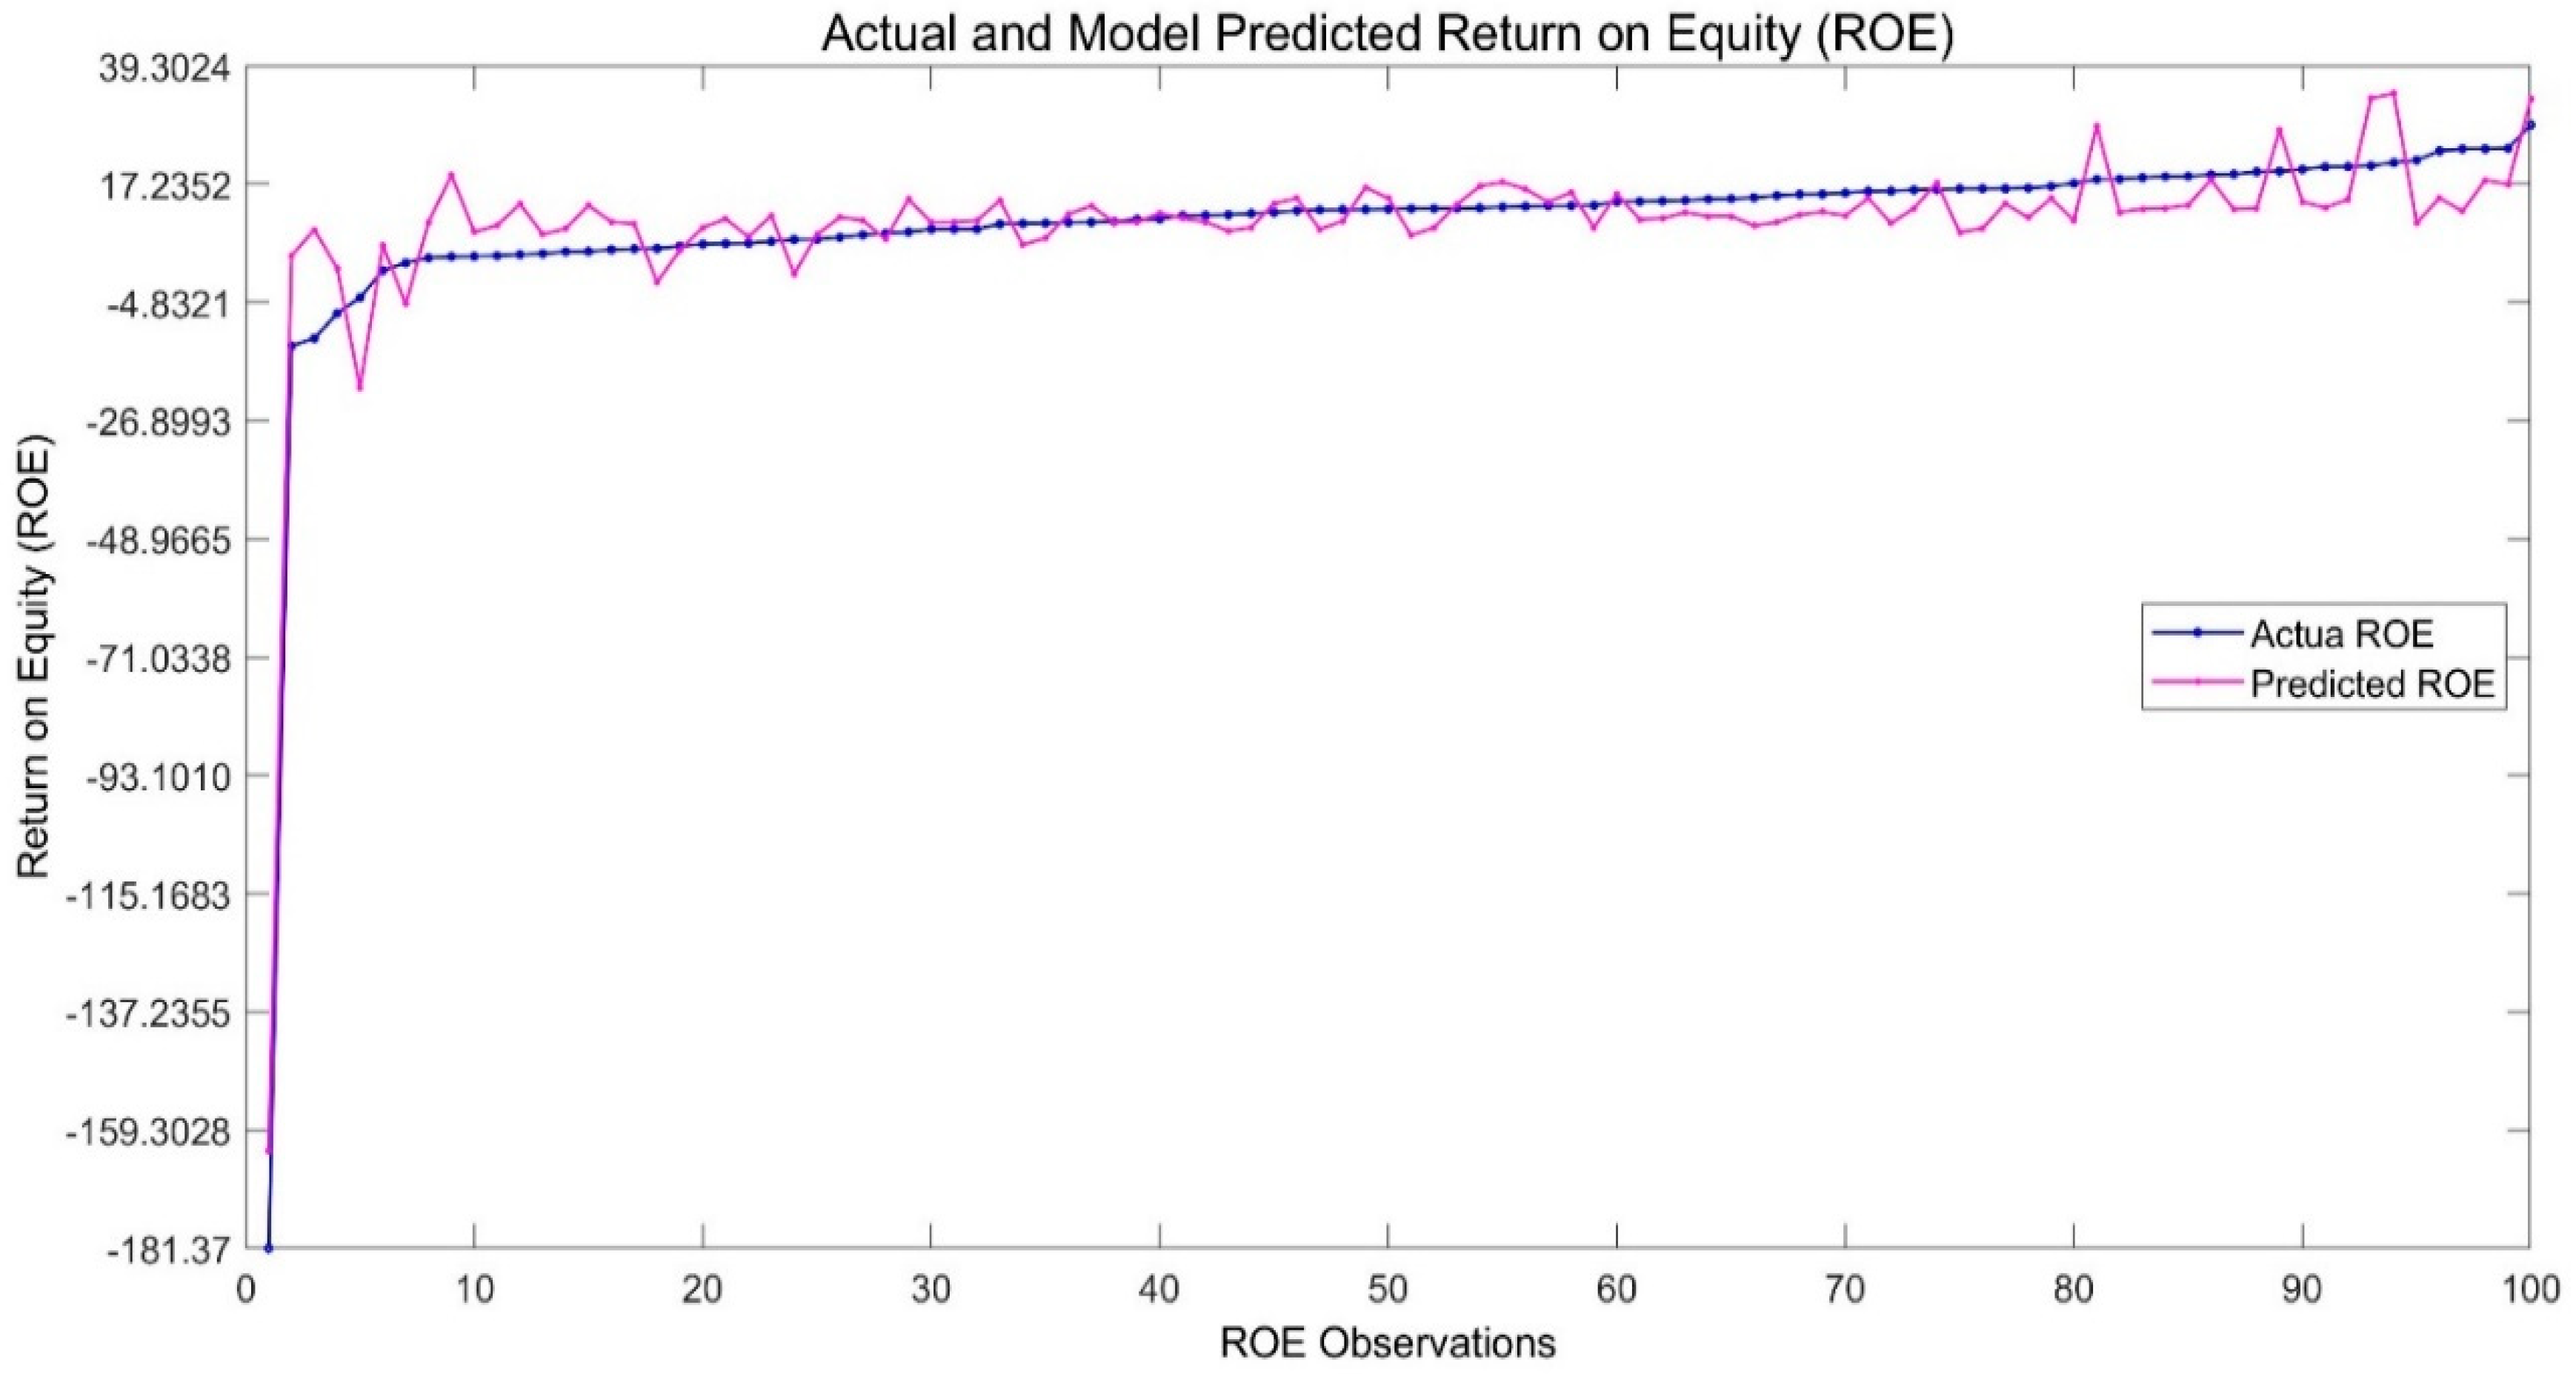
4.1.1. Relative Significance of ROE Predictors
Figure 4 shows the actual and predicted ROE for the 100 observations of the testing dataset. The model’s predictive accuracy is measured using VEcv, which is 90.1%, with a root mean square error (RMSE) of 6.45.
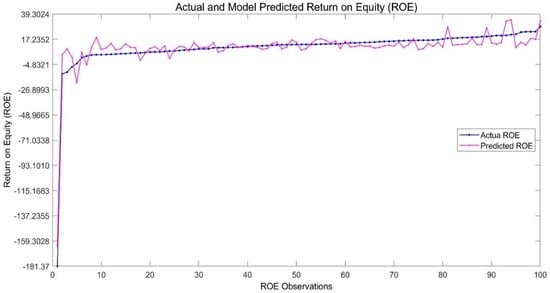
Figure 4.
Actual and predicted return on equity (ROE) using the testing dataset.
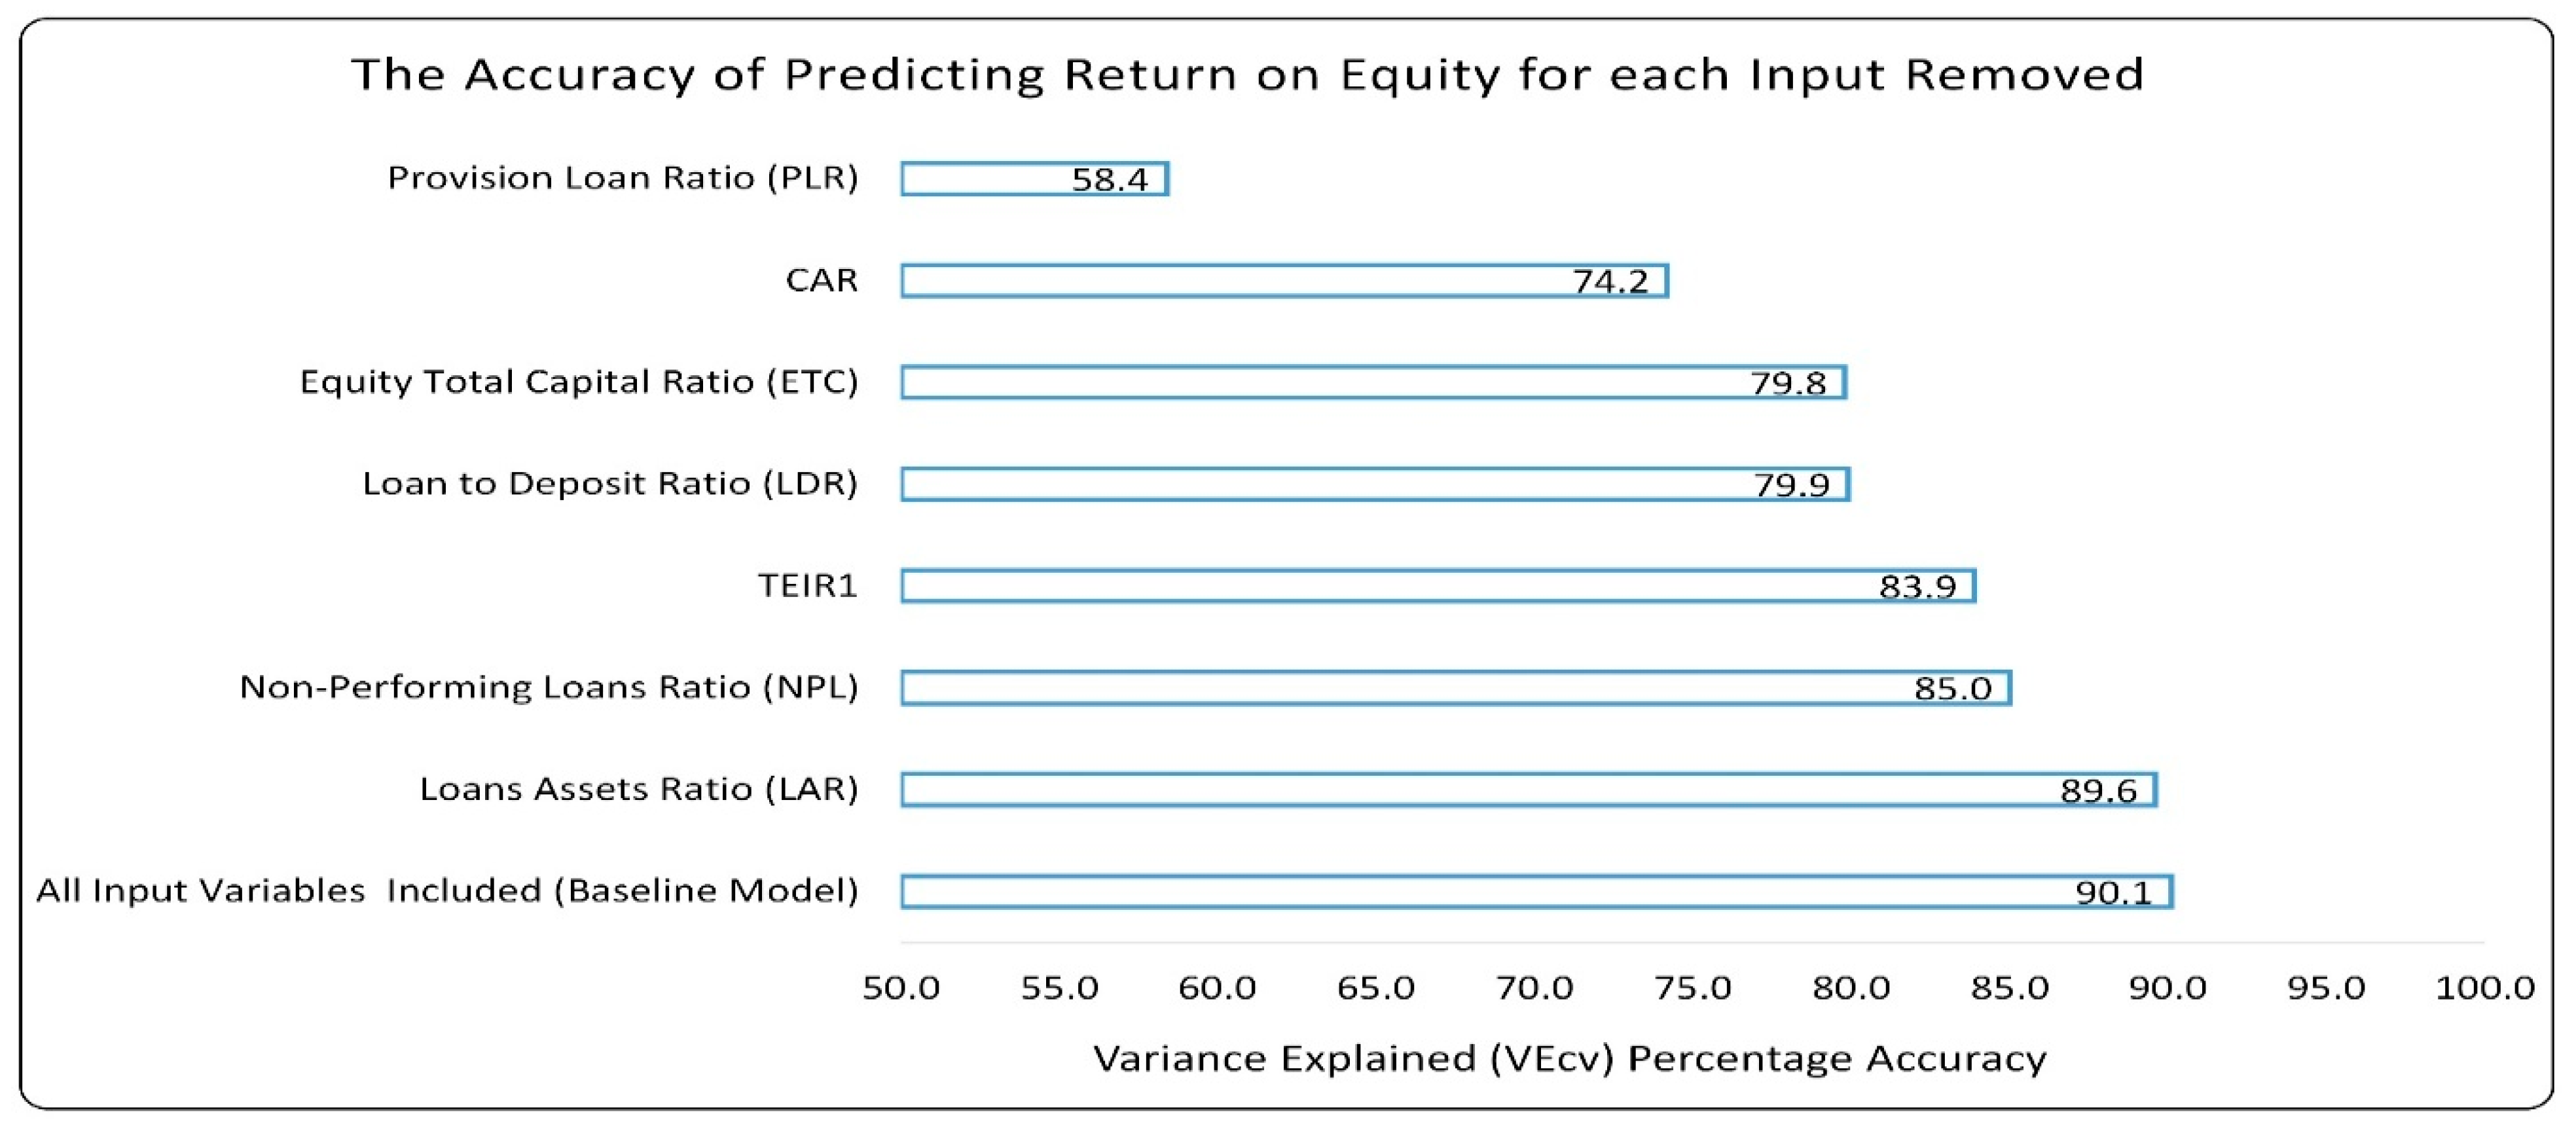
Figure 5 illustrates the predictive accuracy of ROE using VEcv when each input variable is systematically excluded. In Figure 5, the VEcv resulting from deleting one input at a time is denoted by the value on the respective horizontal bar. It is required to contrast this value with the VEcv on the bottom bar, where all input variables are considered simultaneously. The variations between these values indicate the extent of VEcv increase/decrease upon dropping a specific input parameter and its predictive strength (or weakness). Figure 5 depicts that the PLR attribute is the most powerful predictor of ROE, followed by CAR, with LAR being the least effective predictor.
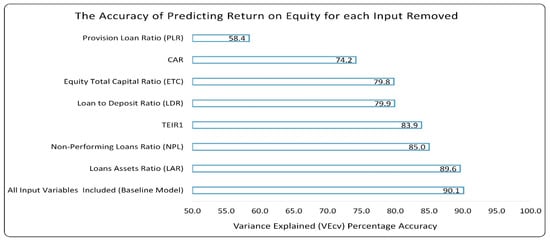
Figure 5.
Model’s predictive accuracy of ROE when dropping one predictor at a time.
4.1.2. Explaining Variations in ROE
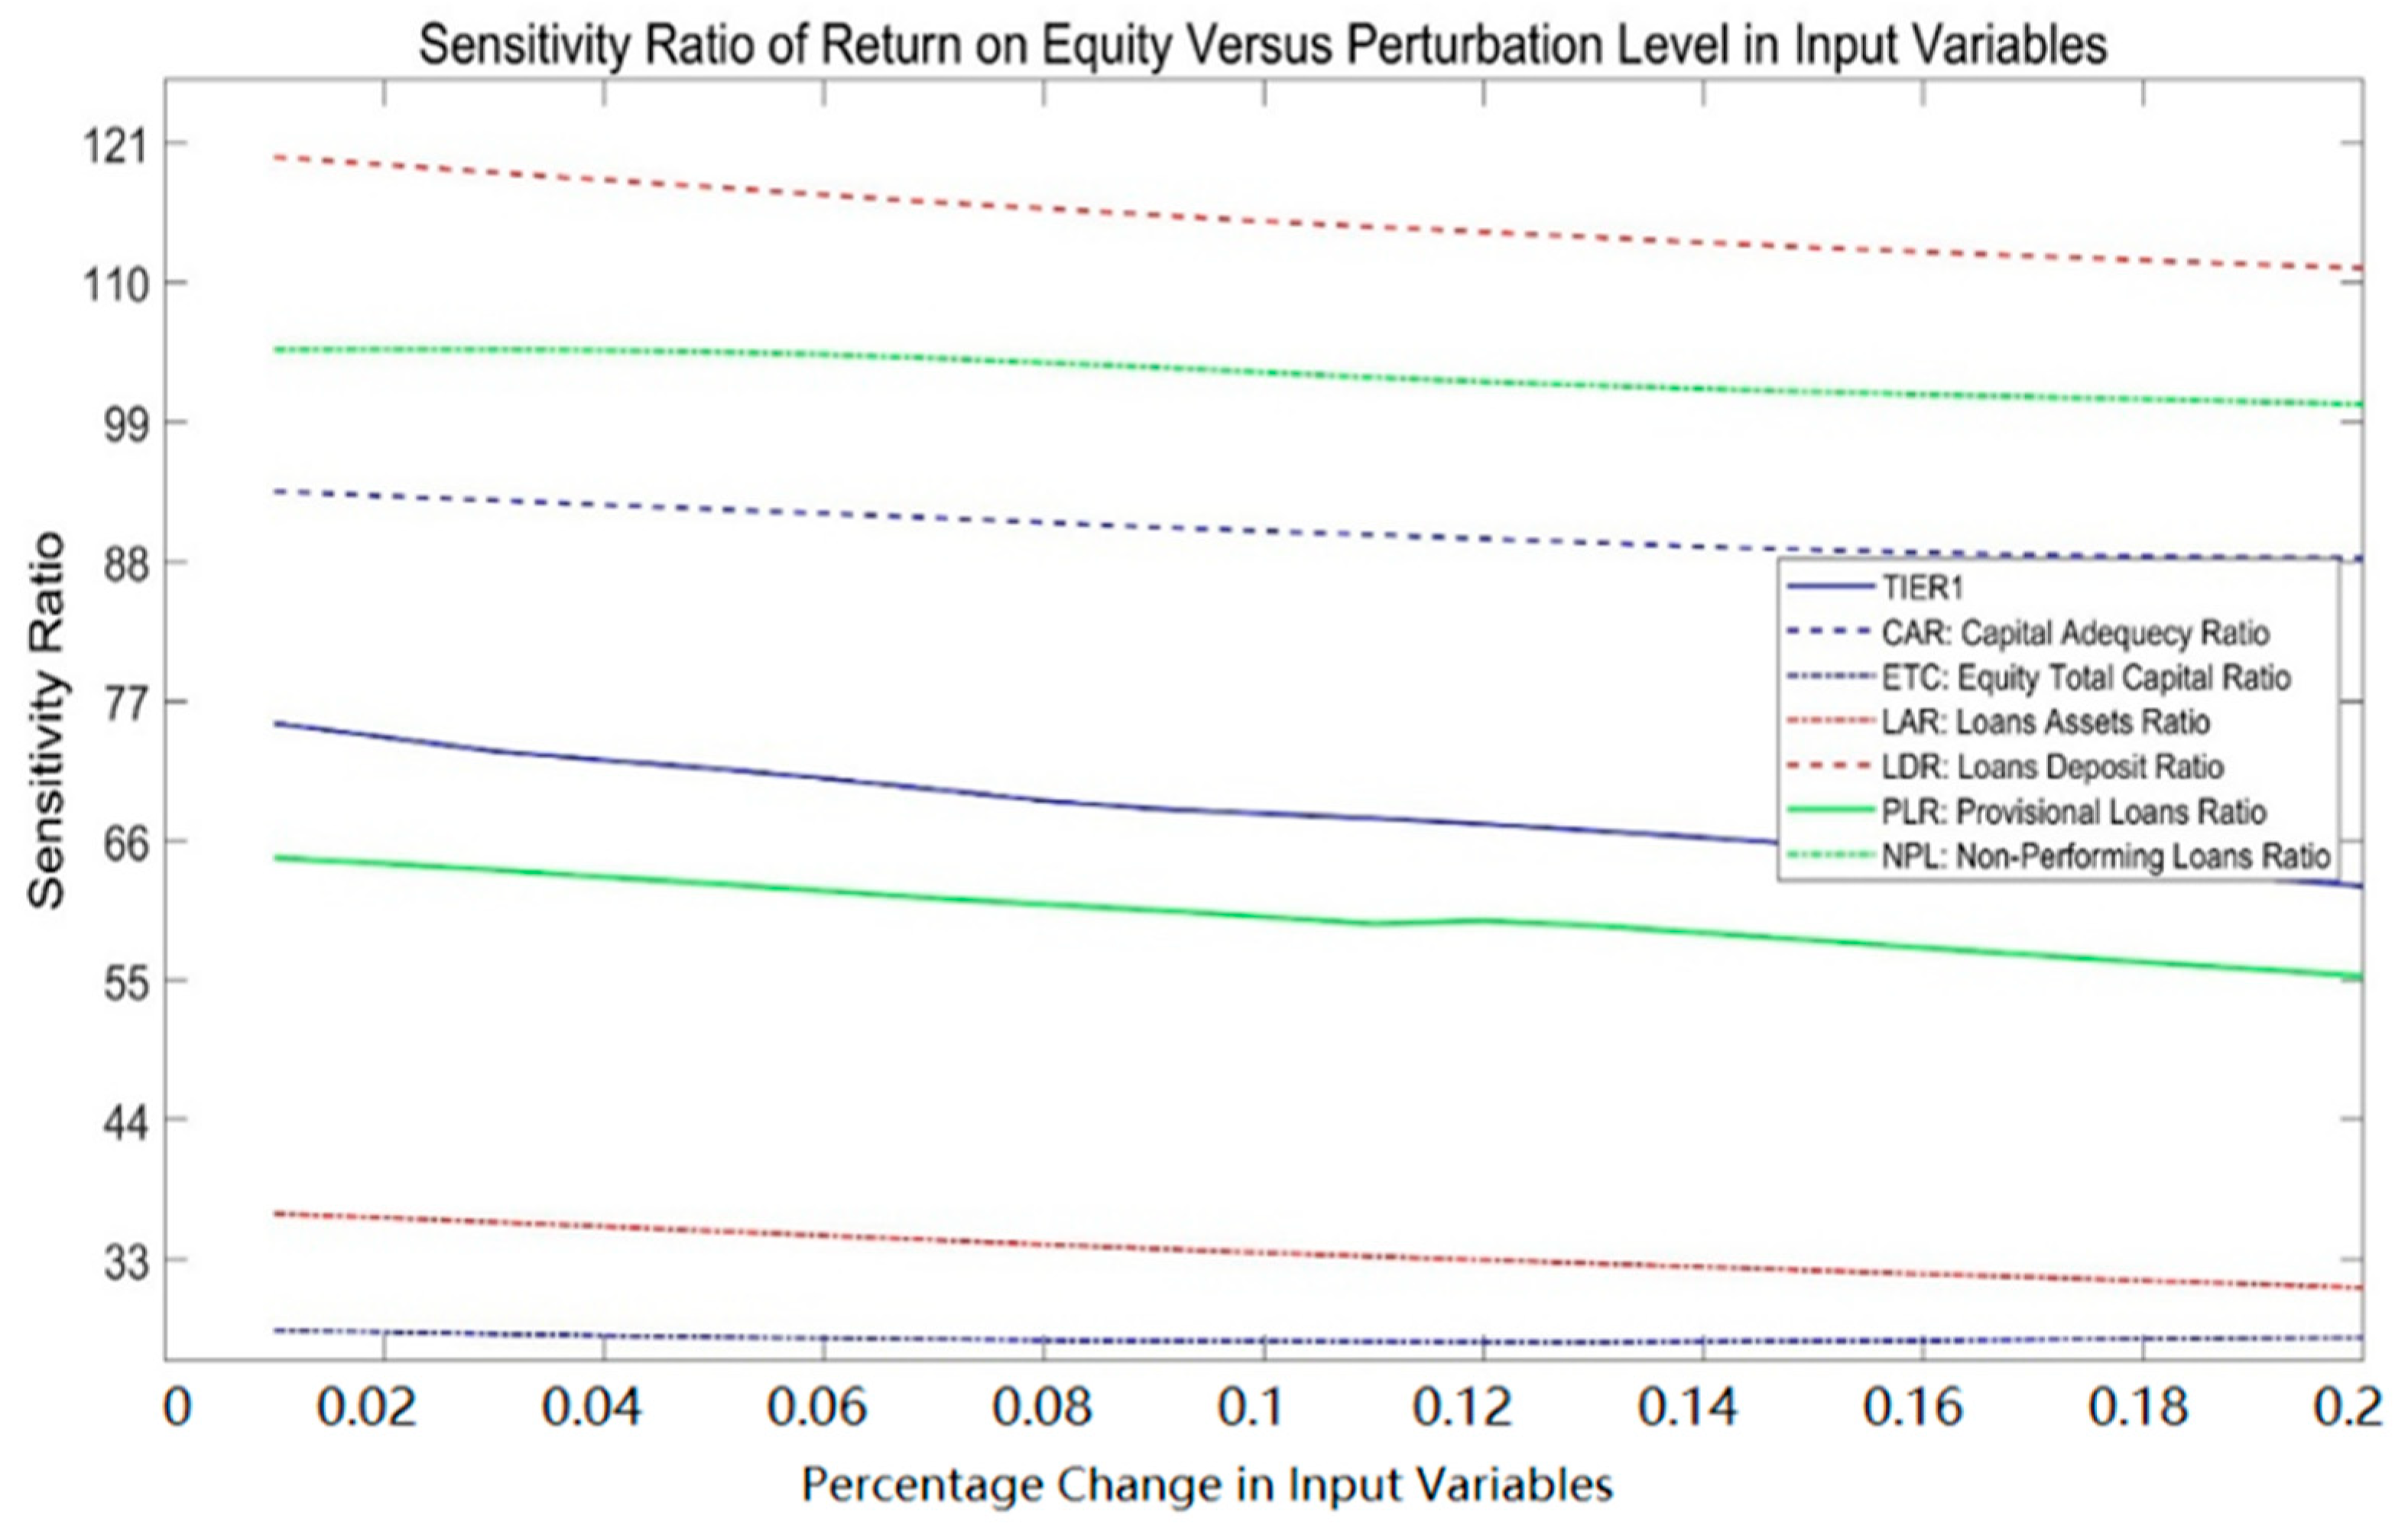
Using training data, the sensitivity ratio of ROE to perturbations in each input parameter was calculated to determine the most influential bank parameters that explain variations in ROE. Figure 6 and Table 2. The sensitivity ratio of PER concerning the three types of risks and their components depicts the sensitivity index of the model’s output for input variable perturbations from 1% to 20% in 1% increments. The sensitivity index values indicate that the LDR is the most significant parameter in explaining variations in ROE, followed by NPL and CAR in second and third place, respectively, with ETC as the least important.
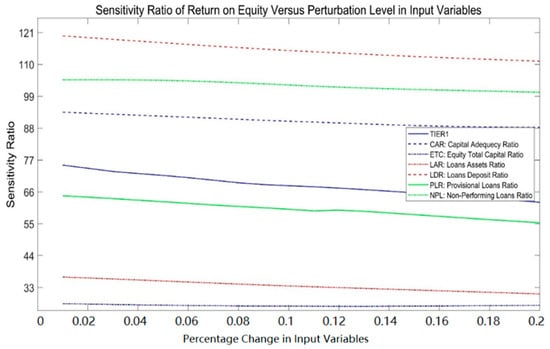
Figure 6.
ROE sensitivity values relative to input parameter perturbation levels.
Table 2.
Sensitivity ratio of ROE concerning the three types of risks and their components.
The findings are consistent with many previous studies, such as Al-Sharkas and Al-Sharkas (2022), Al-Khouri (2011), and Chou and Buchdadi (2016), as their study highlights LDR as the most influential parameter, where higher LDR values correlate with improved ROE in banks. NPL emerges as the second-most critical factor, with elevated NPL levels consistently showing a significant negative impact on ROE across multiple studies, reflecting the direct cost of poor loan quality on profitability (Vella and Ng 2014). Furthermore, as stated by Kim et al. (2020), the results for LDRs do not demonstrate a statistically significant effect on bank performance when measured using ROA. These findings indicate that the higher the LDR, the more favorable the performance of BPR. However, the results were inconsistent depending on whether or not bank performance is measured using NIM, ROE, or ROA. A positive relationship is observed between the LDRs and the banking performance.
Table 2 and Figure 6 show the ROE average sensitivity index for each risk component and type over the perturbations range. When considering all risk components collectively, our findings indicate that credit risk is critical in explaining variations in ROE, with NPL having more effect than PLR. These findings are consistent with those of Kacem and Harbi (2022) and Areghan et al. (2021) but contradicted Hersugondo et al. (2021) and Kwashie et al. (2022) who found a negative impact of NPL on banking performance. Liquidity risk comes in second place, with the LDR having more influence than the LAR; this is consistent with Siddique et al. (2020), who noted that liquidity has a considerable negative relationship with ROE. Capital adequacy risk comes last, with CAR more significant than the other two components of this type of risk, which is consistent with Zhao et al. (2022) findings.
4.2. Earnings per Share (EPS)
4.2.1. Relative Significance of EPS Predictors
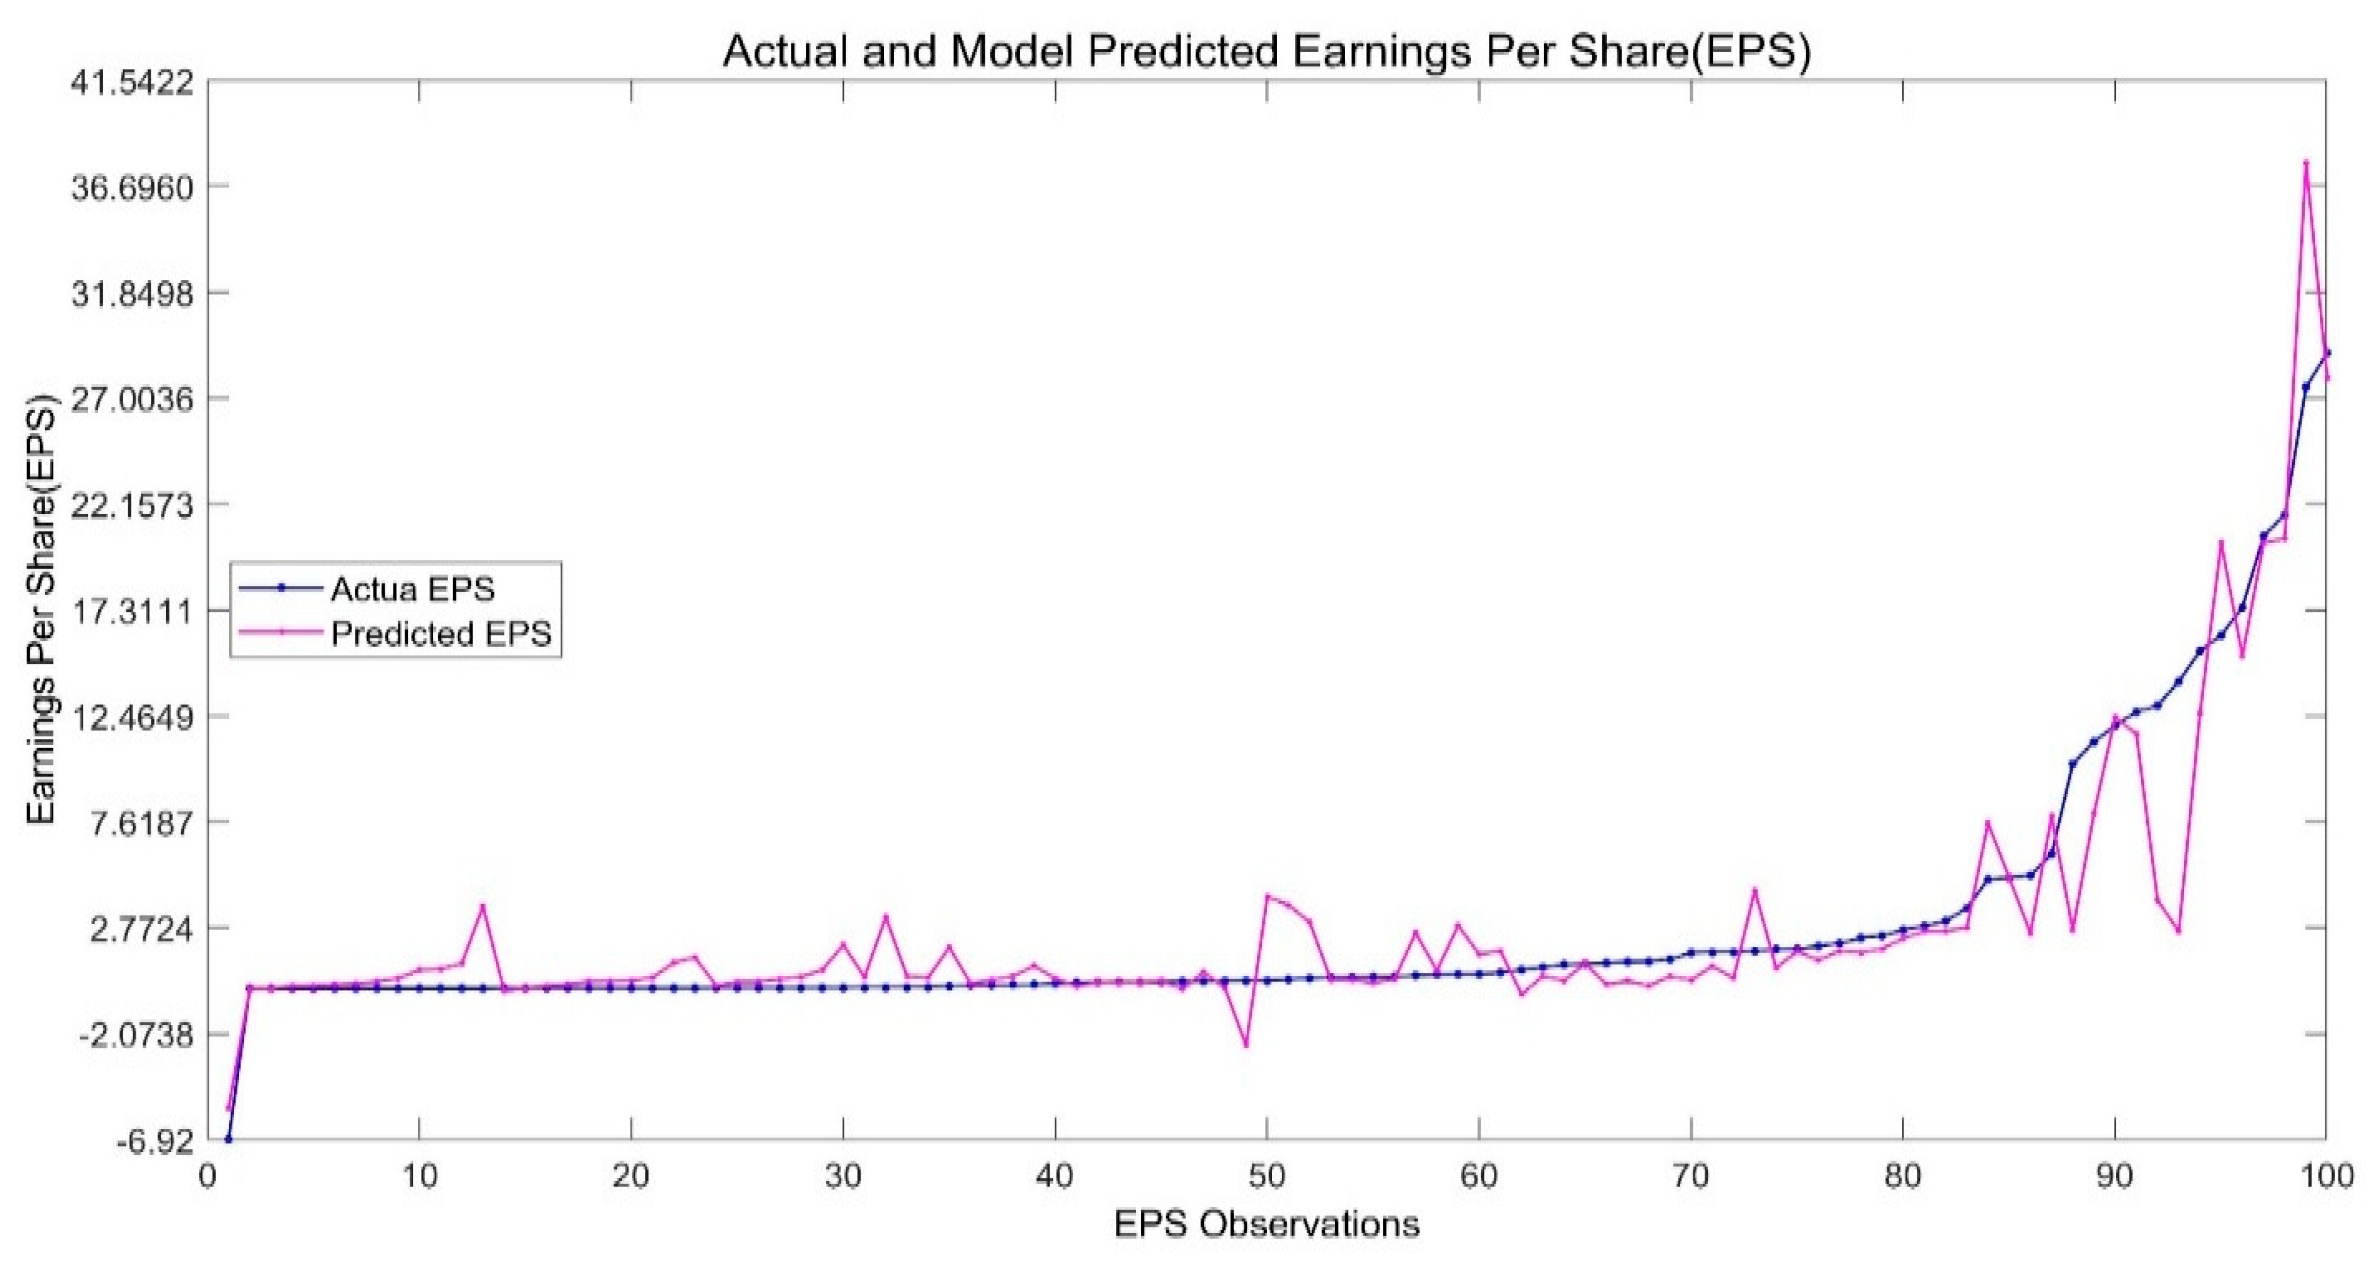
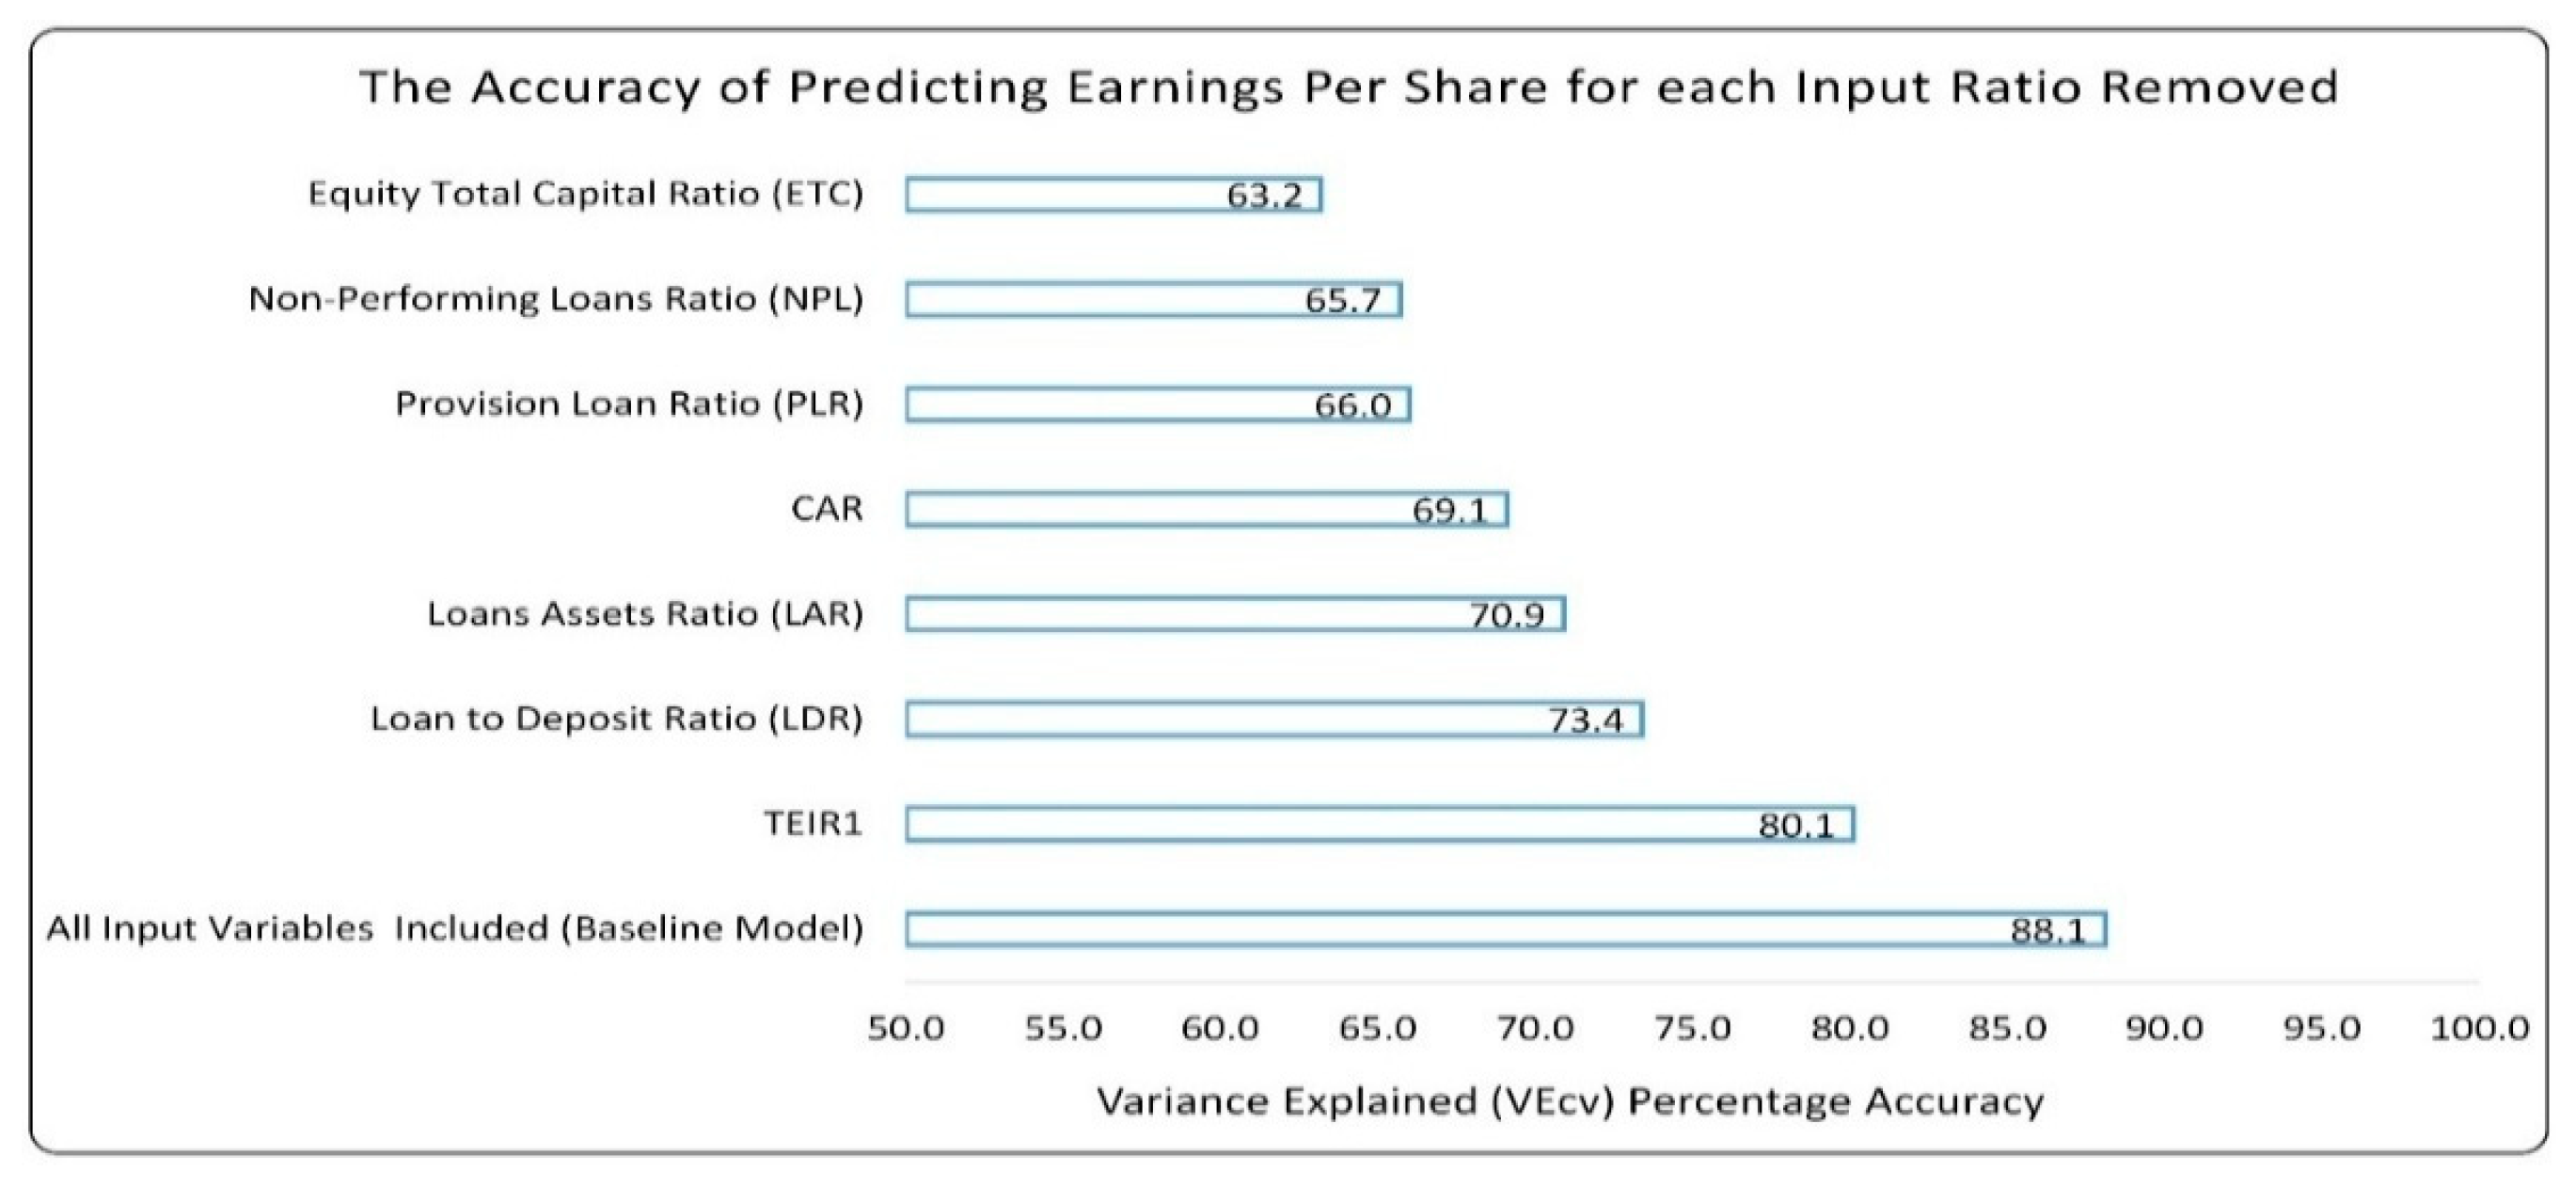
The predictive model was applied to the 100 observations of the testing dataset. Figure 7 shows the actual and predicted EPS values with an accuracy of 88.1% using the VEcv accuracy measure with an RMSE of 2.1. Figure 8 gives the VEcv predictive accuracy of EPS when each input variable is dropped one at a time. The results indicate that the ETC ratio is the most influential factor in EPS forecasting, followed by the NPL and PLR ratios in equal second place. TEIR1 appears to be the least effective in predicting EPS.
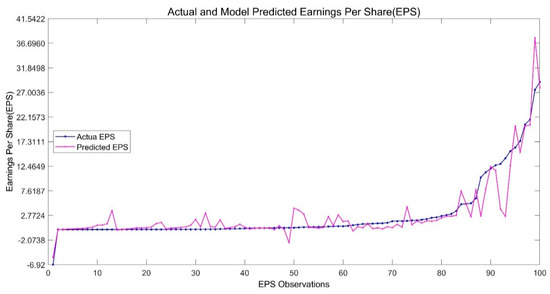
Figure 7.
Actual and predicted earnings per share using the testing dataset.
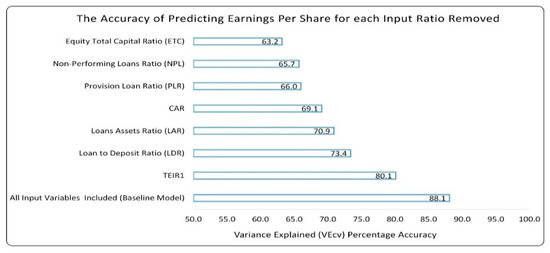
Figure 8.
Model’s predictive accuracy when dropping one predictor at a time.
4.2.2. Explaining Variations in EPS
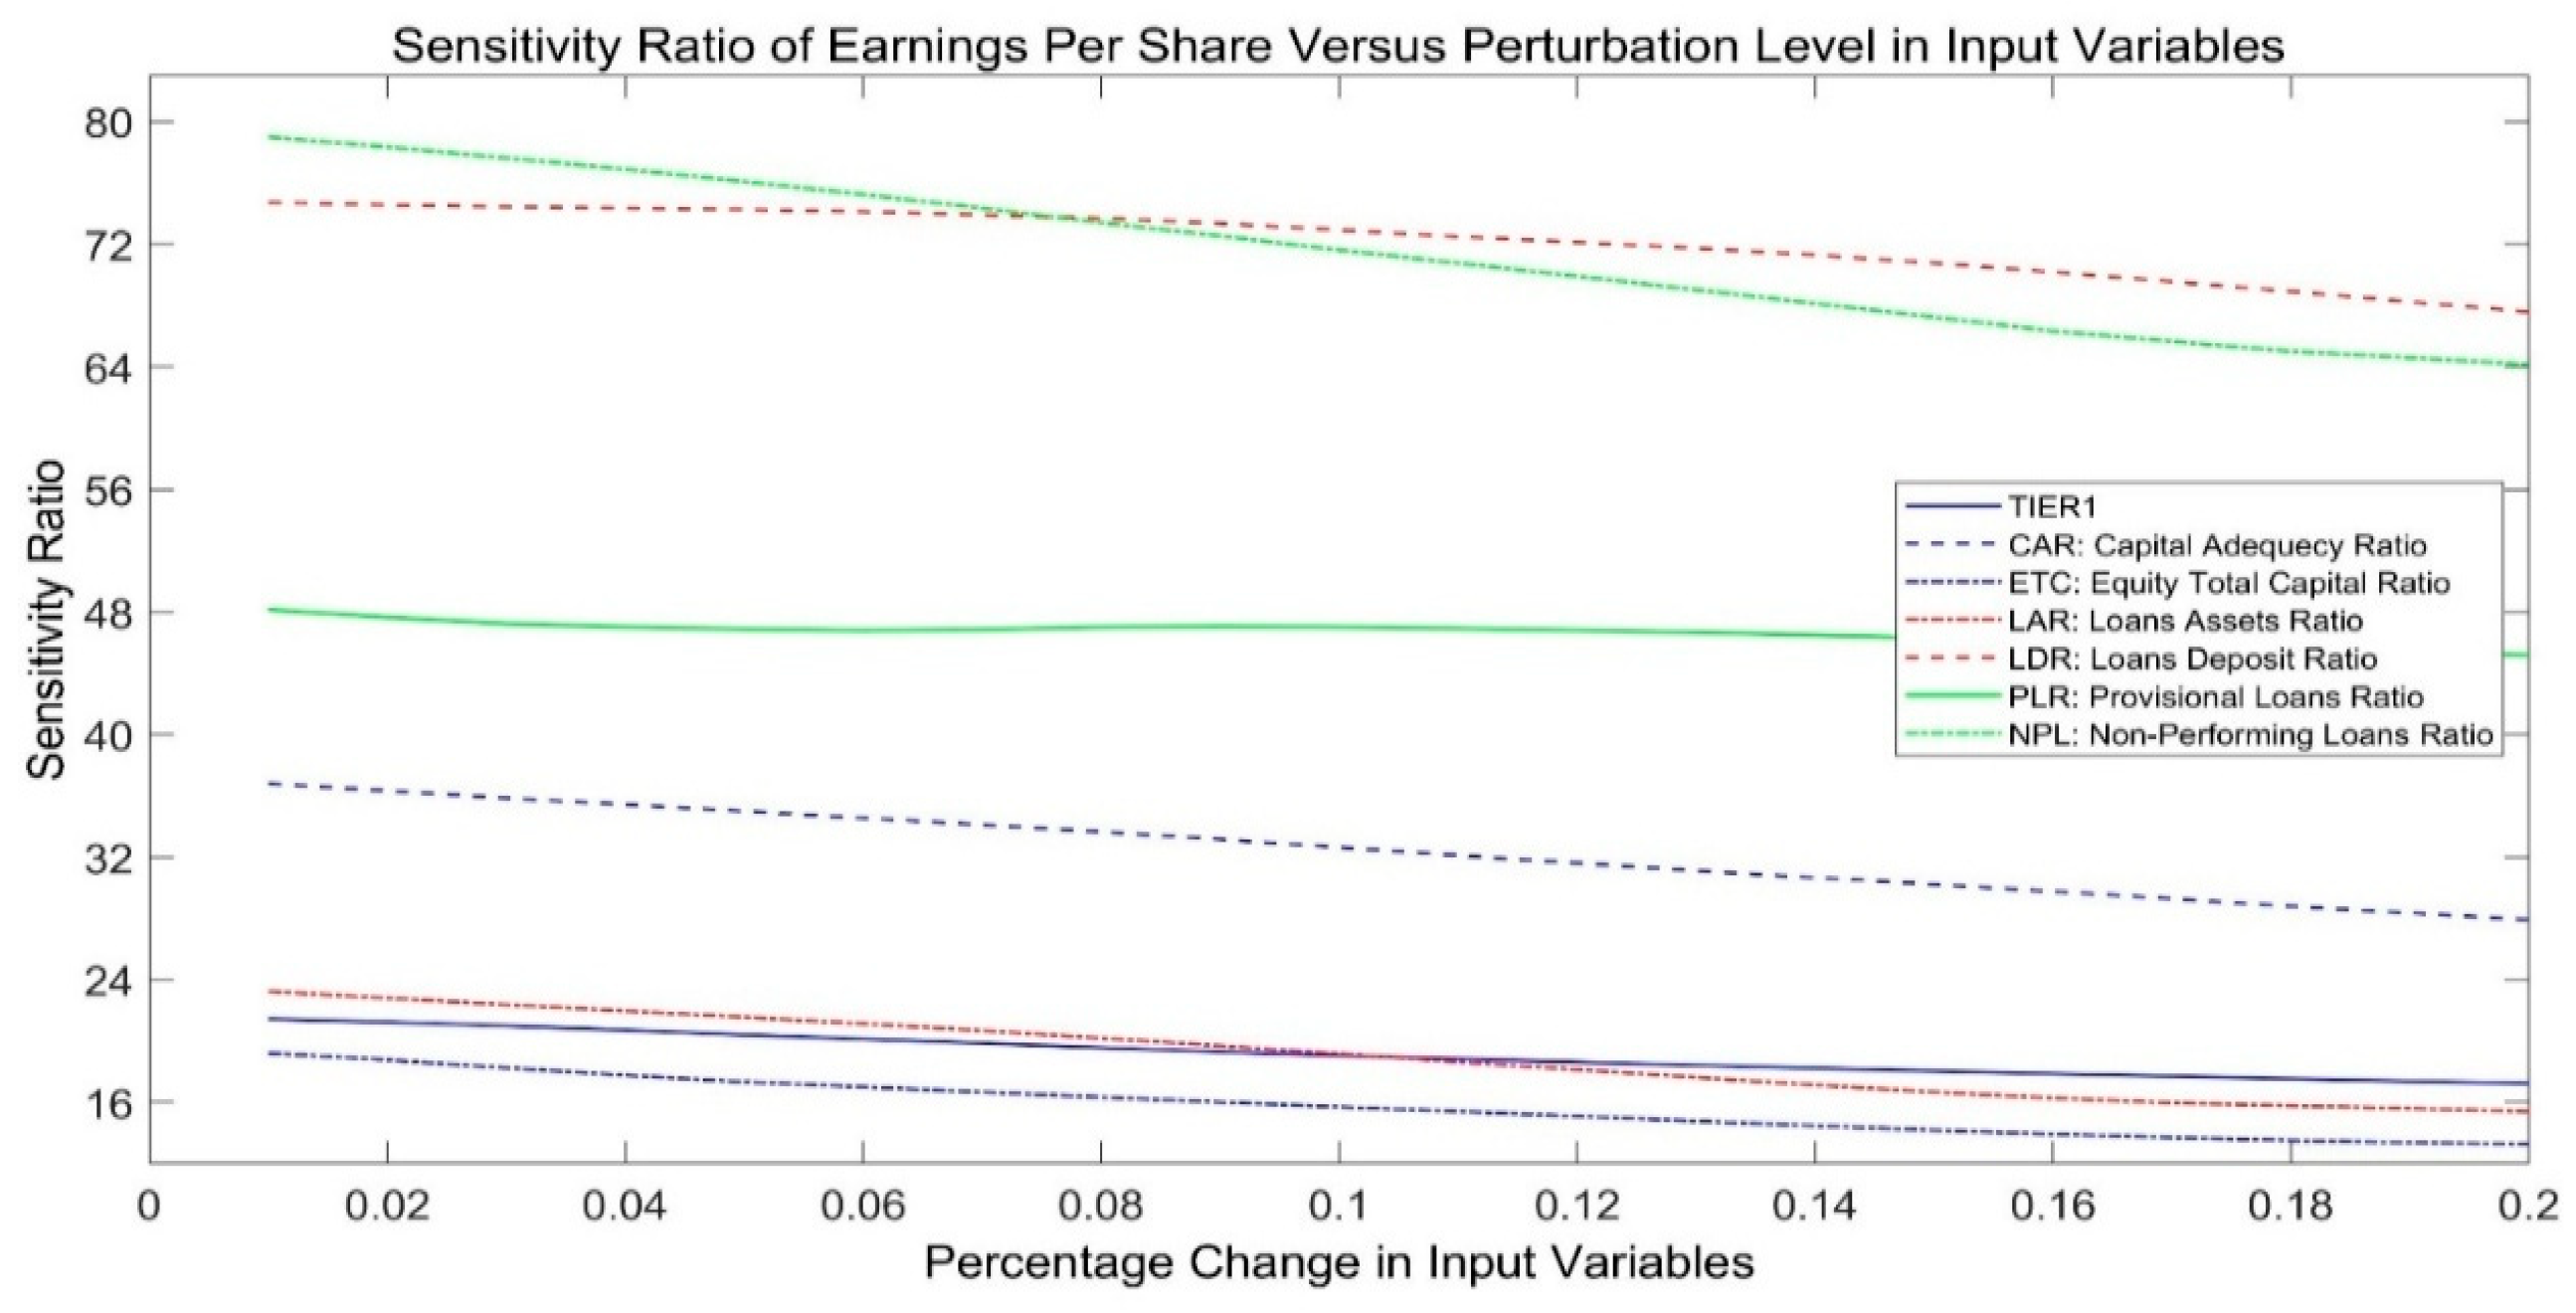
Using training data, the sensitivity ratio of EPS to perturbations in each input parameter was calculated to identify the most influential bank characteristics that explain variations in EPS. Figure 9 depicts the sensitivity index of the model’s EPS output for perturbations spanning from 1% to 20% in 1% increments for each input variable. The sensitivity index values indicate that the LDR ratio has the strongest effect on variations in EPS for perturbation levels above 8%, with NPL a very close second. It can also be observed that the ETC ratio has the least impact on EPS. In addition, TIER1 and LAR seem to have an equivalent effect. Table 3 gives the EPS sensitivity index for each risk component and type over the perturbations range. Collectively, based on the results shown in Table 3, credit risk is the dominant factor influencing EPS, with capital adequacy risk distant last. Very few studies have incorporated EPS as a performance measure that has been affected by risk. The findings are consistent with Banerjee et al. (2025) and Grau-Vera and Rubio (2024).
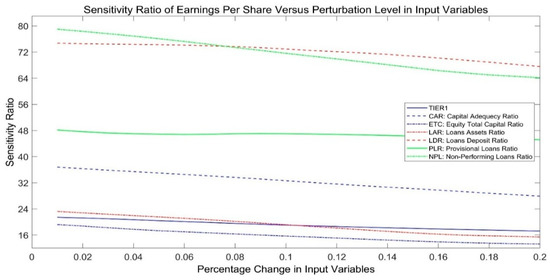
Figure 9.
EPS sensitivity values relative to input parameter perturbation levels.
Table 3.
The sensitivity ratio of EPS concerns the three types of risks and their components.
4.3. Price-Earnings Ratio (PER)
4.3.1. Relative Significance of PER Predictors
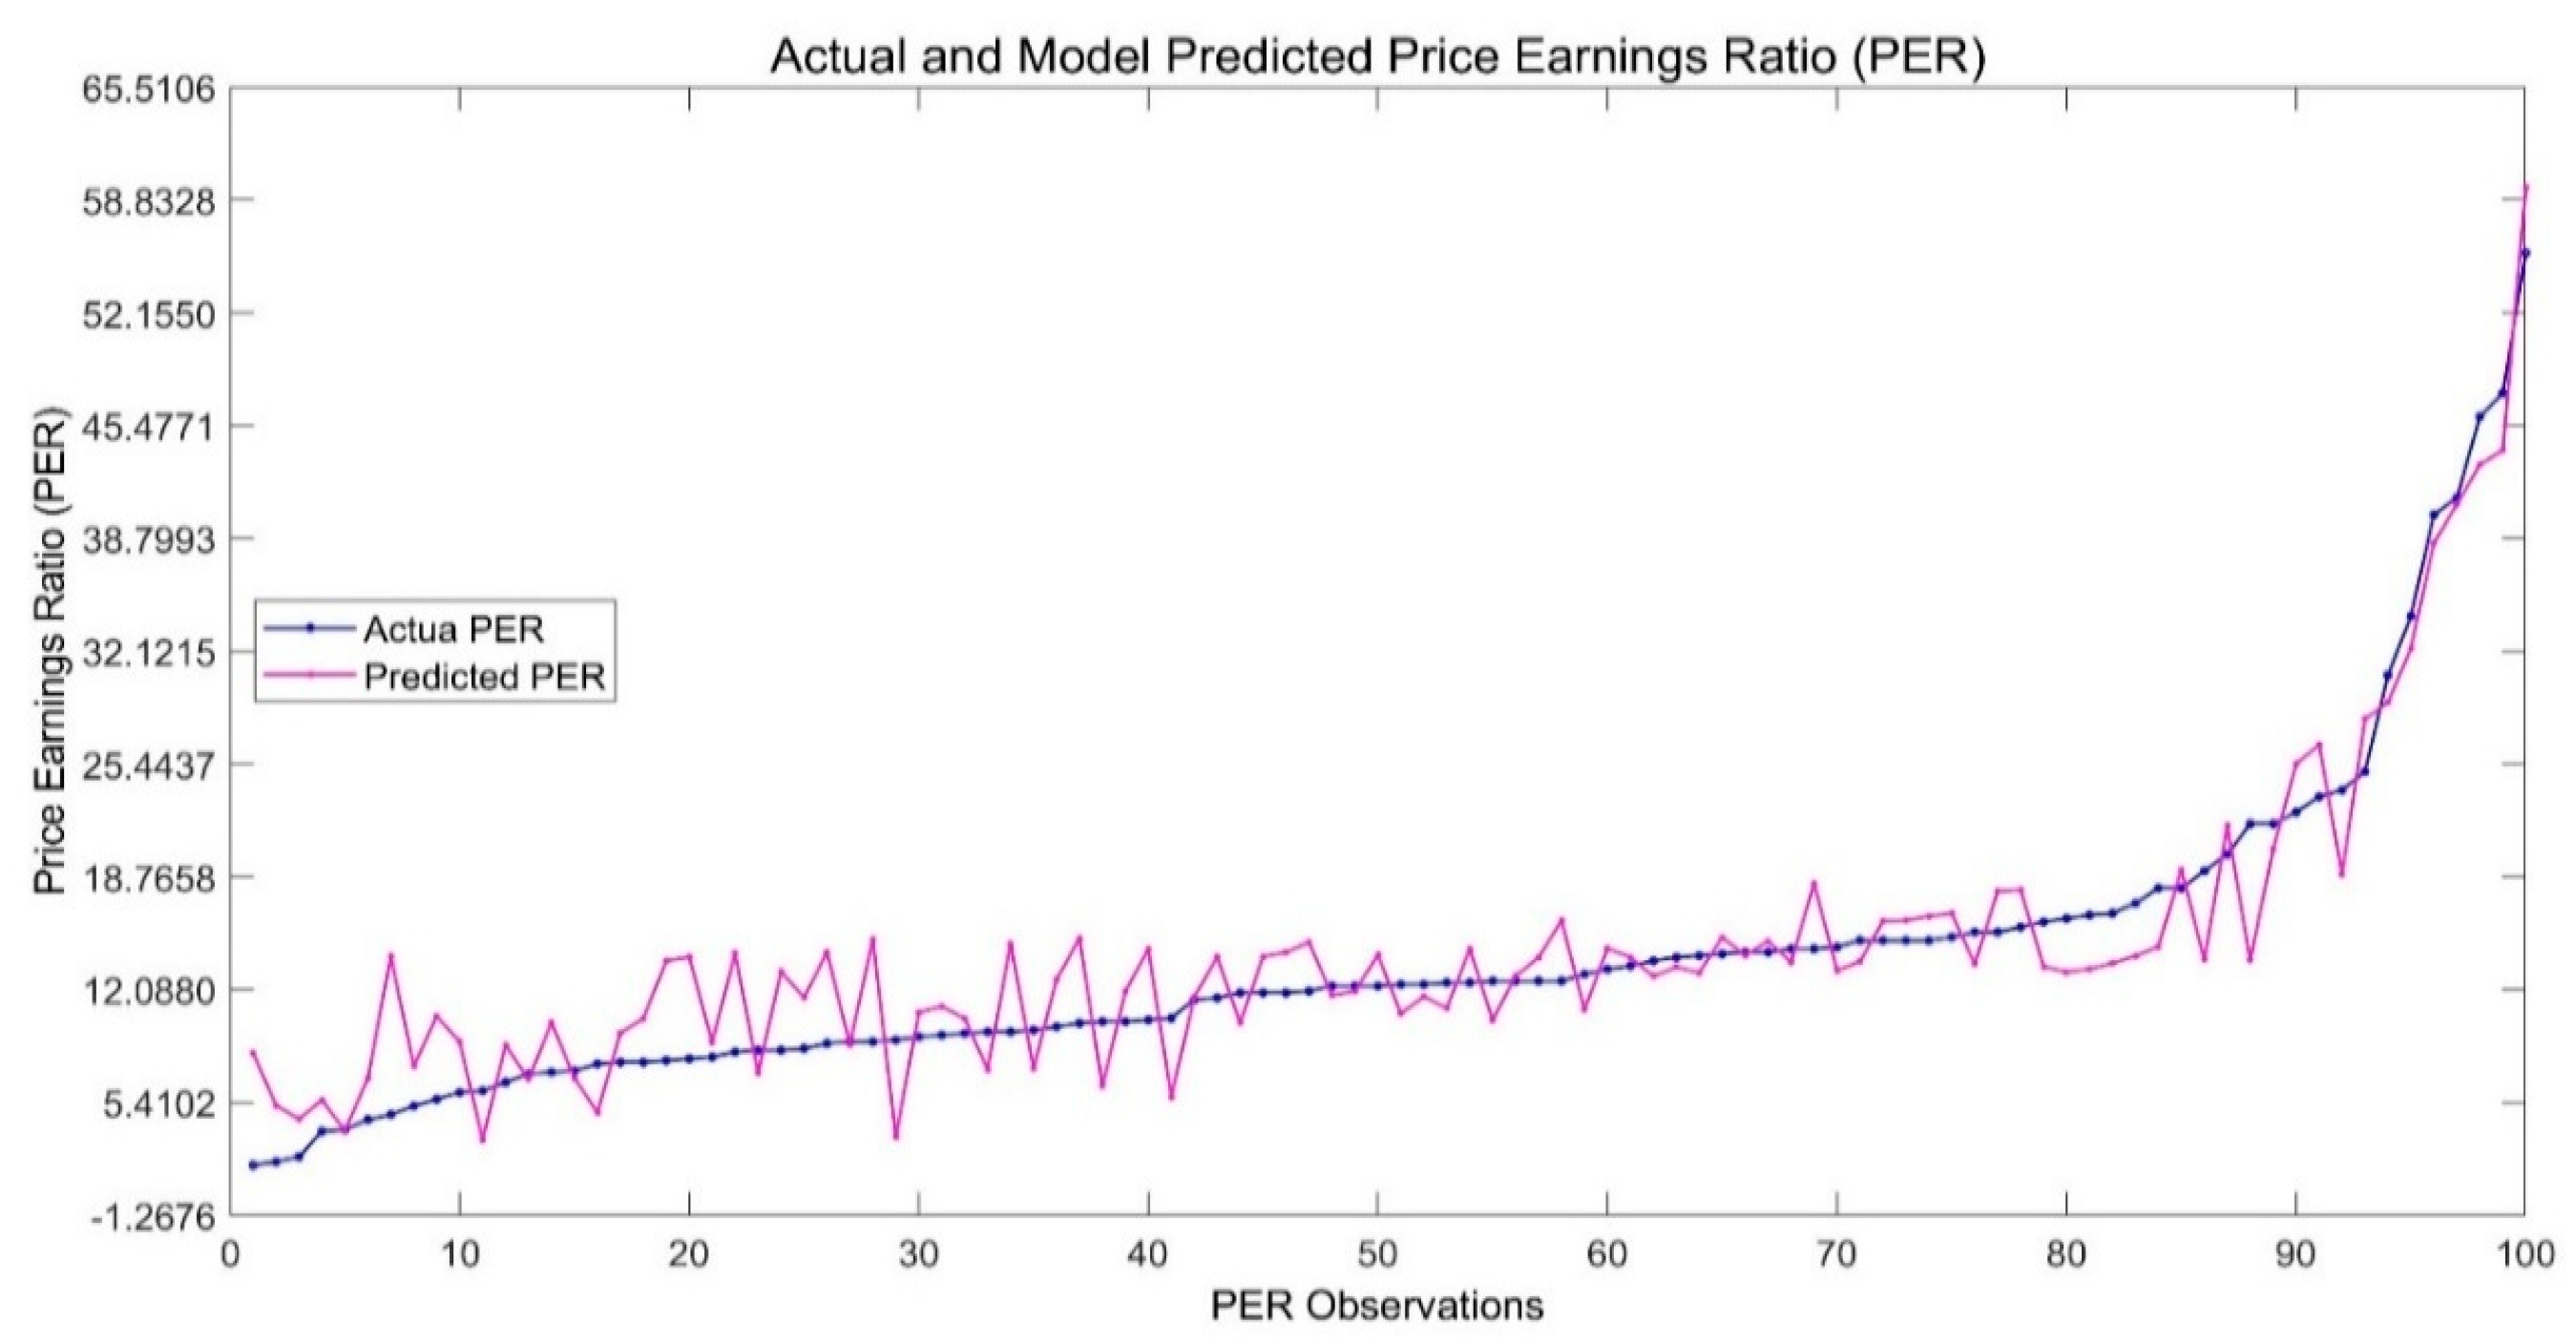
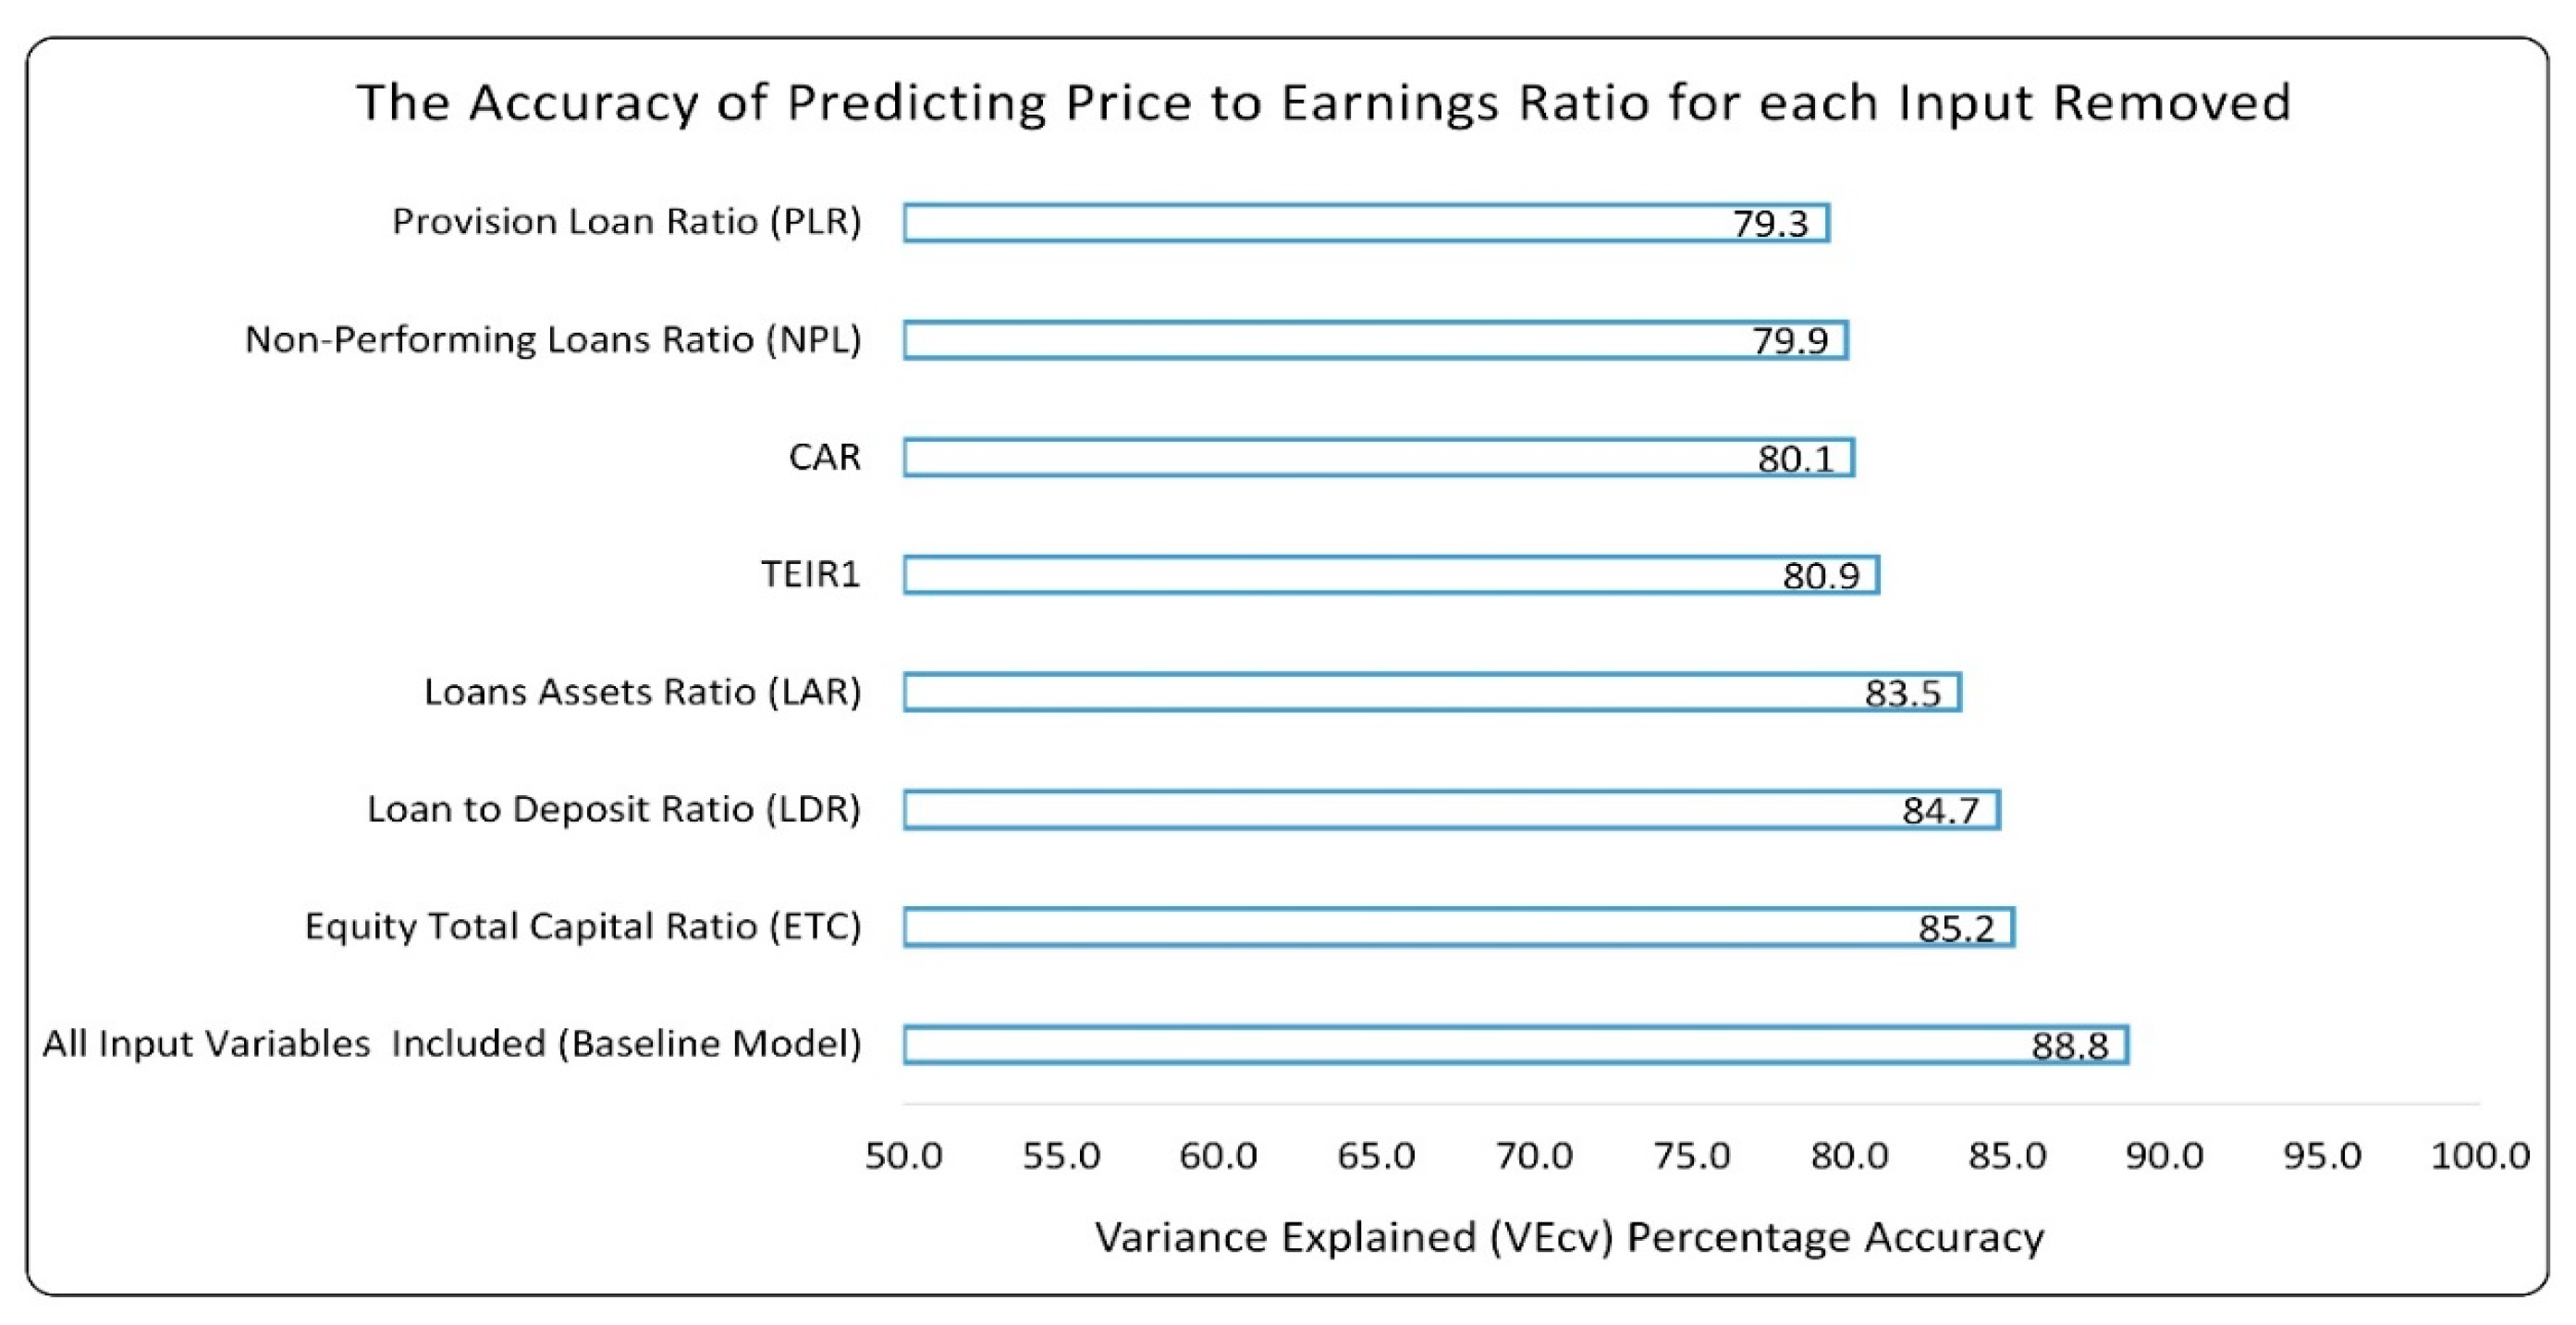
Figure 10 depicts the actual and predicted PER for the 100 testing observations. With an RMSE of 3.1, the model’s predictive accuracy, as measured by VEcv, is 88.8%. Figure 11 gives the VEcv predictive accuracy of PER when each input variable is dropped one at a time to measure its influence.

Figure 10.
Actual and predicted Price-Earnings Ratio for 45 test Observations.
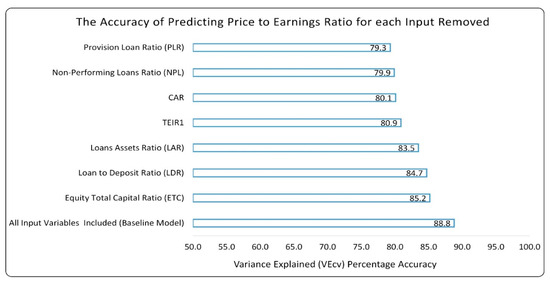
Figure 11.
Model’s predictive accuracy of PER when dropping one predictor at a time.
Figure 11 shows that no dominant parameter determines the prediction of PER. All input parameters, individually, have a minor effect on the predictability of PER, and it can be seen that PLR, NPL, TIER1, and CAR are very close to each other in terms of their power to predict PER; while LAR, LDR, and ETC have similar but slightly less effect than the first group on PER forecasting.
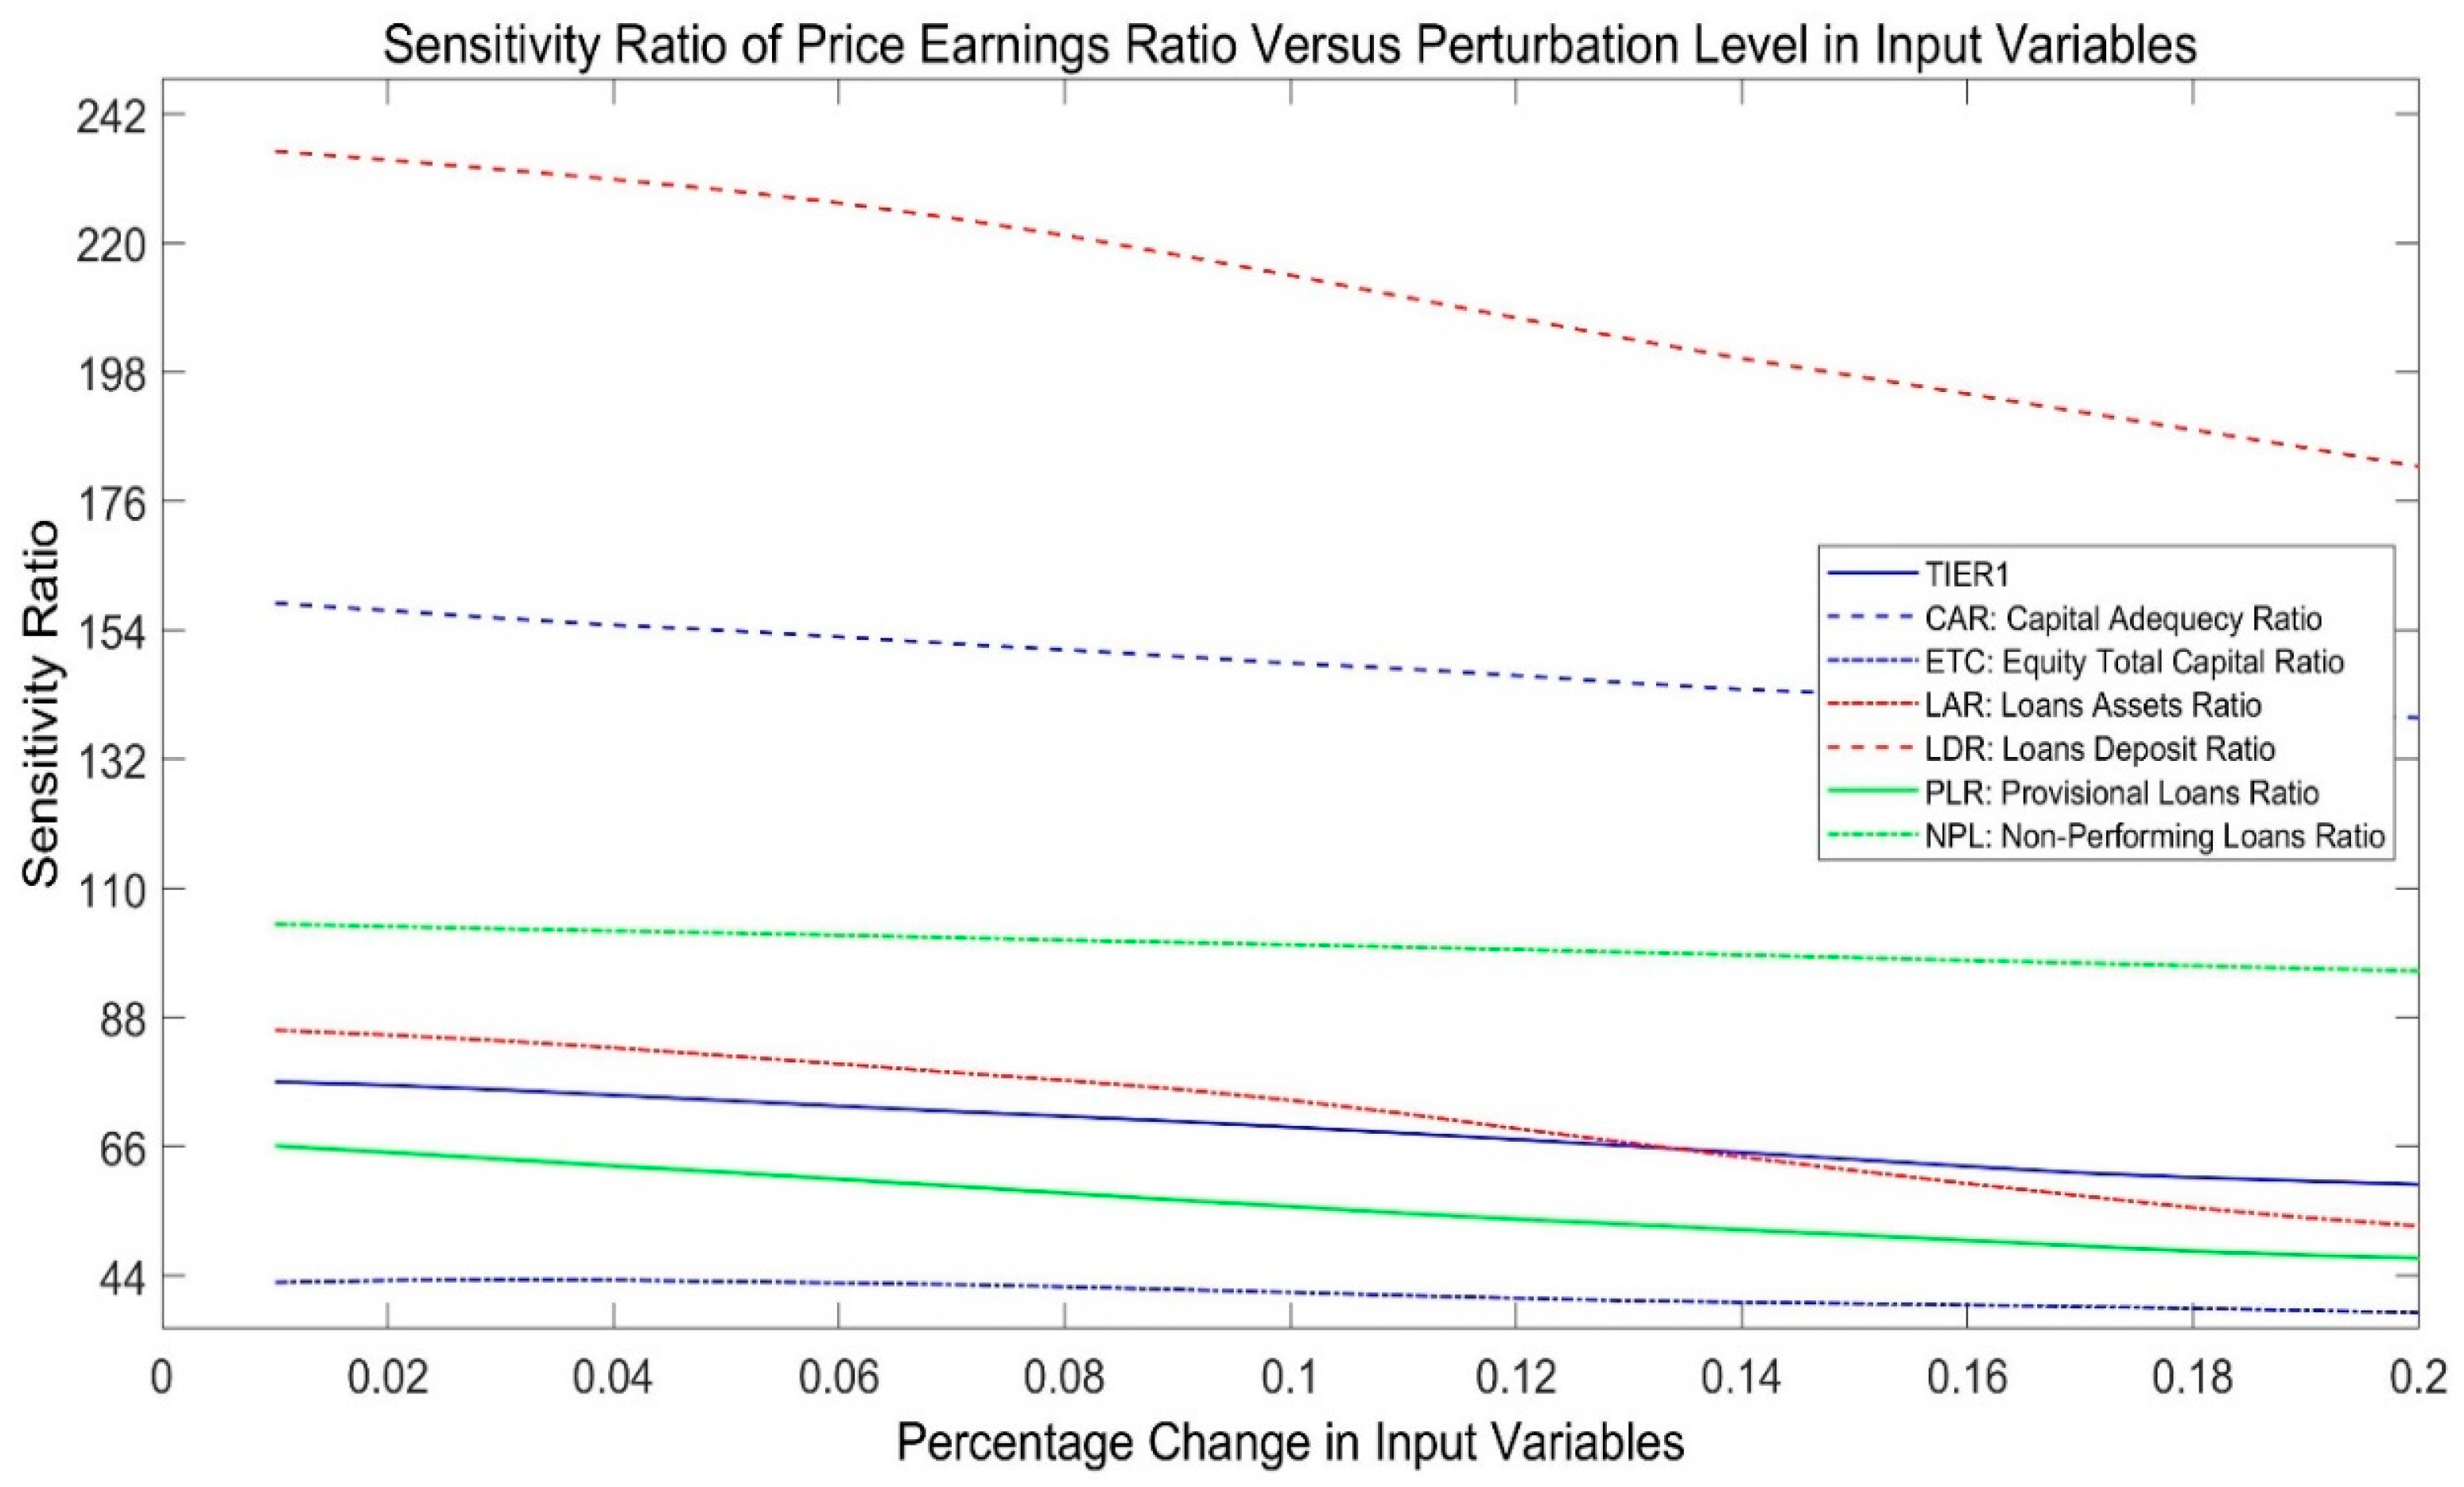
4.3.2. Explaining Variations in PER
Using training data, the sensitivity ratio of PER to perturbations in each input parameter was calculated to identify the most influential bank parameters responsible for PER variations. Figure 12 depicts the sensitivity index of the PER output of the model for perturbations in each input variable spanning from 1% to 20% in 1% increments. Figure 12 demonstrates that liquidity risk is the most influential factor in determining PER, with the LDR having a greater impact than LAR. Capital adequacy risk comes in second place, with CAR having a greater influence than the other two components, TIER1 and ETC. Credit risk comes last, with NPL having more impact than PLR. This study’s findings regarding the effect of risks on PER are particularly new, as no previous research has examined this aspect. The principal determinants of the PER are the LDR followed by CAR, with ETC having the least significant effect.
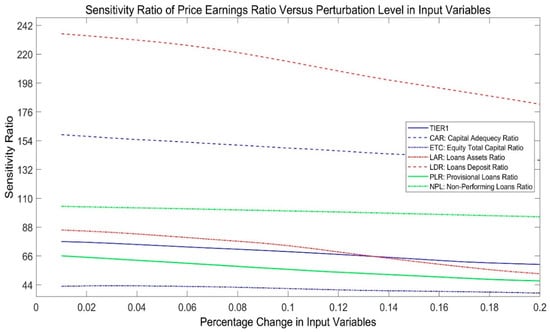
Figure 12.
PER sensitivity values relative to input parameter perturbation levels.
Generally, the combined effect of these risk factors—credit risk, liquidity risk, and capital adequacy—significantly influences overall bank performance and stability, with evidence suggesting that their interplay can either complement or counteract each other depending on the banking context and regulatory environment. Pratiwi and Masdupi (2021), support the view that credit and liquidity risks are positively related, with loan defaults leading to funding deficits and increased liquidity risk. Capital adequacy, measured by the capital adequacy ratio (CAR), is found to play a stabilizing role: banks with higher capital buffers are better positioned to absorb losses and maintain liquidity, thus mitigating the adverse effects of credit and liquidity shocks (Febiyanni and Hermanto 2023). However, Bandyopadhyay and Saxena (2021) find that while capital position improves liquidity, the direct relationship between credit and liquidity risk may weaken under stricter regulatory regimes, such as Basel III, which emphasize higher capital and stable funding requirements.
5. Conclusions
Recently, different types of risks have impacted the banking sector at all levels, beginning with daily operations, annual financial performance, market share, and strategy formulation, and extending to the existence or liquidation of the bank. Many previous studies have extensively investigated many types of risks and their impacts on different dimensions of banking performance. One main gap of previous research is looking at every type of risk alone, while this study considers the impacts of the main types of risks on the common performance variables. Therefore, the study aims to evaluate the impact of the three major risks (credit, capital adequacy, and liquidity), emphasizing the seven risk subcomponents on the financial performance represented by return on equity, earnings per share, and price-earnings ratio. The study collects data from 62 of the largest 100 banks in the Middle East and Africa. The data is collected for the seven risk variables and three target variables related to financial performance over ten years (2013–2022). The study applies a neuro-fuzzy approach that combines neural networks and fuzzy logic systems in the ANFIS to accurately predict and assess the relationship between the risk variables and performance measures. ANFIS proved accurate in learning the data features and altered the system parameters to suit the required error criterion to generate reliable output. The study’s main findings clearly explain the impact of risk variables on performance. The variations in the return on equity (ROE) have been affected mainly by the credit risk (81.4%) as the most important parameter determining ROE. The sensitivity index values indicate that the LDR is the most significant parameter in explaining variations in ROE, followed by NPL and CAR in second and third place, respectively, with ETC as the least important. The liquidity risk comes in second place (74.3%), with the LDR having more influence than the LAR. Capital adequacy risk comes last, with CAR more significant. As shown in Table 4, credit risk is the dominant factor influencing variations in EPS (59%), followed by liquidity risk (46%), and capital adequacy risk last with only 22% influence. The price-earnings ratio (PER) is the third performance measure. The model finds that liquidity risk is the most influential factor in determining PER, with the LDR having a greater impact than LAR. Capital adequacy risk comes in second place, with CAR having a greater influence than the other two components, TIER1 and ETC. Credit risk comes last, with NPL having more impact than PLR.
Table 4.
Sensitivity ratio of PER concerning the three types of risks and their components.
Most of this study’s findings align with many previous studies when compared to the individual components of risk. The main added value is capturing all the dimensions of risk and performance simultaneously, making it more comprehensive than many previous studies. The study has implications at different levels, as it helps managers and regulators to look ahead at the impact of all types of risk on the different dimensions of performance and plan where to concentrate and avoid expected risks. At the knowledge level, this study will open a new approach to assessing all risks simultaneously on performance using ANFIS methodology. Managers and policymakers are interested in accurately measuring the causal relationship between banking risks and performance. Investigating the non-linear nature of the risk and performance and identifying the threshold beyond which risk becomes detrimental to bank performance is highly valuable for researchers and practitioners.
6. Implications
The adoption of such sophisticated techniques leads to the accuracy of rating and measuring banking risks, which results in societal, managerial, and theoretical implications.
The study will enhance the financial stability that protects depositors and improve their trust in the banking sector. The managerial implications may take different forms such as depending on accurate measures to reduce subjectivity, enhance predictability, and mitigate risks. Theoretically, ANFIS opens a new dimension of measuring banking risks, new theoretical developments are needed to balance the complexity of ANFIS and interpretability. Furthermore, our future research will investigate the relationship between risks and macroeconomic indicators and compare the differences among countries. While this model demonstrates high predictive accuracy and provides valuable insights into major banks in the MEA region, it is important to acknowledge that no study is without limitations. Medium- and small-sized banks may face unique risks not fully captured by this model. Therefore, the study suggests testing this model with other classes of banks (small and medium-sized) to ensure its applicability across different banking segments.
Author Contributions
Each author has a significant contribution to this article. I.E.A. contributed to: Conceptualization, Data collection, introduction, justifications, supervision, and discussion. R.M.: Methodology, Software, Validation, and Formal Analysis. E.A.M.: Investigation, Resources, Data Curation, Original Draft Preparation, Writing the draft, and Visualization. All authors have read and agreed to the published version of the manuscript.
Funding
This research received no external funding. However, the APC was funded by Ajman University.
Data Availability Statement
The data are available when required.
Conflicts of Interest
I hereby declare that the disclosed information is correct and that no other situation of real, potential, or apparent conflict of interest is known to me and my co-authors.
References
- Abiola, Idowu, and Awoyemi Samuel Olausi. 2014. The impact of credit risk management on the commercial banks performance in Nigeria. International Journal of Management and Sustainability 3: 295–306. [Google Scholar] [CrossRef]
- AbouElaz, Mona A., Bilal Naji Alhasnawi, Bishoy E. Sedhom, and Vladimír Bureš. 2025. ANFIS-optimized control for resilient and efficient supply chain performance in smart manufacturing. Results in Engineering 25: 104262. [Google Scholar] [CrossRef]
- Abraham, Ajith. 2005. Adaptation of Fuzzy Inference System Using Neural Learning. 2005. In Fuzzy Systems Engineering: Theory and Practice. Edited by Nadia Nedjah and Luiza de Macedo Mourelle. Studies in Fuzziness and Soft Computing. Berlin: Springer, vol. 181, pp. 53–83. [Google Scholar] [CrossRef]
- Abu Huson, Yazan, Laura Sierra-García, and María Antonia Garcia-Benau. 2023. A bibliometric review of information technology, artificial intelligence, and blockchain on auditing. Total Quality Management & Business Excellence 35: 91–113. [Google Scholar] [CrossRef]
- Alam, S. M. Shamsul, Mohammad Abdul Matin Chowdhury, and Dzuljastri Bin Abdul Razak. 2021. Research evolution in banking performance: A bibliometric analysis. Future Business Journal 7: 66. [Google Scholar] [CrossRef]
- Al-Khouri, Ritab. 2011. Assessing the risk and performance of the GCC banking sector. International Research Journal of Finance and Economics 65: 72–78. [Google Scholar]
- Alonso-Robisco, Andrés, and José Manuel Carbó. 2022. Can machine learning models save capital for banks? Evidence from a Spanish credit portfolio. International Review of Financial Analysis 84: 102372. [Google Scholar]
- Al-Sharkas, Adel A., and Tamara A. Al-Sharkas. 2022. The impact on bank profitability: Testing for capital adequacy ratio, cost-income ratio and non-performing loans in emerging markets [Special issue]. Journal of Governance & Regulation 11: 231–43. [Google Scholar] [CrossRef]
- Alshatti, Ali Sulieman. 2015. The effect of credit risk management on financial performance of the Jordanian commercial banks. Investment Management and Financial Innovations 12: 338–45. [Google Scholar]
- Areghan, Sibor, Omankhanlen Alexander, Chima Menyelim Mathias, Komolafe Titilope Deborah, and Okereke Karachi Yvonne. 2021. The Impact of Credit Risk Management, Macroeconomic Variables on Bank Performance in Nigeria. Journal of Legal Ethical and Regulatory Issues 24: 1–10. [Google Scholar] [CrossRef]
- Azadeh, A., M. S. Asadzadeh, H. G. Mirseraji, and M. Saberi. 2015. An emotional learning neuro-fuzzy inference approach for optimum training and forecasting of gas consumption estimation models with cognitive data. Technological Forecasting and Social Change 91: 47–63. [Google Scholar] [CrossRef]
- Bai, Runbo, Hailei Jia, and Pingzhou Cao. 2011. Factor Sensitivity Analysis with Neural Network Simulation based on Perturbation System. Journal of Computational 6: 1402–7. [Google Scholar] [CrossRef]
- Bandyopadhyay, Arindam, and Mayuri Saxena. 2021. Linkage Between Credit Risk and Liquidity Risk in Indian Banks: A Comparison of the Pre & Post Basel 3 Conditions? NIBM Working Paper Series, WPS05/November. Available online: https://www.nibmindia.org/static/working_paper/NIBM_WP05_ABMS.pdf (accessed on 27 April 2025).
- Banerjee, Ameet Kumar, Molla Ramizur Rahman, Arun Kumar Misra, and Ahmet Sensoy. 2025. Risk sharing framework and systemic tolerance in Indian banks: Double layer network approach. Research in International Business and Finance 73: 102636. [Google Scholar] [CrossRef]
- Wanjiru, Beatrice Nyokabi, Ambrose O. Jagongo, and Fredrick W. S. Ndede. 2024. Effect of capital adequacy on financial performance of commercial banks in Kenya. The Strategic Journal of Business & Change Management 11: 327–49. [Google Scholar] [CrossRef]
- Bhattarai, Yuga Raj. 2016. Effect of credit risk on the performance of Nepalese commercial banks. NRB Economic Review 28: 41–64. [Google Scholar] [CrossRef]
- Bolívar, Fernando, Miguel A. Duran, and Ana Lozano-Vivas. 2023. Business model contributions to bank profit performance: A machine learning approach. Research in International Business and Finance 64: 101870. [Google Scholar] [CrossRef]
- Boyacioglu, Melek Acar, and Derya Avci. 2010. An adaptive network-based fuzzy inference system (ANFIS) for the prediction of stock market return: The case of the Istanbul stock exchange. Expert Systems with Applications 37: 7908–12. [Google Scholar] [CrossRef]
- Cao, Maosen, Nizar F. Alkayem, Lixia Pan, and Drahomír Novák. 2016. Advanced Methods in Neural Networks-Based Sensitivity Analysis with their Applications in Civil Engineering. In Artificial Neural Networks—Models and Applications. London: IntechOpen, pp. 335–53. [Google Scholar] [CrossRef]
- Castillo, Oscar, Juan R. Castro, and Patricia Melin. 2023. Forecasting the COVID-19 with interval Type-3 fuzzy logic and the fractal dimension. International Journal of Fuzzy Systems 25: 182–97. [Google Scholar] [CrossRef]
- Chang, Victor, Sharuga Sivakulasingam, Hai Wang, Siu Tung Wong, Meghana Ashok Ganatra, and Jiabin Luo. 2024. Credit Risk Prediction Using Machine Learning and Deep Learning: A Study on Credit Card Customers. Risks 12: 174. [Google Scholar] [CrossRef]
- Chen, Tao. 2022. Prediction Calculation of Stock Composite Index Closing Price Based on Grey Correlation Analysis Method. In International Conference on Frontier Computing. Singapore: Springer Nature Singapore, pp. 177–83. [Google Scholar]
- Cheng, Antony Y., and Daniel S. Yeung. 1999. Sensitivity analysis of neocognitron. IEEE Transactions on Systems, Man, and Cybernetics, Part C (Applications and Reviews) 29: 238–49. [Google Scholar] [CrossRef]
- Chiu, Stephen L. 1996. Selecting input variables for fuzzy models. Journal of Intelligent & Fuzzy Systems 4: 243–56. [Google Scholar]
- Chou, Te-Kuang, and Agung Dharmawan Buchdadi. 2016. Bank Performance and Its Underlying Factors: A Study of Rural Banks in Indonesia. Accounting and Finance Research 5: 55–63. [Google Scholar] [CrossRef]
- Colesnic, Olga, Konstantinos Kounetas, and Polemis Michael. 2020. Estimating risk efficiency in Middle East banks before and after the crisis: A metafrontier framework. Global Finance Journal 46: 100484. [Google Scholar] [CrossRef]
- Dimopoulos, Yannis, Paul Bourret, and Sovan Lek. 1995. Use of some sensitivity criteria for choosing networks with good generalization ability. Neural Processing Letters 2: 1–4. [Google Scholar] [CrossRef]
- Dubois, Didier, Henri Prade, and Ronald R. Yager, eds. 1997. Fuzzy Information Engineering: A Guided Tour of Applications. Hoboken: John Wiley & Sons, Inc. [Google Scholar]
- Ekinci, Ramazan, and Gulden Poyraz. 2019. The effect of credit risk on financial performance of deposit banks in Turkey. Procedia Computer Science 158: 979–87. [Google Scholar] [CrossRef]
- Eltweri, Ahmed, Nedal Sawan, Krayyem Al-Hajaya, and Zineb Badri. 2024. The Influence of Liquidity Risk on Financial Performance: A Study of the UK’s Largest Commercial Banks. Journal of Risk and Financial Management 17: 580. [Google Scholar] [CrossRef]
- Erasmus, Afriyie. 2022. The impact of custom-made internal risk control systems on bank performance in Ghana. In Forum Scientiae Oeconomia. Dąbrowa Górnicza: Wydawnictwo Naukowe Akademii WSB, vol. 10, pp. 151–74. [Google Scholar]
- Febiyanni, Febiyanni, and Hermanto Hermanto. 2023. The influence of capital risk, liquidity risk, and credit risk, on profitability with macroprudential intermediation ratio as a moderating variable. Enrichment Journal of Management 13: 1984–92. Available online: https://digilib.esaunggul.ac.id/the-influence-of-capital-risk-liquidity-risk-and-credit-risk-on-profitability-with-macroprudential-intermediation-ratio-as-a-moderating-variable-31131.html (accessed on 5 August 2023).
- Gedeon, Tamás D. 1997. Data mining of inputs: Analysing magnitude and functional measures. International Journal of Neural Systems 8: 209–18. [Google Scholar] [CrossRef]
- Geisser, Seymour. 1975. The predictive sample reuse method with applications. Journal of the American Statistical Association 70: 320–28. [Google Scholar] [CrossRef]
- Geisser, Seymour. 1993. Predictive Inference: An Introduction. London: Chapman and Hall. [Google Scholar]
- Goddard, John, Phil Molyneux, and John O. S. Wilson. 2004. Dynamics of Growth and Profitability in Banking. Journal of Money, Credit and Banking 36: 1069–1090. [Google Scholar] [CrossRef]
- Grau-Vera, David, and Gonzalo Rubio. 2024. Risk-adjusted performance of new economy indices and thematic sectors. Research in International Business and Finance 71: 102438. [Google Scholar] [CrossRef]
- Hamam, Abdelwahab, and Nicolas D. Georganas. 2008. A comparison of Mamdani and Sugeno fuzzy inference systems for evaluating the quality of experience of Hapto-Audio-Visual applications. Paper presented at 2008 IEEE International Workshop on Haptic Audio-Visual Environments and Games, Ottawa, ON, Canada, October 18–19; Piscataway: IEEE, pp. 87–92. [Google Scholar]
- Hamza, Syed Muhammad. 2017. Impact of Credit Risk Management on Banks Performance: A Case Study in Pakistan Banks. European Journal of Business and Management 9: 57–64. [Google Scholar]
- Han, Jiawei, Micheline Kamber, and Jian Pei. 2012. Data Mining Concepts and Techniques. Waltham: Morgan Kaufmann. [Google Scholar]
- Hersugondo, Hersugondo, Nabila Anjani, and Imang Dapit Pamungkas. 2021. The Role of Non-Performing Asset, Capital, Adequacy and Insolvency Risk on Bank Performance: A Case Study in Indonesia. The Journal of Asian Finance, Economics and Business 8: 319–29. [Google Scholar]
- Himeur, Yassine, Mariam Elnour, Fodil Fadli, Nader Meskin, Ioan Petri, Yacine Rezgui, Faycal Bensaali, and Abbes Amira. 2023. AI-big data analytics for building automation and management systems: A survey, actual challenges and future perspectives. Artificial Intelligence Review 56: 4929–5021. [Google Scholar] [CrossRef]
- Huang, An, Youlong Yang, and Yuanyuan Liu. 2024. A Binary Risk Linguistic Fuzzy Behavioral TOPSIS Model for Multi-attribute Large-Scale Group Decision-Making Based on Risk Preference Classification and Adaptive Weight Updating. International Journal of Fuzzy Systems 26: 1852–78. [Google Scholar] [CrossRef]
- Huang, Xiaoxia. 2012. A risk index model for portfolio selection with returns subject to experts’ estimations. Fuzzy Optimization and Decision Making 11: 451–63. [Google Scholar] [CrossRef]
- Hussain, Kashif, Mohd Salleh, and Mohd Najib. 2015. Analysis of techniques for anfis rule-base minimization and accuracy maximization. ARPN Journal of Engineering and Applied Sciences 10: 9739–46. [Google Scholar]
- Jang, Jyh-Shing R. 1991. Fuzzy modeling using generalized neural networks and Kalman filter algorithm. Paper presented at Ninth National Conference on Artificial Intelligence, Anaheim CA, USA, July 14–19, vol. 2, pp. 762–67. [Google Scholar]
- Jang, Jyh-Shing R. 1993. ANFIS: Adaptive-network-based fuzzy inference system. IEEE Transactions on Systems Man and Cybernetics 23: 665–85. [Google Scholar] [CrossRef]
- Jang, Jyh-Shing Roger, Chuen-Tsai Sun, and Eiji Mizutani. 1997. Neuro-fuzzy and soft computing-a computational approach to learning and machine intelligence [Book Review]. IEEE Transactions on Automatic Control 42: 1482–84. [Google Scholar] [CrossRef]
- Jovic, Srdjan, Jasmina Smigic Miladinovic, Radmila Micic, Sanja Markovic, and Goran Rakic. 2019. Analysing of exchange rate and gross domestic product (GDP) by adaptive neuro fuzzy inference system (ANFIS). Physica A: Statistical Mechanics and its Applications 513: 333–38. [Google Scholar] [CrossRef]
- Kacem, Oumeima, and Sana El Harbi. 2022. Do risk governance and effective board affect bank performance? Evidence from large banks worldwide. Risk Management 24: 461–83. [Google Scholar] [CrossRef]
- Kaur, Raminder Preet, and Amanjot Singh Klair. 2012. Investigation of Grid partitioning and Subtractive Clustering based Neuro-Fuzzy Systems for Evaluation of Fault-Proneness in Open source software system. Paper presented at International Conference on Computer Graphics, Simulation and Modeling, Pattaya, Thailand, July 28–29; pp. 143–45. [Google Scholar]
- Kim, Jong-Min, Ning Wang, Yumin Liu, and Kayoung Park. 2020. Residual control chart for binary response with multicollinearity covariates by neural network model. Symmetry 12: 381. [Google Scholar] [CrossRef]
- Kodithuwakku, Sujeeva. 2015. Impact of Credit Risk Management on the Performance of Commercial Banks in Sri Lanka. International Journal of Scientific Research and Innovative Technology 2: 1–6. [Google Scholar]
- Kohavi, Ron, and George H. John. 1997. Wrappers for feature selection. Artificial Intelligence 97: 273–324. [Google Scholar] [CrossRef]
- Kristóf, Tamás, and Miklós Virág. 2022. EU-27 bank failure prediction with C5. 0 decision trees and deep learning neural networks. Research in International Business and Finance 61: 101644. [Google Scholar] [CrossRef]
- Kwashie, Angela Akpemada, Samuel Tawiah Baidoo, and Enock Kojo Ayesu. 2022. Investigating the impact of credit risk on financial performance of commercial banks in Ghana. Cogent Economics & Finance 10: 2109281. [Google Scholar]
- Lamy, D. 1996. Modeling and sensitivity analysis of neural networks. Mathematics and Computers in Simulation 40: 535–48. [Google Scholar] [CrossRef]
- Li, Jin. 2016. Assessing spatial predictive models in the environmental sciences: Accuracy measures, data variation and variance explained. Environmental Modelling & Software 80: 1–8. [Google Scholar]
- Li, Jin. 2017. Assessing the accuracy of predictive models for numerical data: Not r nor r2, why not? Then what? PLoS ONE 12: e0183250. [Google Scholar] [CrossRef]
- Li, Minghui, Kaiyue Li, Yeni Huang, and Zhongyu Cao. 2025. Commercial bank NSFR adjustment and risk: Evidence from China. Research in International Business and Finance 73: 102559. [Google Scholar] [CrossRef]
- Liu, Jinpei, Zijie Qiang, Peng Wu, and Pengcheng Du. 2022. Multiple stage optimization driven group decision-making method with interval linguistic fuzzy preference relations based on ordinal consistency and DEA cross-efficiency. Fuzzy Optimization and Decision Making 22: 309–36. [Google Scholar] [CrossRef]
- Luthfi, Emha Taufiq, and Ferry Wahyu Wibowo. 2017. Loan Payment Prediction Using Adaptive Neuro Fuzzy Inference System. International Journal of Simulation: Systems Science & Technology 18: 9.1–9.6. [Google Scholar]
- Mamdani, Ebrahim H. 1974. Applications of fuzzy algorithms for a simple dynamic plant. Proceedings of the Institution of Electrical Engineers 121: 1585–88. [Google Scholar] [CrossRef]
- Mamdani, Ebrahim H., and Sedrak Assilian. 1975. An experiment in linguistic synthesis with a fuzzy logic controller. International Journal of Man-Machine Studies 7: 1–13. [Google Scholar] [CrossRef]
- MathWorks. 2023a. “Fuzzy Logic Toolbox, User’s Guide” R2020a. Available online: https://www.mathworks.com/products/fuzzy-logic.html?s_tid=srchtitle_fuzzy%20logice_1 (accessed on 8 March 2023).
- MathWorks. 2023b. Available online: https://www.mathworks.com/help/fuzzy/genfis.html (accessed on 8 March 2023).
- MathWorks. 2023c. Available online: https://www.mathworks.com/help/fuzzy/anfis.html?s_tid=srchtitle (accessed on 8 March 2023).
- Meliza, Norraidah Abu Hasan, and Saputri Hermilasari. 2024. The influence of banking liquidity risk on profitability: The moderating role of capital adequacy ratio. Banks and Bank Systems 19: 140–51. [Google Scholar] [CrossRef]
- Mirashk, Hamed, Amir Albadvi, Mehrdad Kargari, and Mohammad Ali Rastegar. 2024. News Sentiment and Liquidity Risk Forecasting: Insights from Iranian Banks. Risks 12: 171. [Google Scholar] [CrossRef]
- Mitra, Sushmita, and Yoichi Hayashi. 2000. Neuro-fuzzy rule generation: Survey in soft computing framework. IEEE Transactions on Neural Networks 11: 748–68. [Google Scholar] [CrossRef]
- Mohamed, Elfadil A., Ibrahim Elsiddig Ahmed, Riyadh Mehdi, and Hanan Hussain. 2021. Impact of corporate performance on stock price predictions in the UAE markets: Neuro-fuzzy model. Intelligent Systems in Accounting, Finance and Management 28: 52–71. [Google Scholar] [CrossRef]
- Nallakaruppan, M. K., Himakshi Chaturvedi, Veena Grover, Balamurugan Balusamy, Praveen Jaraut, Jitendra Bahadur, V. P. Meena, and Ibrahim A. Hameed. 2024. Credit Risk Assessment and Financial Decision Support Using Explainable Artificial Intelligence. Risks 12: 164. [Google Scholar] [CrossRef]
- Negnevitsky, Michael. 2017. Artificial Intelligence: A Guide to Intelligent Systems. Harlow: Addison Wesley. [Google Scholar]
- Neshat, Mehdi, Ali Adeli, Ghodrat Sepidnam, and Mehdi Sargolzaei. 2012. Prediction of concrete mix design using adaptive neural fuzzy inference systems and fuzzy inference systems. International Journal of Advanced Manufacturing Technology 63: 373–90. [Google Scholar] [CrossRef]
- Nguyen, Minh Hong, Binh Nguyen Thanh, Huy Pham, and Thi Thu Tra Pham. 2025. The determinants of funding liquidity risk in decentralized lending. Global Finance Journal 64: 101055. [Google Scholar] [CrossRef]
- Ontiveros, Emanuel, Patricia Melin, and Oscar Castillo. 2024. Towards an Efficient Approach for Mamdani Interval Type-3 Fuzzy Inference Systems. International Journal of Fuzzy Systems 26: 2172–90. [Google Scholar] [CrossRef]
- Pham, N. Thach, Robert Powell, and Deepa Bannigidadmath. 2024. Tail risk network analysis of Asian banks. Global Finance Journal 62: 101017. [Google Scholar] [CrossRef]
- Poudel, Ravi Prakash Sharma. 2012. The Impact of Credit Risk Management on Financial Performance of Commercial Banks in Napal. International Journal of Arts and Commerce 1: 9–15. [Google Scholar]
- Pratiwi, Esha, and Erni Masdupi. 2021. Effect of Credit Risk, Market Risk and Liquidity Risk on Return on Assets of Conventional Commercial Banks Registered in The Financial Services Authority During the COVID-19 Pandemic. Financial Management Studies 4: 29–46. [Google Scholar]
- Qiu, Yue, Shaoguang Qu, Zhentao Shi, and Tian Xie. 2025. Predicting cryptocurrency volatility: The power of model clustering. Economic Modelling 144: 106986. [Google Scholar] [CrossRef]
- Rajab, Sharifa, and Vinod Sharma. 2018. A review on the applications of neuro-fuzzy systems in business. Artificial Intelligence Review 49: 481–510. [Google Scholar] [CrossRef]
- Rastogi, Shailesh, Arpita Sharma, Geetanjali Pinto, and Venkata Mrudula Bhimavarapu. 2022. A literature review of risk, regulation, and profitability of banks using a scientometric study. Future Business Journal 8: 28. [Google Scholar] [CrossRef]
- Saâdaoui, Foued, and Monjia Khalfi. 2024. Revisiting Islamic banking efficiency using multivariate adaptive regression splines. Annals of Operations Research 334: 287–315. [Google Scholar] [CrossRef]
- Shmueli, G. 2010. To Explain or to Predict? Statistical Science 25: 289–310. [Google Scholar] [CrossRef]
- Siddique, Asima, Muhammad Asif Khan, and Zeeshan Khan. 2022. The effect of credit risk management and bank-specific factors on the financial performance of the South Asian commercial banks. Asian Journal Accounting Research 7: 182–94. [Google Scholar] [CrossRef]
- Siddique, Asima, Omar Masood, Kiran Javaria, and Dinh Tran Ngoc Huy. 2020. A comparative study of the performance of commercial banks in ASIAN developing and developed countries. Insights into Regional Development 2: 580–91. [Google Scholar] [CrossRef]
- Stone, Mervyn. 1974. Cross-validatory choice and assessment of statistical predictions (with discussion). Journal of the Royal Statistical Society: Series B (Methodological) 39: 111–47. [Google Scholar] [CrossRef]
- Subhedar, Mansi, and Gajanan Birajdar. 2012. Comparison of Mamdani and Sugeno inference systems for dynamic spectrum allocation in cognitive radio networks. Wireless Personal Communications 1: 805–19. [Google Scholar] [CrossRef]
- TAB Insights. 2022. Report. Available online: https://tabinsights.com/ab500/largest-banks-mea (accessed on 5 August 2023).
- Takagi, Tomohiro, and Michio Sugeno. 1985. Fuzzy identification of systems and its applications to modeling and control. IEEE Transactions on Systems, Man, and Cybernetics 15: 116–32. [Google Scholar] [CrossRef]
- Talpur, Noureen, Said Jadid Abdulkadir, Hitham Alhussian, Mohd Hilmi Hasan, Norshakirah Aziz, and Alwi Bamhdi. 2023. Deep Neuro-Fuzzy System application trends, challenges, and future perspectives: A systematic survey. Artificial Intelligence Review 56: 865–913. [Google Scholar] [CrossRef]
- Vella, Vince, and Wing Lon Ng. 2014. Enhancing risk-adjusted performance of stock market intraday trading with neuro-fuzzy systems. Neurocomputing 141: 170–87. [Google Scholar] [CrossRef]
- Veryzhenko, Iryna. 2021. Who gains and who loses on stock markets? Risk preferences and timing matter. Intelligent Systems in Accounting, Finance & Management 28: 143–55. [Google Scholar] [CrossRef]
- Walker, Thomas, Yixin Xu, Dieter Gramlich, and Yunfei Zhao. 2023. The impact of natural disasters on the performance and solvency of US banks. International Journal of Managerial Finance 19: 136–54. [Google Scholar] [CrossRef]
- Wan, Yuqing, and Yain-Whar Si. 2017. Adaptive neuro fuzzy inference system for chart pattern matching in financial time series. Applied Soft Computing 57: 1–18. [Google Scholar] [CrossRef]
- Wang, Joseph. 2000. Analytical Electrochemistry, 2nd ed. Hoboken: Wiley-VCH. [Google Scholar]
- Xiong, Zhi-Bin, and Rong-Jun Li. 2005. Credit risk evaluation with fuzzy neural networks on listed corporations of China. Paper presented at the 2005 IEEE International Workshop on VLSI Design and Video Technology, Suzhou, China, May 28–30; Piscataway: IEEE, pp. 397–402. [Google Scholar]
- Yazdani-Chamzini, Abdolreza, Mohammad Majid Fouladgar, Edmundas Kazimieras Zavadskas, and S. Hamzeh Haji Moini. 2013. Selecting the optimal renewable energy using a fuzzy multiple criteria decision making model. Journal of Business Economics and Management 14: 957–78. [Google Scholar] [CrossRef]
- Yeom, Chan-Uk, and Keun-Chang Kwak. 2018. Performance comparison of ANFIS models by input space partitioning methods. Symmetry 10: 700. [Google Scholar] [CrossRef]
- Zeng, Xiaoqin, and Daniel S. Yeung. 2003. A quantified sensitivity measure for multilayer perceptron to input perturbation. Neural Computation 15: 183–212. [Google Scholar] [CrossRef]
- Zhao, Yaoteng, Supat Chupradit, Marria Hassan, Sadaf Soudagar, Alaa Mohamd Shoukry, and Jameel Khader. 2022. The role of technical efficiency, market competition and risk in the banking performance in G20 countries. Business Process Management Journal 27: 2144–60. [Google Scholar] [CrossRef]
- Zou, Yijun, and Fan Li. 2014. The Impact of Credit Risk Management on Profitability of Commercial Banks: A Study of Europe. London: Macmillan. [Google Scholar]


Disclaimer/Publisher’s Note: The statements, opinions and data contained in all publications are solely those of the individual author(s) and contributor(s) and not of MDPI and/or the editor(s). MDPI and/or the editor(s) disclaim responsibility for any injury to people or property resulting from any ideas, methods, instructions or products referred to in the content. |
© 2025 by the authors. Licensee MDPI, Basel, Switzerland. This article is an open access article distributed under the terms and conditions of the Creative Commons Attribution (CC BY) license (https://creativecommons.org/licenses/by/4.0/).