
A Multistate Analysis of Policyholder Behaviour in Life Insurance—Lasso-Based Modelling Approaches


Abstract
1. Introduction
1.1. Motivation and Practical Relevance
1.2. Literature Review and Contribution
1.3. Structure of the Paper
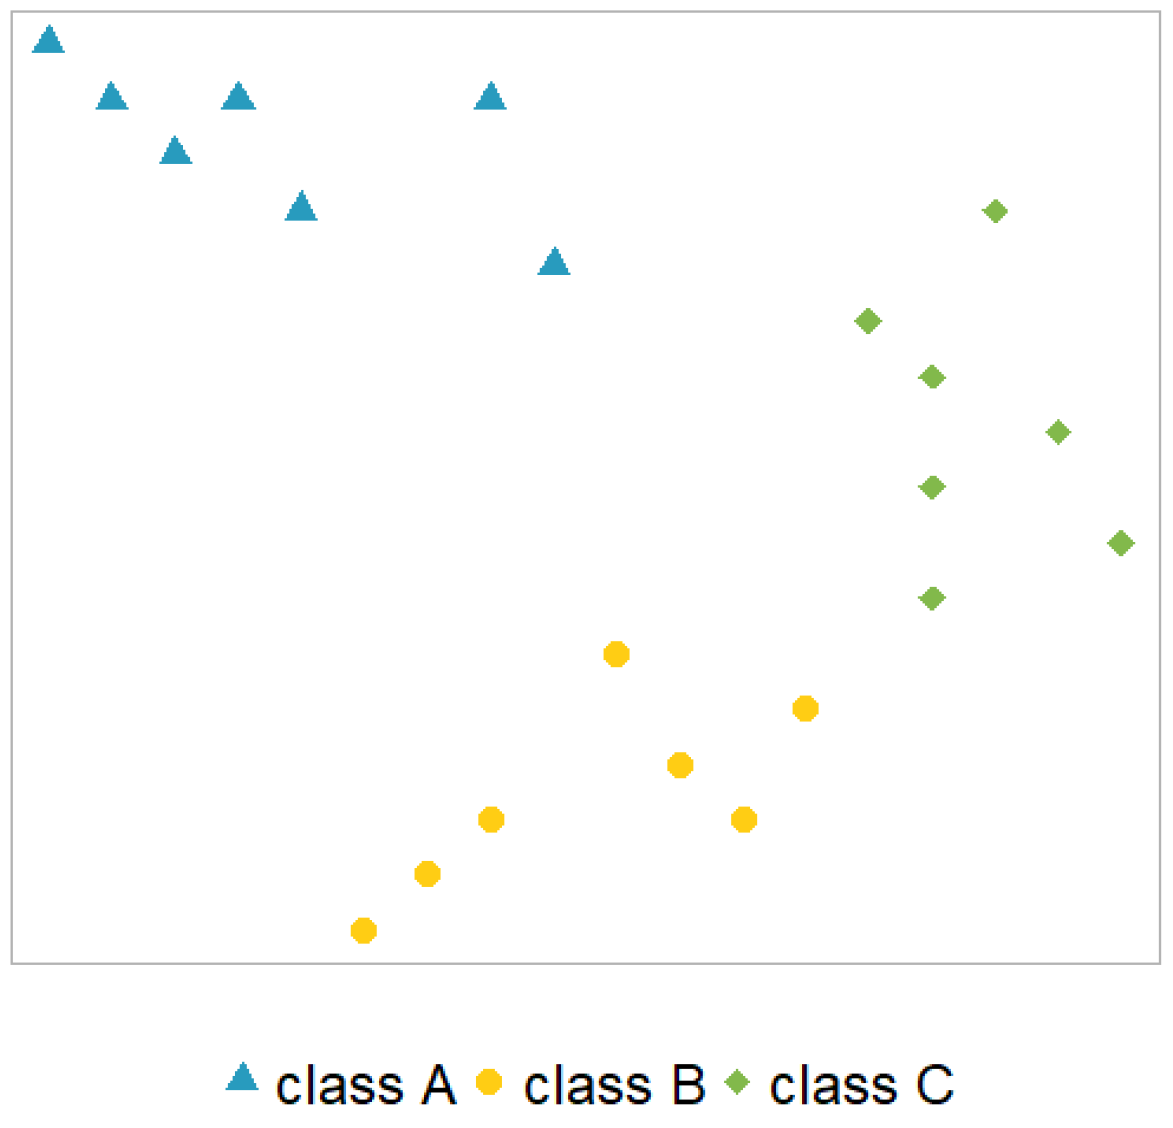
2. Modelling Multiple Status Transitions
- K is the set of possible classes for the response variable Y with potential classes.
- Based on Allwein et al. (2000), M corresponds to a coding matrix with possible entries, . Each column, j, corresponds to a binary base model, indicating whether the class (in row i) has a positive label (), has a negative label () or is not included (). The latter means that data from class i are not reflected in the calibration of model j.
- describes the (predicted) probability that an observation, x, is in the subset of classes I.
- denotes the subset of the observations, where .
- .
- In general, p describes a (predicted) probability from a binary model, i.e., before aggregation, and q describes a (predicted) probability for a multi-class model, i.e., after aggregation.
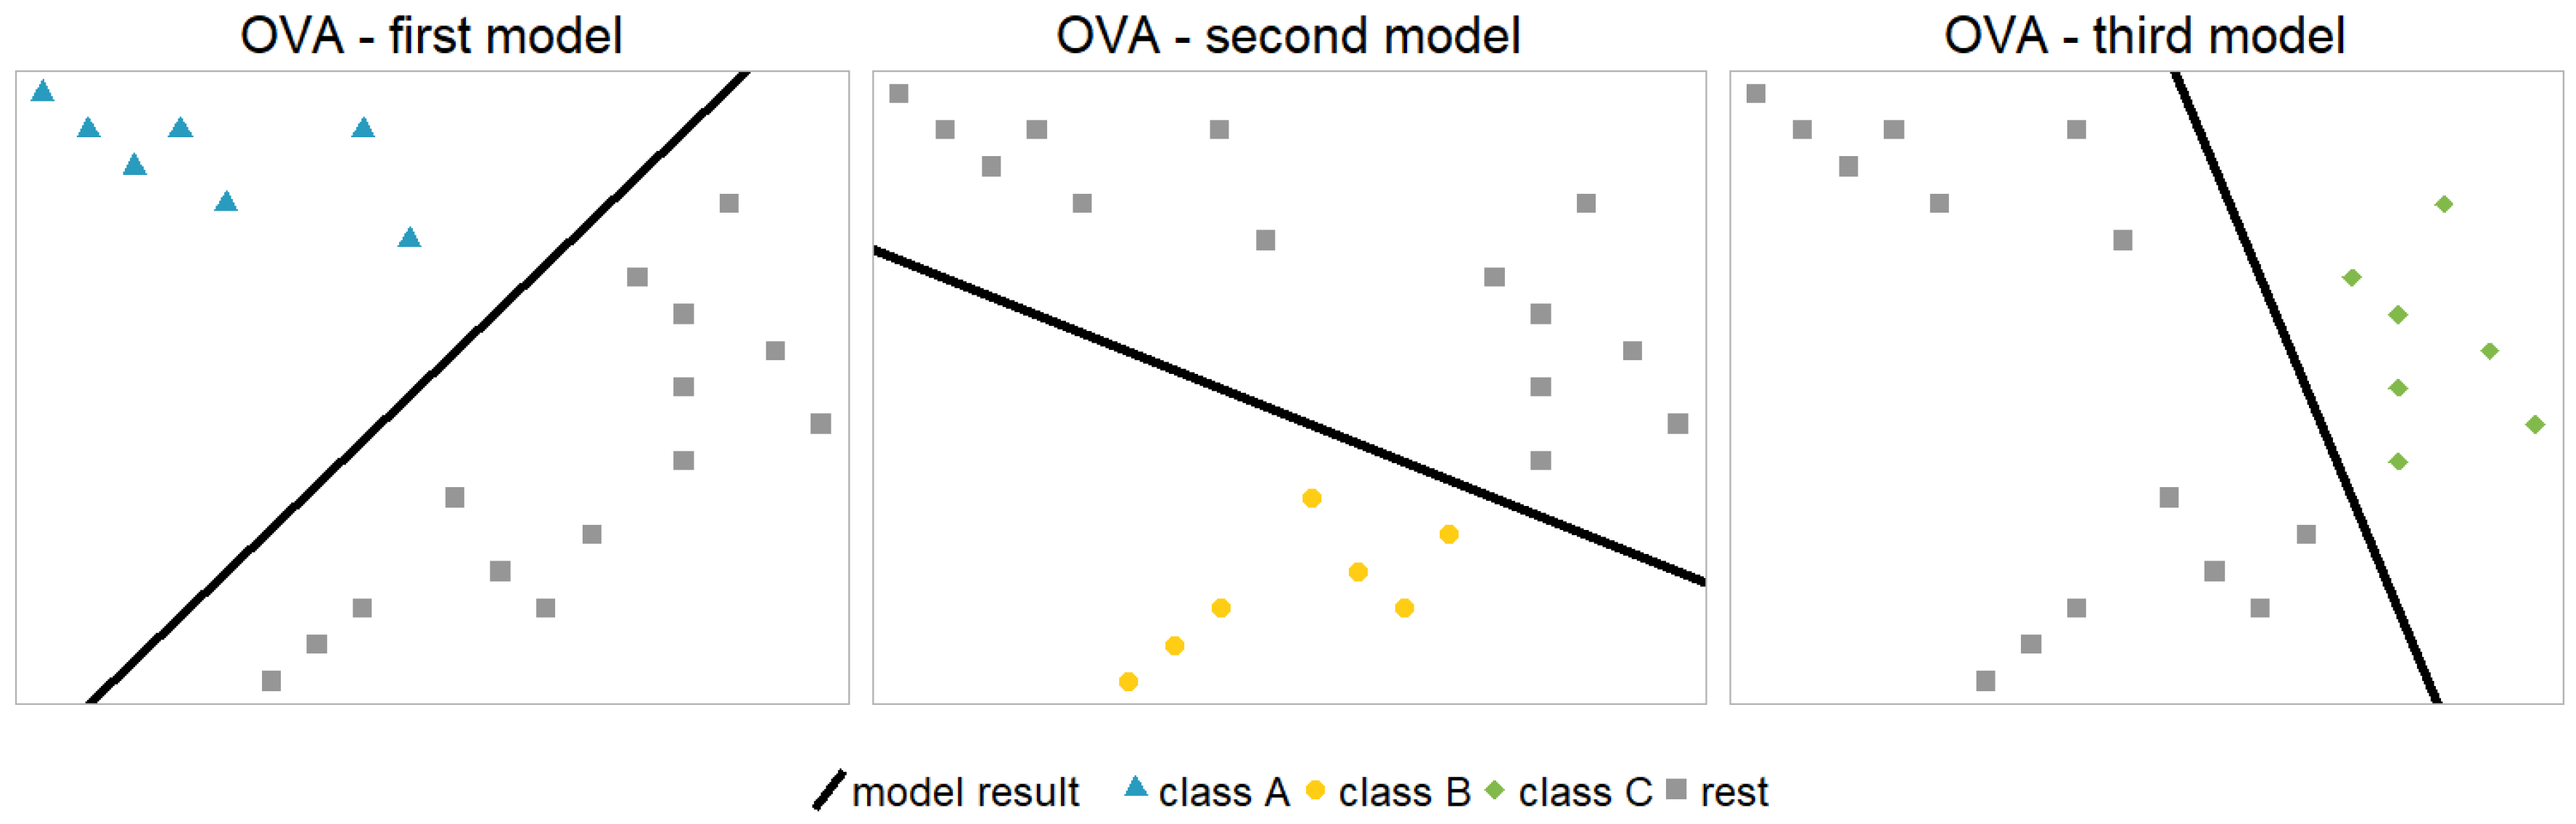
2.1. One vs. All Model
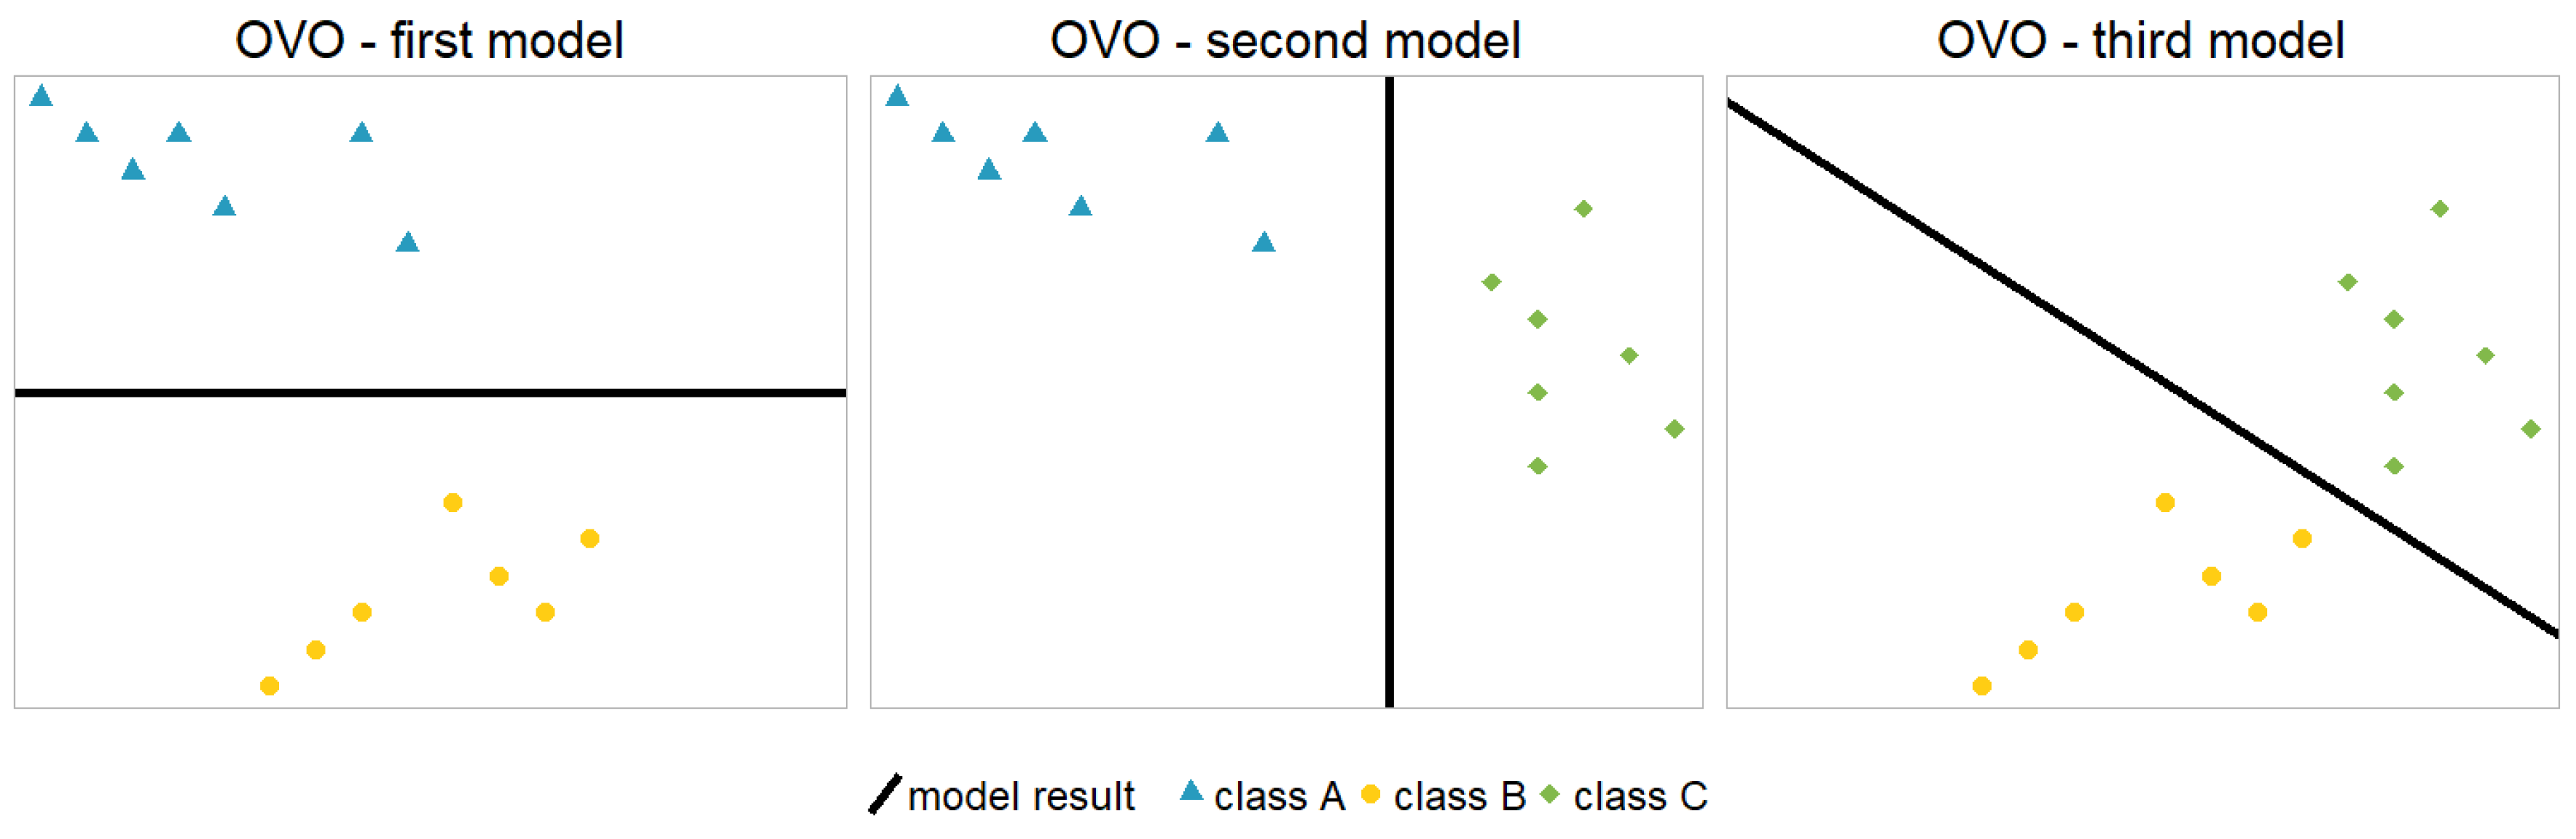
2.2. One-vs.-One Model
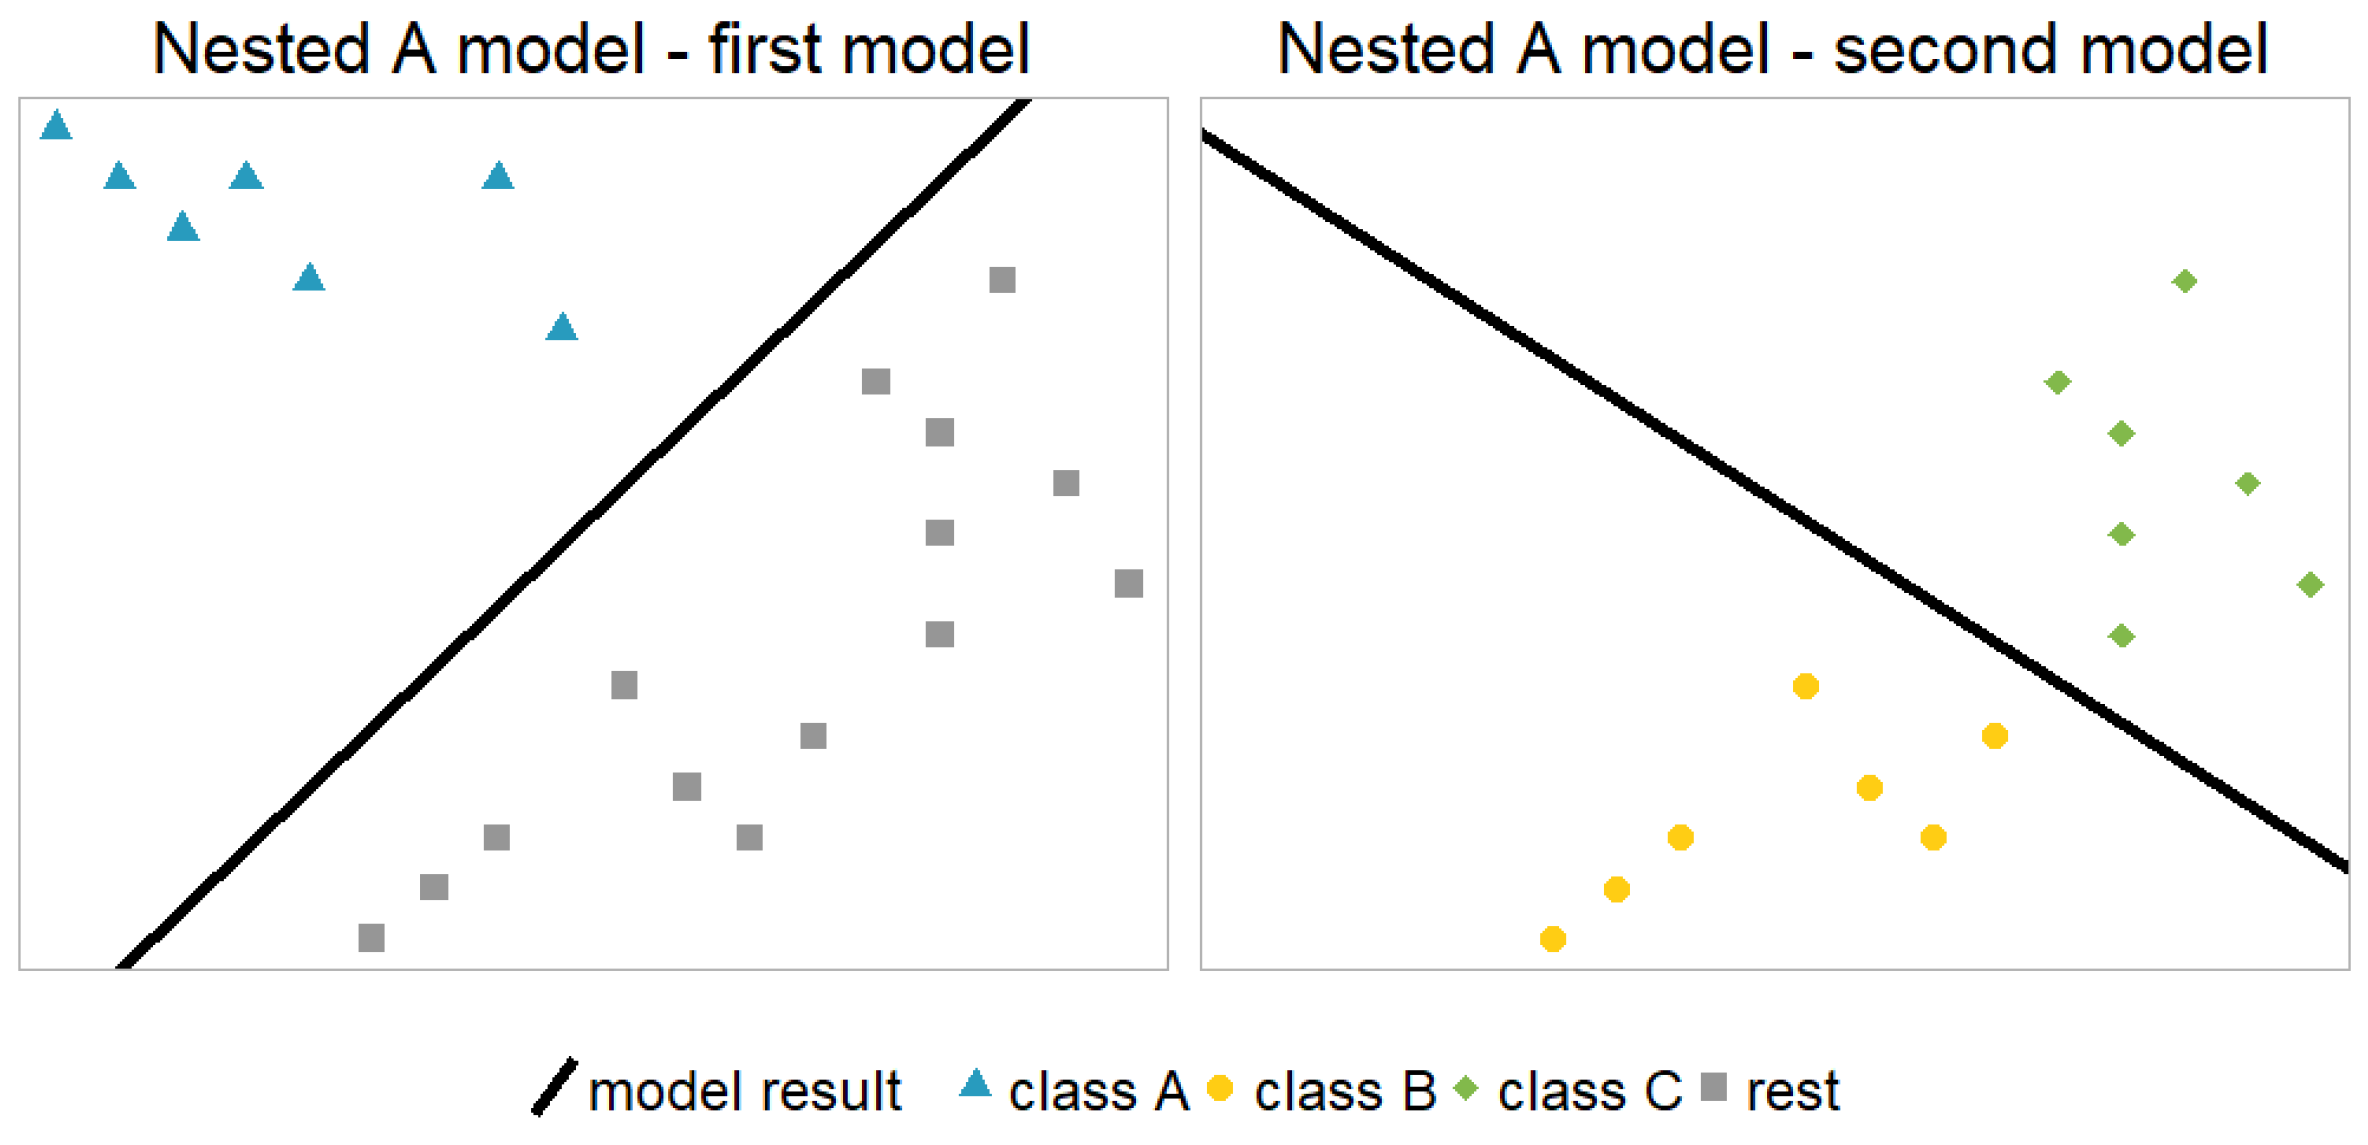
2.3. Nested Model
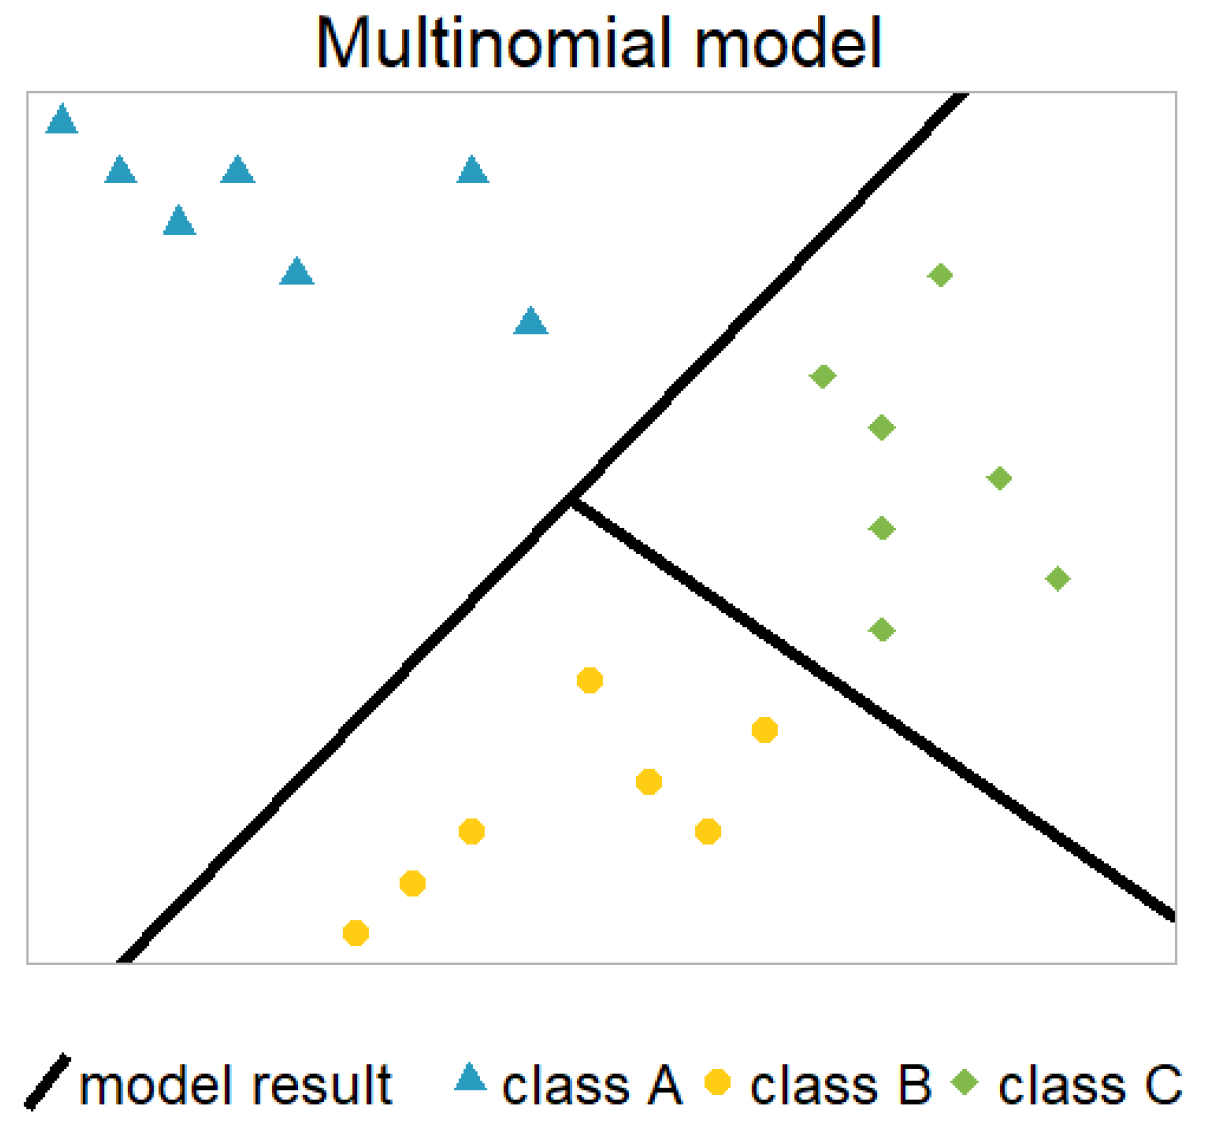
2.4. Multinomial Model
2.5. Transition History
- No previous information: There is always the possibility of ignoring any information about previous states. This is the easiest and most primitive way of dealing with the transition history but, it can still be legitimate for applications where the history is obviously irrelevant.
- Markov property: A Markov property can be assumed, see Dynkin (1965). The ‘past’ (transition history) does not matter for the ‘future’ (predictions), given that the ‘present’ (current state) is known, i.e.,:where t indicates the time (=contract duration) of an observation and corresponds to the state (active, paid-up, or lapse) in that year, t. Hence, we are modelling yearly lapse and paid-up rates.
- Full transition history: There are also applications in which it is possible to define one new covariate (or more), which represents the state history sufficiently. This highly depends on the number of states and the structure and dependencies of the underlying data set. In our specific example, the time since paying up seems to sufficiently describe the state history; see Section 3.1 for details.
3. Application for a European Life Insurer
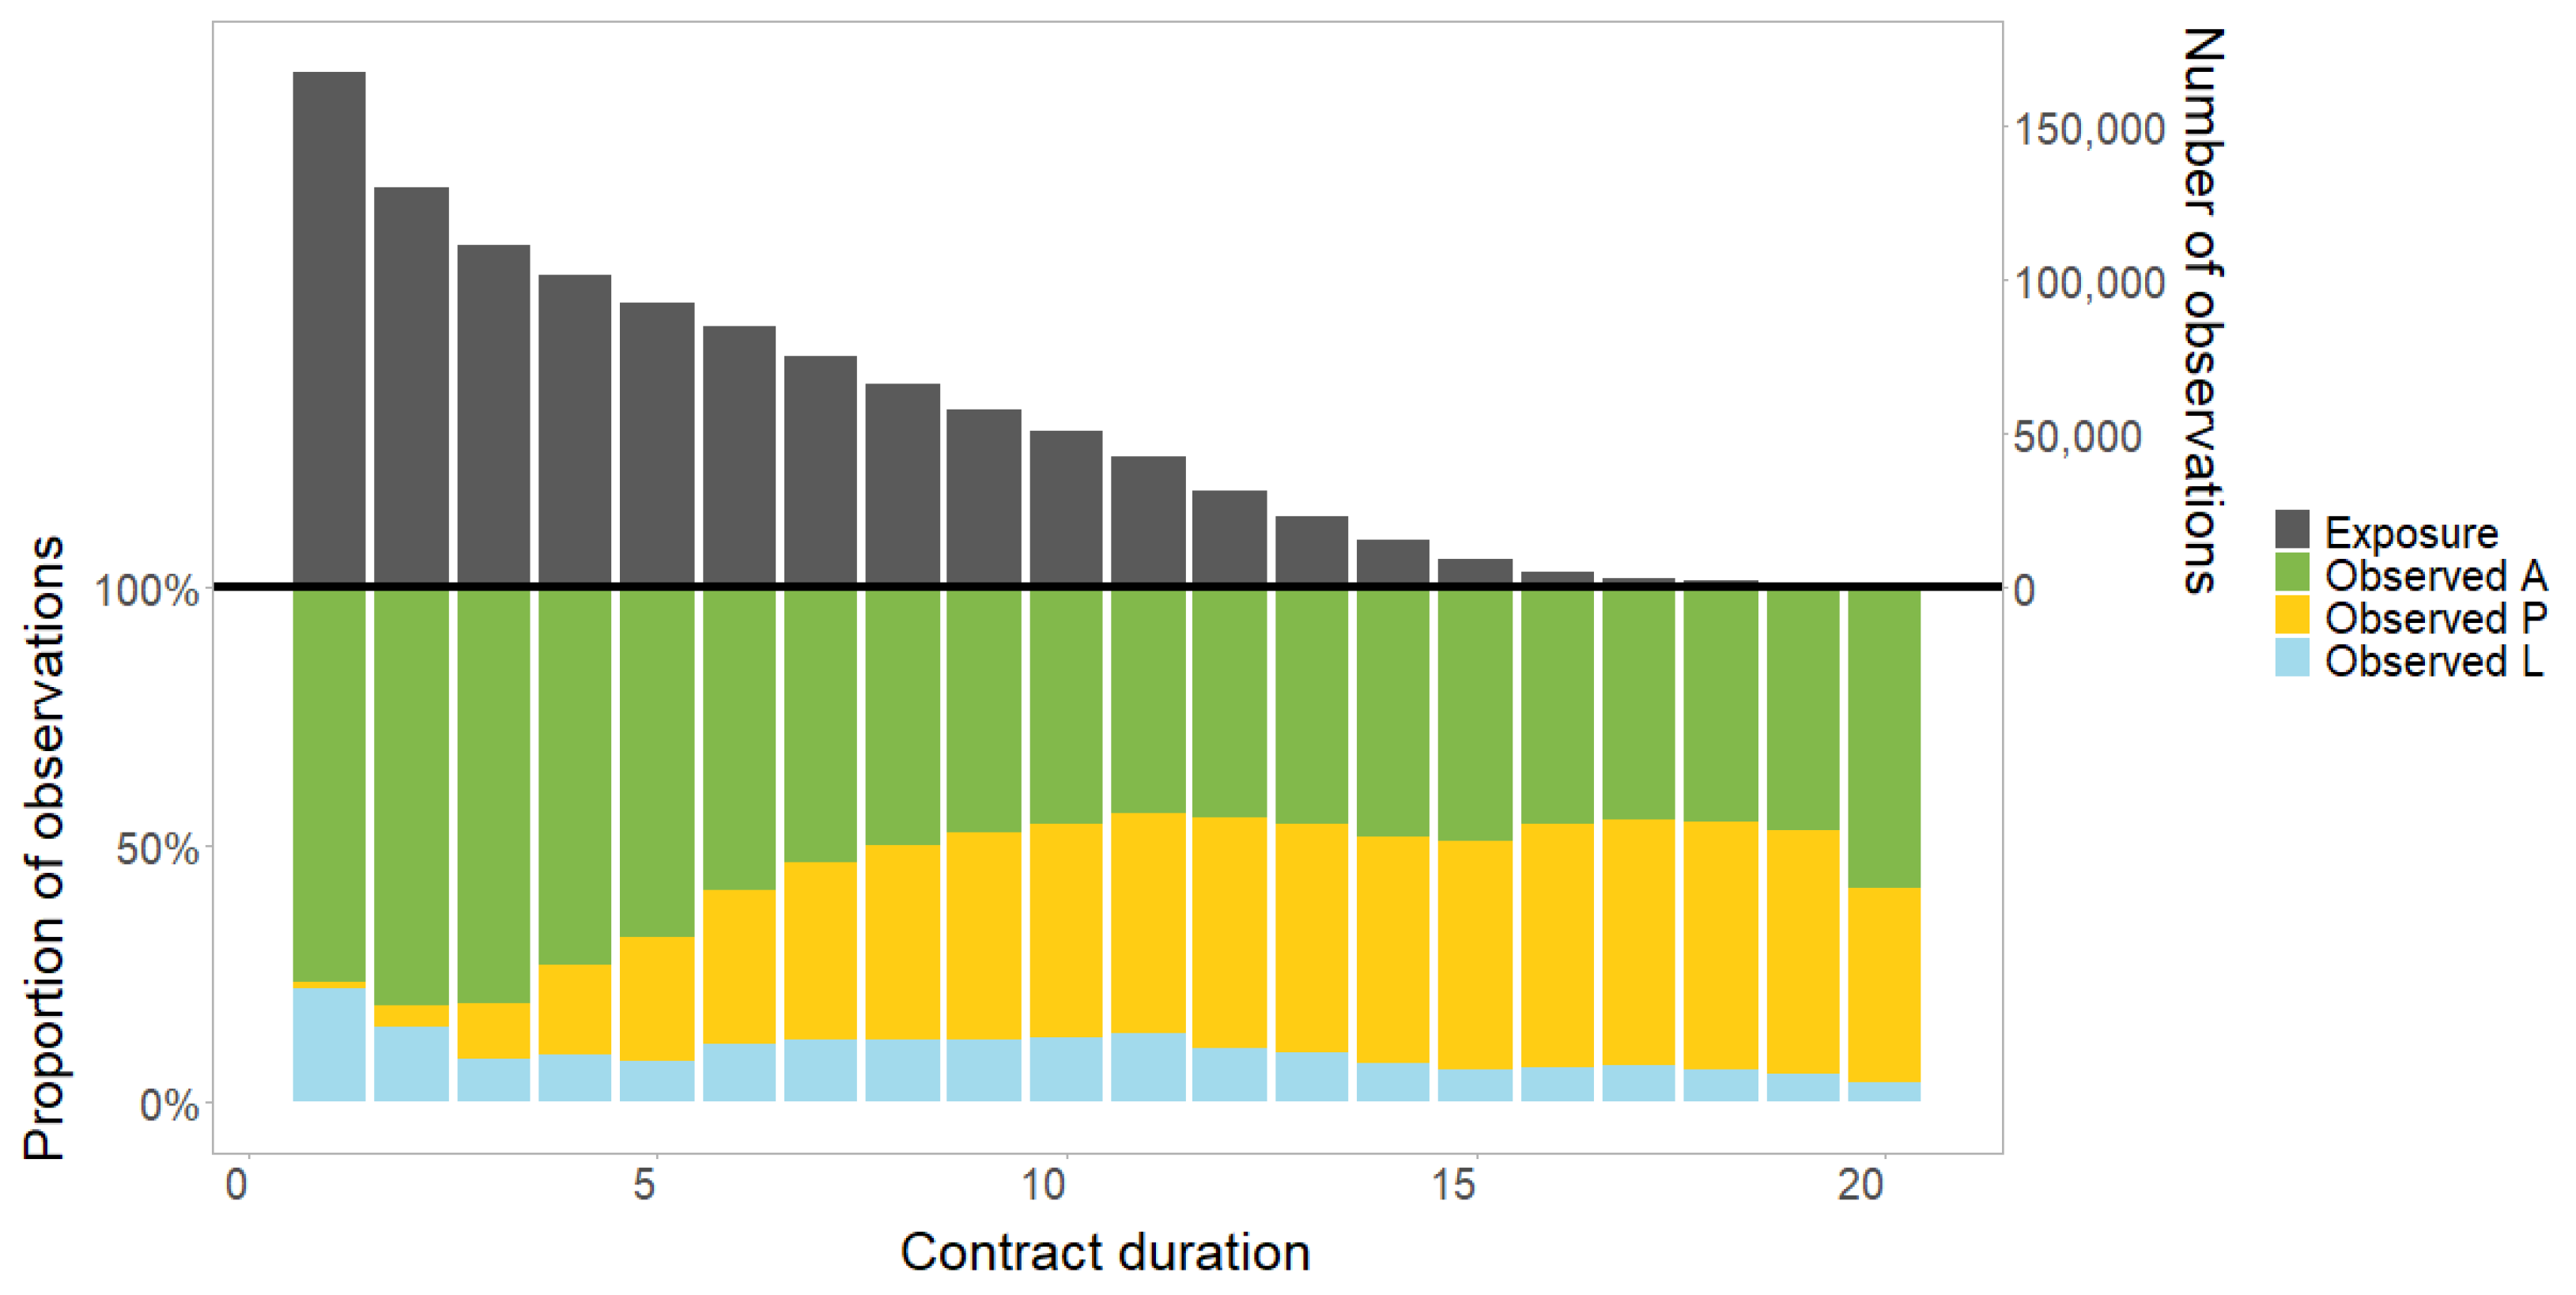
3.1. Data Description
3.2. General Model Setup
- Modelling the trend and fused Lasso penalty with contrast matrices;
- Determining the hyper-parameter based on a 5-fold cross-validation using the one standard error (1-se) rule4.
3.3. Specific Model Setup and Parameter Estimation
- The second model of each nested approach is identical to a model in the OVO approach. Of course, this can also be seen when comparing the columns of in Section 2.2 with and in Section 2.3.
- Splitting the data set requires an additional model which is identical for all approaches (cf. the last entry in the last column). For the subset with the initial state ‘active’, the number of models is identical to the previous number of models (including both initial states) because the corresponding response variable can still have all three states, ‘active’, ‘paid-up’, and ‘lapse’. For the subset with the initial state ‘paid-up’, however, one additional model is required with possible levels ‘paid-up’ and ‘lapse’ for the response variable. It is just a single logistic regression with an initial state, ‘paid-up’, and response, ‘paid-up’ or ‘lapse’.
- Whenever a model distinguishes class P from one (or all) other classes, the corresponding value is rather high—especially when P and L are compared (see Nested A, second model). A plausible interpretation might be that separating class P is comparably easy for a model in the sense that the model performance does not decrease when the penalisation is increased.
- The decomposition strategies have a higher degree of freedom in terms of the value because they might differ for the individual binary models. In this application, however, the values seem to have a similar magnitude across the different modelling approaches. Note that we also optimised the penalised likelihood functions from the decomposition strategies with the restriction of a constant penalisation term, , for all binary models. As expected, the impact on the results was rather small. This might be different in applications where the independently calibrated values vary more. In the end, we chose the penalisation terms of Table 1, which is consistent with the independent model definitions.
4. Results and Comparison of the Modelling Approaches
4.1. Transition History
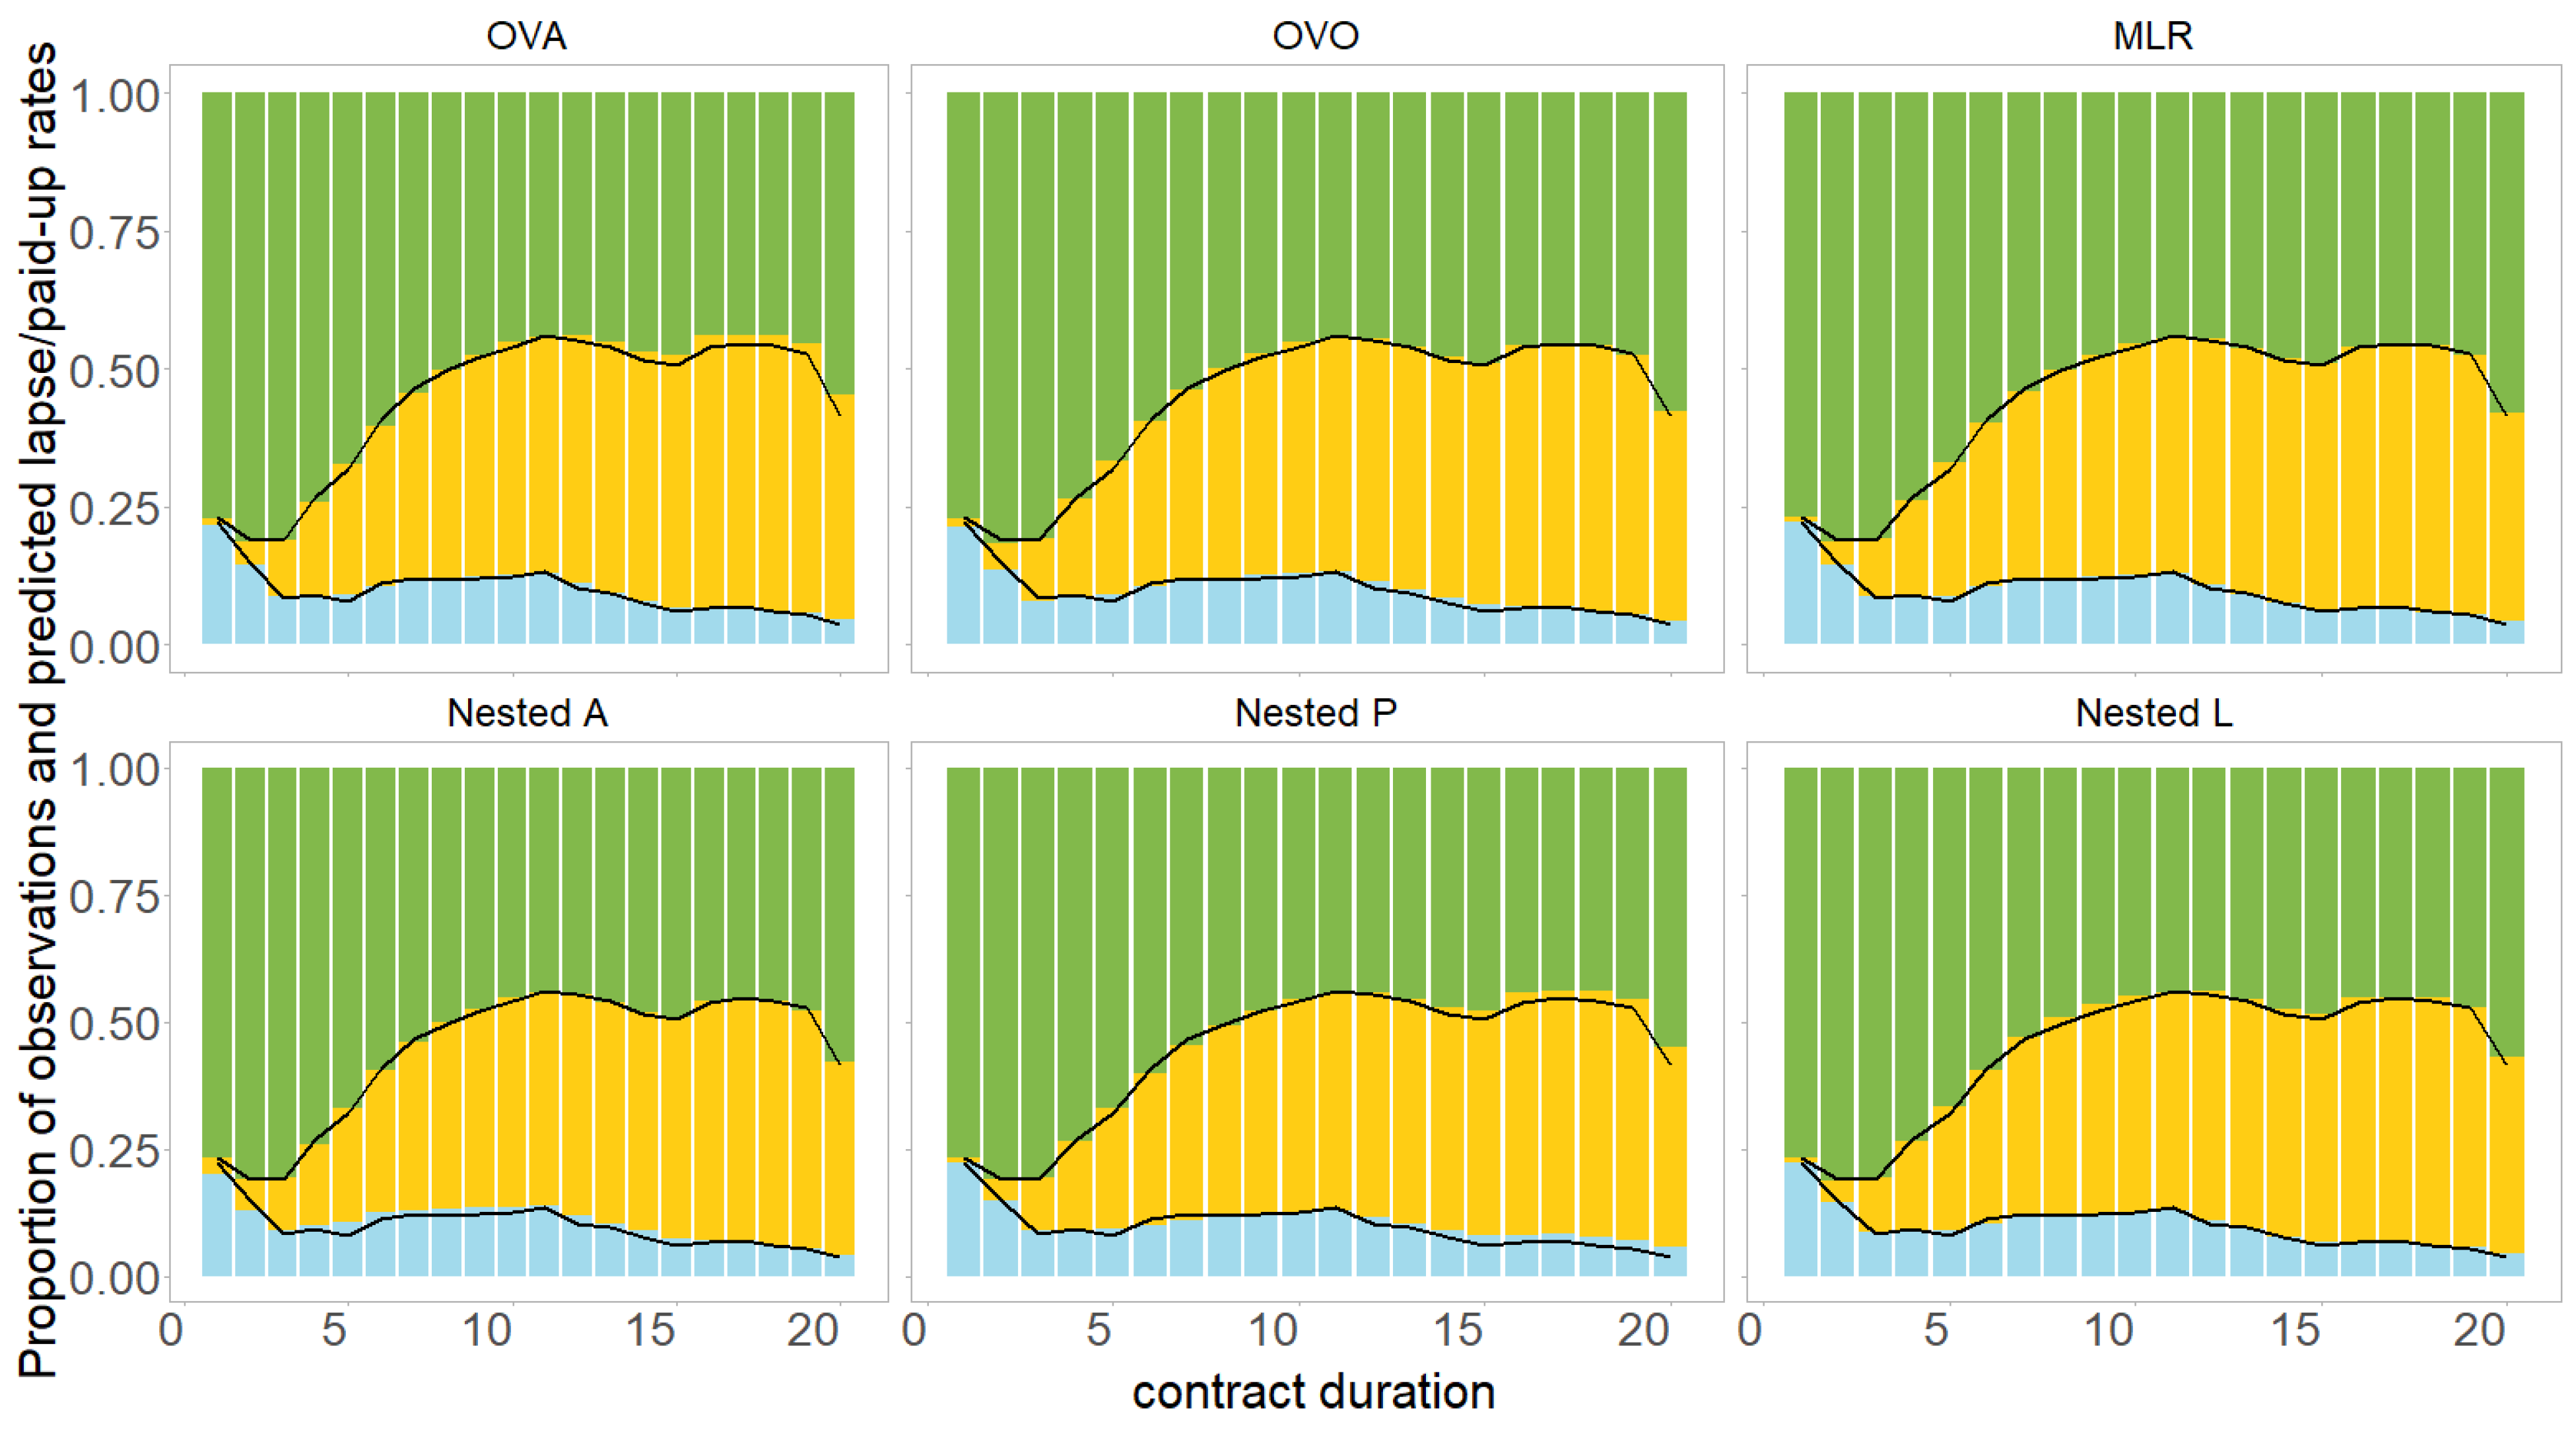
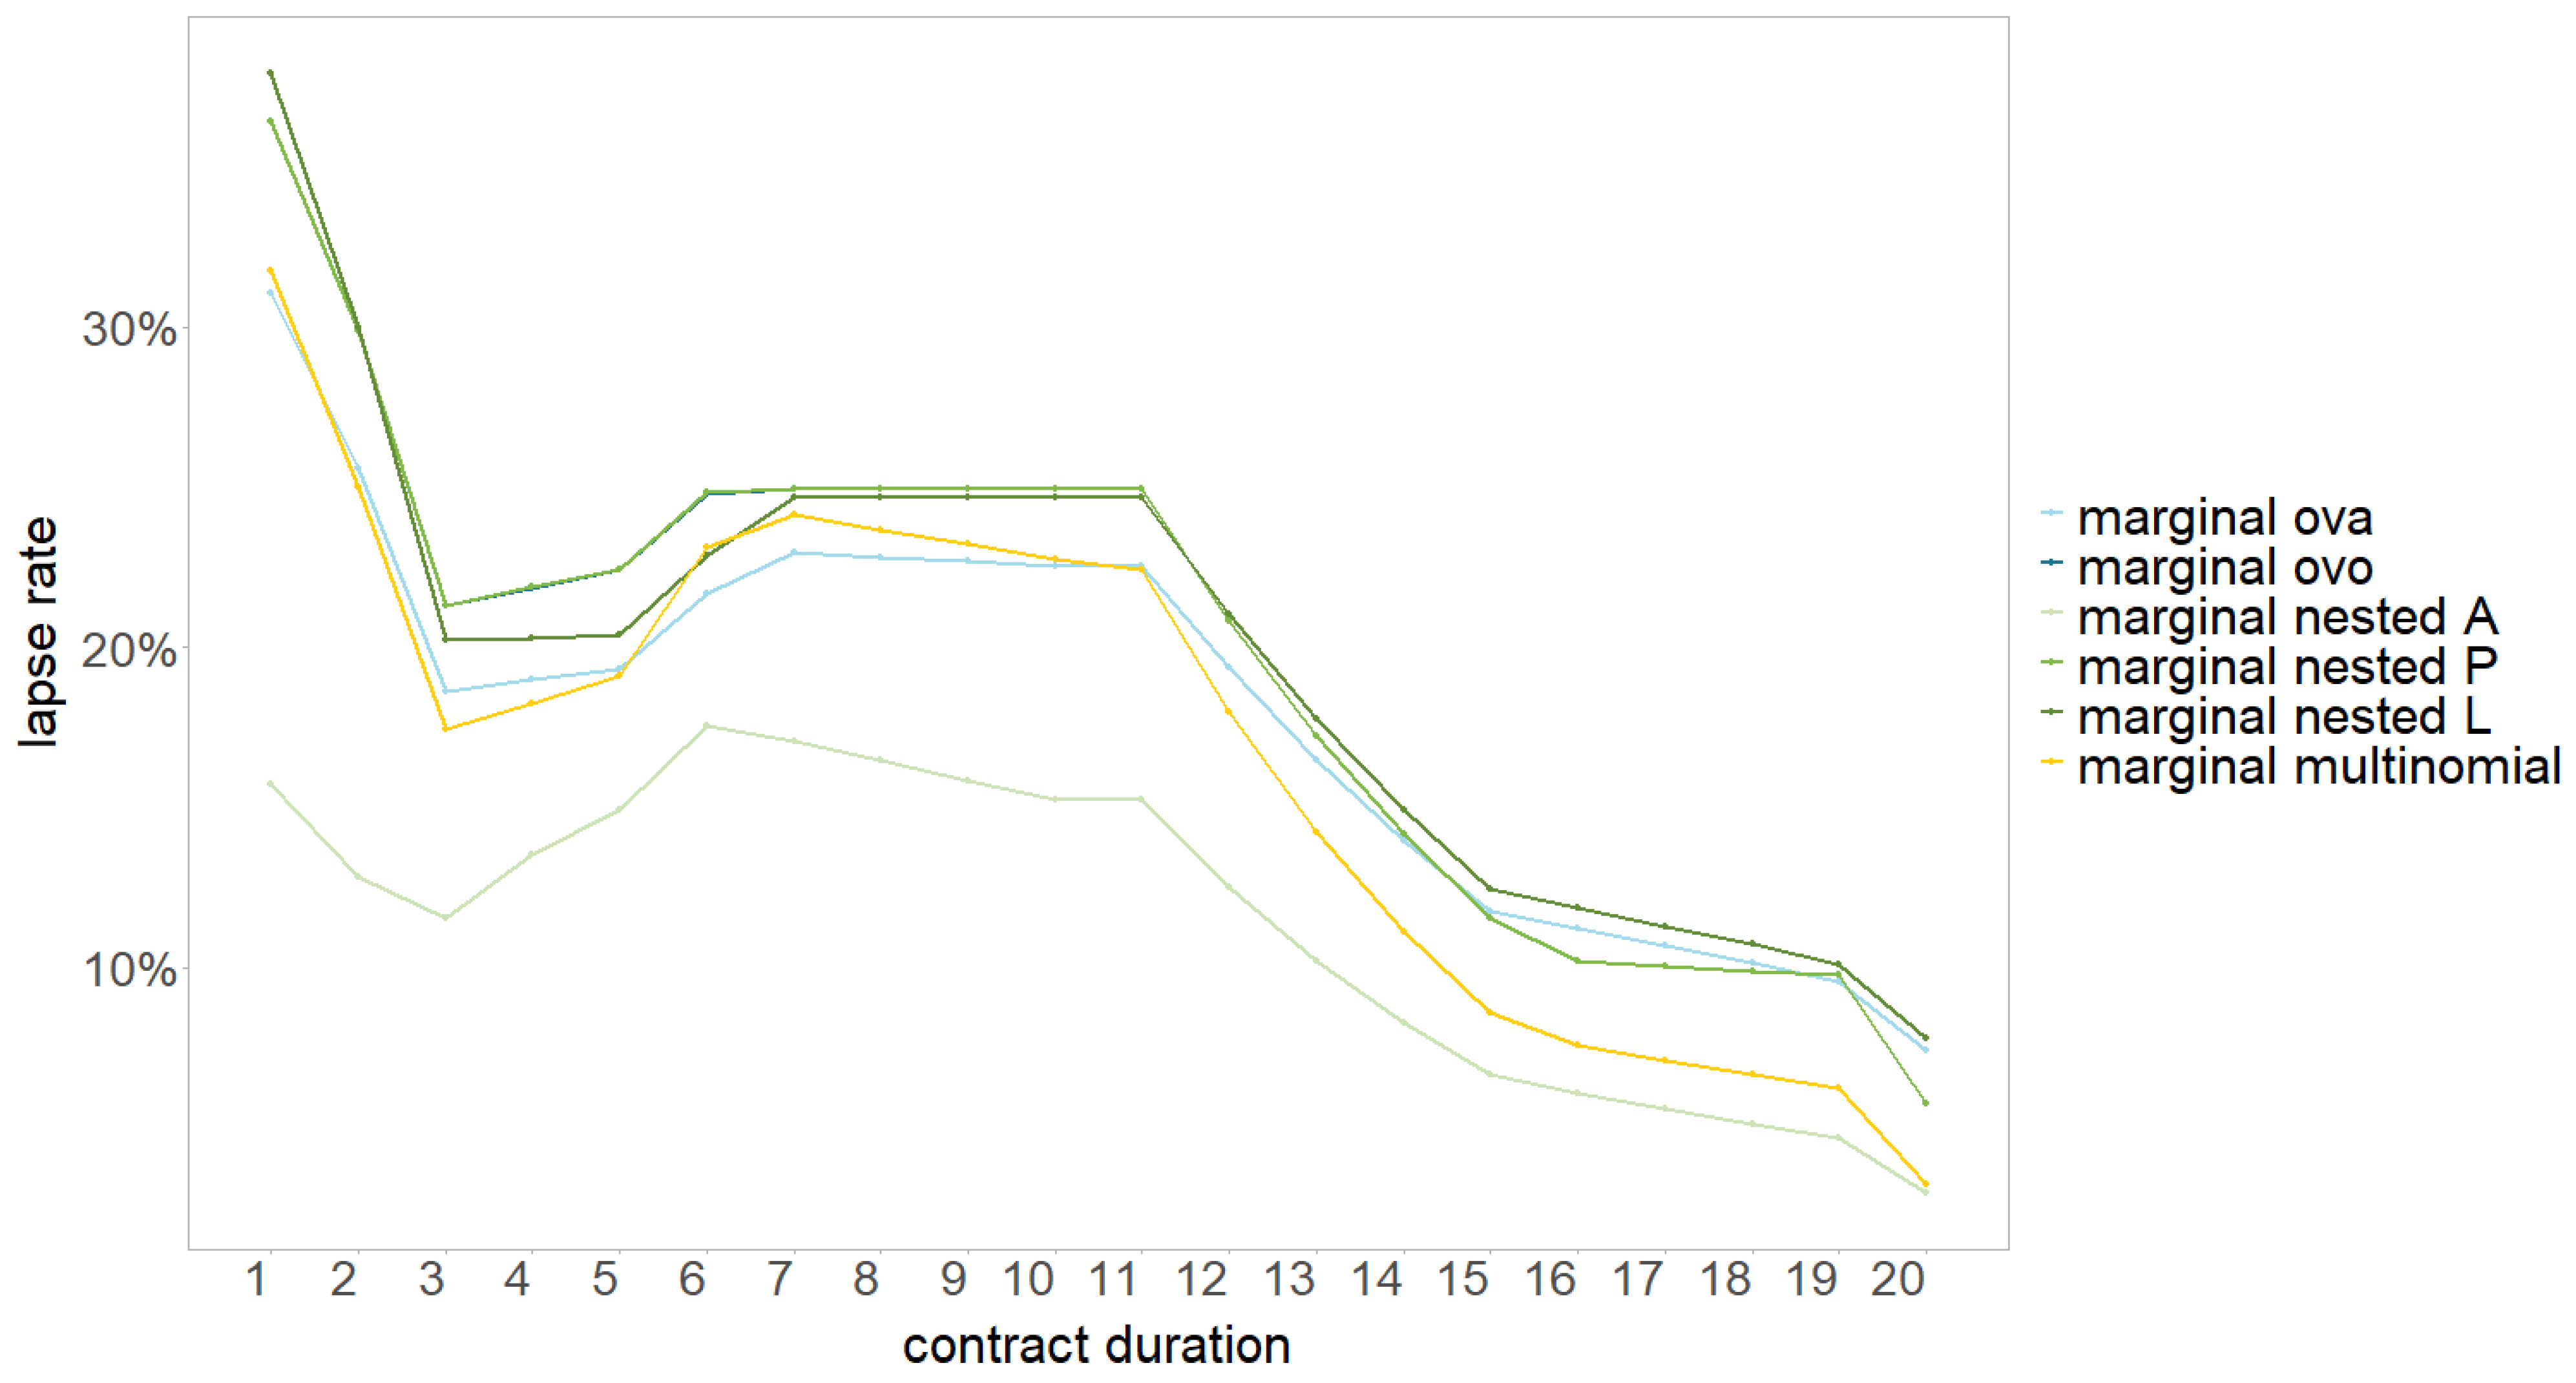
4.2. Modelling Approaches
5. Conclusions
Author Contributions
Funding
Data Availability Statement
Conflicts of Interest
Abbreviations
| Notation/Abbreviation | Explanation |
| GLM | Generalised linear model |
| MLR | Multinomial logistic regression |
| GBM | Gradient boosting machine |
| Lasso | Least absolute shrinkage and selection operator |
| OVA | One versus all model |
| OVO | One versus one model |
| Y | Response variable (dependent variable) |
| X | Covariate matrix (independent variables) |
| K | Set of possible classes |
| m | Number of classes, i.e., |
| n | Number of observations |
| J | Number of covariates |
| Model parameter vector | |
| Hyperparameter in the Lasso model controlling the penalisation strength | |
| A | Active state |
| P | Paid-up state |
| L | Lapse state |
Appendix A. Results of the MLR

| Intercept | Intercept |
|---|---|
| active | 3.09 |
| paid-up | −85.32 |
| lapse | −9.13 |
| active with calendar year | 3.97 |
| paid-up with calendar year | −102.67 |
| lapse with calendar year | −7.9 |
| contract duration | 1 | 2 | 3 | 4 | 5 | 6 | 7 | 8 | 9 | 10 |
| active | −0.15 | 0 | 0 | 0 | −0.67 | −0.27 | 0 | 0 | 0.03 | 0 |
| paid-up | 2.41 | 3.35 | 2.92 | 0 | 1.95 | 0 | 0 | 0 | 0 | 0.06 |
| lapse | 1.08 | −5.1 | 0 | −1.9 | 1.22 | 0.53 | 0 | 0 | −0.04 | −0.19 |
| active with calendar year | −1.28 | 1.12 | 0 | 0.82 | −2.24 | 0 | 0 | 0 | 0 | 0 |
| paid-up with calendar year | 0.91 | 4.45 | 3.14 | 0 | 0 | 0 | 0 | 0 | 0 | 0.81 |
| lapse with calendar year | 0 | −4.22 | 0 | −1.26 | 0.11 | 0.89 | 0 | 0 | 0 | 0 |
| contract duration | 11 | 12 | 13 | 14 | 15 | 16 | 17 | 18 | 19 | |
| active | 0.17 | 0 | 0.08 | 0 | 0 | −0.62 | 0 | 0 | 6.16 | |
| paid-up | 0 | −0.04 | 0 | 0 | 0 | 0 | 0.02 | 0 | 0 | |
| lapse | −2.41 | 0 | 0 | 0 | 1.51 | 0 | 0 | 0 | 0 | |
| active with calendar year | 0.14 | 0 | 0 | 0 | 0 | −0.27 | 0 | 0 | 4.72 | |
| paid-up with calendar year | 0 | −0.52 | 0 | 0 | 0 | 0 | 0 | 0 | 0 | |
| lapse with calendar year | −1.84 | 0 | 0 | 0 | 0.72 | 0 | 0 | 0 | 0 |
| Insurance Type | Unit-Linked |
|---|---|
| active | −1.11 |
| paid-up | 0 |
| lapse | 0.24 |
| active with calendar year | −0.42 |
| paid-up with calendar year | 0 |
| lapse with calendar year | 0.76 |
| Country | 1 | 2 | 3 |
|---|---|---|---|
| active | 0 | −1.9 | −7.35 |
| paid-up | 3.79 | 1.82 | 0 |
| lapse | -3.9 | 0 | 1.7 |
| active with calendar year | 0 | −1.32 | −7.08 |
| paid-up with calendar year | 3.37 | 2.68 | 0 |
| lapse with calendar year | −3.55 | 0 | 1.92 |
| Gender | Female |
|---|---|
| active | 0.32 |
| paid-up | −0.47 |
| lapse | 0 |
| active with calendar year | 0.31 |
| paid-up with calendar year | −0.48 |
| lapse with calendar year | 0 |
| Payment Frequency | Annual | Semi-Annual | Quarterly | Monthly |
|---|---|---|---|---|
| active | 0 | 0 | −0.04 | 1.73 |
| paid-up | 52.12 | 0 | 0 | 0 |
| lapse | −8.87 | −0.5 | 1.9 | −0.02 |
| active with calendar year | 0 | 0 | 0 | 1.79 |
| paid-up with calendar year | 51.3 | 0 | −0.01 | 0 |
| lapse with calendar year | −8.73 | −0.05 | 1.78 | 0 |
| Payment Method | Depositor | Other |
|---|---|---|
| active | 0 | −3.08 |
| paid-up | 12.13 | 0 |
| lapse | −1.34 | 0 |
| active with calendar year | 0 | −2.42 |
| paid-up with calendar year | 12.04 | 0 |
| lapse with calendar year | −1.37 | 0 |
| Nationality | Foreign |
|---|---|
| active | −2.4 |
| paid-up | 0 |
| lapse | 2.64 |
| active with calendar year | −2.39 |
| paid-up with calendar year | 0 |
| lapse with calendar year | 2.62 |
| Dynamic Premium Increase Percentage | 2 | 2.5 | 3 | 4 | 5 | 6 | 7 | 8 | 9 | 10 |
|---|---|---|---|---|---|---|---|---|---|---|
| active | 0 | 0 | 0 | 0 | −0.01 | −0.14 | 0 | 0 | −0.42 | 0 |
| paid-up | −0.39 | 0 | 0.07 | 0 | 0 | 0 | 0 | 0 | 0 | 0 |
| lapse | 5.14 | 0 | −0.54 | 0 | 0.16 | 0.36 | 0 | 0 | 0.6 | 0 |
| active with calendar year | 0 | 0 | 0 | 0 | −0.01 | −0.19 | 0 | 0 | −0.11 | 0 |
| paid-up with calendar year | −0.42 | 0 | 0.04 | 0 | 0 | 0 | 0 | 0 | 0 | 0 |
| lapse with calendar year | 5.17 | 0 | −0.29 | 0 | 0.06 | 0.24 | 0 | 0 | 1.02 | 0 |
| Entry Age | Bin 1 | Bin 2 | Bin 3 | Bin 4 | Bin 5 | Bin 6 | Bin 7 |
|---|---|---|---|---|---|---|---|
| active | −1.9 | 0.27 | 0.04 | 0 | 0 | 0 | 0 |
| paid-up | 0 | 0 | 0 | 0 | 0.6 | 0 | −0.35 |
| lapse | 0.36 | −0.34 | −0.52 | 0.12 | 0 | 0.62 | 1.14 |
| active with calendar year | −2.01 | 0.26 | 0.03 | 0 | 0 | 0 | 0 |
| paid-up with calendar year | 0 | 0 | 0 | 0 | 0.6 | 0 | −0.34 |
| lapse with calendar year | 0.2 | −0.3 | −0.5 | 0.1 | 0 | 0.63 | 1.15 |
| Original Term of the Contract | Bin 1 | Bin 2 | Bin 3 |
|---|---|---|---|
| active | 0 | 0 | 0 |
| paid-up | 0.14 | −0.4 | 0.83 |
| lapse | −1.73 | 2.13 | −1.3 |
| active with calendar year | 0 | 0 | 0 |
| paid-up with calendar year | 0 | −0.33 | 0.67 |
| lapse with calendar year | −2.92 | 2.13 | −1.24 |
| Premium Payment Duration | Bin 1 | Bin 2 | Bin 3 | Bin 4 | Bin 5 | Bin 6 |
|---|---|---|---|---|---|---|
| active | 0 | −1.63 | 0 | −0.15 | 0 | 0 |
| paid-up | 2.69 | 0 | 0.62 | 0 | 0 | 0 |
| lapse | −2.22 | 0 | 0 | 0 | 0.54 | −1.38 |
| active with calendar year | 0 | −1.62 | 0 | −0.16 | 0 | 0 |
| paid-up with calendar year | 2.68 | 0 | 0.55 | 0 | 0 | 0 |
| lapse with calendar year | −2.44 | 0 | −0.01 | 0 | 0.39 | −1.13 |
| Sum Insured | Bin 1 | Bin 2 | Bin 3 | Bin 4 | Bin 5 | Bin 6 | Bin 7 | Bin 8 | Bin 9 | Bin 10 | Bin 11 |
|---|---|---|---|---|---|---|---|---|---|---|---|
| active | 5.31 | 1.58 | 1.14 | 1.24 | 0 | 0 | 0 | 2.17 | −2.8 | −0.22 | 3.49 |
| paid-up | 0.24 | −0.4 | −0.74 | 0 | 0 | −3.35 | −0.29 | 0 | 0 | 0 | 0 |
| lapse | −1.23 | 0.01 | 0 | −1.33 | 0 | 2.5 | 2.08 | −4.84 | 1.2 | 2.47 | −1.51 |
| active with calendar year | 5.07 | 1.7 | 1.08 | 1.09 | 0 | 0 | 0 | 2.33 | −3.13 | −0.1 | 3.64 |
| paid-up with calendar year | 0 | −0.24 | −0.61 | 0 | 0 | −3.42 | −0.14 | 0 | 0 | 0 | 0 |
| lapse with calendar year | −1.62 | 0 | 0 | −1.39 | 0 | 2.47 | 2.06 | −4.5 | 0.72 | 2.56 | −1.26 |
| Yearly Premium | Bin 1 | Bin 2 | Bin 3 | Bin 4 | Bin 5 | Bin 6 |
|---|---|---|---|---|---|---|
| active | −6.31 | 1.91 | 0 | 0 | −6.47 | 5.47 |
| paid-up | 2.87 | 0.27 | −0.76 | 1.07 | 0 | 1.09 |
| lapse | 0 | −1.44 | 4.04 | −3.9 | 5.92 | −12.47 |
| active with calendar year | −6.68 | 1.91 | 0 | 0 | −6.45 | 5.34 |
| paid-up with calendar year | 2.4 | 0.18 | −0.5 | 0.92 | 0 | 1.22 |
| lapse with calendar year | 0 | −1.52 | 3.95 | −3.81 | 5.77 | −12.55 |
| Previous Status | Paid-Up |
|---|---|
| active | −88.35 |
| paid-up | 4.23 |
| lapse | 0 |
| active with calendar year | −88.4 |
| paid-up with calendar year | 4.31 |
| lapse with calendar year | 0 |
| calendar year | 2001 | 2002 | 2003 | 2004 | 2005 | 2006 | 2007 | 2008 | 2009 | 2010 |
| active | - | - | - | - | - | - | - | - | - | - |
| paid-up | - | - | - | - | - | - | - | - | - | - |
| lapse | - | - | - | - | - | - | - | - | - | - |
| active with calendar year | −0.21 | 0 | −2.24 | −0.24 | −1.31 | 1.97 | 0 | −0.76 | 0.28 | 0 |
| paid-up with calendar year | 0 | 0 | 0 | 10.29 | 6.85 | 0 | 0.48 | 0.59 | −0.03 | 1.34 |
| lapse with calendar year | 1.03 | 0 | 0 | 0 | 0 | 0 | −1.09 | 0 | 0 | −1.26 |
| calendar year | 2011 | 2012 | 2013 | 2014 | 2015 | 2016 | 2017 | 2018 | 2019 | 2020 |
| active | - | - | - | - | - | - | - | - | - | |
| paid-up | - | - | - | - | - | - | - | - | - | |
| lapse | - | - | - | - | - | - | - | - | - | |
| active with calendar year | 0 | −0.13 | −0.28 | 0 | 0.64 | 0.41 | 0 | 0 | 0.64 | 4.75 |
| paid-up with calendar year | 0.88 | 0 | 0 | −0.81 | −2.04 | −1.65 | −1.25 | 0 | 0 | 0 |
| lapse with calendar year | −3.68 | 1.02 | 0.07 | 0 | 0 | 0 | 0.06 | 0.67 | −0.61 | −12.14 |
| 1 | In pure classification problems, the predicted class would typically be the class with the highest overall estimate; see Lorena et al. (2008). |
| 2 | In pure classification problems, the overall estimate for the OVO model would typically be based on the majority vote; see Lorena et al. (2008). |
| 3 | Say, for example, that the contract duration equals three and the time since paying up equals zero. The only possible transition history is, therefore, A → A → A → A. If the contract duration equals three, and the time since paying up equals two, we can derive the transition history A → A → P → P. |
| 4 | The 1-se rule uses the most parsimonious model with a performance within one standard error from the optimal model (based on cross-validation). It is a common data science approach to deriving a robust model with a competitive performance. |
References
- Allwein, Erin L., Robert E. Schapire, and Yoram Singer. 2000. Reducing multiclass to binary: A unifying approach for margin classifiers. Journal of Machine Learning Research 1: 113–41. Available online: https://www.jmlr.org/papers/volume1/allwein00a/allwein00a.pdf (accessed on 3 April 2025).
- Azzone, Michele, Emilio Barucci, Giancarlo Giuffra Moncayo, and Daniele Marazzina. 2022. A machine learning model for lapse prediction in life insurance contracts. Expert Systems with Applications 191: 116261. [Google Scholar] [CrossRef]
- Barucci, Emilio, Tommaso Colozza, Daniele Marazzina, and Edit Rroji. 2020. The determinants of lapse rates in the Italian life insurance market. European Actuarial Journal 10: 149–178. [Google Scholar] [CrossRef]
- Christiansen, Marcus C. 2012. Multistate models in health insurance. AStA Advances in Statistical Analysis 96: 155–86. [Google Scholar] [CrossRef]
- Dong, Yumo, Edward W. Frees, Fei Huang, and Francis K. C. Hui. 2022. Multi-State Modelling Of Customer Churn. ASTIN Bulletin: The Journal of the IAA 52: 735–64. [Google Scholar] [CrossRef]
- Dynkin, Evgenii B. 1965. Markov Processes. Berlin and Heidelberg: Springer, pp. 77–104. [Google Scholar] [CrossRef]
- Eling, Martin, and Dieter Kiesenbauer. 2014. What policy features determine life insurance lapse? An analysis of the German market. Journal of Risk and Insurance 81: 241–69. [Google Scholar] [CrossRef]
- Eling, Martin, and Michael Kochanski. 2013. Research on lapse in life insurance: What has been done and what needs to be done? The Journal of Risk Finance 14: 392–413. [Google Scholar] [CrossRef]
- EU. 2015. Commission Delegated Regulation (EU) 2015/35. Official Journal of the European Union L12: 1–797. [Google Scholar]
- Frees, Edward W. 2004. Longitudinal and Panel Data: Analysis and Applications in the Social Sciences. Cambridge: Cambridge University Press, pp. 387–416. [Google Scholar] [CrossRef]
- Galar, Mikel, Alberto Fernández, Edurne Barrenechea, Humberto Bustince, and Francisco Herrera. 2011. An overview of ensemble methods for binary classifiers in multi-class problems: Experimental study on one-vs-one and one-vs-all schemes. Pattern Recognition 44: 1761–76. [Google Scholar] [CrossRef]
- Gatenby, Peter, and Nick Ward. 1994. Multiple state modelling. Paper presented at Staple Inn Actuarial Society, London, UK, February 1; Available online: https://www.actuaries.org.uk/system/files/documents/pdf/modelling.pdf (accessed on 3 April 2025).
- Grubinger, Thomas, Achim Zeileis, and Karl-Peter Pfeiffer. 2014. Evtree: Evolutionary learning of globally optimal classification and regression trees in R. Journal of Statistical Software 61: 1–29. [Google Scholar] [CrossRef]
- Haberman, Steven, and Arthur E. Renshaw. 1996. Generalized linear models and actuarial science. Journal of the Royal Statistical Society: Series D (The Statistician) 45: 407–36. [Google Scholar] [CrossRef]
- Hand, David J., and Robert J. Till. 2001. A simple generalisation of the area under the ROC curve for multiple class classification problems. Machine Learning 45: 171–86. [Google Scholar] [CrossRef]
- Hastie, Trevor, and Robert Tibshirani. 1997. Classification by pairwise coupling. In Advances in Neural Information Processing Systems. Cambridge: MIT Press, vol. 10, Available online: https://proceedings.neurips.cc/paper/1997/file/70feb62b69f16e0238f741fab228fec2-Paper.pdf (accessed on 3 April 2025).
- Henckaerts, Roel, Katrien Antonio, Maxime Clijsters, and Roel Verbelen. 2018. A data driven binning strategy for the construction of insurance tariff classes. Scandinavian Actuarial Journal 8: 681–705. [Google Scholar] [CrossRef]
- Kiesenbauer, Dieter. 2012. Main Determinants of Lapse in the German Life Insurance Industry. North American Actuarial Journal 16: 52–73. [Google Scholar] [CrossRef]
- Kim, Seung-Jean, Kwangmoo Koh, Stephen Boyd, and Dimitry Gorinevsky. 2009. ℓ1 Trend Filtering. SIAM Review 51: 339–60. [Google Scholar] [CrossRef]
- Kullback, Solomon, and Richard A. Leibler. 1951. On information and sufficiency. The Annals of Mathematical Statistics 22: 79–86. Available online: https://www.jstor.org/stable/2236703 (accessed on 3 April 2025). [CrossRef]
- Kwon, Hyuk-Sung, and Bruce L. Jones. 2008. Applications of a multi-state risk factor/mortality model in life insurance. Insurance: Mathematics and Economics 43: 394–402. [Google Scholar] [CrossRef]
- LeDell, Erin, Navdeep Gill, Spencer Aiello, Anqi Fu, Arno Candel, Cliff Click, Tom Kraljevic, Tomas Nykodym, Patrick Aboyoun, and Michal Kurka. 2022. h2o: R Interface for the ‘H2O’ Scalable Machine Learning Platform. R package version 3.38.0.1. Available online: https://github.com/h2oai/h2o-3 (accessed on 3 April 2025).
- Lorena, Ana Carolina, André C. P. L. F. de Carvalho, and João M. P. Gama. 2008. A review on the combination of binary classifiers in multi-class problems. Artificial Intelligence Review 30: 19–37. [Google Scholar] [CrossRef]
- McCullagh, Peter, and John A. Nelder. 1989. Generalized Linear Models, 2nd ed. New York: Routledge. [Google Scholar] [CrossRef]
- Milhaud, Xavier, and Christophe Dutang. 2018. Lapse tables for lapse risk management in insurance: A competing risk approach. European Actuarial Journal 8: 97–126. [Google Scholar] [CrossRef]
- Poufinas, Thomas, and Gina Michaelide. 2018. Determinants of life insurance policy surrenders. Modern Economy 9: 1400–22. [Google Scholar] [CrossRef]
- R Core Team. 2022. R: A Language and Environment for Statistical Computing. Vienna: R Foundation for Statistical Computing. Available online: https://www.R-project.org/ (accessed on 3 April 2025).
- Reck, Lucas, Johannes Schupp, and Andreas Reuß. 2023. Identifying the determinants of lapse rates in life insurance: An automated Lasso approach. European Actuarial Journal 13: 541–569. [Google Scholar] [CrossRef]
- Schweizerische Aktuarvereinigung. 2018. Richtlinie der Schweizerischen Aktuarvereinigung zur Bestimmung ausreichender technischer Rückstellungen Leben gemäss FINMA Rundschreiben 2008/43 “Rückstellungen Lebensversicherung”. Available online: https://www.actuaries.ch/de/downloads/aid!b4ae4834-66cd-464b-bd27-1497194efc96/id!39/Richtlinie%20%C3%9Cberpr%C3%BCfung%20technische%20R%C3%BCckstellungen%20Leben_Version%202018.pdf (accessed on 3 April 2025).
- Tibshirani, Robert. 1996. Regression shrinkage and selection via the lasso. Journal of the Royal Statistical Society: Series B (Methodological) 58: 267–88. [Google Scholar] [CrossRef]
- Tibshirani, Robert, Michael Saunders, Saharon Rosset, Ji Zhu, and Keith Knight. 2005. Sparsity and smoothness via the fused lasso. Journal of the Royal Statistical Society: Series B (Statistical Methodology) 67: 91–108. [Google Scholar] [CrossRef]
- Tibshirani, Ryan J., and Jonathan Taylor. 2011. The solution path of the generalized lasso. The Annals of Statistics 39: 1335–71. [Google Scholar] [CrossRef]
- Xong, Lim Jin, and Ho Ming Kang. 2019. A Comparison of Classification Models for Life Insurance Lapse Risk. International Journal of Recent Technology and Engineering (IJRTE) 7: 245–50. [Google Scholar]
- Zhang, Lidan. 2016. A Multi-State Model for a Life Insurance Product with integrated Health Rewards Program. Burnaby: Simon Fraser University. [Google Scholar]
- Zhang, Zhongliang, Bartosz Krawczyk, Salvador Garcìa, Alejandro Rosales-Pérez, and Francisco Herrera. 2016. Empowering one-vs-one decomposition with ensemble learning for multi-class imbalanced data. Knowledge-Based Systems 106: 251–63. [Google Scholar] [CrossRef]

| Markov Property | |||||
|---|---|---|---|---|---|
| Model | No Previous Information | Markov Property | Full Transition History | Including Interactions | Splitting the Data Set |
| OVA | 1.92, 2.39, 1.63 | 1.45, 2.82, 1.48 | 1.21, 1.65, 1.48 | 1.45, 1.22, 1.12 | 2.41, 4.72, 2.96, 31.44 |
| OVO | 2.66, 1.49, 8.82 | 2.02, 1.49, 6.38 | 1.26, 1.53, 4.60 | 2.02, 1.49, 2.52 | 2.48, 3.81, 3.32, 31.44 |
| Nested A | 1.92, 8.82 | 1.45, 6.38 | 1.21, 4.60 | 1.45, 2.52 | 2.41, 3.32, 31.44 |
| Nested P | 2.39, 1.49 | 2.82, 1.49 | 1.65, 1.53 | 1.22, 1.49 | 4.72, 3.81, 31.44 |
| Nested L | 1.63, 2.66 | 1.48, 2.02 | 1.48, 1.26 | 1.12, 2.02 | 2.96, 2.48, 31.44 |
| MLR | 1.37 | 1.03 | 0.95 | 0.94 | 1.70, 31.44 |
| Covariate | Penalty Type |
|---|---|
| contract duration | trend filtering |
| insurance type | regular |
| country | regular |
| gender | regular |
| payment frequency | fused |
| payment method | regular |
| nationality | regular |
| dynamic premium increase percentage | trend filtering |
| entry age | fused |
| original term of the contract | trend filtering |
| premium payment duration | trend filtering |
| sum insured | trend filtering |
| yearly premium | trend filtering |
| previous status | regular |
| time since paying up | regular |
| Markov Property | |||||
|---|---|---|---|---|---|
| Model | No Previous Information | Markov Property | Full Transition History | Including Interactions | Splitting the Data Set |
| Improvement over intercept-only model: [in %] | |||||
| Intercept only | 0.0 | 0.0 | 0.0 | 0.0 | 0.0 |
| OVA | 37.6 | 48.4 | 48.5 | 50.0 | 49.9 |
| OVO | 39.9 | 50.8 | 50.9 | 51.4 | 51.3 |
| Nested A | 30.0 | 46.6 | 46.7 | 47.4 | 47.3 |
| Nested P | 37.9 | 48.2 | 48.5 | 50.4 | 50.2 |
| Nested L | 42.5 | 50.1 | 50.1 | 50.9 | 50.8 |
| MLR | 37.9 | 48.2 | 48.6 | 50.4 | 50.3 |
| Number of models, parameters and potential parameters | |||||
| Intercept only | 1/1 | 1/1 | 1/1 | 1/1 | 1/1 |
| OVA | 3/179/225 | 3/170/228 | 3/212/276 | 3/276/447 | 4/162/298 |
| OVO | 3/159/225 | 3/148/228 | 3/191/274 | 3/199/447 | 4/160/298 |
| Nested A | 2/104/150 | 2/108/152 | 2/134/184 | 2/154/298 | 3/126/223 |
| Nested P | 2/122/150 | 2/107/152 | 2/134/182 | 2/161/298 | 3/101/223 |
| Nested L | 2/112/150 | 2/103/152 | 2/135/184 | 2/160/298 | 3/113/223 |
| MLR | 1/94/150 | 1/86/152 | 1/108/184 | 1/171/298 | 2/104/223 |
| Computing time [in minutes] | |||||
| Intercept only | 0 | 0 | 0 | 0 | 0 |
| OVA | 8 | 12 | 13 | 16 | 8 |
| OVO | 7 (138) | 8 (140) | 8 (136) | 9 (136) | 5 (95) |
| Nested A | 5 | 5 | 6 | 7 | 3 |
| Nested P | 6 | 7 | 7 | 10 | 6 |
| Nested L | 7 | 7 | 8 | 10 | 5 |
| MLR | 14 | 16 | 17 | 26 | 10 |
Disclaimer/Publisher’s Note: The statements, opinions and data contained in all publications are solely those of the individual author(s) and contributor(s) and not of MDPI and/or the editor(s). MDPI and/or the editor(s) disclaim responsibility for any injury to people or property resulting from any ideas, methods, instructions or products referred to in the content. |
© 2025 by the authors. Licensee MDPI, Basel, Switzerland. This article is an open access article distributed under the terms and conditions of the Creative Commons Attribution (CC BY) license (https://creativecommons.org/licenses/by/4.0/).
Share and Cite
Reck, L.; Schupp, J.; Reuß, A. A Multistate Analysis of Policyholder Behaviour in Life Insurance—Lasso-Based Modelling Approaches. Risks 2025, 13, 73. https://doi.org/10.3390/risks13040073
Reck L, Schupp J, Reuß A. A Multistate Analysis of Policyholder Behaviour in Life Insurance—Lasso-Based Modelling Approaches. Risks. 2025; 13(4):73. https://doi.org/10.3390/risks13040073
Chicago/Turabian StyleReck, Lucas, Johannes Schupp, and Andreas Reuß. 2025. "A Multistate Analysis of Policyholder Behaviour in Life Insurance—Lasso-Based Modelling Approaches" Risks 13, no. 4: 73. https://doi.org/10.3390/risks13040073
APA StyleReck, L., Schupp, J., & Reuß, A. (2025). A Multistate Analysis of Policyholder Behaviour in Life Insurance—Lasso-Based Modelling Approaches. Risks, 13(4), 73. https://doi.org/10.3390/risks13040073