1. Introduction
As cryptocurrencies continue to gain prominence in financial markets, their predictability remains a major challenge, particularly in light of emerging environmental pressures. A key question, largely overlooked in the literature, arises: do environmental variables, such as temperature anomalies and CO2 emissions, influence cryptocurrency returns?
This issue is particularly relevant in light of two major trends. First, the growing integration of ESG (Environmental, Social, and Governance) criteria into investment strategies is shaping the perception of risk associated with cryptocurrencies, which may, in turn, influence investor demand. Second, the tightening of regulations targeting energy-intensive mining practices—such as the MiCA regulation in Europe and energy taxation on mining in the United States—is altering cost structures and, consequently, the profitability of cryptocurrency-related activities. These developments suggest a potential interaction between environmental factors and cryptocurrency price dynamics, warranting further analysis to assess both the extent of this relationship and the underlying mechanisms.
So far, debates on the environmental impact of cryptocurrencies have primarily focused on technical metrics (e.g., energy consumption per transaction), without fully exploring their economic implications. However, recent studies suggest that environmental factors may influence cryptocurrency returns through three main channels:
Regulatory channel: Restrictions on carbon-intensive mining increase operational costs and affect miners’ profitability. For instance, China’s 2021 mining ban triggered a sharp drop in Bitcoin’s price, falling from USD 64,000 to USD 48,000 (
Liu et al. 2022).
Demand channel: The rise of ESG-focused investment funds is pushing institutional investors away from highly polluting cryptocurrencies, affecting their long-term valuation.
Systemic risk channel: Extreme climate events disrupt mining operations and amplify cryptocurrency market volatility. For example, in 2023, an extreme heatwave in Texas forced ERCOT to temporarily suspend Bitcoin mining operations, leading to a drop in the network’s hash rate and a sudden surge in market volatility.
Even investors indifferent to climate concerns are affected by these dynamics. Policy decisions and energy shocks directly influence extraction costs and cryptocurrency market liquidity, inevitably impacting digital asset valuation.
Clark et al. (
2023) suggest that climate anomalies and CO
2 emissions may influence cryptocurrency prices, but these analyses are often static and fail to account for dynamic interactions. Unlike previous studies, and building upon
Clark et al. (
2023), our research adopts a dynamic approach to better capture how these relationships evolve over time in response to environmental regulations and economic cycles.
To address this issue, we employ an econometric framework combining two complementary models:
DCC-GARCH, which models dynamic volatility and interdependencies between cryptocurrencies and environmental factors, which is particularly relevant given the volatility clustering observed in crypto markets (
Tissaoui et al. 2024);
TVC-VAR, which captures the evolving relationship between environmental shocks and cryptocurrency returns, allowing us to identify structural breaks induced by regulations and energy crises (
Abidi and Touhami 2024).
This methodology highlights how environmental predictors interact with digital assets, offering actionable insights for portfolio management and public policy. By incorporating recent data reflecting ESG policy developments and mining regulations, this study provides a deeper understanding of the interplay between cryptocurrency markets and environmental challenges.
The findings of this research will make significant contributions to the literature by identifying new sources of risk that should be integrated into cryptocurrency portfolio management, beyond traditional economic and financial factors.
This paper is structured as follows:
Section 2 reviews the literature,
Section 3 presents the research hypotheses,
Section 4 describes the data and methodology,
Section 5 provides the empirical results and discussion, and
Section 6 concludes the study.
2. Literature Review
Cryptocurrencies have emerged as a distinct asset class, attracting increasing attention from investors, researchers, and regulators. Unlike traditional financial assets such as stocks, bonds, or commodities, they are characterized by extreme volatility, growing adoption, and significant sensitivity to external shocks—whether economic, geopolitical, or environmental. A key question in financial literature concerns the predictability of cryptocurrency returns, which is crucial not only for market efficiency but also for risk management and the development of optimized investment strategies.
Several studies have explored the determinants of cryptocurrency returns and forecasting models designed to anticipate their fluctuations.
2.1. Interactions Between Cryptocurrencies and Environmental Shocks
An emerging topic in cryptocurrency research concerns their interaction with environmental shocks and climate regulations.
Clark et al. (
2023) pioneered this field by examining how CO
2 emissions and temperature anomalies influence cryptocurrency volatility. Unlike studies focused on the carbon footprint of mining, their approach highlights a significant relationship between CO
2 emissions and the returns of Bitcoin and Ethereum, while stablecoins such as Tether and TrueUSD remain unaffected by these variables.
These findings suggest that environmental concerns and climate regulations could become key factors in assessing cryptocurrency markets. As regulators implement stricter energy and emissions policies, investors may adjust their strategies accordingly.
Furthermore, the evolution of climate regulations and increasing investor concerns about the energy transition may introduce new sources of volatility. As a result, integrating these environmental variables into financial analysis models could enhance our understanding of cryptocurrency market dynamics.
This relationship raises the question of their inclusion in forecasting models, justifying the exploration of new methodological approaches.
2.2. Technical Factors and Advanced Forecasting Methods
Early empirical research on cryptocurrency returns focused on technical factors, particularly price trends and trading volumes. Using a nonparametric quantile causality test over the 2010–2017 period,
Balcilar et al. (
2017) showed that trading volume helps predict Bitcoin returns, except under extreme market conditions, where this relationship becomes unstable. Similarly,
Bouri et al. (
2019), employing copula and quantile causality tests over the 2014–2018 period, demonstrated that trading volume primarily influences extreme returns but has a limited effect on overall cryptocurrency volatility. Using dynamic conditional correlations (DCCs) over a three-year period,
Tzouvanas et al. (
2020) found that relationships between cryptocurrency returns and other financial assets fluctuate depending on market conditions.
With the rise of new technologies, recent studies have integrated machine learning techniques to improve prediction accuracy.
Xilong and Tao (
2023) applied supervised feature selection models and principal component analysis over the 2015–2022 period to optimize return forecasting models. Similarly,
Juwita et al. (
2023), using VAR and GARCH models over the 2017–2021 period, confirmed that trading volume and price volatility are key indicators of cryptocurrency returns.
These approaches highlight the need to integrate additional exogenous factors to enhance the robustness of forecasting models, particularly by incorporating environmental variables, whose influence on cryptocurrency returns is only beginning to be documented.
2.3. Macroeconomic and Geopolitical Factors
Research has progressively shifted towards macroeconomic and geopolitical factors that influence cryptocurrency returns.
Demir et al. (
2018) analyzed the role of economic policy uncertainty (EPU) in Bitcoin dynamics. Using a Bayesian SVAR model, OLS regressions, and quantile-on-quantile analysis, they identified a nonlinear relationship between these variables, suggesting that Bitcoin can act as a safe-haven asset under certain economic uncertainty conditions.
In the same vein,
Aysan et al. (
2019) examined the predictive power of the global geopolitical risk (GPR) index on Bitcoin returns between 2010 and 2018. Their findings, based on a BSGVAR model and quantile regressions, indicate that while Bitcoin is negatively affected by moderate geopolitical tensions, it serves as a hedge when these tensions reach extreme levels.
Long et al. (
2022) introduced the concept of “geopolitical beta” (βGPR), measuring cryptocurrencies’ sensitivity to geopolitical shocks. Their study found that some cryptocurrencies are more exposed to geopolitical events, significantly influencing their performance. Specifically, cryptocurrencies with low geopolitical risk exposure tend to outperform those with high geopolitical beta, suggesting that investors demand a premium for assets closely correlated with geopolitical tensions.
Finally,
Kamal and Wahlstrøm (
2023) investigated the impact of the Russia–Ukraine conflict in February 2022 on the cryptocurrency market. Using asymmetric GARCH models, they found that the actual escalation of the conflict had a more pronounced negative effect than the mere threat of escalation—contrary to stock markets, where geopolitical threats typically have a stronger impact than actual events. They also observed increased cryptocurrency demand following the escalation, suggesting their use as a means to bypass economic sanctions and facilitate cross-border financial transfers.
Given these insights, it becomes essential to assess whether environmental shocks, like macroeconomic and geopolitical shocks, influence cryptocurrency market dynamics and volatility.
2.4. Contribution of Our Study
This study differentiates itself from previous research by incorporating environmental variables into the analysis of cryptocurrency returns. Unlike existing approaches, which primarily focus on the carbon footprint of mining or static analyses of environmental impacts, we introduce an advanced methodology capable of capturing the dynamic evolution of these relationships. By integrating DCC-GARCH and TVC-VAR models, our approach surpasses the limitations of the static models used by
Clark et al. (
2023), offering a more realistic perspective on the interactions between cryptocurrencies and environmental factors. This enables us to analyze how these relationships evolve in response to regulatory changes, economic shocks, and structural market transformations, while also identifying periods of heightened volatility and structural shifts influencing price dynamics.
Our study also covers a broader and more recent period (2017–2023), incorporating major events that have significantly reshaped the cryptocurrency market. The 2021 ban on mining in China led to a massive relocation of mining operations, altering the geographical distribution of Bitcoin’s energy consumption. Ethereum’s transition to Proof-of-Stake in 2022 considerably reduced its carbon footprint, potentially affecting its sensitivity to environmental factors. Additionally, the tightening of ESG regulations is shaping new institutional investment dynamics, reinforcing the growing importance of environmental criteria in cryptocurrency valuation.
In the context of an ongoing energy transition and increasingly stringent regulations, our study goes beyond merely improving the understanding of the links between environmental factors and cryptocurrency performance. It also demonstrates that integrating environmental variables significantly enhances the predictability of cryptocurrency returns. This finding highlights the necessity of adapting investment strategies to climate and regulatory developments, providing policymakers and investors with essential tools to anticipate the risks and opportunities associated with environmental shocks.
3. Research Hypotheses
This study aims to understand how environmental variables influence cryptocurrency returns. Based on this premise, we formulate the following hypotheses:
H1: Environmental variables significantly influence cryptocurrency volatility.
CO
2 emissions and temperature anomalies have a direct impact on cryptocurrency volatility.
Clark et al. (
2023) show that these environmental variables affect Bitcoin and Ethereum returns, while stablecoins remain unaffected. These findings suggest that evolving climate regulations and investor concerns about the energy transition could become drivers of volatility in cryptocurrency markets.
H2: Cryptocurrency return volatility is persistent.
Cryptocurrency volatility dynamics exhibit strong persistence, indicating that past shocks continue to affect future volatility.
Balcilar et al. (
2017) and
Bouri et al. (
2019) demonstrate that cryptocurrency volatility is marked by extreme return episodes, where causality relationships become unstable. Additionally,
Kamal and Wahlstrøm (
2023) highlight that cryptocurrencies react strongly to geopolitical shocks, reinforcing the persistent nature of their volatility.
H3: Correlations between cryptocurrencies and environmental variables evolve and are influenced by exogenous shocks.
Interdependencies between cryptocurrency returns and environmental factors are not constant over time.
Tzouvanas et al. (
2020) show that correlations between cryptocurrencies and other assets fluctuate based on market conditions. Moreover,
Naeem et al. (
2023) reveal that the impact of oil prices on cryptocurrencies depends on market regimes, suggesting that relationships between financial assets and exogenous variables shift in response to global shocks. It is therefore plausible that links between cryptocurrencies and environmental variables are also subject to temporal dynamics influenced by macroeconomic events, such as the COVID-19 crisis or climate policies.
H4: Integrating environmental variables improves cryptocurrency return forecasting.
Incorporating environmental variables into forecasting models significantly enhances the accuracy of cryptocurrency return predictions.
Xilong and Tao (
2023) and
Juwita et al. (
2023) demonstrate that adding new explanatory variables, such as trading volume or price volatility, refines forecasting models. Following this logic, integrating environmental variables could capture new sources of risk and uncertainty, improving prediction accuracy and providing a better understanding of cryptocurrency market dynamics.
By testing these hypotheses, this study contributes to the literature by highlighting the crucial role of environmental factors in cryptocurrency dynamics—both in terms of volatility and predictability—while underscoring their impact on the evolution of financial markets.
4. Data and Methodology
4.1. Data
This study examines the predictability of cryptocurrency returns based on environmental variables. We first analyze the relationship between these returns and environmental factors before exploring how these variables can be used to predict the evolution of digital assets.
Our research focuses on three major cryptocurrencies: Bitcoin (BTC), Ethereum (ETH), and Tether (USDT). This selection is based on their distinct roles within the crypto ecosystem and their widespread adoption.
Bitcoin (BTC) is often regarded as a store of value and a hedge against inflation. Nicknamed “digital gold”, it is distinguished by its programmed scarcity and its limited supply of 21 million units (
Demir et al. 2018). Its role as a safe-haven asset becomes particularly relevant during macroeconomic crises and periods of geopolitical instability.
Aysan et al. (
2019) and
Abidi and Touhami (
2024) show that Bitcoin serves as a hedge against major crises, although it remains vulnerable to moderate geopolitical tensions. Additionally,
Long et al. (
2022) introduce the concept of geopolitical beta, highlighting the sensitivity of certain cryptocurrencies, including Bitcoin, to geopolitical shocks. However, this hedging function is not systematic: according to
Balcilar et al. (
2017), the relationship between trading volume and Bitcoin returns becomes unstable under extreme market conditions, limiting its predictability.
Furthermore, environmental factors are increasingly influencing Bitcoin’s valuation.
Clark et al. (
2023) highlight that restrictions on energy-intensive mining activities have directly impacted miners’ profitability and, consequently, Bitcoin’s price. These regulatory developments could redefine its role as a store of value.
Ethereum (ETH), on the other hand, is the cornerstone of decentralized finance (DeFi) and smart contracts. Unlike Bitcoin, which is primarily used as a speculative asset or store of value, Ethereum has been increasingly adopted by institutions due to its technological utility (
Bouri et al. 2019).
Xilong and Tao (
2023) demonstrate that the evolution of the cryptocurrency market is heavily dependent on the development of DeFi applications, in which Ethereum plays a central role. However, Ethereum is also exposed to various external factors, including environmental ones.
Clark et al. (
2023) indicate that CO
2 emissions and temperature anomalies have a significant impact on its volatility, unlike stablecoins such as Tether.
Tether (USDT), as a stablecoin pegged to USD, has a different risk profile. Unlike Bitcoin and Ethereum, which experience significant price fluctuations, Tether is designed to maintain parity with the dollar, making it less sensitive to traditional macroeconomic factors.
Balcilar et al. (
2017) and
Bouri et al. (
2019) confirm that Tether’s volatility is significantly lower than that of unpegged cryptocurrencies, making it a preferred tool for liquidity management in the crypto-financial ecosystem. However, its stability is largely dependent on investor confidence in its reserves and the evolution of financial regulations. Unlike Bitcoin and Ethereum, Tether is not directly affected by CO
2 emissions or temperature variations (
Clark et al. 2023). However, it remains exposed to regulatory scrutiny on stablecoins and investigations into the transparency of its reserves.
During periods of uncertainty, investors tend to favor Tether as a safeguard against the volatility of other cryptocurrencies (
Juwita et al. 2023).
Kamal and Wahlstrøm (
2023) note that during the Russia–Ukraine conflict in 2022, demand for stablecoins surged, confirming their role as a refuge in unstable environments. Finally,
Naeem et al. (
2023) suggest that the influence of stablecoins on the cryptocurrency market largely depends on macroeconomic conditions and liquidity cycles.
Our analysis includes two key environmental variables: carbon emissions and temperature anomalies, which are playing an increasingly significant role in financial markets and influencing regulatory decisions.
Carbon emissions are directly linked to cryptocurrency mining activities, particularly for blockchains using the Proof-of-Work (PoW) mechanism, such as Bitcoin. This process is highly energy-intensive and has been subject to increasing scrutiny due to its environmental impact (
Bouri et al. 2021).
Clark et al. (
2023) show that rising CO
2 emissions from mining not only affect investor perception but also influence regulations and financial institutions’ decisions. Their study reveals that periods of high carbon intensity are often associated with increased Bitcoin volatility, driven by regulatory uncertainties and ESG pressures on institutional portfolios.
Temperature anomalies, meanwhile, can affect mining efficiency, energy costs, and regulatory decisions, indirectly influencing investor sentiment and cryptocurrency price dynamics (
Jia et al. 2022).
Clark et al. (
2023) demonstrate that extreme temperatures, particularly heat waves, reduce the efficiency of mining farms and increase operational costs, sometimes leading to temporary network disruptions. These disturbances impact available computing power (hash rate), resulting in increased volatility and short-term price adjustments in the cryptocurrency market.
The study covers the period from 5 January 2017 to 2 October 2023, encompassing several critical phases of the cryptocurrency market. This period allows for the integration of the effects of various global events, including the COVID-19 pandemic, which profoundly impacted financial markets and altered risk perception, as well as the Russia–Ukraine conflict, which affected macroeconomic stability and influenced capital flows into digital assets. It also coincides with the growing institutional adoption of cryptocurrencies and the rise of ESG (Environmental, Social, and Governance) criteria in investment decisions related to digital assets.
The data used in this study are of daily frequency, providing a detailed analysis of cryptocurrency return variations in response to environmental fluctuations. Specifically, environmental variables are sourced from the
gml.noaa.gov database (accessed on 3 May 2024), while cryptocurrency return data are obtained from
Investing.com (accessed on 4 May 2024).
4.2. Methodology
To study the connectivity between cryptocurrency returns and environmental variables, we employ the DCC-GARCH model, which allows for the analysis of dynamic correlation over time. The Dynamic Conditional Correlation GARCH (DCC-GARCH) approach enables simultaneous modeling of the conditional variances and correlations of multiple time series. Introduced by
Engle (
2002), this model addresses the limitations of the Constant Conditional Correlation GARCH (CCC-GARCH) model, where the matrix of conditional correlations R remains constant. In contrast, the DCC-GARCH model allows this matrix to become dynamic, providing a more precise and adaptable representation of correlations over time:
The conditional variance-covariance matrix H
t is decomposed into two matrices: the diagonal matrix D
t of standard deviations and the matrix R
t of conditional correlations, both of which vary over time.
The conditional variance-covariance matrix Ht must be positive definite, which requires ensuring the positivity of Dt and Rt. Indeed, the matrix Dt is always positive because :).
However, the matrix
Rt, which must lie between 0 and 1, varies over time and can be decomposed into two matrices:
where:
Qt is a symmetric and positive definite matrix of dimension N × N times;
The unconditional covariance of standardized residuals obtained from univariate GARCH models;
α and β are parameters to be estimated, and their sum must be less than one to ensure the positivity of matrix Qt.
To ensure that the matrix Ht is positive definite, it is required that ≥ 0; ≥ 0 et + < 1.
To assess the predictive power of environmental variables on future cryptocurrency returns, we adopted the Time-Varying Coefficients Vector Autoregression (TVC-VAR) model. This model extends the traditional Vector Autoregression (VAR) by allowing coefficients to vary over time, capturing the changing dynamics of relationships between variables, which enhances forecast accuracy compared to a standard VAR model. Empirically, the TVC-VAR model accommodates time-varying coefficients, providing a more realistic representation of temporal relationships. This flexible model is therefore better suited to capture the evolving links between environmental factors and cryptocurrency returns. The model is defined as follows:
where ε
t is a Gaussian white noise with zero mean, and the time-varying covariance matrix is denoted as Σ
t.
Let
, and
, where
denotes the column stacking operator. We assume that
where
ωt is Gaussian white noise with zero mean and covariance.
Let
, where
is lower triangular,
is a diagonal matrix,
is the vector of diagonal elements of
, and
, is the column vector formed by the non-zero elements of the (
i + 1)-th row of
. We assume that
where
ξt and
ψi are Gaussian white noises with zero mean and covariance matrices.
Let where ψ is the covariance matrix of ψt.
We assume that ψi,t is independent of ψj,t for j ≠ i, and that ξ t, ψt, ωt, and εt are mutually uncorrelated at all leads and lags.
However, while the TVC-VAR model is a powerful tool for capturing the evolution of relationships between variables, its application requires careful attention to model specification, the management of overfitting risk, and data availability. The dynamic estimation of coefficients increases the model’s complexity, necessitating a substantial volume of data to ensure the robustness of the results. Furthermore, the model’s flexibility can lead to overfitting, as it may capture noise rather than reflecting fundamental economic relationships, thus limiting its generalizability. Nonetheless, the TVC-VAR model remains particularly well-suited for periods of crises and structural transitions, as it tracks the gradual evolution of relationships between variables. Unlike fixed-coefficient models, it adapts to new market dynamics, especially in response to sudden shocks, by continuously updating its estimates based on newly available information.
5. Empirical Results and Discussion
5.1. Descriptive Statistics
Table 1 presents the descriptive statistics of the returns for Bitcoin, Ethereum, and Tether, as well as the environmental variables CO
2 emissions and temperature anomalies. These statistics reveal important characteristics about the dynamics of these assets and factors. The average returns for Bitcoin (0.129) and Ethereum (0.203) indicate upward trends over the study period, while Tether’s nearly zero average (0.0004) reflects its expected stability. The means of CO
2 emissions (0.000023) and temperature anomalies (0.364) provide insight into average environmental trends, suggesting their potential impact on cryptocurrency returns.
The maximum and minimum values show high volatility for Bitcoin (22.760 and −49.727) and Ethereum (25.859 and −58.963), implying significant risks but also opportunities for substantial gains. Tether, with values of 9.531 and −9.531, maintains lower volatility, consistent with its role as a stablecoin. The environmental variables exhibit more modest variations, illustrating their relative stability. The standard deviations confirm the marked volatility of Bitcoin (3.981) and Ethereum (5.276) compared to Tether (0.421). The low standard deviations for CO2 emissions (0.000210) and temperature anomalies (0.152) indicate their relative constancy.
Negative skewness coefficients for all series signal leftward asymmetry, meaning that extreme losses are more likely than extreme gains. High kurtosis values for Bitcoin (12.653) and Ethereum (9.604) suggest leptokurtic distributions, characterized by an increased frequency of extreme events. Tether’s exceptionally high kurtosis (248.562) reflects rare but significant volatility. The kurtosis of the environmental variables, close to zero, indicates relatively normal distributions.
The Jarque–Bera tests, with significant probabilities (p < 0.001), confirm the non-normality of the returns. The results of the Ljung–Box (Q2) tests show significant autocorrelations, and the ARCH tests reveal pronounced heteroskedasticity, indicating the presence of volatility clusters.
These statistics indicate that cryptocurrencies like Bitcoin and Ethereum offer both high opportunities and high risks, necessitating robust risk management strategies. The strong potential correlation between environmental factors and cryptocurrency returns, suggested by these descriptive statistics, will be further explored using the DCC-GARCH method to analyze dynamic correlations and the TVC-VAR model for return forecasting. These analyses will provide a deeper understanding of the impact of environmental variables on the returns of crypto assets and help develop more accurate and adaptive predictive models.
Table 2, which presents the unit root tests (ADF and PP), shows significant results for all variables across different specification levels (without trend or constant, with constant, with constant and trend). For Bitcoin, Ethereum, and Tether, the test statistic values are extremely negative, and the associated probabilities are close to zero, indicating that these series are stationary and do not contain a unit root. The ADF test values for Bitcoin are −51.774, −51.825, and −51.862, respectively, while the PP tests yield very similar results. Ethereum exhibits similar results, with ADF test values of −51.956, −52.029, and −52.099, and nearly identical PP values.
For Tether, although the ADF test values (ranging from −12.744 to −12.769) indicate stationarity, the PP values are even more extreme (−79.394 to −79.388), further reinforcing the absence of a unit root. Regarding the environmental variables, CO2 emissions show significant ADF and PP test values, ranging from −3.8 to −4.0, also confirming the stationarity of this series. In contrast, temperature anomalies show stationarity only when a constant and trend are present, with significant test values ranging from −6.770 to −7.458.
5.2. Empirical Analysis
5.2.1. Results of the DCC-GARCH Model Estimation
Table 3 presents the results from the DCC-GARCH (1,1) model estimation for Bitcoin, CO
2 emissions, and temperature anomalies. This model captures the conditional dynamics of variance and correlation among these variables. In the mean equation (Panel A), the constants for Bitcoin, CO
2 emissions, and temperature anomalies are 0.172, 0.000, and 0.381, respectively, with statistically significant t-statistics at different levels. This indicates that, on average, Bitcoin and temperature anomalies have a significant positive mean component, while the constant coefficient for CO
2 is statistically significant but close to zero.
In the variance equation (Panel B), the constants for Bitcoin, CO2, and temperature anomalies are 0.862, 0.000, and 0.001, respectively, and all are significant. The ARCH (α) coefficients for Bitcoin, CO2, and temperature anomalies are 0.118, 0.050, and 0.967, respectively, indicating that past shocks significantly influence present volatility for all variables. The GARCH (β) coefficients for Bitcoin and CO2 are 0.836 and 0.899, respectively, both significant, suggesting strong volatility persistence. For temperature anomalies, the GARCH coefficient is insignificant, possibly indicating different volatility dynamics compared to Bitcoin and CO2. The sum of α + β is close to 1 for all variables (0.954 for Bitcoin, 0.949 for CO2, and 0.967 for temperature anomalies), confirming strong volatility persistence.
In the dynamic conditional correlation section (Panel C), the coefficients A and B in the dynamic conditional correlation equation are 0.132 and 0.794, respectively, both significant. This indicates that conditional correlations vary significantly over time and are influenced by past shocks and previous correlations. Diagnostic tests on the residuals (Panel D) show that the Q-statistic for Bitcoin is 25.159 (not significant), but there are very high values for CO2 and temperature anomalies (both significant). This suggests no significant autocorrelation in the residuals for Bitcoin but significant autocorrelation for CO2 and temperature anomalies, indicating dependencies not captured by the model for these two series.
In line with the findings of
Imran et al. (
2023) and
Daxiang and Yu (
2023), the results of this study show that environmental variables, particularly CO
2 emissions and temperature anomalies, significantly influence the volatility and dynamics of Bitcoin returns. The strong volatility persistence (α + β close to 1) across all series studied emphasizes the importance of accurate modeling for forecasting. Furthermore, Bitcoin returns exhibit persistent volatility and significant sensitivity to past shocks, typical of high-risk financial assets. The strong dynamic conditional correlation between Bitcoin, CO
2 emissions, and temperature anomalies suggests that environmental variables significantly impact Bitcoin returns. Thus, the results from the DCC-GARCH model highlight the significant interconnectedness between Bitcoin returns and environmental variables, paving the way for more robust and informed forecasts of cryptocurrency returns based on environmental conditions.
In
Table 4, Panel A reveals a strong correlation between Ethereum returns and temperature anomalies, with significant coefficients. These coefficients highlight the impact of environmental variables on cryptocurrency returns, suggesting that fluctuations in these factors can influence digital asset prices. As emphasized by
El Ouadghiri et al. (
2021), this growing awareness of environmental factors could foster increased environmental consciousness among certain investors, encouraging them to develop preferences for sustainable investments.
In Panel B, the results of the variance equation show significant coefficients for Ethereum and CO
2 in the ARCH terms (α), indicating considerable conditional volatility associated with these variables. Financially, and consistent with the findings of
Huang et al. (
2019) and
Khalfaoui et al. (
2022), this suggests that changes in CO
2 levels and environmental anomalies can affect Ethereum return volatility, influencing risk management strategies and investor decision-making.
Additionally, in Panel C, the dynamic conditional correlation between variables reveals significant relationships between Ethereum and CO2, demonstrating their joint responsiveness to environmental changes. Econometrically, this suggests a strong interconnection between Ethereum returns and CO2 levels, reinforcing the importance of integrating environmental factors into models of cryptocurrency returns.
Finally, Panel D presents the results of diagnostic tests on residuals, confirming the relevance and robustness of the proposed model. These findings offer valuable econometric insights into how environmental variables influence cryptocurrency returns, providing useful financial guidance for investors and decision-makers in managing risks associated with digital assets in an evolving environmental landscape.
Additionally, the results presented in
Table 5, Panel A indicates that the coefficient for CO
2 is highly significant (34.586), suggesting a strong influence of this variable on the mean. Similarly, the coefficient for temperature anomalies is significant (71.936), highlighting its substantial effect on the mean. In the variance equation, the constant for temperature anomalies is significant, indicating its influence on the volatility. The ARCH and GARCH coefficients reveal the presence of autocorrelation and persistent volatility in the residuals, confirming the dynamic nature of these variables. Moreover, the dynamic conditional correlation between the variables is significant, affirming their interdependence. Diagnostic tests on the residuals show significant autocorrelation, further emphasizing the importance of incorporating environmental factors into models of cryptocurrency returns. Overall, these results underline the critical role that CO
2 emissions and temperature anomalies play in influencing cryptocurrency returns, while also illustrating the complex interactions between these environmental variables in the cryptocurrency market context.
5.2.2. Results and Interpretations of the TVC-VAR Model
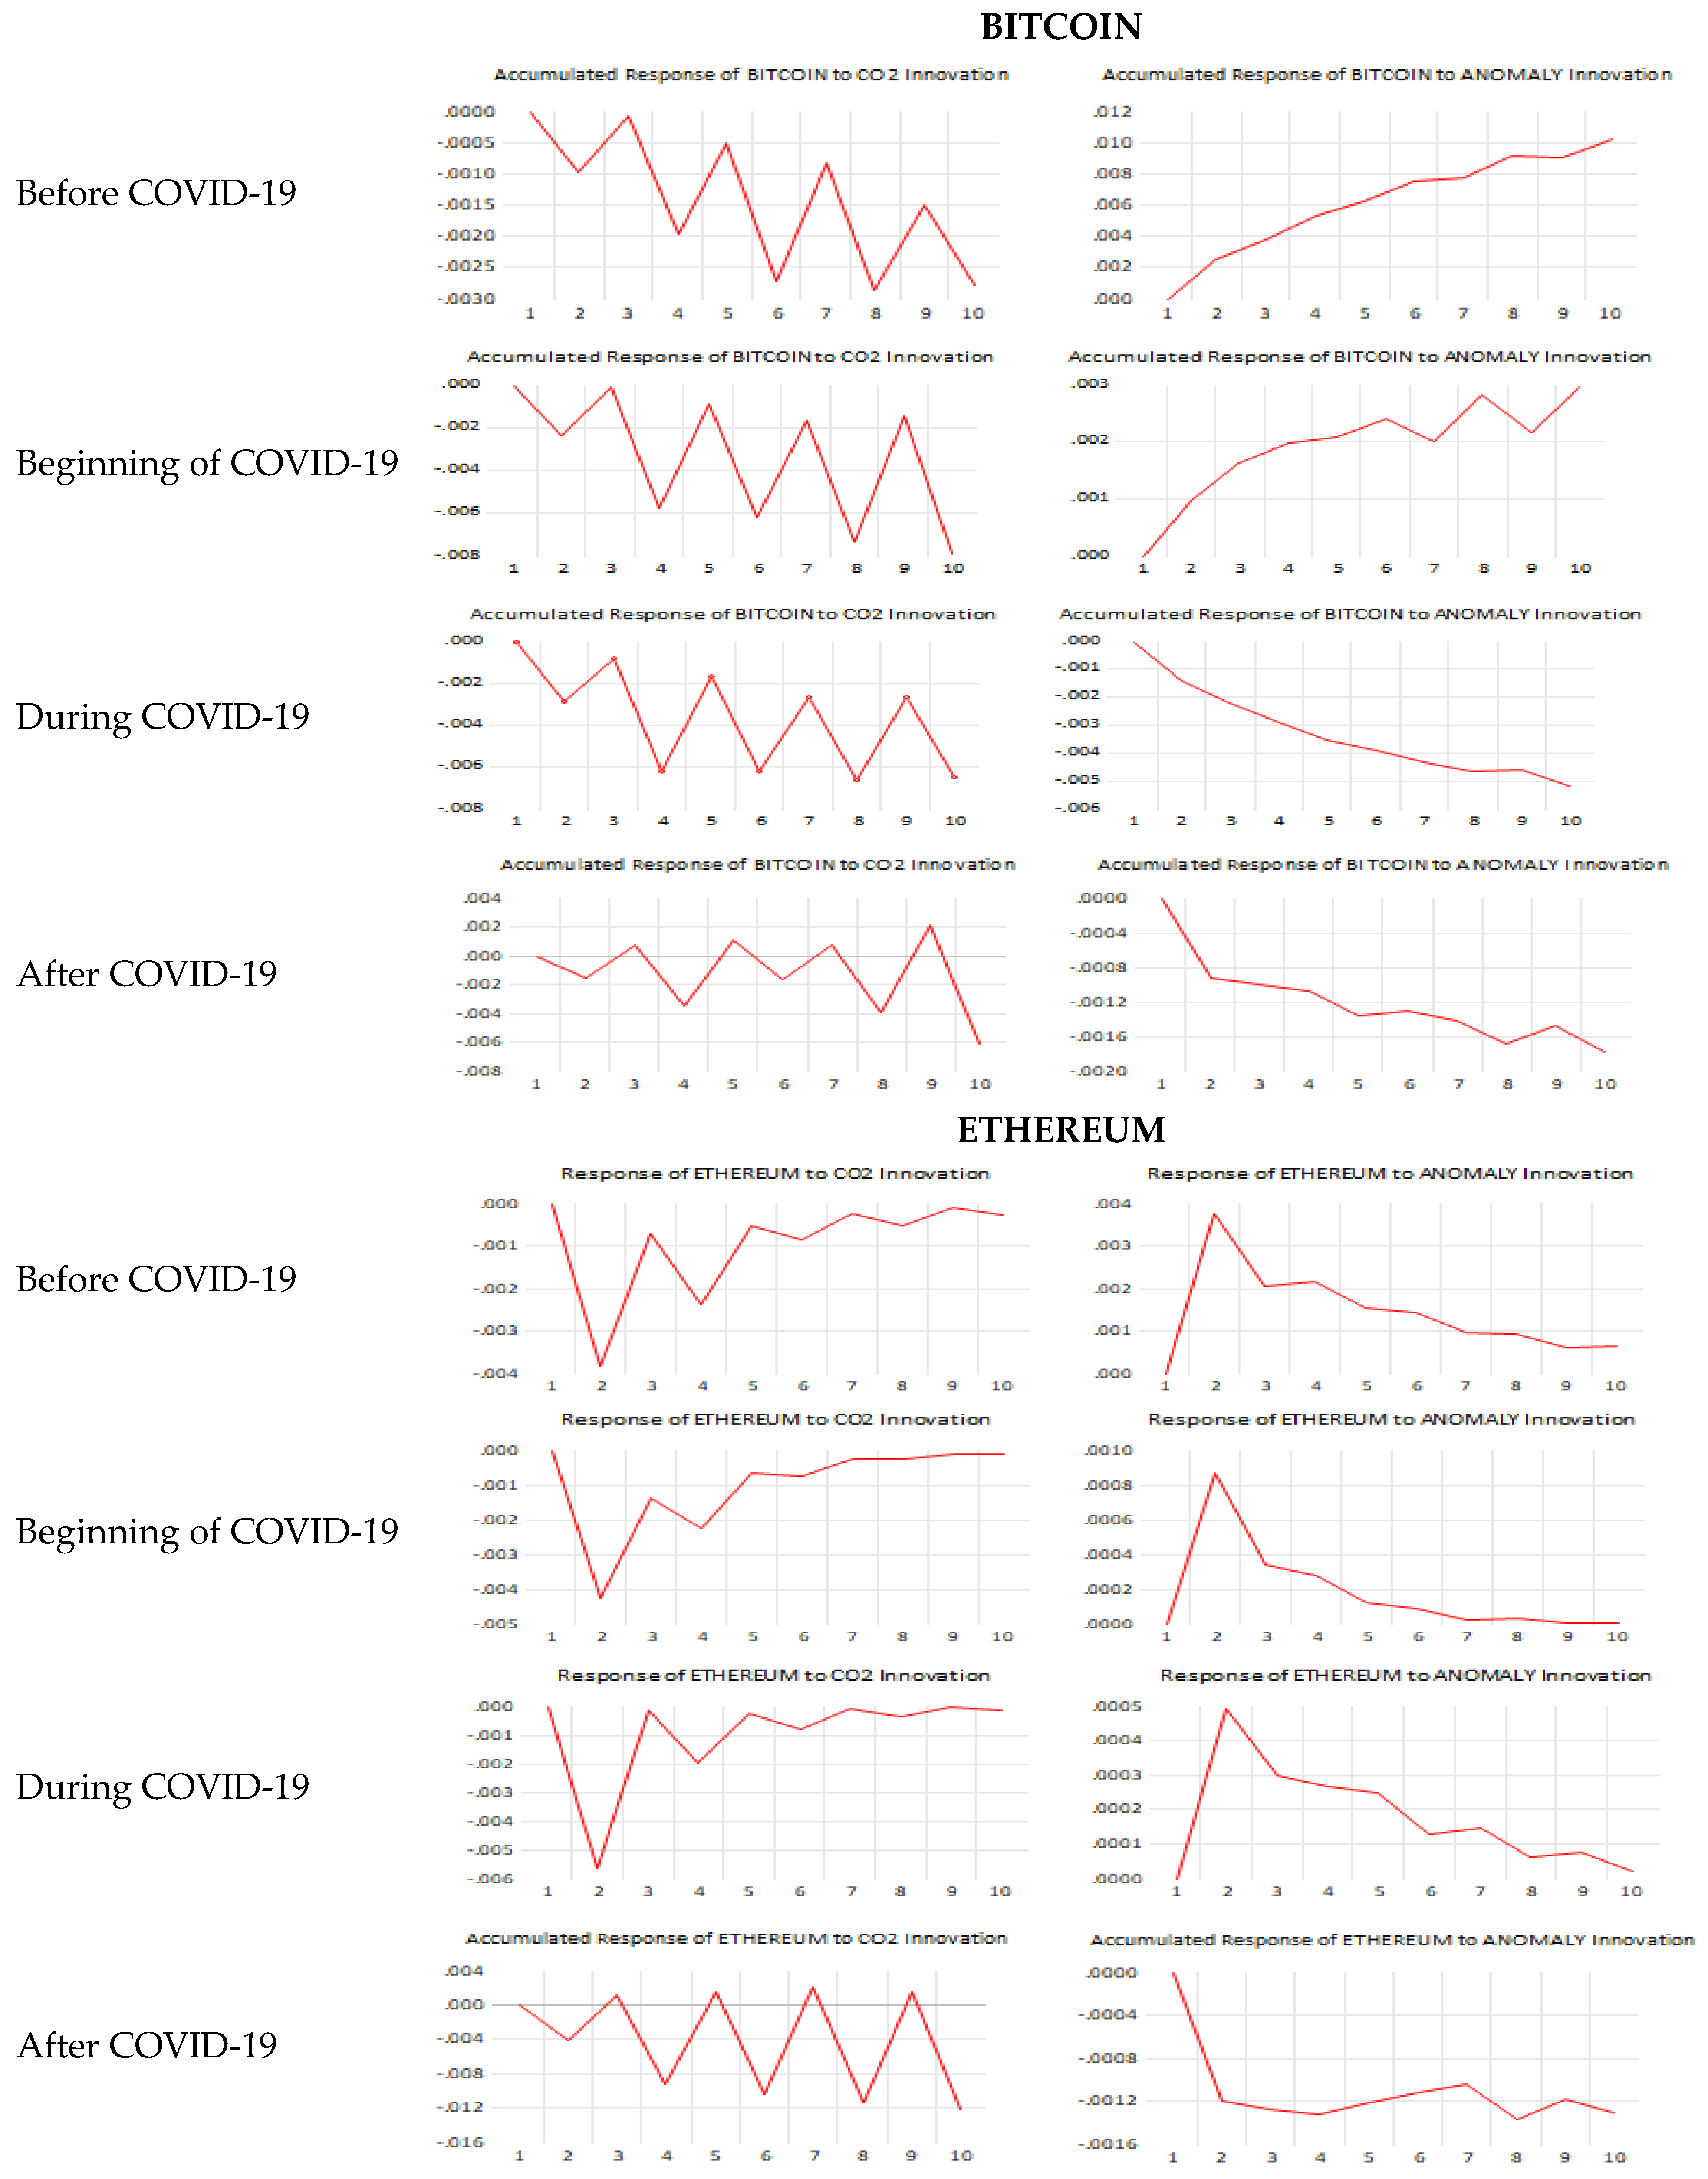
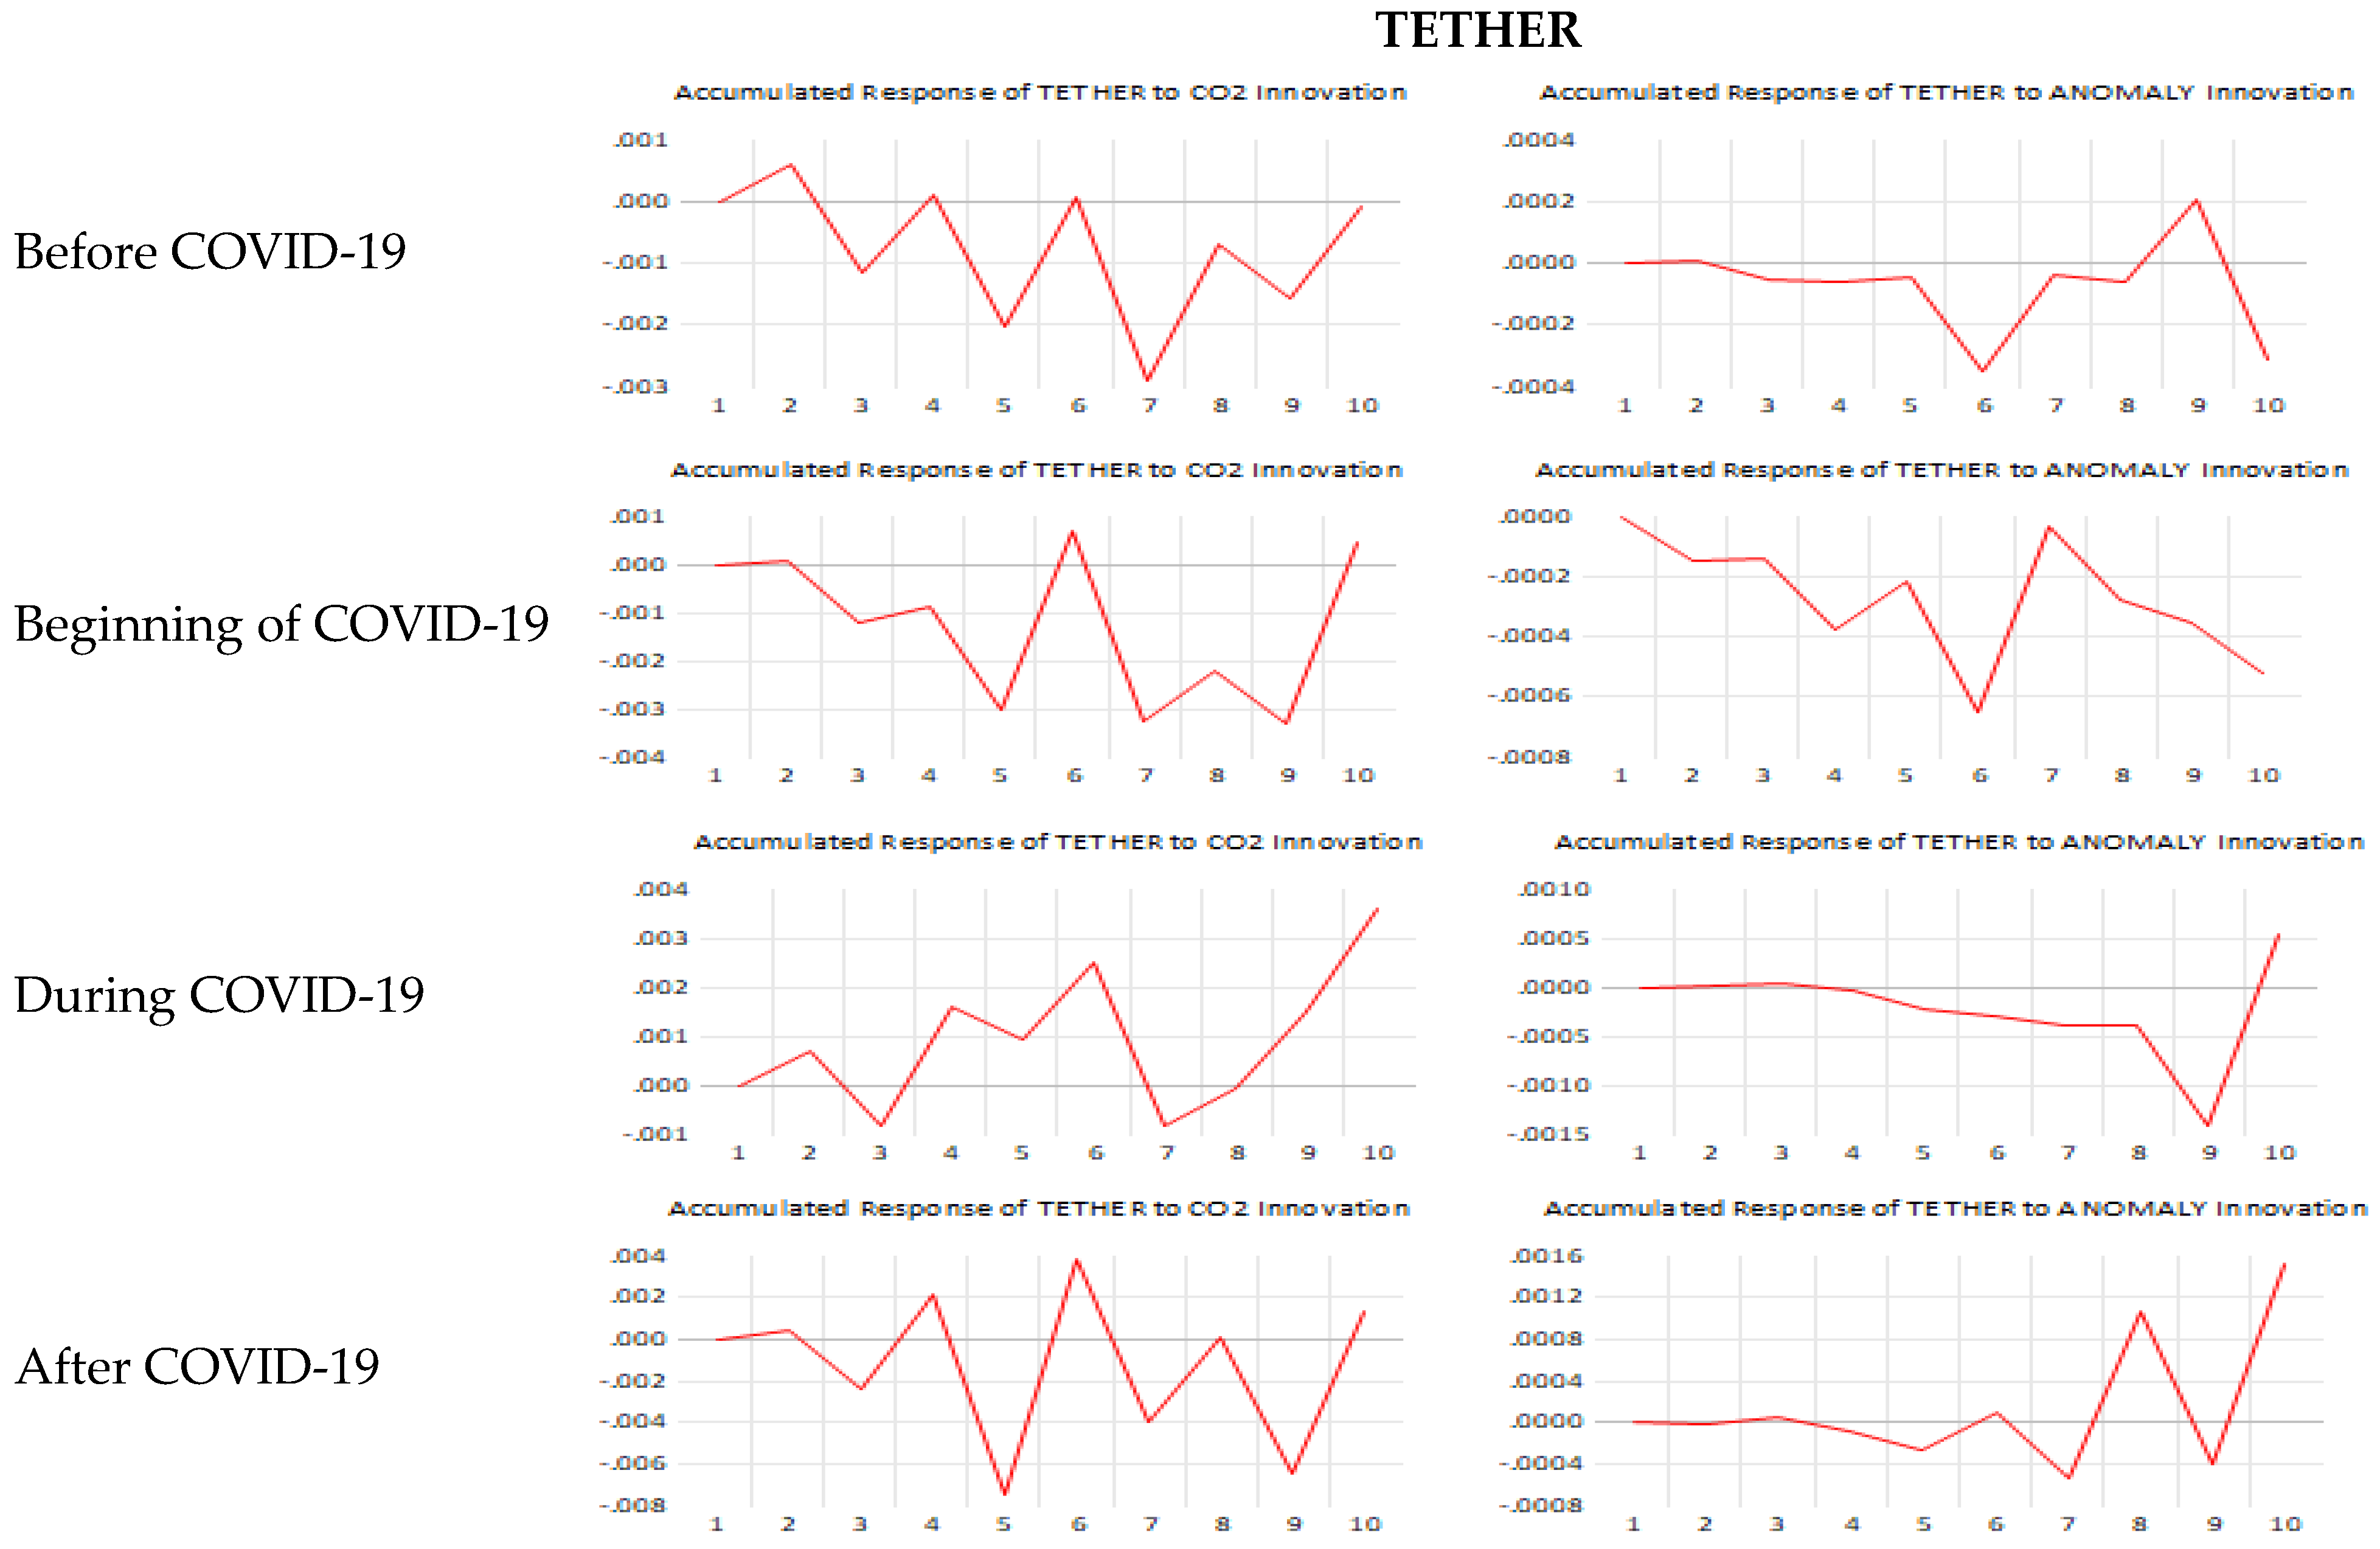
The charts in
Figure 1, which analyze the impact of environmental factors on cryptocurrency returns—specifically Bitcoin, Ethereum, and Tether—before, during, and after the COVID-19 crisis, reveal complex and varied dynamics.
Before the crisis, Bitcoin returns exhibited a cumulative negative response to CO2 emissions, reaching approximately −0.0025 by period 10, indicating a negative impact. In contrast, temperature anomalies had a growing positive effect, reaching about 0.011, highlighting Bitcoin’s sensitivity to these variables. As the pandemic began, this trend persisted, with a more pronounced negative response to CO2 emissions (−0.0075) and a lesser positive effect from temperature anomalies (0.0025). However, during the crisis, both environmental factors negatively influenced Bitcoin, reaching approximately −0.006, showing an increased sensitivity to environmental disruptions. After the pandemic, the effects of CO2 emissions and temperature anomalies fluctuated but remained generally negative, underscoring the ongoing importance of these variables for Bitcoin investors.
Ethereum displayed less pronounced responses before the pandemic, with fluctuations in returns due to CO2 emissions ranging from +0.3% to −0.4% and a stronger influence from temperature anomalies, reaching −0.3%. This influence intensified at the onset of the pandemic, with responses ranging from +0.2% to −0.5% for CO2 emissions and a continued decline to −0.8% for temperature anomalies. During the crisis, Ethereum returns reacted similarly but more intensely to these factors. After the pandemic, the effect of CO2 emissions slightly diminished, ranging from +0.2% to −0.15%, while sensitivity to temperature anomalies gradually decreased, returning closer to zero.
Tether showed moderate sensitivity to environmental factors before the pandemic, with return variations between +0.05% and −0.05% for CO2 emissions and minimal impact from temperature anomalies. As the pandemic began, this sensitivity increased, with cumulative declines reaching −0.2% for CO2 emissions and −0.009% for temperature anomalies. During the pandemic, the influence remained high but slightly attenuated, with responses reaching +0.003% for CO2 and +0.008% for temperature anomalies. After the pandemic, Tether continued to exhibit significant sensitivity to CO2 emissions (+0.003%) and temperature anomalies (+0.004%), although this sensitivity was lower compared to the crisis period.
These analyses highlight the critical importance of environmental variables in determining cryptocurrency returns, emphasizing the need for investors and analysts to incorporate these factors into their forecasting models.
Table 6 presents the performance measures of cryptocurrency return forecasts for Bitcoin, Ethereum, and Tether, obtained from the Time-Varying Coefficient Vector Autoregression (TVC-VAR) model. This model was specifically designed to assess the predictability of cryptocurrency returns while incorporating environmental variables, notably CO
2 emissions and temperature anomalies. The performance measures include the Root Mean Squared Error (RMSE), Mean Absolute Error (MAE), and Theil’s U-statistic, providing a comprehensive comparison of forecast accuracy for each cryptocurrency.
For Bitcoin, the RMSE is 0.051, indicating a low average squared difference between predicted and actual values, which suggests good forecast accuracy by the TVC-VAR model. The MAE, which measures the average absolute forecast error, is 0.041, further confirming satisfactory model performance. The Theil coefficient is 0.72, which is less than 1, indicating that the TVC-VAR model outperforms a naive forecast and highlighting its effectiveness in predicting Bitcoin returns by integrating environmental variables.
For Ethereum, the results show an RMSE of 0.059 and an MAE of 0.043, slightly higher than Bitcoin’s, but still acceptable. The Theil coefficient for Ethereum is 0.75, also below 1, demonstrating that the TVC-VAR model provides forecasts superior to those from a simple reference model. This indicates that the model effectively captures Ethereum return variations based on environmental variables, further emphasizing their importance in forecasting.
Regarding Tether, performance measures show an RMSE of 0.006 and an MAE of 0.005, much lower than for Bitcoin and Ethereum, reflecting Tether’s nature as a stablecoin and its lower volatility. Theil’s U-statistic for Tether is 0.78, slightly higher than for the other cryptocurrencies but still below 1, suggesting that even for a less volatile cryptocurrency, the TVC-VAR model provides more accurate forecasts than a naive prediction.
Overall, consistent with
Clark et al. (
2023), this study highlights the critical role of environmental variables, such as CO
2 emissions and temperature anomalies, in cryptocurrency return predictability. The TVC-VAR model proves to be an effective tool for integrating these environmental factors into return forecasts, offering reliable predictions for investors and financial analysts. By incorporating these forecasts into investment strategies, investors can better account for the environmental influences shaping the cryptocurrency market. Integrating environmental variables into forecasting models marks a significant advancement in understanding and anticipating cryptocurrency movements, empowering investors to make more informed and proactive decisions. By enriching traditional financial models with environmental factors, investors can enhance their ability to predict returns and manage risks in response to global environmental changes.
5.3. Discussion of Hypotheses and Validation of Results
The empirical results obtained from the estimation of the DCC-GARCH (1,1) model and the TVC-VAR model allow us to assess the validity of the hypotheses formulated in this study.
First, Hypothesis H1, which states that environmental variables significantly influence cryptocurrency volatility, is strongly supported. The DCC-GARCH model results reveal that CO
2 emissions and temperature anomalies have a significant impact on the conditional variance of Bitcoin and Ethereum returns. The importance of the estimated ARCH and GARCH coefficients for these cryptocurrencies highlights the effect of past environmental shocks on future volatility. Furthermore, the strong conditional correlation dynamics indicate that these variables are not merely external factors but are deeply integrated into the pricing dynamics of cryptocurrencies. In contrast, Tether, as a stablecoin, exhibits lower sensitivity to environmental fluctuations, which is consistent with the findings of
Clark et al. (
2023), who suggest that asset-backed cryptocurrencies are less affected by environmental factors.
Hypothesis H2, which posits the persistence of cryptocurrency return volatility, is also validated. The α and β coefficients of the DCC-GARCH model for Bitcoin and Ethereum are close to 1, confirming a high degree of volatility persistence. These results align with the findings of
Balcilar et al. (
2017) and
Bouri et al. (
2019), who demonstrate that cryptocurrency volatility exhibits long-memory characteristics, typical of financial assets subject to high speculation and sensitivity to exogenous events. Moreover, the TVC-VAR model highlights the differentiated impact of environmental shocks before, during, and after the COVID-19 crisis, illustrating the dynamic nature of this volatility in response to global disruptions.
Regarding Hypothesis H3, which suggests that correlations between cryptocurrencies and environmental variables evolve in response to exogenous shocks, the model results support this proposition. The DCC-GARCH coefficients indicate that the conditional correlation between cryptocurrency returns and environmental variables fluctuates over time, influenced by macroeconomic events and shocks. Impulse response analysis using the Monte Carlo method shows that the impact of environmental variables on Bitcoin, Ethereum, and Tether has changed across different phases of the pandemic, confirming the non-stationary nature of these relationships. These findings corroborate the work of
Tzouvanas et al. (
2020) and
Naeem et al. (
2023), who demonstrate that the relationship between cryptocurrencies and other exogenous factors varies depending on economic cycles and market regimes.
Finally, Hypothesis H4, which states that incorporating environmental variables improves cryptocurrency return forecasting, is confirmed by the performance of the TVC-VAR model. The low RMSE and MAE values obtained in Bitcoin, Ethereum, and Tether return forecasts indicate that the inclusion of environmental variables enhances prediction accuracy. The improved forecasting performance due to these variables is consistent with the conclusions of
Xilong and Tao (
2023) and
Juwita et al. (
2023), who emphasize the importance of enriching financial models with relevant exogenous factors. These results suggest that integrating environmental data into forecasting models could serve as a strategic tool for investors seeking to anticipate cryptocurrency market dynamics.
Overall, the findings validate the study’s hypotheses and reinforce the idea that environmental factors play a central role in cryptocurrency dynamics. These conclusions open new avenues for research in green finance and risk management related to digital assets, highlighting the importance of considering environmental issues in the analysis and forecasting of emerging financial markets.
6. Conclusions
The environmental impact of cryptocurrency mining is an increasing concern, with empirical studies highlighting the negative externalities associated with blockchain technology. In this context, our research examines whether environmental factors, particularly CO2 emissions and temperature anomalies, play a significant role in the predictability of cryptocurrency returns. Unlike previous studies that primarily focused on macroeconomic determinants such as economic policy uncertainty and geopolitical risk, our study takes an innovative approach by integrating the environmental dimension into the analysis of cryptocurrency return volatility and dynamics.
Our empirical findings indicate that environmental variables significantly influence cryptocurrency price fluctuations, with effects varying across time periods and assets. Estimating the DCC-GARCH model reveals strong dynamic conditional correlations between cryptocurrency returns and environmental factors, notably between Bitcoin and temperature anomalies. Ethereum exhibits a significant correlation with CO2 emissions, while Tether remains particularly sensitive to both environmental factors. These results suggest that environmental variables should not be overlooked in modeling cryptocurrency market behavior.
Furthermore, the TVC-VAR model highlights the evolving nature of the relationship between environmental factors and cryptocurrency returns. Before the COVID-19 pandemic, Bitcoin responded negatively to CO2 emissions and positively to temperature anomalies. However, during and after the pandemic—including the Russo-Ukrainian war—the impact of environmental variables on cryptocurrency returns intensified. These findings underscore the dynamic and changing nature of environmental influence on digital assets, reinforcing their importance in return forecasting models.
This study makes several key contributions to the literature on cryptocurrency market dynamics. First, it broadens the scope of research on return predictability by incorporating environmental factors, an area that remains underexplored. Second, it employs advanced econometric models, specifically DCC-GARCH and TVC-VAR, to capture the dynamic relationships between cryptocurrency returns and environmental indicators, providing a more flexible and precise analytical framework than the static models used in previous studies. Finally, this research highlights the heterogeneous impact of environmental variables across different cryptocurrencies, offering insights into how various digital assets respond to environmental shocks.
The results of this study have important implications for both academia and financial market professionals. For the academic field, this research challenges the traditional view that cryptocurrency volatility is primarily driven by macroeconomic and financial factors. By demonstrating that environmental variables also play a crucial role, this study opens new avenues for research on the interaction between environmental sustainability and digital finance.
For investors and financial analysts, these findings suggest that integrating environmental variables into risk management models could enhance portfolio optimization strategies. Cryptocurrency traders could leverage environmental trend monitoring to anticipate market fluctuations. Furthermore, policymakers and regulators should consider these results when designing regulatory frameworks to promote more sustainable mining practices, as excessive energy consumption and carbon emissions could pose future regulatory risks.
Based on these findings, several energy policy recommendations can be formulated to limit the environmental impact of cryptocurrency mining and promote a more sustainable ecosystem. Governments and financial institutions should implement tax incentives and subsidies to encourage the use of green energy in the mining industry. Initiatives such as harnessing solar, wind, or hydroelectric energy for mining farms could significantly reduce the carbon footprint of cryptocurrencies. The adoption of environmental standards to regulate cryptocurrency mining energy consumption could be a viable solution. For instance, requiring energy certifications for mining companies could limit the use of fossil fuels and encourage more environmentally friendly practices. Governments and industry players should also invest in developing more energy-efficient blockchain technologies. Solutions such as transitioning from Proof-of-Work (PoW) to Proof-of-Stake (PoS), recently adopted by Ethereum, demonstrate that performance and sustainability can be reconciled.
A fundamental question for further research concerns the true source of cryptocurrencies’ environmental impact: are CO2 emissions the primary driver of these digital assets’ returns, or is it rather an effect linked to energy inefficiency and the lack of “green” energy sources in countries where cryptocurrencies are widely used?
In other words, if the energy used for mining and transactions were entirely renewable, would cryptocurrencies still be influenced by their CO2 emissions? Or are they affected simply because they are predominantly mined and traded in countries where fossil fuels dominate? This question underscores the need for future research on the geography of cryptocurrency mining and its influence on volatility and profitability.
While this study makes significant contributions, it has certain limitations. A primary limitation is that only two environmental variables (CO2 emissions and temperature anomalies) were considered, whereas other sustainability-related factors, such as the adoption of renewable energy in mining operations, remain unexplored. Future research could incorporate additional environmental indicators to refine our understanding of their influence on cryptocurrency returns.
Another limitation is that our study is restricted to three cryptocurrencies (Bitcoin, Ethereum, and Tether). Expanding the analysis to a broader set of digital assets, including emerging altcoins, would provide deeper insights into the heterogeneity of environmental effects across different blockchain ecosystems.
Future research should explore the implications of renewable energy sources on cryptocurrency stability and examine how a sustainable energy transition could influence investor perceptions and industry regulations. The ultimate goal is to ensure the sustainable development of cryptocurrencies while maximizing their economic and technological potential.


