Article

The Economic and Financial Health of Lithuanian Logistics Companies

by
Rita Bužinskienė
1 and
Vera Gelashvili
2,*
1
Faculty of Business and Technology, Šiauliai State Higher Education Institution, Aušros Ave. 40, LT-76241 Šiauliai, Lithuania
2
Department of Business Economics, Faculty of Economics and Business Sciences, Rey Juan Carlos University, Paseo de los Artilleros s/n, 28032 Madrid, Spain
*
Author to whom correspondence should be addressed.
Risks 2024, 12(6), 99; https://doi.org/10.3390/risks12060099
Submission received: 30 April 2024 / Revised: 5 June 2024 / Accepted: 11 June 2024 / Published: 19 June 2024

Abstract

:
In recent decades, the importance of transport and logistics companies has increased considerably, especially for Lithuania, where this sector is on the rise and creating benefits for various users. Therefore, this study aims to analyse the economic–financial situation of transport and logistics companies operating in Lithuania, focusing mainly on their financial risk, probability of bankruptcy, and level of solvency. To achieve these results, 416 companies were analysed based on their data from 2022. The employed methodology included descriptive analysis, quartile ratio analysis, the use of Altman’s Z-score model to predict bankruptcy, and, finally, logistic regression analysis to answer the hypotheses. The results show that the companies analysed in this study were highly profitable, with a high level of solvency and liquidity that did not compromise their continuity in the market. These results were confirmed by the Z-score analysis. In addition, it was observed that the age and size of the companies did not affect their survival on the market. This study presents results that are of great interest for the academic literature, as well as for the management of logistics companies. The originality of the study lies in its relevance and timeliness, presenting robust results for different stakeholders, such as policymakers or new entrepreneurs, among others.

1. Introduction

The global logistics sector has witnessed significant growth, with logistics emerging as a critical component of the business economic system and a major driver of global economic activity. A key determinant of a nation’s competitiveness and employment potential is its level of logistics efficiency. To enhance their logistics performance, countries should prioritise improving the quality of their port and railroad infrastructure (Erkan 2014). Logistics companies have an important role in coordinating the transfer of resources and goods from one location to another and are involved in various significant tasks, such as packaging, warehousing, and shipping. A well-thought-out logistics plan is essential for any successful company to ensure the timely and intact delivery of its products to clients. Logistics efficiency is indispensable for any company to attain a competitive edge in the marketplace and increase profit. Collaboration among all supply chain participants can enhance organisational competitiveness, ensure that end consumers receive value for their money, and reduce the industry’s level of unpredictability (Francis and Waiganjo 2014). Logistics encompasses the segment of the supply chain process responsible for orchestrating, executing, and overseeing the seamless movement and storage of products, services, and related data from the point of origin to the destination to meet consumer demands (Lagneaux 2008). Logistics companies wield considerable influence over various components of the economy, including gross domestic product (GDP), productivity, inflation, energy costs, interest rates, and other economic factors (Richard 2020). Li and Chen (2021) showed that the advancement of the logistics sector can enhance regional economic growth in addition to local economic growth. Their findings indicate a significant relationship between production and consumption and between urban and rural areas. Moreover, they underscore the importance of smart logistics to the industry’s success. Sezer and Abasiz (2017) investigated the macro and micro contributions of the logistics industry to the development of the national economy. Macro-level contributions come in the form of economy-generating employment, increased national income, and foreign investment inflow. At the micro level, logistics is crucial for boosting businesses’ ability to compete at a small scale. Companies that outsource logistics functions can focus on their core competencies. Hence, businesses can make the most use of their resources by allowing a top-tier solutions provider to expertly handle their logistics using the businesses’ own infrastructure of personnel and technology. Without logistics support, no company engaged in marketing, manufacturing, or project execution can be successful (Neeraja et al. 2014). According to Lambert and Burduroglu (2000), logistic activities can be categorised into two main types: inbound logistics, which involves material procurement, handling, storage, and transportation, and outbound logistics, which encompasses product collection, maintenance, distribution, and delivery to the end user. Given the importance of transport and logistics companies to the Lithuanian economy, the main objective of this study is to analyse the economic–financial situation for these companies, taking into account their solvency and liquidity, and to examine their probability of bankruptcy. To this end, the economic and financial data of 416 companies in the sector operating in Lithuania were studied. The methodologies used were descriptive analysis, analysis of ratios by quartiles, Altman’s Z-score, and logistic regression. The results obtained present conclusions of great interest both to the academic world and to the operators of these companies.
The paper is distributed as follows: Section 2 analyses the existing literature on logistics companies, as well as their business viability, in Lithuania. Section 3 analyses the two hypotheses put forward in the study. Section 4 summarises the study variables, methodology, and sample characteristics. Section 5 presents and discusses the results. Finally, conclusions about the study and its practical and theoretical implications are presented.

2. Literature Background

2.1. Logistics Companies’ Importance and Evolution

A logistics company is a business that plans, coordinates, and oversees the supply chain of other businesses. A logistics company may function in the areas of order fulfilment, distribution, storage, transportation, and supplier procurement, contingent upon the terms of the parties’ commercial agreement. Logistics includes many important activities. While transport is often considered the most crucial logistics activity (Tseng et al. 2005), logistics also involves other essential functions, such as warehousing, storage, cargo handling, and ancillary support activities related to land, air, and water transportation. Long before logistics gained global recognition as a concept, traders would store their goods in one location and then transport them to the market for sale. Over time, logistics has evolved into a multibillion-dollar sector that serves global trade. Nowadays, logistics continues to evolve and produce new opportunities. The evolution of logistics has significantly influenced the growth of the global economy (Frikha and Hlali 2023). Dablanc and Rakotonarivo (2010) claim that the initial step in logistics begins with the warehouse. They discovered the importance of the spatial organisation of logistics facilities from a geographic perspective and found that the relocation of logistics facilities from the central urban areas of Paris to the suburbs had a more pronounced impact on geography compared to its effect on employment and households.
The changes in electronic commerce businesses that have taken place over the past four decades in industrialised countries have been mainly due to logistics. The gradual advancement and acceptance of remote methods of selling items represent one of the most significant changes in the logistics process (Ilchenko and Freiuk 2020). In the past, logistical tasks such as order picking, break-bulk, freight consolidation, shipping, receiving, storing, and containerisation were commonplace.
In the present day, numerous distribution operations have been computerised, automated, and outfitted with cutting-edge material handling machinery and information systems, all owing to technological advancements (Rimienė and Grundey 2007). These advancements have significantly enhanced the efficiency of logistics operations, facilitating the timely delivery of goods at a reduced cost (UK Essay 2017).
Some significant aspects of logistics operations that play a vital role in the distribution process are the level of customer service, quality, efficiency, satisfaction, and transportation. Various economic trends focus on enhancing and optimising the volume of commodities moved and cutting down the time between production and receipt by the final consumer (Tomasz 2013). Pokrovskaya et al. (2022) suggest that the COVID-19 pandemic has reshaped the rules of engagement for businesses. Those that have demonstrated the ability to swiftly adapt to rapid changes have emerged victorious. Logistics providers and their electronic platforms are changing and becoming more and more influential in setting the rules of the market. Globalisation is facilitating greater accessibility to commodities, services, and information worldwide. Consequently, the global freight volume has steadily risen alongside the deepening of economic globalisation, while urban logistics spaces are undergoing progressive transformations. Specifically, sustainable development plays a crucial role in redistributing social resources, enhancing urban ecology, and stabilising the urban economic system (He et al. 2019). Furthermore, with the emergence of COVID-19, internet shopping became the predominant driving force in the logistics industry, as an increasing number of customers opted to order products online (Stošić and Trajković 2020).
Many researchers agree that the effectiveness of supply chain management is the most important aspect of logistics activities. Supply chain management is a rapidly growing field that is transforming the ability of manufacturing and non-manufacturing businesses to satisfy their clients’ needs (Almatarneh et al. 2022). As the geographical distances between the points of production and consumption expand, the importance of logistics grows. The rising global demand for a diverse array of products is prompting shifts in people’s expectations for each product (Neeraja et al. 2014). It is necessary for companies to effectively manage logistics activities to enhance business competitiveness and ensure customer satisfaction. Therefore, selecting appropriate storage, warehouse, and transport management strategies is essential for companies to minimise their overall costs (Ristovska et al. 2017). Logistics companies need to focus on organising the control of procurement, storage, transport, and information to enhance efficiency. An effective supply chain management strategy lowers expenses and increases a company’s ability to compete (Kumar et al. 2006). Countries with emerging economies must pay particular attention to the logistics and supply chain management processes to maintain competitiveness. Modern technology enables these countries to capitalise on market opportunities to their fullest extent (Kherbach and Mocan 2016). Suppliers, customers, and logistics service providers are the key players in the supply chain, and companies rely on their support to successfully execute supply chain management (Larson and Halldorsson 2010).
Many researchers have focused on the financial aspect of logistics companies. It is a fact that capital structure negatively influences the profitability of logistics companies, specifically in terms of their return on assets (ROA). Unfortunately, there is no statistically significant evidence supporting the direct impact of capital structure on return on equity (ROE) (Ngoc et al. 2021). Despite its negative impact on the financial aspect of the logistics sector, its economic significance is substantial, with its direct contributions and indirect effects collectively contributing to GDP and domestic employment (De Doncker 2017). To reduce logistics costs relative to the gross domestic product, it is important to focus on the relationship between logistics costs and economic development. Developing appropriate logistics policies that accommodate economic growth needs is essential (Liu 2016). Hence, investments in the logistics sector are essential to enhance trade outcomes and earn higher earnings, while also effectively meeting the changing demands of customers (Al Jabri et al. 2021). Other researchers have revealed the negative effect on the financial performance of logistics companies during the COVID-19 pandemic, which lead to severe constraints on export activities and international transportation. As a result, there was a notable increase in the leverage ratio, accompanied by decreases in profitability and efficiency ratios among affected businesses (Nguyen 2022). This downturn is evidenced by a decrease in overall revenue, profitability, and investment among companies operating in sectors including travel and tourism, transportation, the supply chain, sports, and other industries reliant on these sectors (Atayah et al. 2021).
According to the literature review, most studies have primarily focused on several financial indicators or specific aspects of logistics, such as supply chain efficiency and transportation infrastructure. However, as the global demand for logistics services continues to surge, driven particularly by the expansion of international trade, there is a significant gap in the research. Specifically, there is a need for more comprehensive studies to understand the relationship between the overall economic and financial health of logistics companies. This literature gap highlights the necessity for an integrated approach that examines both the financial and economic performance metrics of logistics companies in a microeconomic context.
For further analysis, we have chosen Lithuanian logistic companies as a sample for several compelling reasons. First and foremost, they are a crucial pillar of Lithuania’s economy, significantly driving economic growth and development. Furthermore, logistic companies in Lithuania are known for generating substantial profits, which contribute to their growth and bolster the country’s overall financial health. Providing employment opportunities and fostering related industries can create a ripple effect that strengthens the broader Lithuanian economic landscape. While other sectors were not the primary focus of our analysis, this decision allowed us to concentrate specifically on the logistics sector and conduct a detailed examination.

2.2. Viability of Logistics Companies in Lithuania

The viability of logistics companies is based on a range of internal factors, such as social dynamics, human resources, and technology, as well as external factors such as economic conditions, political–legal frameworks, socio-cultural trends, ecological considerations, and the competitive environment. For a logistics company to achieve a high level of economic viability, it is necessary for it to apply new tools and methods. One of the key tools is a financial ratio analysis involving the following attributes: profitability, efficiency (asset management), solvency (liquidity), and capital markets (Karpavičienė and Navickas 2020).
Lithuanian logistics companies primarily focus on offering transportation and warehousing logistics services, along with various additional services. Regrettably, it has been found that Lithuanian companies offering integrated logistics services are unable to provide comprehensive management of the entire business logistics process (Meidutė et al. 2012). Transport and logistics services are vital activities in Lithuania. Companies in this sector fulfil the requirements and needs of various transport users across the EU market and CIS countries. Transportation is unrestricted across borders, with exceptions for quality and pollution standards. Additionally, drivers can be hired from any country within the EU or the CIS (Sekliuckienė and Langvinienė 2013). The most challenging year for numerous transport sectors was the onset of the economic recession in 2007. During this period, transportation saw a decrease in demand, leading to businesses struggling to meet their needs. As a consequence, profitability experienced a significant decline (Bazaras and Palšaitis 2012). However, Raslavičius et al. (2014) highlighted that Lithuanian transportation has played a pivotal role in fostering economic growth. The effect of this growth may have both a positive and negative impact on the environment and people’s quality of life, depending on the measures taken at all levels to promote sustainable development. Juozapaitis and Palsaitis (2017) argue that the effective viability of logistics companies in Lithuania requires the utilisation of transport cluster systems. This is further bolstered by the strategic significance of international logistics and transport hubs. Furthermore, it is advised that Lithuania develops sectoral models, contingent upon data availability, and ceases relying on foreign models to assess domestic enterprises (Prusak 2017). Looking back at statistics data from 2020, it is evident that the primary logistics companies comprised road transport (65%), sea transport (6.1%), rail transport (5.3%), air transport (2.1%), postal and courier services (0.8%), and other services (20%) (Enterprice Lithuania 2020). In Lithuania’s transport industry, the road freight transportation sector had the biggest turnover (EUR 6.7 billion of the total turnover generated), followed by the storage and support operations sector (EUR 3.8 billion of the total turnover generated). Together, these two sectors constituted 89% of the total turnover volume in the transport sector in 2020 (Statista Research Department 2023). Bazaras and Palšaitis (2017) surveyed the logistics situation in Lithuania. Their findings revealed that the primary issue in the logistics industry is the high cost associated with modern software, which poses a challenge for small businesses. However, despite this challenge, most companies acknowledge that Lithuania offers them a favourable operational environment. Vaičiūtė et al. (2022) have highlighted that with the emergence of the COVID-19 pandemic, road transport logistics encountered new technological challenges. Therefore, there is a need to foster synergy between technological advancements in transport companies and collaborative logistics. Nowadays, green logistics has emerged as a focal point and is considered essential for transport and logistics service companies in Lithuania to adopt. This adoption can increase the domination of logistics companies in sustainable development efforts. The primary sustainability factors encompass environmental protection, business partner demands, corporate culture, and legal regulations and policies, among others (Vienažindienė et al. 2021).
In the following section, we outline our hypotheses considering the circumstances around logistics operations in Lithuania.
3. Hypothesis Development

The Z-score model is commonly used to determine the probability of bankruptcy. Several studies, employing various discriminant analyses, have calculated the financial health and probability of bankruptcy of many types of companies using multiple categories of financial ratios, including solvency, coverage, leverage, and profitability (Nam and An 2017; Marsenne 2020; Surwanti et al. 2022). Certain publications focus on researching bankruptcy prediction, identifying potential bankruptcy signals, and assessing financial distress within the logistics industry (Giovanni et al. 2020; Saputri and Asrori 2019; Winarno 2019). The stress experienced during the COVID-19 pandemic affected the financial stability of the logistics and transportation sectors (Indah et al. 2023). Various studies have examined cargo shipping (Lozinskaia et al. 2017), the logistics sector (Brozyna et al. 2016; Pisula 2012; Pisula et al. 2013), the shipping and logistics industry (Nam and An 2017), the aviation industry (Hu et al. 2022; Shi and Li 2024), and transportation companies (Surwanti et al. 2022; Salmar 2018; Irawan et al. 2021).
H1. 
Logistics companies have a low probability of bankruptcy and a high level of solvency, according to Z-score analysis.
Equity and current ratios have a notable influence on the credit risk of both the logistics and maritime industries; however, return on assets and the quick ratio exhibit the most substantial impact on each industry, respectively (Woo et al. 2021). Accordantly, return on assets (ROA) and return on equity (ROE) are also affected by business type in the logistics industry (Jang and Ahn 2021). Previous research has found that the causes of failure also vary with the size and age of firms (Barba Navaretti et al. 2014; Lukason and Hoffman 2015), and a significant relationship was determined between a company’s age and the cause of insolvency, the main reason being a lack of starting capital. As a result, mature small and medium-sized companies often face greater challenges when faced with increasing competition and economic downturns compared to young and adolescent businesses, which typically fail due to internal flaws (Kücher et al. 2020). Other studies have conducted relevant research on financial management risk in logistics service fields (Hofmann and Lampe 2013) and maritime transportation (Wang et al. 2014; Kang et al. 2016; Adland et al. 2017).
H2. 
The probability of bankruptcy of logistics companies is explained by their age and size.
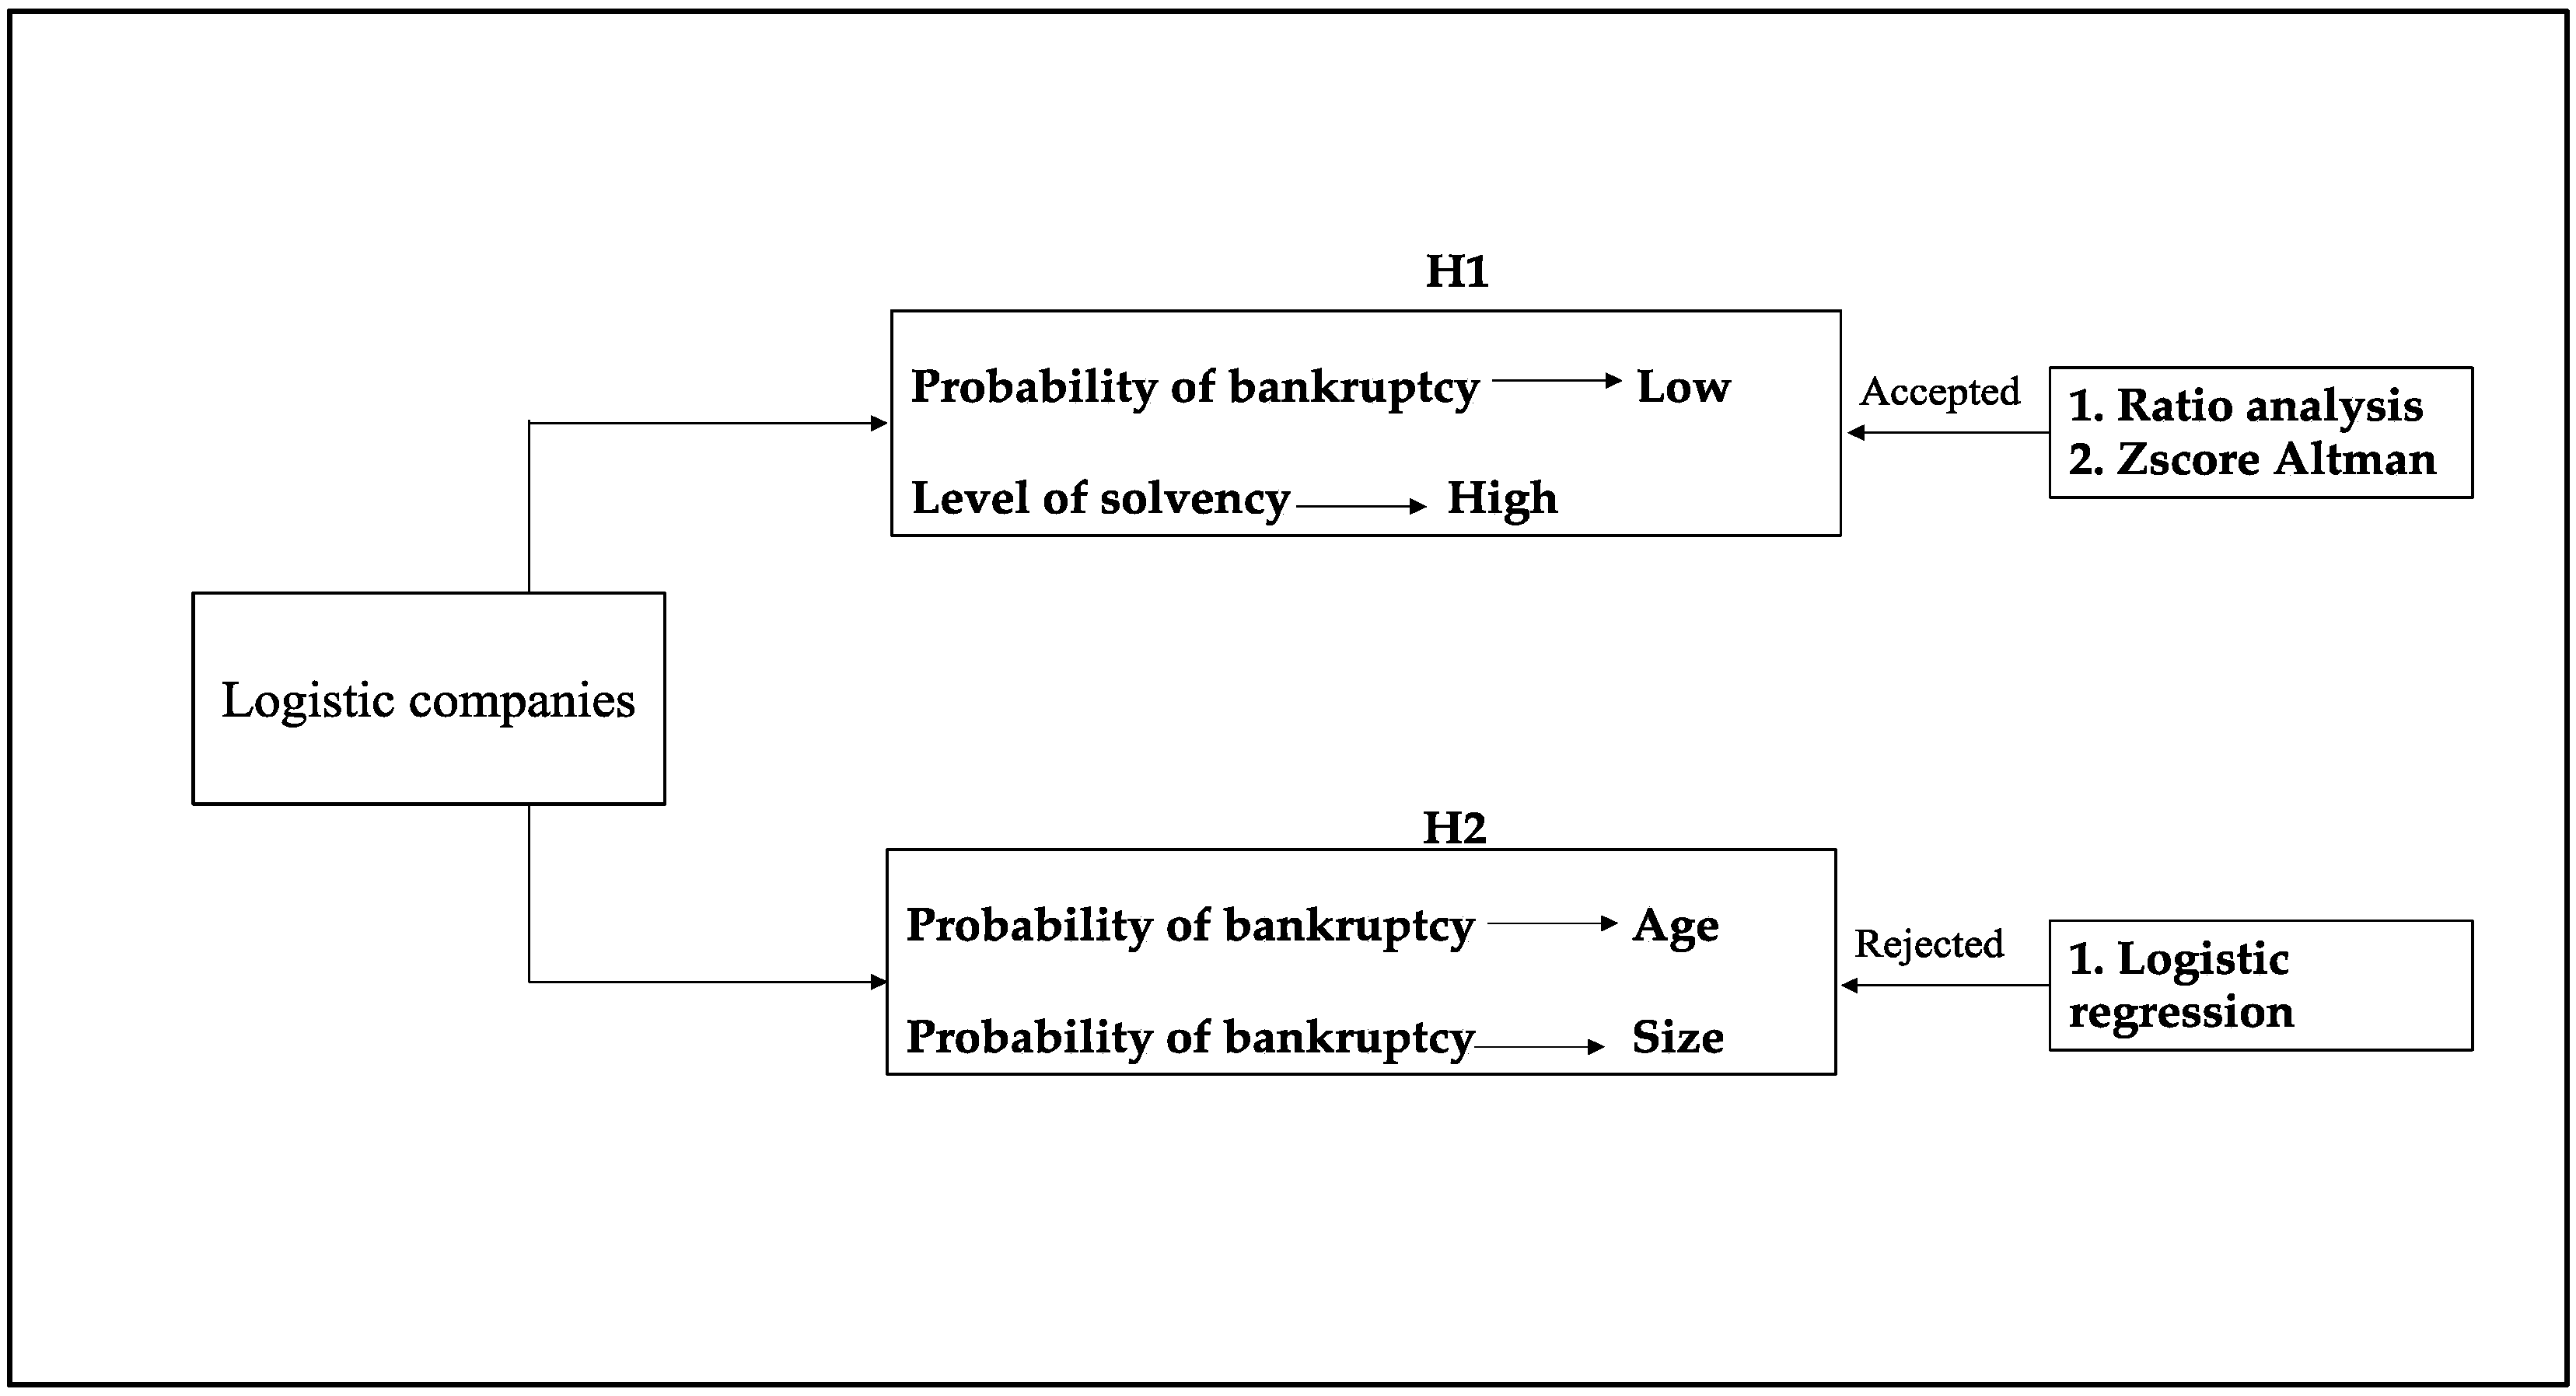
In order to determine whether logistics companies operating in Lithuania have a high level of solvency and a low level of bankruptcy, Altman’s Z-score will be used to classify the sample according to its economic and financial performance into solvent, financially troubled, and bankrupt companies. In addition to this, analysis of the ratios by quartiles will be developed to give the most accurate results for the companies analysed. For the second hypothesis, logistic regression is performed to see whether the variables age and size condition the probability of bankruptcy. The proposed model is presented in Figure 1.
Taking into account the two hypotheses, it is expected that both will be accepted. The following section describes the sample, variables, and methodology used to achieve the objectives set out in the proposed model.

4. Sample, Variables, and Methodology

4.1. Sample and Variables of the Study

The study sample consisted of logistics companies operating in Lithuania at the national level. The data were obtained from the ORBIS database, which provides both quantitative and qualitative data. The main difficulty encountered was finding companies that presented all their economic–financial data in order to perform the necessary analyses to determine whether they were solvent or not. For the year 2022, there were 3192 enterprises with economic–financial data available, but due to the lack of specific data required for the analysis of solvency, most of these enterprises were excluded from the final sample. Table 1 shows the sample selection process.
As can be seen in the table, 416 logistics companies operating in Lithuania were analysed, which represented 13% of the initial sample size. To analyse the adequacy of the final sample in representing the total population, the ideal sample size was calculated taking into account a 95% confidence level and a 5% margin of error. It was found that the ideal sample size to validate our study was 344 companies, which was exceeded by our final sample.
The study variables mainly consisted of economic–financial variables in order to gain first-hand knowledge about logistics companies in Lithuania. In particular, variables such as solvency ratios, liquidity ratios, profitability ratios or variables, and the age and size of the company were used. Table 2 summarises the variables and their respective formulas used in this research.
As can be seen in the table, the variables are divided into four blocks. The first includes the profitability ratios, which have been used in numerous international studies to measure the profitability of companies (Retolaza et al. 2014; Flores-Ureba et al. 2023; Gelashvili et al. 2023). The second group consists of the three main short-term liquidity ratios, on the basis of which the ability of a company to pay its short-term debts is measured (Gelashvili et al. 2023; Dimitras et al. 1996). In the third group, we have the two solvency ratios, i.e., the ability of a company to survive in the long term (Ibáñez et al. 2013). These first three groups of ratios have been used in several studies to predict the failure or survival of a firm on the market (Retolaza et al. 2014; Flores-Ureba et al. 2023; Altman et al. 2017). The last group of ratios is made up of descriptive variables such as the size of the company measured by the number of employees and the total assets of the company, the age of the company from the time of its creation, the size of the companies as a separate variable, and, finally, the profits generated during the accounting year. These variables have been targeted by researchers due to their relationship with the probability of firm bankruptcy (Gelashvili et al. 2023; Altman 1968; Blasco and Carrizosa 2007; Situm 2014).

4.2. Methodology

The methodology began with a descriptive analysis of the variables studied. Then, since there were many companies that differed greatly in the results of the ratio calculations, the analysis of the ratios was carried out based on quartiles, which made it possible to see the business landscape of the logistics companies. This method is widely used to avoid relying only on the average results, where there may be variations due to the results of some specific companies. Finally, Altman’s Z-score analysis was used to classify companies as healthy, doubtful, or with a high probability of bankruptcy (Altman 1968). Altman’s Z-score is based on multiple discriminant analysis that uses five ratios and five weights to predict the failure of manufacturing firms. The initial test of the model gave an accuracy of 95% one year prior and 72% two years prior to failure (initial sample of 66 firms) (Hussain et al. 2014). The accuracy of the results increased considerably in subsequent models. Today, the first Z-score model developed by Altman is still the most widely used, compared to other scoring models developed over the years (Ortega et al. 2024). The Z-score results were used to confirm the results of the ratios. In addition, a logistic regression was carried out, since the dependent variable, the Z-score, was transformed into a dummy variable, which made it possible to answer H2 of the study. Logistic regression is an optimal model for this type of analysis (Peláez 2016).

5. Results

5.1. Descriptive Analysis

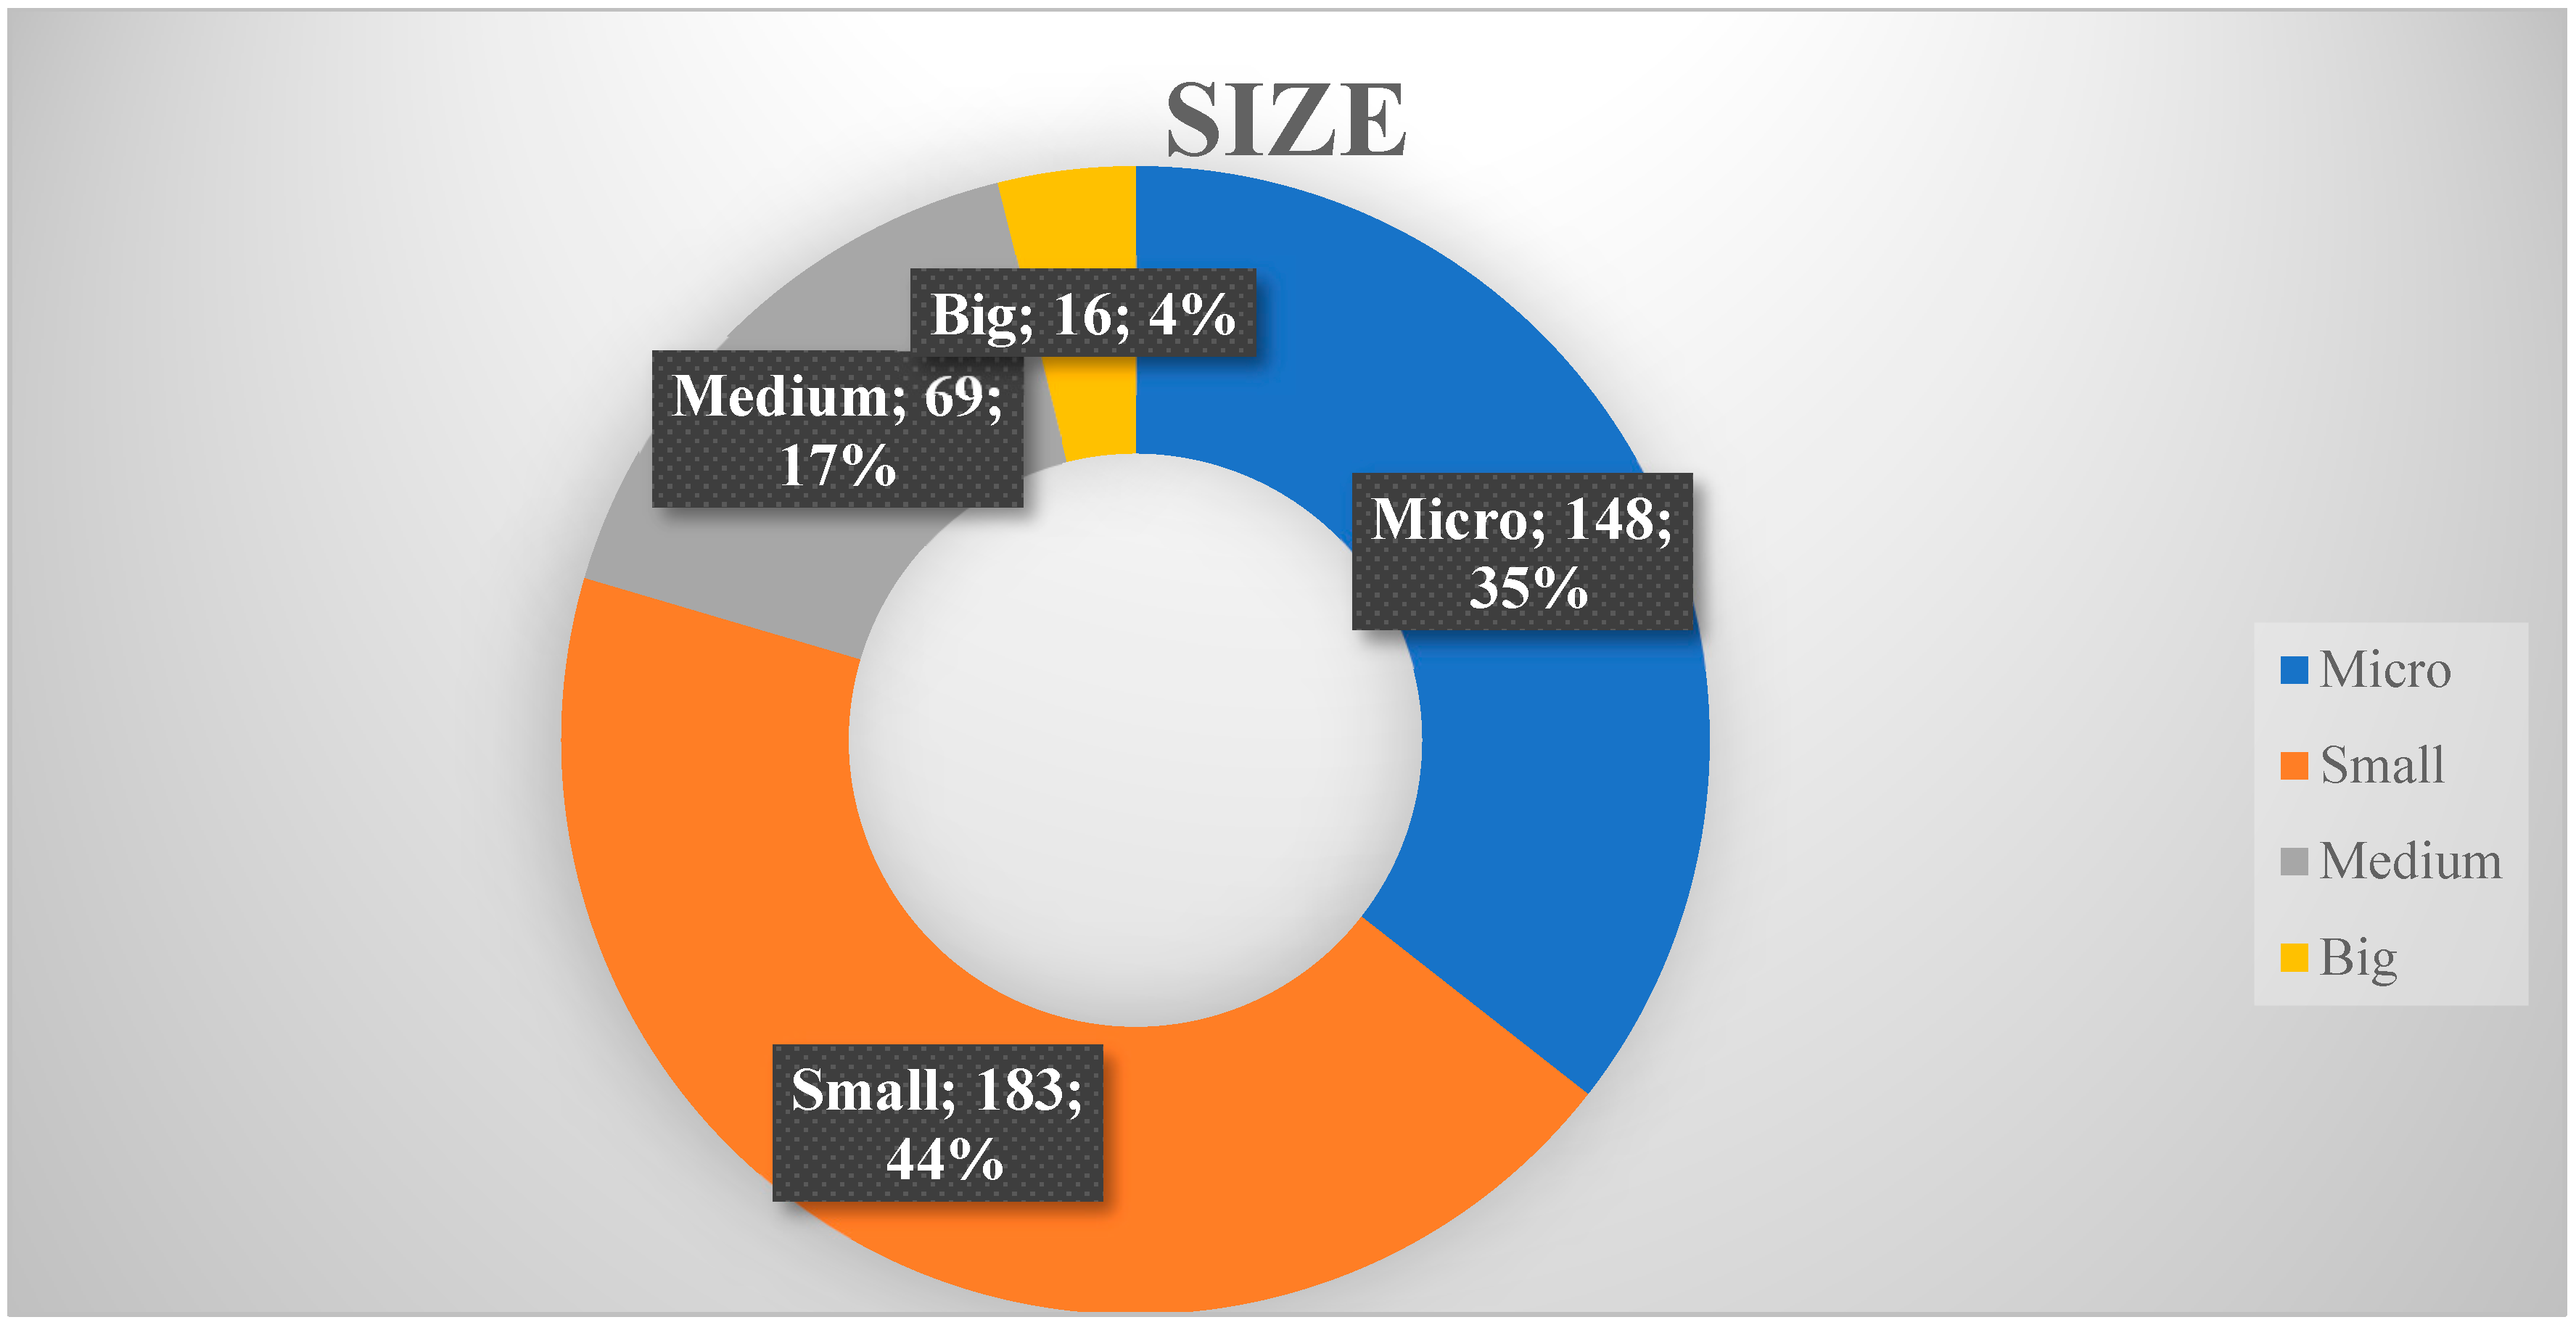
As mentioned above, it was possible to obtain economic and financial data for all 416 companies for 2022. These companies all operated in the logistics sector, and more than half of them were based in Vilnius (51%). Analysing the size of the companies (see Figure 1), the descriptive analysis showed that most of the companies were micro- or small-sized (80%). According to EU regulations, micro-enterprises are those with a maximum of 10 employees and a turnover (annual) or total assets not exceeding 2 million. Small enterprises are those with a maximum of 49 employees and a turnover (annual) or total assets not exceeding 10 million. Medium-sized enterprises are those with between 50 and 249 employees and a turnover (annual) of less than 50 million or total assets not exceeding 43 million. Finally, large enterprises are those that have 250 employees or more and an annual turnover exceeding 50 million or total assets exceeding 43 million. Figure 2 summarises the size of the companies in the study.
The results of the analyses of the other variables are shown in Table 3. The profitability ratios show that on average, these were enterprises that had high profitability in terms of both assets and turnover and thus generated positive results for their owners. It is worth noting that the standard deviation was rather high, probably due to the fact that some companies had negative profitability (minima) and others had excessive profitability (maximum).
The results of the liquidity ratios show that these logistics companies in Lithuania were, on average, companies with a high probability of liquidity, as their average ratio in 2022 was 1.95, which was higher than 1, meaning that they could pay their short-term debts with their liquid assets. The results for the cash ratios and acid test ratios were optimal, i.e., the companies could pay more than half of their short-term debts without selling stocks. An analysis of the solvency ratios shows that these were companies with fairly solid net assets and low debt (average 33.83). This result was also confirmed by the result of the debt–equity ratio, which compares long-term external financing and equity with the company’s total assets. The result on the assets turnover ratio shows an average of almost 11, which means that, on average, logistics companies have 11 times more net turnover than their economic resources. This result is one of the indicators of the good economic and financial health of the companies in this sector. If we analyse the minimum and maximum, we see that there are companies that have had 198 times more net turnover than their total assets or companies that have had their core revenue equal to their assets.
Analysing the last block of variables, we see that the number of employees varied between 1 and 2484, i.e., these were enterprises from the same sector but of very different sizes. On average, these enterprises employed 84 persons, although this result had a rather high variance. The age variable was calculated for the end of 2022. The results show that these were companies with experience on the market, as their average age was almost 14 years, although there were companies that had been in existence for less than a year and others that had been on the market for more than 32 years. Finally, the profit generated by these companies in 2022 was analysed; the results of the descriptive data show that on average, they had generated a turnover of more than EUR 18 million with their activity.

5.2. Ratio Analysis

  • Profitability ratios
Profitability ratios measure the profit generated by a company based on its economic resources, turnover, or equity. In this study, the three ratios (%) presented results at acceptable levels. In the case of the ROA, for every EUR 100 invested in assets, logistics companies generated almost EUR 15 of profit, on average. In the case of the ROE, for every EUR 100 invested by the shareholders, they received a profit of EUR 33.76, which is a very good result. The profit margin ratio represents the sales result after all expenses have been paid. In this study, the result was 6.35, which was slightly lower than the results for the other profitability ratios. In order to provide more precise information, the results of the companies have been divided into quartiles (Table 4).
For the ROA results by quartile, there was a big difference in profit between Q1 and Q3; specifically, in Q1, there were companies with an average ROA of 3.33, which is a low result for an investment. Meanwhile, for Q3, companies showed a benefit of almost 23%, which means that every EUR 100 invested generated an average of EUR 23. The same was observed for the ROE: there were companies in Q1 that generated an average profit of EUR 7.75 for their owners, while the companies grouped into Q3 were very profitable, with an average profit of almost 62%. Concerning the results for the profit margin, we observed the same tendency as for the rest of the ratios, i.e., a large difference between the results for Q1 and Q3. This difference was also significant between the companies in Q2 and Q3, where the profit was almost 100% greater for those in Q3 than for those in Q2. These results indicate that logistics companies are, on average, profitable enterprises. Some are more successful than others, but, in general, they show a solid profitability.
  • Liquidity ratios
The results of the liquidity ratios show that the Lithuanian logistics companies in this study were able to cover 100% of their short-term debts, regardless of which quartile the company was in. This means there was a low probability of short-term financial problems. It should be noted that the results of the acid test were not higher than 1, with a result of 1 meaning that these companies would have to sell their shares in order to pay off their short-term debts. The same applied to the average cash ratio; these companies would be able to pay 50% of their short-term debts with liquid assets.
As seen in Table 5, there were large differences in the results of the acid test. The Q1 companies could only pay 6% of their short-term debt, which is a rather low result, but if we compare this result with the current ratio results in Q1, we see that these companies had a lot of short-term stocks, so they did not pose a threat to their creditors. It is noteworthy that the Q3 companies were companies that could afford their short-term debt without selling shares. Overall, all the ratios showed optimal results, which means that these companies would be attractive to their creditors.
  • Solvency ratios
The solvency ratio measures the ratio of equity to all the economic resources held by a company. The higher the result, the more self-financing the company. In this study, the average of this ratio was almost 34%, which means that 34% of the assets were backed by equity. The debt–equity ratio indicates the degree of indebtedness of an enterprise, excluding short-term debts; in this case, the average of 61.66 means that the enterprises bought 61.66% of their assets on the basis of equity and long-term debts. More detailed results by quartile are shown in Table 6.
Analysing the solvency ratio by quartile, the companies in Q1 had 16.48% of their total assets financed by equity; meanwhile, the companies grouped into Q3 had 51.73% of their assets financed through shareholder equity. For the debt ratio results, there was a large difference between the companies in the different quartiles. Specifically, Q1 had a very low result of 4.66, which means that the companies in this quartile were highly indebted, with economic–financial problems. The companies in Q3, however, had purchased more than 76% of their assets with secure and long-term investments, which would give them an advantage when asking for more investment and help guarantee their long-term survival.

5.3. Z-Score Analysis

Bankruptcy is a legal procedure that occurs when a company is unable to meet its debts and becomes insolvent. Early prediction of bankruptcy is important for companies, as it allows them to restructure the company or look for other investors and solvency possibilities. Among the models for predicting corporate bankruptcy or solvency, the Z -score model described in (Altman 1968), based on multiple discriminant analysis, stands out. The model consists of using five ratios and five weights to predict the failure of listed manufacturing firms. This model has been adjusted over time, and the Z -score has been adapted to non-manufacturing and non-listed companies (Ortega et al. 2024). As the sample of this study includes non-listed companies, the model has the following formulation:
Z = 0.717 X 1 + 0.847 X 2 + 3.107 X 3 + 0.420 X 4 + 0.998 X 5
where Z’ is the index of bankruptcy; X 1 = (Current Assets-Current Liabilities)/Total Assets; X 2 = Retained Earnings/Total Assets; X 3 = Earnings before Interest and Taxes/Total Assets; X 4 = Book Value of Equity/Total Liabilities; and X 5 = Sales/Total Assets.
Altman’s Z -score divides companies into the green zone, with no financial problems ( Z > 2.9); the grey zone, with a probability of bankruptcy in the next period (1.23 < Z < 2.9); and the distress zone, with a high probability of bankruptcy ( Z < 1.23). Nowadays, Altman’s first Z -score model is still the most widely used compared to other scoring models developed over the decades.
According to the Z -score formula, the companies in this study were classified into the following three groups: safe, grey, and distress. The results are shown in Table 7.
The results show that the majority (90%) of the logistics companies were solvent, without financial risk and with a high chance of long-term survival. Specifically, out of the 416 companies analysed, 373 were in the safe zone, while 23 were in the grey zone, i.e., they were companies with signs of long-term insolvency, with a probability of bankruptcy. It would therefore be advisable for the managers of these companies to take steps to reduce the probability of bankruptcy. Finally, there were only 20 logistics companies in the bankruptcy zone. This means that 5% of the companies analysed had a probability of failure. This is not a high figure, but in order to prevent bankruptcy, the economic and financial situation of these companies should be reviewed, and the necessary prevention measures should be taken.
To answer H2 in this study, a logit model was used in which the dependent variable, Z-score, was divided into two groups: insolvent firms or firms with a high probability of insolvency and healthy firms. Since the dummy variable was the dependent variable of the study, the logit model was the most appropriate model for this type of analysis. The independent variables were the age of the enterprise and its size as measured by the number of employees and total assets. The results are shown in Table 8.
As we can see in the table, none of the variables were predictors for business failure since the level of significance (p < 0.05) was not reached. We can therefore say that neither the age of the company nor its size influenced the solvency or bankruptcy of these logistics companies. This result was previously confirmed by the correlation between the variables studied.
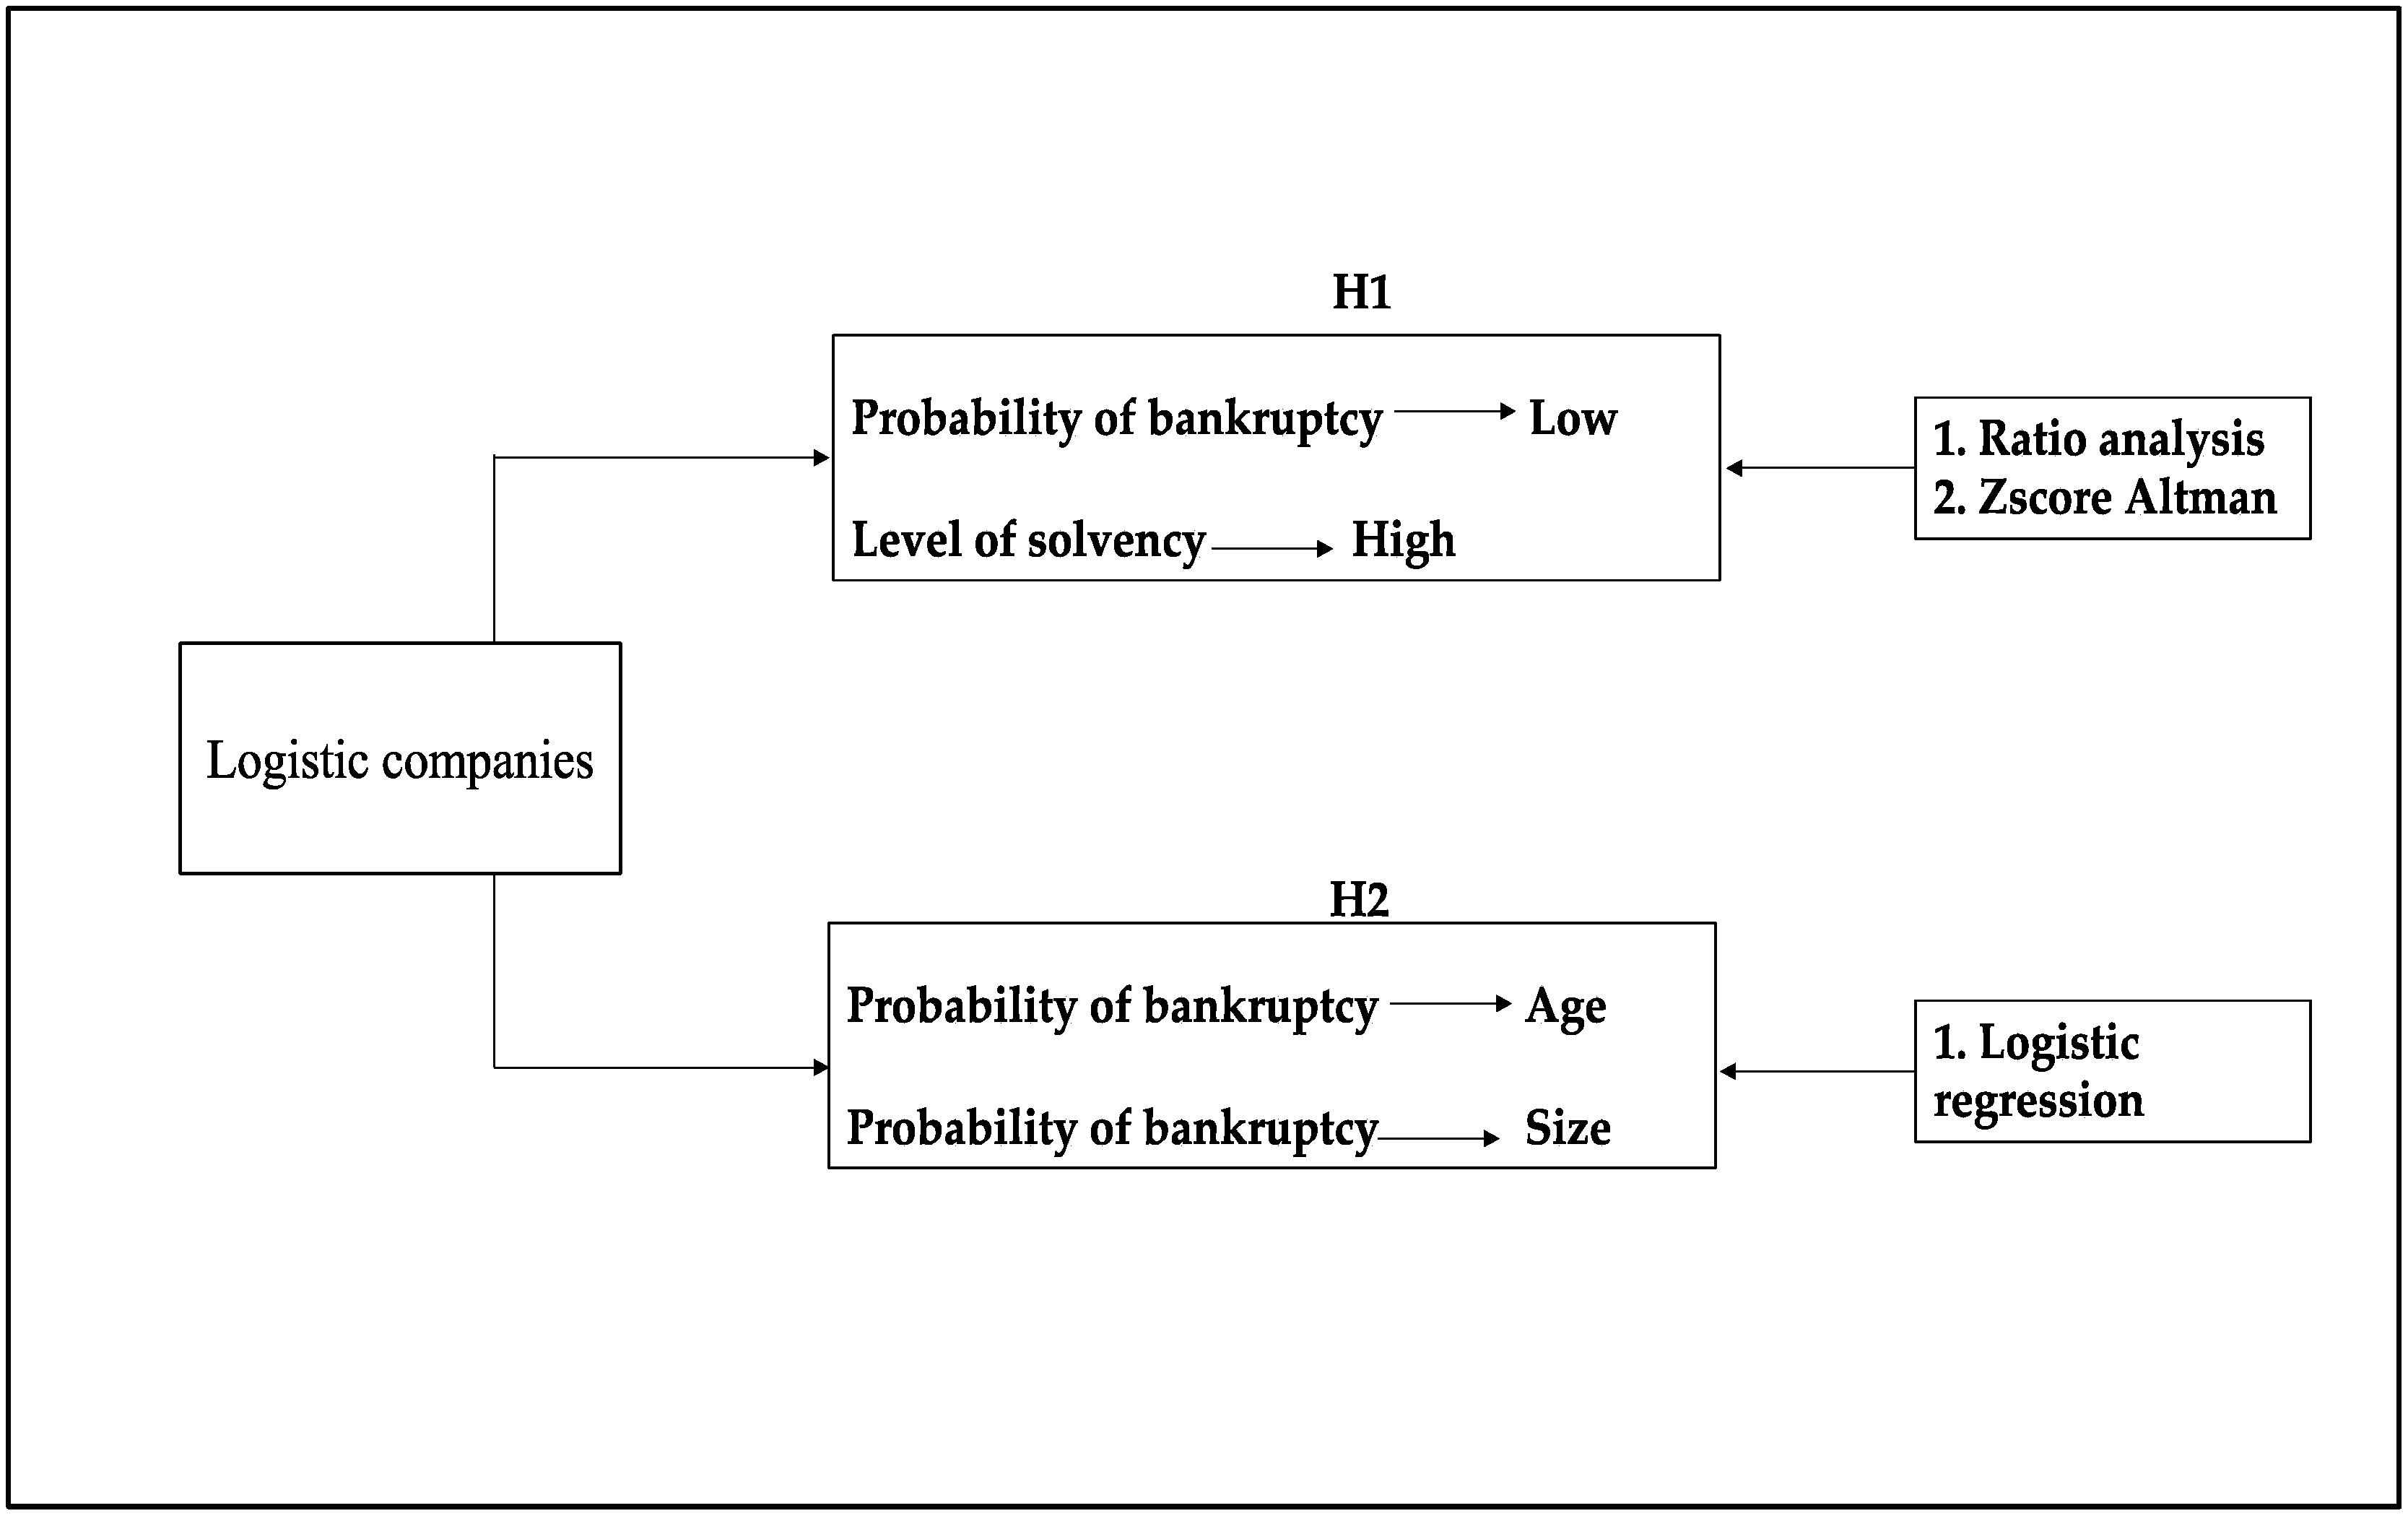
Looking at the results of the ratios and the Z -score analysis, it can be seen that these were companies with solid solvency, as 90% of them were not at risk of bankruptcy according to their economic and financial data for 2022. This result was corroborated by the analysis of the ratios, where it was shown that most of the companies had high profitability, a high level of liquidity in the short term, and were solvent in the long term. Based on this, H1 is accepted. The logistic regression results refute H2. Figure 3 shows the model of the study and the final result.

6. Discussion

Based on the results of the ratios analysed, it can be concluded that logistics companies in Lithuania are highly profitable companies that generate economic and financial benefits for their stakeholders and at the same time participate in the economic growth of the country in which they operate. According to Raslavičius et al. (2014), based on their core business, transport and logistics companies play an important role in the economic growth of the country. This fact has been confirmed by the results of this study, as profitable companies generate profit not only for their owners but also for the country through taxes. At the same time, they need fewer subsidies to survive. The work of Vaičiūtė et al. (2022) pointed out that transport and logistics companies in Lithuania have had problems with digitalisation and incorporating the most advanced technologies for proper operation; however, the results of the ratio analysis in this study indicate that there were no excessive costs for these companies in 2022, as they showed robust results for profitability.
Second, one of the most debated issues in the academic literature is whether firm size or market experience determines firm survival or failure (Barba Navaretti et al. 2014; Lukason and Hoffman 2015). There are several studies that claim that firm size and age positively affect firm profitability. According to Gelashvili et al. (2022), higher firm profitability was associated with fewer years of firm life. They also found that the larger the firms, the more profit they earned. However, some studies (Galán González and Gravel 1997) have not found relationships between these two independent variables and firm profitability, which is directly related to firm survival. In this study, no relationships were found between firm size and age and the prediction of business failure; therefore, our results are in line with the studies of Galán González and Gravel (1997).
Third, the integration of technology across the supply chain landscape presents immense opportunities for businesses to optimise operations, reduce costs, enhance sustainability, and improve their overall efficiency. Through the utilisation of automation and robotics, warehouse operations have witnessed a significant transformation, characterised by heightened speed, precision, and reduced reliance on human labor (International Freight Forwarding Services 2023). Furthermore, the integration of AI technologies into warehouse management systems has ushered in a new era of logistics and supply chain management. AI-powered warehouse automation systems leverage sophisticated algorithms to optimise diverse aspects of warehouse operations, ranging from inventory oversight to order processing and completion (Sodiya et al. 2024). However, the suitability of technology-driven solutions may vary depending on factors such as company size and regional labor availability. Warehouse Management Systems (WMSs) are better suited for automated warehousing, particularly for larger companies in regions with limited manual labor (Odeyinka and Omoegun 2023). In addition to warehouse management, Fleet Management Systems (FMSs) have become indispensable tools for modern logistics businesses. These systems play a crucial role in enhancing operations, improving customer service, controlling costs, and streamlining processes (Nagaraj 2023). Furthermore, the deployment of automated solutions such as automated guided vehicles (AGVs) within distribution centers is anticipated to mitigate the challenges posed by escalating labor expenses (Thakur 2022). Telematics and blockchain technologies further augment the efficiency and security of supply chain operations (Ghaffarpasand et al. 2022; Idrees et al. 2021). Moreover, sustainable packaging and smart packaging solutions offer innovative approaches to reducing environmental impacts and improving operational effectiveness (Coelho et al. 2020; Fernandez et al. 2023).
One of the important aspects is to take into account the impact of COVID-19 on logistics companies. Several companies have reported that the years 2020 and 2021 were years that have significantly affected the logistics sector, causing economic and financial problems and even business bankruptcy (Nguyen 2022; Vaičiūtė et al. 2022; Indah et al. 2023; Jahanshahi et al. 2024). However, in 2022, they were able to recover from their economic and financial problems (Van Hoa et al. 2023). These results are in line with the results of the analysis of the ratios of this study, where it was seen that in 2022 they had a high level of solvency, a good profitability and an acceptable level of liquidity. Moreover, 90% of the companies were in the “safe” zone according to Altman’s Z-score.
All in all, the results of this study shed light on the economic and financial situation of transport and logistics companies operating in Lithuania (Juozapaitis and Palsaitis 2017), contributing significantly to the academic knowledge and updating existing information.

7. Conclusions and Implications

The aim of this study was to analyse the economic and financial situation of transport and logistics companies operating in Lithuania, as these companies contribute significantly to the country’s economic growth. The literature review highlighted the need for economic and financial analysis of logistics companies, as most studies have been theoretical in nature or focused on analysing their profitability, not their probability of bankruptcy. For this purpose, two hypotheses were formulated: For H1, we analysed whether transport and logistics companies operating in Lithuania had a high level of solvency and a low probability of business failure based on Altman’s Z-score. In addition to this, an analysis of the ratios on the basis of quartiles was carried out, which made it possible to present a clearer picture of the economic and financial situation of these companies, not only on the basis of the average. The results of the analysis showed that, in fact, 90% of the analysed companies were healthy, with high levels of liquidity and solvency, while only 10% had economic–financial problems that could lead to bankruptcy. Given these results, H1 was accepted. H2 analysed whether the age of these companies and their size influenced the probability of bankruptcy. The results of the logistic regression showed that none of the variables were significant in predicting bankruptcy; therefore, H2 was rejected. The main conclusion that can be drawn from this is that logistics companies operating in Lithuania are in good financial health and can therefore be considered a business option for entrepreneurs.
In terms of its theoretical implications, this study contributes to the academic literature by providing the latest available economic–financial data for these firms. It can be observed that in recent years, the academic literature (Nguyen 2022; Vaičiūtė et al. 2022; Indah et al. 2023; Jahanshahi et al. 2024) has focused on the effect of COVID-19; therefore, almost all studies analyse the impact of the pandemic on the sector in the years 2020 and 2021 but none on the recovery period of 2022. So far, the academic literature has focused on the importance of these firms but has not provided evidence based on economic and financial data. In addition, this study rejects the relationships between firm failure and firm size and age. This finding is new for this type of firm and does not apply to other sectors; therefore, new lines of research can be proposed on this basis. Consequently, new lines of research can be proposed to explore these unique factors and develop a more nuanced understanding of what drives firm success and failure in the logistics industry. This could lead to the development of targeted strategies and policies to enhance the performance of logistics companies.
In terms of its practical implications, we can highlight the importance of the results for the correct management of transport and logistics companies. The managers of these companies must consider the correct management of economic and financial variables, as these can help improve the solvency and liquidity of the company, rather than variables such as age and size. Governments should pay more attention to these types of companies, as they not only generate benefits for their owners but can also lead to more efficient supply chains, reduced costs, and improved competitiveness at the macroeconomy scale. This, in turn, can foster economic growth, create jobs, and enhance the overall economic health of the nation.
Although this study is based on a quantitative analysis, it is important to pay attention to qualitative variables to predict business failure. In particular, the experience, skills, professionalism, and behaviour of a company’s top management can be vital for avoiding business failure (Gelashvili et al. 2019; Shin et al. 2015). The academic literature has highlighted the importance of business environment variables such as GDP, inflation, and the economic situation affecting the country in a given period (Ozili 2022; Succurro 2012).
It is important to underline the regulations governing corporate insolvency at the European level. In particular, the EU is developing a set of initiatives in the area of insolvency proceedings that establishes rules on restructuring; provides an early warning system and online information; and establishes a preventive programme (Directive (EU) 2019/1023 of the European Parliament and of the Council on preventive restructuring frameworks, on discharge of debt and disqualifications, and on measures to increase the efficiency of procedures concerning restructuring, insolvency and discharge of debt). On the basis of European law, Lithuania has established the Insolvency Law for Legal Persons, which aims to facilitate an efficient insolvency process for legal persons by ensuring a balance between the interests of creditors and those of legal persons (XIII-2221 Republic of Lithuania Law on Insolvency of Legal Persons). Therefore, as a final summary, it can be said that in order to avoid business failure, not only the quantitative variables that come from annual accounts are important but also the environmental or qualitative variables that significantly affect the correct functioning of any company.
Based on this, the limitations of the study are presented. This study was not without its limitations. The first and most important limitation arose due to a lack of access to the economic–financial data of these companies; it was possible to analyse only 13% of the original sample of transport and logistics companies, as the database did not contain key information to calculate the required variables for many of the companies. Therefore, it was not possible to say whether all the logistics companies operating in Lithuania have the same economic–financial situation as those analysed. The second limitation of the study was the range of years. An analysis of panel data could shed more light on the economic–financial situation of these companies. Therefore, it is not possible to say whether all the logistics companies operating in Lithuania have the same economic–financial situation as those analysed and that these results are robust to different years. The third limitation is the number of variables used in the study, i.e., the data obtained have only allowed the calculation of an efficiency ratio. Calculating other efficiency ratios can clarify the economic and financial situation of these companies. Qualitative variables are expected to be used to predict business failure. Finally, another type of statistical analysis could help to present more robust results. In particular, other discriminant scoring analyses could be used and the results compared with Altman’s Z-score. Future research should take the appropriate steps to overcome these limitations.

Author Contributions

Conceptualisation, R.B.; methodology, V.G.; software, V.G.; validation, V.G.; formal analysis, V.G.; investigation, R.B.; resources, R.B.; data curation, V.G.; writing—original draft preparation, R.B.; writing—review and editing, R.B.; visualisation, R.B.; supervision, R.B. and V.G.; project administration, R.B. and V.G.; funding acquisition, R.B. All authors have read and agreed to the published version of the manuscript.

Funding

The authors declare that they did not receive any funding or financial support from any organisation for the research and publication of this work.

Data Availability Statement

The data that support the findings of this study are available on request from the corresponding author.

Acknowledgments

The authors gratefully acknowledge the Šiauliai State Higher Education Institution for its crucial support in achieving their research goals. They sincerely appreciate the institution’s invaluable assistance throughout this project.

Conflicts of Interest

The authors declare no conflicts of interest.

References

  1. Adland, Roar, Joakim Noraas, and Rikke S. Iversen. 2017. Capital structure determinants of shipbuilding companies. International Journal of Shipping and Transport Logistics 9: 763–89. [Google Scholar] [CrossRef]
  2. Al Jabri, Asma Mohammed Abdullah, Zouhaier Slimi, Hind Huwaishal Al Yaqoopi, and Umut Mehmet. 2021. Logistic Companies in Oman: Role in Boosting Economy, Implementing Eco-Friendly, Technological Logistics for Sustainable Development. European Journal of Business and Management Research 6: 209–18. [Google Scholar] [CrossRef]
  3. Almatarneh, Zeyad, Baker Akram Falah Jarah, and Mufleh Amin AL Jarrah. 2022. The role of management accounting in the development of supply chain performance in logistics manufacturing companies. Uncertain Supply Chain Management 10: 13–18. [Google Scholar] [CrossRef]
  4. Altman, Edward I. 1968. Financial ratios, discriminant analysis and the prediction of corporate bankruptcy. The Journal of Finance 23: 589–609. [Google Scholar] [CrossRef]
  5. Altman, Edward I., Małgorzata Iwanicz-Drozdowska, Erkki K. Laitinen, and Arto Suvas. 2017. Financial distress prediction in an international context: A review and empirical analysis of Altman’s Z-score model. Journal of International Financial Management & Accounting 28: 131–71. [Google Scholar]
  6. Atayah, Osama Fayez, Mohamed Mahjoub Dhiaf, Khakan Najaf, and Guilherme Francisco Frederico. 2021. Impact of COVID-19 on financial performance of logistics firms: Evidence from G-20 countries. Journal of Global Operations and Strategic Sourcing 15: 172–96. [Google Scholar] [CrossRef]
  7. Barba Navaretti, Giorgio, Davide Castellani, and Fabio Pieri. 2014. Age and Firm Growth: Evidence from Three European Countries. Small Business Economics 43: 823–37. [Google Scholar] [CrossRef]
  8. Bazaras, Darius, and Ramūnas Palšaitis. 2012. Lithuania Transport Service Providers’ Position in The Baltic Sea Region Transport Market. Transport and Telecommunication 13: 271–74. [Google Scholar] [CrossRef]
  9. Bazaras, Darius, and Ramūnas Palšaitis. 2017. Logistics Situation in Lithuania—Changes During 10 Years. Procedia Engineering 187: 726–32. [Google Scholar] [CrossRef]
  10. Blasco, Agustí Segarra, and Mercedes Teruel Carrizosa. 2007. Creación y supervivencia de las nuevas empresas en las manufacturas y los servicios. Economía Industrial 363: 47–58. [Google Scholar]
  11. Brozyna, Jacek, Grzegorz Mentel, and Tomasz Pisula. 2016. Statistical Methods of the Bankruptcy Prediction in the Logistics Sector in Poland and Slovakia. Transformations in Business & Economics 15: 93–114. [Google Scholar]
  12. Coelho, Patricia Megale, Blanca Corona, Roland ten Klooster, and Ernst Worrell. 2020. Sustainability of reusable packaging–Current situation and trends. Resources, Conservation & Recycling 6: 100037. [Google Scholar]
  13. Dablanc, Laetitia, and Dina Rakotonarivo. 2010. The impacts of logistics sprawl: How does the location of parcel transport terminals affect the energy efficiency of goods’movements in Paris and what can we do about it? Procedia-Social and Behavioral Sciences 2: 6087–96. [Google Scholar] [CrossRef]
  14. De Doncker, Helga. 2017. Economic Importance of the Logistics Sector in Belgium, NBB Working Paper, 325. Brussels: National Bank of Belgium, pp. 1–79. ISSN 1784-2476. [Google Scholar]
  15. Dimitras, Augustinos I., Stelios H. Zanakis, and Constantin Zopounidis. 1996. A survey of business failures with an emphasis on prediction methods and industrial applications. European Journal of Operational Research 90: 487–513. [Google Scholar] [CrossRef]
  16. Enterprice Lithuania. 2020. Overview of Lithuania Transport and Logistics Industry. Transport and Logistics. (NACE H49-H53). Available online: https://inovacijuagentura.lt/site/binaries/content/assets/analitika/analytical-products-en/overview-of-lithuanian-transport-and-logistics-industry.pdf (accessed on 30 April 2024).
  17. Erkan, Birol. 2014. The Importance and Determinants of Logistics Performance of Selected Countries. Journal of Emerging Issues in Economics, Finance and Banking 3: 1237–54. [Google Scholar]
  18. Fernandez, Carlos M., Joel Alves, Pedro Dinis Gaspar, Tania M. Lima, and Pedro D. Silva. 2023. Innovative processes in smart packaging. A systematic review. Journal of the Science of Food and Agriculture 103: 986–1003. [Google Scholar] [CrossRef]
  19. Flores-Ureba, Sandra, Vera Gelashvili, Alba Gómez-Ortega, and María Luisa Delgado Jalón. 2023. R&D companies based on their age, size and type of field, are they solvent companies? International Entrepreneurship and Management Journal, 1–23. [Google Scholar] [CrossRef]
  20. Francis, Gatobu H., and Esther Waiganjo. 2014. Role of Supply Chain Practices on Customer Satisfaction in the Printing Industry in Kenya: A Case Study of Morven Kester East Africa Limited. International Journal of Academic Research in Business and Social Sciences 4: 128–43. [Google Scholar] [CrossRef]
  21. Frikha, Rami, and Arbia Hlali. 2023. The Evolution Of Logistics Management Toward The Digital Transition. International Journal of Commerce, Industry and Entrepreneurship Studies 3: 66–75. [Google Scholar]
  22. Galán González, José Luis, and Julio Vecino Gravel. 1997. Las fuentes de rentabilidad de las empresas. [The sources of profitability of companies]. Revista Europea de Dirección y Economía de la Empresa 6: 21–36. [Google Scholar]
  23. Gelashvili, Vera, Alba Gomez-Ortega, and Sandra Flores-Ureba. 2023. Transport companies based on their size and management type: Has COVID-19 conditioned their solvency? Economic Research-Ekonomska istraživanja 36: 2163510. [Google Scholar] [CrossRef]
  24. Gelashvili, Vera, Eva María Aguilar Pastor, María-Jesús Segovia-Vargas, and María-del-Mar Camacho-Miñano. 2019. The economic and financial viability of sheltered employment centres: Is the level of managerial professionalization a determining factor for profitability? Management Decision 57: 2261–83. [Google Scholar] [CrossRef]
  25. Gelashvili, Vera, María-Jesús Segovia-Vargas, and María-del-Mar Camacho-Miñano. 2022. What factors condition the financial viability of sheltered employment centres? Empirical evidence. Review of Managerial Science 16: 459–82. [Google Scholar] [CrossRef]
  26. Ghaffarpasand, Omid, Mark Burke, Louisa K. Osei, Helen Ursell, Sam Chapman, and Francis D. Pope. 2022. Vehicle Telematics for Safer, Cleaner and More Sustainable Urban Transport: A Review. Sustainability 14: 16386. [Google Scholar] [CrossRef]
  27. Giovanni, Axel, Devi Wahyu Utami, and Thesya Yuzevin. 2020. Leverage dan Profitabilitas dalam Memprediksi Financial Distress Perusahaan Pertambangan Periode 2016–2018. Journal of Business and Banking 10: 151. [Google Scholar] [CrossRef]
  28. He, Meiling, Lei Zeng, Xiaohui Wu, and Jianqiang Luo. 2019. The Spatial and Temporal Evolution of Logistics Enterprises in the Yangtze River Delta. Sustainability 11: 5318. [Google Scholar] [CrossRef]
  29. Hofmann, Erik, and Kerstin Lampe. 2013. Financial statement analysis of logistics service providers: Ways of enhancing performance. International Journal of Physical Distribution & Logistics Management 43: 321–42. [Google Scholar]
  30. Hu, Yaofeng, Zhan Qi, Di Wang, and Yansen Wu. 2022. Empirical Analysis of the Relationship Between Altman’s Z-Score and Stock Performance Based on Airline Companies Listed in the United States. Proceedings of Business and Economic Studies 5: 51–58. Available online: http://ojs.bbwpublisher.com/index.php/PBES (accessed on 29 April 2024).
  31. Hussain, Fawad, Iqtidar Ali, Shakir Ullah, and Madad Ali. 2014. Can Altman Z-score model predict business failures in Pakistan? Evidence from textile companies of Pakistan. Journal of Economics and Sustainable Development 5: 110–15. [Google Scholar]
  32. Ibáñez, Pedro Carmona, Julián Martínez Vargas, and José Pozuelo Campillo. 2013. Diagnóstico económico-financiero de la empresa cooperativa. Un estudio comparado de los años 2004 y 2007. REVESCO. Revista de Estudios Cooperativos 110: 43–95. [Google Scholar]
  33. Idrees, Sheikh Mohammad, Mariusz Nowostawski, Roshan Jameel, and Ashish Kumar Mourya. 2021. Security Aspects of Blockchain Technology Intended for Industrial Applications. Electronics 10: 951. [Google Scholar] [CrossRef]
  34. Ilchenko, Nataliia, and Olha Freiuk. 2020. Evolution of logistics management concepts in e-commerce. Economics & Education 5: 56–62. [Google Scholar]
  35. Indah, Lia Nur, Budi Prasetya, and Eva Purnamasari. 2023. Effect of Profitability, Financial Leverage, and Sales Growth on Financial Distress of Transportation and Logistics Sector Companies Listed on the Indonesia Stock Exchange 2020–2022. JOBS (Jurnal of Business Studies) 9: 105–16. [Google Scholar]
  36. International Freight Forwarding Services. 2023. The Future of Logistics: How Technology Is Revolutionizing the Supply Chain. October 15. Available online: https://www.linkedin.com/pulse/future-logistics-how-technology-revolutionizing-supply-5viyc (accessed on 29 April 2024).
  37. Irawan, Agus, Adi Prasetyo, and Dwi Irawan. 2021. Analysis of Financial Distress in Transportation Companies with the Altman Z-Score Approach. Review of Applied Accounting Research 1: 1–8. [Google Scholar] [CrossRef]
  38. Jahanshahi, Asghar Afshar, Fatma Sonmez Cakir, Ozan Kalaycioglu, and Zafer Adiguzel. 2024. Economic Impacts and Financial Strategies of Turkish Logistics Companies During the COVID-19 Crisis. IEEE Engineering Management Review 52: 69–83. [Google Scholar] [CrossRef]
  39. Jang, Seung Wook, and Woo Chul Ahn. 2021. Financial analysis effect on management performance in the Korean logistics industry. The Asian Journal of Shipping and Logistics 37: 245–52. [Google Scholar] [CrossRef]
  40. Juozapaitis, Mantgirdas, and Ramunas Palsaitis. 2017. Feasibility Analysis of Establishing Logistics Clusters in Lithuania. Procedia Engineering 178: 131–36. [Google Scholar] [CrossRef]
  41. Kang, Hyo-Won, Grace W. Y. Wang, Hee-Seok Bang, and Su-Han Woo. 2016. Economic performance and corporate financial management of shipping firms. Maritime Economics & Logistics 18: 317–30. [Google Scholar]
  42. Karpavičienė, Deimantė, and Valentinas Navickas. 2020. Evaluating of Economic Viability of Logistics Companies. Sociálno-Ekonomická Revue 3: 24–33. [Google Scholar]
  43. Kherbach, Oualid, and Marian Liviu Mocan. 2016. The importance of logistics and supply chain management in the enhancement of Romanian SMEs. Procedia—Social and Behavioral Sciences 221: 405–13. [Google Scholar] [CrossRef]
  44. Kumar, Vinod, Kamel A. Fantazy, Uma Kumar, and Todd A. Boyle. 2006. Implementation and management framework for supply chain flexibility. Journal of Enterprise Information Management 19: 303–19. [Google Scholar] [CrossRef]
  45. Kücher, Alexander, Stefan Mayr, Christine Mitter, Christine Duller, and Birgit Feldbauer-Durstmüller. 2020. Firm age dynamics and causes of corporate bankrup. Review of Managerial Science 14: 633–61. [Google Scholar] [CrossRef]
  46. Lagneaux, Frédéric. 2008. Economic Importance of Belgian Transport Logistics. NBB WORKING PAPER No. 125. Brussels: National Bank of Belgium, pp. 1–77. [Google Scholar]
  47. Lambert, Douglas M., and Renan Burduroglu. 2000. Measuring and Selling the Value of Logistics. The International Journal of Logistics Management 11: 1–16. [Google Scholar] [CrossRef]
  48. Larson, Paul D., and Arni Halldorsson. 2010. Logistics versus supply chain management: An international survey. International Journal of Logistics: Research and Applications 7: 17–31. [Google Scholar] [CrossRef]
  49. Li, Xiaofei, and Fen Chen. 2021. Impact of logistics development on economic growth: An empirical research from guangdong province in China. Complexity 2021: 9950935. [Google Scholar] [CrossRef]
  50. Liu, Xianghui. 2016. The Impact of Logistics Costs on the Economic Development: The Case of Thailand. BPA Studies. Available online: https://www.bpastudies.org/index.php/bpastudies/article/view/204/388 (accessed on 25 April 2024).
  51. Lozinskaia, Agata, Andreas Merikas, Anna Merika, and Henry Penikas. 2017. Determinants Of The Probability Of Default: The Case Of The Internationally Listed Shipping Corporations. Maritime Policy & Management 44: 37–858. [Google Scholar]
  52. Lukason, Oliver, and Richard C. Hoffman. 2015. Firm failure causes: A population level study. Problems and Perspectives Management 13: 45–55. [Google Scholar]
  53. Marsenne, Maureen. 2020. Analisa Penggunaan Altman’s Z-Score Untuk Memprediksi Kebangkrutan Perusahaan (Studi Kasus pada PT. Bank Permata, Tbk). Balance: Media Informasi Akuntansi dan Keuangan 12: 56–74. [Google Scholar] [CrossRef]
  54. Meidutė, Ieva, Michail Litvinenko, and Artūras Aranskis. 2012. Logistics Cooperation: Integrated Logistics Services. Business: Theory and Practice 13: 343–51. [Google Scholar] [CrossRef]
  55. Nagaraj, R. 2023. The Role of Fleet Management Systems in Modern Businesses. Accountant at ISRLogics. Available online: https://www.linkedin.com/pulse/role-fleet-management-systems-modern-businesses-nagaraj-r?trk=article-ssr-frontend-pulse_more-articles_related-content-card (accessed on 25 April 2024).
  56. Nam, Hyun Jung, and Yo Han An. 2017. Default Risk and Firm Value of Shipping & Logistics Firms in Korea. The Asian Journal of Shipping and Logistics 33: 61–65. [Google Scholar]
  57. Neeraja, B., Mita Mehta, and Arti Chandani. 2014. Supply Chain and Logistics For The Present Day Busines. Procedia Economics and Finance 11: 665–75. [Google Scholar] [CrossRef]
  58. Ngoc, Nguyen Minh, Nguyen Hoang Tien, and To Huynh Thu. 2021. The Impact of Capital Structure on Financial Performance of Logistic Service Providers Listed on Ho Chi Minh City Stock Exchange. Palarch’s Journal of Archaeology of Egypt/Egyptology 18: 688–719. [Google Scholar]
  59. Nguyen, Hong Thi Xuan. 2022. The Effect of COVID-19 Pandemic on Financial Performance of Firms: Empirical Evidence from Vietnamese Logistics Enterprises. Journal of Asian Finance, Economics and Business 9: 177–83. [Google Scholar]
  60. Odeyinka, Olumide F., and Olumide G. Omoegun. 2023. Warehouse Operations: An Examination of Traditional and Automated Approaches in Supply Chain Management. In Operations Management-Recent Advances and New Perspectives. London: IntechOpen, pp. 1–16. [Google Scholar] [CrossRef]
  61. Ortega, Alba Gómez, Vera Gelashvili, and José Angel Rivero Menéndez. 2024. El papel de la contabilidad en el scoring para la alerta temprana de la insolvencia. Economistas 111–20. Available online: https://dialnet.unirioja.es/servlet/articulo?codigo=9309522 (accessed on 25 April 2024).
  62. Ozili, Peterson K. 2022. Banking sector earnings management using loan loss provisions in the Fintech era. International Journal of Managerial Finance 18: 75–93. [Google Scholar] [CrossRef]
  63. Peláez, Irene Moral. 2016. Modelos de regresión: Lineal simple y regresión logística. Revista Seden 14: 195–214. [Google Scholar]
  64. Pisula, Tomasz. 2012. The usage of scoring models to evaluate the risk of bankruptcy on the example of companies from the transport sector. Scientific Journals of Rzeszów University of Technology, Series: Management and Marketing 19: 133–51. [Google Scholar] [CrossRef]
  65. Pisula, Tomasz, Grzegorz Mentel, and Jacek Brozyna. 2013. Predicting Bankruptcy Of Companies From The Logistics Sector Operating in the Podkarpacie Region. Modern Management Review 18: 113–33. [Google Scholar] [CrossRef]
  66. Pokrovskaya, Oksana, Roman Fedorenko, and Aleksandra Musatkina. 2022. The evolution of the logistics ecosystems in the context of COVID-19. Transportation Research Procedia 63: 69–77. [Google Scholar] [CrossRef]
  67. Prusak, Błażej. 2017. Predicting Corporate Bankruptcies in Poland and Lithuania—Comparative Analysis. Intellectual Economics 11: 18–31. [Google Scholar]
  68. Raslavičius, Laurencas, Artūras Keršys, Martynas Starevičius, Jonas Sapragonas, and Žilvinas Bazaras. 2014. Biofuels, sustainability and the transport sector in Lithuania. Renewable and Sustainable Energy Reviews 32: 328–46. [Google Scholar] [CrossRef]
  69. Retolaza, José Luis, Leire San-Jose, and Andrés Araujo. 2014. La eficiencia como reto de las empresas de inserción. REVESCO, Revista de Estudios Cooperativos 115: 159–85. [Google Scholar]
  70. Richard, Hilda. 2020. The Contribution of the Logistics to the Economic Growth: Evidence from Tanzania (2007–2016). Available online: https://papers.ssrn.com/sol3/papers.cfm?abstract_id=3518943 (accessed on 25 April 2024).
  71. Rimienė, Kristina, and Dainora Grundey. 2007. Logistics Centre Concept through Evolution and Definition. Engineering Economics 54: 87–95, Commerce of Engineering Decisions. [Google Scholar]
  72. Ristovska, Natasha, Sasho Kozuharov, and Vladimir Petkovski. 2017. The Impact of Logistics Management Practices on Company’s Performance. International Journal of Academic Research in Accounting, Finance and Management Sciences 7: 245–52. [Google Scholar] [CrossRef]
  73. Salmar, Ott. 2018. Bankruptcy Prediction of Road Transportation Firms: Evidence from Europe. Master’s thesis, University of Tartu, Tartu, Estonia; pp. 1–31. [Google Scholar]
  74. Saputri, Lilis, and Asrori Asrori. 2019. The Effect of Leverage, Liquidity, and Profitability on Financial Distress with the Effectiveness of the Audit Committee as a Moderating Variable. Accounting Analysis Journal 8: 38–44. [Google Scholar]
  75. Sekliuckienė, J., and N. Langvinienė. 2013. The challenges and opportunities for the Lithuanian international trade in services: A case of emerging market. In 6 th International Conference on Services Management: Conference Proceedings. Oxford: Oxford Brookes University, pp. 1002–13. [Google Scholar]
  76. Sezer, Sevgi, and Tezcan Abasiz. 2017. The Impact of Logistics Industry on Economic Growth: An Application in Oecd Countries. Eurasian Journal of Social Sciences 5: 11–23. [Google Scholar] [CrossRef]
  77. Shi, Yin, and Xiaoni Li. 2024. Bankruptcy prediction for the European aviation industry: Anapplication of the Altman model. Managerial Decision Economics 45: 477–91. [Google Scholar] [CrossRef]
  78. Shin, Yuhyung, Sun Young Sung, Jin Nam Choi, and Min Soo Kim. 2015. Top Management Ethical Leadership and Firm Performance: Mediating Role of Ethical and Procedural Justice Climate. Journal of Business Ethics 129: 43–57. [Google Scholar] [CrossRef]
  79. Situm, Mario. 2014. The age and the size of the firm as relevant predictors for bankruptcy. Journal of Applied Economics and Business 2: 5–30. [Google Scholar]
  80. Sodiya, Enoch Oluwademilade, Uchenna Joseph Umoga, Olukunle Oladipupo Amoo, and Akoh Atadoga. 2024. AI-driven warehouse automation: A comprehensive review of systems. GSC Advanced Research and Reviews 18: 272–82. [Google Scholar] [CrossRef]
  81. Statista Research Department. 2023. Turnover in the Transport Industry in Lithuania 2020, by Sector. Available online: https://www.statista.com/statistics/448863/lithuania-turnover-volume-in-the-transport-sector-by-mode/ (accessed on 24 April 2024).
  82. Stošić, Mihajlović Ljiljana, and Svetlana Trajković. 2020. The Importance of Logistics And Supply Chains for Pandemia Conditions. Journal of Process Management—New Technologies, International 8: 53–59. [Google Scholar] [CrossRef]
  83. Succurro, Marianna. 2012. Bankruptcy systems and economic performance across countries: Some empirical evidence. European Journal of Law and Economics 33: 101–26. [Google Scholar] [CrossRef]
  84. Surwanti, Arni, Ramdan Fauzi, and Rosnia Masruki. 2022. Predicting Corporate Bankruptcy in Indonesia’s Transportation Industry. Journal of Applied Management 20: 276–88. [Google Scholar] [CrossRef]
  85. Thakur, Anusha. 2022. A Conceptual Market Analysis of Automated Vehicles for Logistics in Future. Journal of Supply Chain Management Systems 11: 24–37. [Google Scholar]
  86. Tomasz, Tomasz. 2013. The Importance of Logistics in Business Activity of Enterprises. Technika Transportu Szynowego koleje-tramvaje-metro 10: 1055–60. [Google Scholar]
  87. Tseng, Yung-yu, Wen Long Yue, and Michael A. P. Taylor. 2005. The role of transportation in logistics chain. Eastern Asia Society for Transportation Studies 5: 1657–72. [Google Scholar]
  88. UK Essay. 2017. How logistics improvements affect the economy. marHe Economy. Available online: https://www.ukessays.com/essays/commerce/logistics-management-how-logistics-improvements-effect-the-economy-commerce-essay.php (accessed on 18 June 2024).
  89. Vaičiūtė, Kristina, Aušra Katinienė, and Gintautas Bureika. 2022. The Synergy between Technological Development and Logistic Cooperation of Road Transport Companies. Sustainability 14: 14561. [Google Scholar] [CrossRef]
  90. Van Hoa, Nguyen, Pham Van Thu, Nguyen Thanh Dat, and Le Thanh Loan. 2023. Analysis of the business environment of the logistics and the construction industry in Vietnam after COVID-19. International Journal of Advanced Multidisciplinary Research and Studies 3: 316–28. [Google Scholar]
  91. Vienažindienė, Milita, Vilma Tamulienė, and Jurgita Zaleckienė. 2021. Green Logistics Practices Seeking Development of Sustainability: Evidence from Lithuanian Transportation and Logistics Companies. Energies 14: 7500. [Google Scholar] [CrossRef]
  92. Wang, Grace W. Y., Su-Han Woo, and Joan Mileski. 2014. The relative efficiency and financial risk assessment of shipping companies. Maritime Policy & Management 41: 651–66. [Google Scholar]
  93. Winarno, Slamet Heri. 2019. Analisis NPM, ROA, dan ROE dalam Mengukur Kinerja Keuangan. Jurnal STEI Ekonomi 28: 254–66. [Google Scholar] [CrossRef]
  94. Woo, Su-Han, Min-Su Kwon, and Kum Fai Yuen. 2021. Financial determinants of credit risk in the logistics and shipping industries. Maritime Economics & Logistics 23: 268–90. [Google Scholar]
Figure 1. Proposed research model. Source: own elaboration.
Risks 12 00099 g001
Figure 2. Size of companies by number of employees. Source: own elaboration.
Risks 12 00099 g002
Figure 3. Proposed research model result. Source: own elaboration.
Risks 12 00099 g003
Table 1. Final study sample.
Initial Sample of Logistics Companies in Lithuania3192
(-) No 2022 economic–financial data in ORBIS−2376
The sample with 2022 economic–financial data in ORBIS816
(-) Sample with data missing for any variable during the period−263
The sample with complete economic–financial data553
(-) Sample with data missing for any descriptive variable −137
Final study sample416
Source: own elaboration.
Table 2. Description of the variables.
Profitability ratios
Return on assets (ROA)(Operating result/total assets) * 100
Return on equity (ROE)(Net result/equity) * 100
Profit margin on sales(Net income/net sale) * 100
Liquidity ratios
Current ratioCurrent assets/current liabilities
Quick ratio(Current assets − inventory)/current liabilities
Cash ratioCash and cash equivalent/current liabilities
Solvency ratios
Solvency ratioEquity/total assets
Indebtedness(Non-current liabilities + equity)/non-current assets
Efficiency ratio
Assets turnoverNet sales/average total assets
Descriptive variables
AGETotal liabilities/total assets
SIZESize of firm based on total assets and number of employees
Number of employeesNumber of employees in the firm for 2022
TurnoverRevenue from total sales or rendering the services
Source: own elaboration.
Table 3. Descriptive statistics.
NMinimumMaximumMeanStd. Deviation
ROA 416−62.9594.5714.9419.34
ROE 416−882.63409.6533.7674.49
Profit margin416−28.8583.416.3510.63
Current ratio4160.0045.291.952.90
Acid test 4160.009.960.571.12
Cash ratio4160.005.310.491.12
Solvency ratio416−85.8596.9533.8327.25
Indebtedness4160.01362.7661.6685.58
Assets turnover4160.00198.0510.8515.40
Number of employees4161248448146.53
AGE4160.1432.1213.797.79
Turnover (thousands)41640.451,930,126.0018,574.37115,423.18
Source: own elaboration.
Table 4. Profitability ratios by quartiles.
ROA ROE Profit Margin
N (valid)416416416
Mean14.9433.766.35
QuartilesQ13.337.751.20
Q211.2928.973.61
Q322.9861.688.30
Source: own elaboration.
Table 5. Liquidity ratios by quartiles.
Current RatioAcid TestCash Ratio
N (valid)416416416
Mean1.950.570.49
QuartilesQ11.030.060.05
Q21.290.280.20
Q31.781.070.47
Source: own elaboration.
Table 6. Solvency ratios by quartiles.
Solvency RatioIndebtedness Ratio
N (valid)416.00416.00
Mean33.8361.66
QuartilesQ116.484.66
Q231.9720.17
Q351.7376.01
Source: own elaboration.
Table 7. Z -score table.
Safe ZoneGrey ZoneDistress Zone
3732320
%90%5%5%
Source: own elaboration.
Table 8. Logit model results.
Z-ScoreCoef.Robust Std. Err.zp > t[95% Conf. Interval]
AGE−0.01227390.0208741−0.590.557−0.05318640.0286385
SIZE−0.36576910.1947814−1.880.060 −0.74753370.0159956
_cons306.5560.46691846.570.000 2.150.4163.980.703
Source: own elaboration.
Disclaimer/Publisher’s Note: The statements, opinions and data contained in all publications are solely those of the individual author(s) and contributor(s) and not of MDPI and/or the editor(s). MDPI and/or the editor(s) disclaim responsibility for any injury to people or property resulting from any ideas, methods, instructions or products referred to in the content.