Article

Beneath the Surface: Disentangling the Dynamic Network of the U.S. and BRIC Stock Markets’ Interrelations Amidst Turmoil

by
Neenu Chalissery
1,
T. Mohamed Nishad
1,
J. A. Naushad
1,
Mosab I. Tabash
2,* and
Mujeeb Saif Mohsen Al-Absy
3
1
Research Department of Commerce and Management Studies, Farook College (Autonomous) Kozhikode, University of Calicut, Kozhikode 673632, India
2
Department of Business Administration, College of Business, Al Ain University, Al Ain P.O. Box 64141, United Arab Emirates
3
Accounting and Financial Science Department, College of Administrative and Financial Science, Gulf University, Sanad 26489, Bahrain
*
Author to whom correspondence should be addressed.
Risks 2024, 12(12), 202; https://doi.org/10.3390/risks12120202
Submission received: 9 October 2024 / Revised: 30 November 2024 / Accepted: 11 December 2024 / Published: 13 December 2024
(This article belongs to the Special Issue Risk Analysis in Financial Crisis and Stock Market)

Abstract

:
The study examines the time-varying correlation and return spillover mechanism among developed (U.S.) and emerging (BRIC) stock markets during major crises from 2000 to 2023, namely the global financial crisis, COVID-19, and the Russia–Ukraine war. To do so, we used dynamic conditional correlation (DCC-GARCH) and time-varying parameter vector autoregression (TVP-VAR) models. This study finds that the nature of market crises plays a significant role in the interrelationship and return spillover mechanisms among the U.S. and BRIC stock markets. The interconnectedness of the stock markets was strengthened by crises such as the GFC and the COVID-19 pandemic. On the other hand, the Russia–Ukraine war temporarily disrupted the interrelationships between the markets. The study yields valuable insight to local and international investors in portfolio diversification and risk management strategies during market turbulence.
JEL Classification:
D53; G01; G11; C58

1. Introduction

Over the past decade, cross-market connectivity has been a significant issue for market participants. A shift in one stock market can influence the returns and volatility of another, significantly impacting portfolio risk evaluation (Mensi et al. 2018). No nation is currently economically autonomous from the global community. Thus, information rapidly influences asset prices both locally and globally. The ongoing integration of worldwide financial markets has rendered the study of co-movements increasingly pertinent and significant (Bhuyan et al. 2016). The enhanced interconnectedness of global financial markets has facilitated unrestricted capital mobility, but it has also resulted in heightened volatility spillovers, especially between emerging and developed economies (Mensi et al. 2016).
Like other emerging markets, the BRICS markets have numerous intriguing commonalities. They have consistently generated elevated average returns with comparatively modest correlations to those of established markets. Nonetheless, their returns are comparatively more predictable than those of developed markets. These characteristics indicate that emerging markets have evolved into a significant asset class, with their allocations in international and specialised portfolios gaining importance due to the diversification advantages they offer to investors in developed markets (Mensi et al. 2016). In the last ten years, the BRICS nations contributed more than 30 percent to the growth of global output. Foreign investors are augmenting their exposure to these markets via direct investment or through equity and debt funds. The connection to international capital markets has intensified, and stock exchanges in BRICS nations have emerged as a crucial avenue for global portfolio diversification (Lakshmi et al. 2015). Moreover, global investors can formulate specialised investment strategies for the BRICS markets, considering their shared attributes of elevated average returns, significant idiosyncratic volatility, enhanced market efficiency, and improved capital mobility (Hammoudeh et al. 2016). Nonetheless, BRICS markets typically exhibit poorer liquidity compared to established financial markets and more volatility, characterised by frequent and erratic fluctuations, often influenced by numerous local occurrences and significant global events (Lakshmi et al. 2015). Thus, it is important to analyse the interconnection of BRIC markets with developed ones.
Because of the continuous processes of financial liberalisation and economic openness, the degree of integration between emerging stock markets and the global market has increased over the past few decades (Todea 2016). The United States, as an economic powerhouse, has been a principal economic partner for most emerging nations, especially the BRIC nations, serving as a significant importer and provider of outsourced business opportunities (Bhuyan et al. 2016). A total of 16% of the world market capitalisation is contributed by BRICS countries; at the same time, the United States contributes 36%. Additionally, BRICS is the largest contributor to the global list of listed companies. Moreover, the BRIC nations account for 22% of global GDP (with China contributing 15%, India 3%, and Brazil and Russia contributing 2% each), while the United States alone accounts for 25%. Over the past 20 years, the BRICS countries have experienced a higher compound annual growth rate than developed nations such as the U.S. (Panda et al. 2021). Shifts in the U.S. macroeconomic conditions adversely impact economic and stock market performance in BRICS nations by reducing exports and capital inflows. Consequently, global shocks, particularly those emanating from the U.S. market, might be conveyed to BRICS stock markets (Bouri et al. 2018). In this context, we are particularly concerned about the dynamics of market connectedness and spillover mechanisms between the U.S. and the BRIC markets.
It is a well-established fact that stock market correlations increase during adverse market conditions (Das and Uppal 2004; Dungey et al. 2015; Škrinjarić and Šego 2020). Previous research has investigated alterations in financial market behaviours, including abrupt shifts that hold significant ramifications for the analysis of crisis propagation and systemic risk (Bekaert and Harvey 2003; Bekaert et al. 2014; Dungey et al. 2015; Forbes and Rigobon 2002). This body of literature commonly indicates that the transmission of shocks, as seen by return correlations, dependencies, and volatility spillovers between markets, intensifies during crises, demonstrating the presence of contagion effects across financial markets. The BRICS nations are significant recipients of global financial flows and are prominent consumers of commodities worldwide. Because of this, changes in global economic factors may help bring about changes in global economic and financial conditions, like the global financial crisis, to the BRICS stock markets, which would then affect their economic growth (Mensi et al. 2014).
In this area of interest, this paper looks into the intricacies of market connectivity and spillover mechanisms between the U.S. and BRIC markets across three major crises, namely, the global financial crisis of 2008, the global pandemic of COVID-19, and the recent Russian–Ukrainian war. This study stands out in the market connectedness literature as it incorporates major stock markets and notable crises that affected global stock markets from 2000 to 2023. Unlike previous research, this study employs a multifaceted approach, combining the dynamic conditional correlation (DCC) GARCH and time-varying parameter (TVP) VAR models. This integrated methodology yields superior results and enhances our comprehension of market connectedness and spillover dynamics. The study finds that the nature of market crises plays a significant role in the interrelationship and information spillover mechanisms among U.S. and BRIC stock markets. Global crises like the 2008 financial crisis and the COVID-19 pandemic strengthened the interconnectedness of the stock market. On the contrary, the Russia–Ukraine war temporarily disrupted the interrelationships between the U.S. and BRIC markets.
The remaining paper consists of Five sections. The Section 2 describes the theoretical background of the problem, followed by a description of the methodology in Section 3. Section 4 reports the results. Section 5 discusses the major findings. The last section concludes the work with major implications.

2. Study Background and Literature Review

In an era of escalating significance for emerging markets, recent research has examined the ways in which return and volatility from developed markets spill over to emerging markets (Yadav et al. 2023; Dahir et al. 2020; Nath Mukherjee and Mishra 2010; Todea 2016; Bhar and Nikolova 2009; Rejeb and Boughrara 2015; and Kumar and Dhankar 2017). In this context, Bekaert and Harvey (2000), Carrieri et al. (2007), and Greenwood-Nimmo et al. (2021) found that there is significant co-movement among developed and developing markets. While Wang and Wang (2010) examined the relationship between Greater China and the U.S. and Japan, Miyakoshi (2003) investigated the return and volatility spillovers from Japan and the U.S. to seven Asian markets, and they discovered that the U.S. and Japan have an impact on the fluctuations of Chinese and Asian markets. Further, Alfreedi (2019) focused on the shock and volatility spillover and the conditional variance–covariance between the stock markets of developed nations, such as the U.S., the U.K., and China, and the stock markets of the Gulf Cooperation Council (GCC) nations. The returns and volatility spillovers between emerging capital markets in Southeast Asia, Latin America, and Central and Eastern Europe were investigated by Gębka and Serwa (2007), and they proposed that the interconnections among emerging markets underscores the significance of shared factors in intra-regional interdependencies and goes beyond their mutual reliance on the global capital market.
Meanwhile, a number of studies examined the co-movements between the U.S. and BRICS markets (Bhuyan et al. 2016; Bouri et al. 2018; Hammoudeh et al. 2016; Lakshmi et al. 2015; McIver and Kang 2020; Muguto and Muzindutsi 2022; Wen et al. 2022; Xu and Hamori 2012). Syriopoulos et al. (2015) presented analogous findings, investigating the dynamic risk–return characteristics of BRICS stock markets and demonstrating time-varying correlations and volatility spillover effects with the U.S. market. Similarly, Bhuyan et al. (2016) indicated that the U.S. stock market has considerable mean return and volatility spillover effects on the BRICS stock markets. Further, Dimitriou et al. (2013) revealed substantial dynamic connections between the stock markets of the U.S. and BRICS nations. Consistent with the findings of Zhang et al. (2013), as well as Aloui et al. (2011), the findings indicate that Brazil and Russia exhibit better relationships with developed nations compared to India and China. Bhuyan et al. (2016) identified that the U.S. market exerts considerable mean and volatility spillover effects on Brazil, Russia, India, and South Africa. Bhar and Nikolova (2009) analysed the degree of integration of the BRIC nations with their respective regions and the global economy. They determined that India exhibits the highest degree of integration at both regional and global levels, whereas China remains regionally fragmented.
Moreover, studies, particularly those focusing on the impact of the market crisis on stock market connectedness and risk transmission, are receiving more attention among researchers (Bhar and Nikolova 2007; Habiba et al. 2020; Rehman et al. 2022; Yousaf et al. 2022). In general, researchers emphasise that the association between the U.S. and BRICS markets is exceedingly erratic during times of global economic upheaval (Dakhlaoui and Aloui 2016). Regarding the impact of the global financial crisis of 2008, Wang (2014) examined the stock market connections between the United States and six prominent East Asian nations, demonstrating that the global financial crisis (GFC) has intensified these links. Mensi et al. (2016) analysed the spillover effect between the U.S. market and five significant emerging stock markets, specifically those of the BRICS countries, and derived implications for portfolio risk modelling and forecasting by considering periods preceding and succeeding the recent global financial crisis (GFC). McIver and Kang (2020) identified temporal fluctuations in volatility correlation and large dynamic spillovers among these stock markets, together with an amplified influence of uncertainty on spillovers. Market spillovers escalated following the onset of the global financial crisis and the ensuing European sovereign debt crisis. It is further documented that the connectedness among the markets will rise significantly during crisis periods (Gong et al. 2019). In the wake of pivotal global events, ranging from the seismic shockwaves of the global financial crisis (Morales and Andreosso-O’Callaghan 2012) and debt crisis to the unprecedented challenges posed by the COVID-19 pandemic (Ben Amar et al. 2021; Yu et al. 2021; Zhang et al. 2020; Cepoi 2020; Chakrabarti et al. 2021; Rehman et al. 2022; Yu et al. 2022; Derbali et al. 2022), and the geopolitical tensions exemplified by the Russia–Ukraine war. While research consistently underscores the heightened interdependence during crisis periods, Ben Amar et al. (2021) provided a compelling revelation of a distinctive disconnect, spotlighting the resilience of the American emerging market amidst the tumultuous currents of the global financial markets during the challenging era of the COVID-19 pandemic. Anyikwa and Phiri (2023) analysed volatility contagion between the U.S. and five BRICS financial markets amid the COVID-19 pandemic and the Russian–Ukrainian crisis. The market spillover during the two crises reveals markedly distinct scenarios. The United States exerted a more substantial and enduring contagion effect on the BRICS markets during the COVID-19 pandemic. Nonetheless, a transient and pulsatile market reaction is observed during the initial phase of the Russian–Ukrainian crisis. However, most of these studies have concentrated on the impact of a single crisis. To the best of our knowledge, no previous studies have compared the effect of major crises that happened between 2000 and 2023, considering the global financial crisis of 2008, COVID-19, and the Russian–Ukrainian war. This study addresses this gap in the literature.
This research primarily contributes to the current literature by illustrating interconnectedness and recognising countries as sources of shock spillover during various market crises. Even though previous studies provide valuable insights, most of the previous studies have solely determined the existence of connectedness or cointegration through cointegration or causality tests. First, we examined the connections and information flows between the U.S. and BRIC markets by considering three major crises that affect stock markets, namely, the global financial crisis of 2008, the COVID-19 pandemic, and the Russia–Ukraine war. This provides information about cross-market linkages and compares the impact of different crises on market connectedness. Secondly, we used DCC-GARCH and time-varying parameter vector autoregression methods to obtain a better idea of how connectivity and spillover effects work.

3. Data and Methodology

3.1. Data

The study used the stock price data of the BRIC (which forms part of the BRICS Union and is included in the leading seven emerging markets list) and the U.S. markets for the time period ranging from January 2000 to March 2023. The study chooses SandP 500 (USA), BOVESPA (Brazil), MOEX (Russia), SandP BSE Sensex (India), and the Shanghai Composite Index (China) as the broad market indices. As the aim of the study is to scrutinise the time varying connectedness and information transmission mechanisms between the U.S. and BRIC markets across various crisis periods, the whole sample period is divided into sub-sample periods as follows: pre-GFC (January 2000 to December 2007), GFC (January 2008 to June 2009), pre-COVID-19 (July 2009 to November 2019), COVID-19 (December 2019 to July 2020), pre-Russia–Ukraine war (August 2020 to January 2022), and Russia–Ukraine war (February 2022 to March 2023). The daily stock price data of selected stock indices were collected from investing.com.

3.2. Methodology

3.2.1. Dynamic Condition Correlation (DCC) GARCH

This study used dynamic conditional correlation GARCH (DCC-GARCH) to analyse the dynamic relationship between the U.S. and BRIC markets during the full sample and sub-sample periods (pre-crisis and crisis periods) to know whether there is any change in the nature of the relationship between these markets during economic crises, health crises, and country war periods. As a preliminary step, the return series is calculated as follows:
r i = P t P t 1 P t 1
The DCC model is based on a two-stage procedure: first, we fit a GARCH (1,1) model of Bollerslev (1986), which reduces the number of parameters by imposing non-linear restrictions.
The mean and variance equations under the GARCH (1,1) model are
Y t = + ε t
h t = ω + α ε t 1 2 + β h t 1
The mean equation is a function of a constant and standardised residual, which follows ε t ~ N ( 0 , σ 2 ) , whereas the variance equation is a function of a constant term, a squared lagged residual from the mean equation to represent the volatility from the previous period and forecasted variance from the past.
In the second step, a DCC model for the return series of U.S. and BRIC markets is constructed. Bollerslev (1986) introduced a class of multivariate GARCH models, specifically the Constant Conditional Correlation (CCC-MGARCH), in which the conditional correlations are time-invariant. However, the assumption that the random shocks have a time-invariant conditional correlation may not be supported empirically. Christodoulakis and Satchell (2002), Tse and Tsui (2002), Engle (2002), and Engle and Sheppard (2001) proposed a generalisation of the CCC model in order to let the conditional correlation matrix be time-variant. Tse and Tsui (2002) introduced a varying correlation GARCH model in which the conditional correlations are a function of the conditional correlation of the previous period.
The DCC-GARCH model of Tse and Tsui (2002) has the following form:
H t = D t R D t  
R t = 1 θ 1 θ 2 R + θ 1 ψ t 1 + θ 2 R t 1
where Dt is defined as D t = d i a g h 11 t 1 2 h k k t 1 2 , R is a symmetric k × k positive definite parameters matrix with unit diagonal elements, ψ t 1 is the k × k corelation matrix of the past P standardised residuals ( ε ^ t 1 ε ^ t p ). A necessary condition to ensure the positivity of ψ t 1 is P k and θ 1 and θ 2 are non-negative scalar parameters satisfying θ 1 +   θ 2 < 1 , ensuring that R is mean-reverting. Moreover, Engle (2002) proposed a different dynamic conditional correlation model. The DCC model of Engle (2002) assumes that the covariance matrix is decomposed as follows:
H t = D t R t D t
R t = d i a g   q 11 t 1 2 q k k t 1 2 Q t d i a g q 11 t 1 2 q k k t 1 2
where Q t is a symmetric k × k positive definite matrix containing the conditional covariance of standardised residuals given by
Q t = 1 θ 1 θ 2 Q 0 + θ 1 η t 1 η t 1 + θ 2 Q t 1
where Q 0 is the unconditional covariance matrix of η t ,   θ 1 and   θ 2 are non-negative scalar parameters satisfying θ 1 + θ 2 < 1 , where θ 1 represents the impact of the last shock on a current conditional correlation, and θ 2 captures the impact of past correlation. If θ 1 and   θ 2 are statistically significant, the conditional correlation is not constant. The DCC model is estimated in two stages. In the first stage, Q t is used to calculate the dynamic conditional correlation:
ρ i i , t = q i j ( q i i , t q j j , t ) 1 / 2
In the second stage, ρ i j , t is used to estimate the conditional covariance:
h i j , t = ρ i j ( h i i , t h j j , t ) 1 / 2
where h i i , t ( h j j , t ) and h i j , t are the conditional variance and conditional covariance generated by using univariate GARCH models.

3.2.2. Time-Varying Parameter Vector Autoregression (TVP-VAR) Approach

This study used the time-varying parameter vector autoregression (TVP-VAR) connectedness approach, as suggested by Antonakakis et al. (2020) which is combined with the work of Diebold and Yilmaz (2012) to examine the return spillover mechanism among global (USA) and regional (BRIC) markets during the entire sample period and sub-sample periods. The TVP-VAR-based connectivity approach has a number of benefits compared to the conventional spillover framework. The precise estimation of parameters, the greater resistance to outliers, and the removal of the rolling window size requirement are the major benefits of this methodology (Diebold and Yilmaz 2014). The analysis starts with the following TVP-VAR framework estimation Antonakakis et al. (2020):
Z t = B t z t 1 + u t u t     ~   N 0 , S t
v e c B t   = v e c B t 1 + v t v t ~ N ( 0 , R t )
where Z t , z t 1 a n d u t are dimensional vectors, R t is a k 2 × k 2 dimensional parameter variance–covariance matrix, B t and S t are k × k dimensional time-varying parameters, whereas v e c B t   and v t are k 2 × 1 . This method includes all indices ( B t   ) changing throughout time, as well as the connection between series. Moreover, the B t and S t variance–covariance matrices are considered to be time-varying.
The study utilises the world representation theorem to convert the TVP-VAR to its vector moving average (VMA) representation in order to compute the generalised impulse response function and generalised forecast error variance decomposition. The H-step in front of the influence of a shock in variable j on variable i is illustrated by the calculation of the generalised forecast error variance decomposition (GFEVD) of Koop et al. (1996) and Pesaran and Shin (1998):
ψ i j g H = τ τ i i 1   h = 0   H 1 ( e i ψ h   τ   τ   e j ) h = 0 H 1 ( e i ψ h   τ   τ   ψ h   τ   e i )
ψ   ~ H i j g = ψ   ( H ) i j g j = 1 H   ϕ   ( H ) i j g
A zero vector with unity at the ith location is represented by e i . Two equalities result from this normalisation: j = 1   k ψ   ~ H = 1   i j g and j = 1   k ψ   ~ H = k .   i j g
The total directional connectivity “TO” of other variables is determined in order to determine the overall influence variable i has on all other variables j:
c i j g H = j = 1 ,   i j k ψ   ~ H i j g
After that, the directional connectedness “FROM” of other variables is used to assess the effect of shocking all other variables j on variable i.
c i j g H = j = 1 ,   i j k ψ   ~ H i j g
As a result of the disparities between the total directional connectedness “FROM” and “TO” of other variables, the net total directional connectedness is produced, which may be thought of as the net influence variable i has on the network under analysis.
c i g H = c i j g H c i j g H
The final measure of connectedness is the adjusted total connectedness index (TCI):
T C I H = i , j = 1 , i 1   ψ   ~ H   i j g k   N 100  

4. Results

4.1. Summary Statistics

The stationarity of log return is tested using the Augmented Dickey–Fuller (ADF) and Phillips–Perron (PP) tests in Table 1, which show that each of the series is stationary. This means that the series can be forecasted and generalised (Sahadudheen and Kumar 2023).
Further, the summary statistics of selected markets are presented in Table 2, which summarises the average return, variance, skewness, and kurtosis of selected markets. In the long run (the full sample period), the average returns of Russia and India are higher (0.000461 and 0.000404), and China had a negative average return. The average return of the U.S. market is 0.000167, which is lower compared to the emerging markets (except in the case of China). These results support the previous research findings that emerging markets have a higher return than developed markets, and that the variance (risk) is also higher in those markets. As seen in the summary statistics, the variance in return is higher for BRIC markets (except in the case of China, which has a negative return). The variance is higher for Russia (0.019912), followed by Brazil (0.017296).
In the long run, all the markets exhibit negative skewness and excess kurtosis, which implies that the stock market may generate either a very large or very small future return. During the period of the GFC and the Russia–Ukraine war, the skewness was positive for all BRIC markets, except in the case of China during the Russia–Ukraine war period. The measure of normality, the Jarque–Bera test statistics of the full sample and sub-sample periods, indicates that all returns are not normally distributed, as it rejects the null hypothesis of normality by proving a random walk process. While comparing the average return and risk in each of these markets, the pattern is different across market turbulence periods and the periods immediately preceding those crises. The U.S. and BRIC stock markets report a negative average return during the time of the GFC; the BRIC market shows a negative return in the time of the COVID-19 pandemic (the U.S. market shows a positive return); in the Russia–Ukraine war time, the U.S. and Brazil show a negative return, while all other markets report a positive return. It can be summarised that the economic crisis, health crisis, and war are having different effects on these markets. The global financial crisis of 2008 affected the developed and BRIC markets similarly, while the COVID-19 pandemic is more affected by the BRIC market than the developed one. In periods immediately preceding the crises, the average market return is positive for all the markets, except in the case of China (during the pre-GFC period) and India (during the pre-Russia–Ukraine war period). By examining the nature of the volatility during crisis periods, the risk is higher for emerging BRIC markets than for the U.S. market.

4.2. Dynamic Conditional Correlation Among Markets

Before analysing the dynamic conditional correlation, we used the ARCH-LM test to check for volatility clustering during each sample period, followed by GARCH modelling. The ARCH-LM test confirms the presence of volatility clustering in each of the return series under consideration, with a p-value of less than 1%. Table 3 presents the results of the GARCH (1,1) model. The coefficient of the mean equation in the GARCH (1,1) model for all series in all sample periods is significant. We select the optimum lag length of 6 based on the Akaike Information Criterion (AIC).
We use the DCC-GARCH (1,1) model to understand the time-varying correlation, and present the parameters and diagnostic test results in Table 4. The DCC rho coefficient shows that the relationship between the U.S. and BRIC markets is positive and significant for all sample periods, except for during the Russia–Ukraine war. The nature of the relationships among the markets in the period immediately preceding the Russia–Ukraine war and during the war period differed from that in previous crisis periods. There is no significant correlation between the markets of India and other markets in the pre-war period, and during the war period, there was no correlation between the Russian market and other markets. The short-run (DCCα) and long-run (DCCβ) relationships are evident in the case of the whole sample period. In crisis periods (the GFC and the COVID-19 pandemic), only DCCα is significant, and for before and during the RUW period, DCCα is significant but not highly significant, even though DCCβ is highly significant.

4.3. Average Connectedness Among Markets

Table 5 presents the static return connectedness among the U.S. and BRIC markets in different sample periods. In crisis-wise analysis, it is seen that the total return spillover among the U.S. and BRIC markets is 51.65% for the whole sample period, and it is increased to 54.33% in the GFC period and 71.33% in the COVID-19 period. The total connectedness was at its lowest (30.74%) during the Russia–Ukraine war period. The connectedness among the markets was found to be strong during the periods of the financial crisis and the COVID-19 pandemic. In this regard, the subprime mortgage crisis, which led to the U.S. financial crisis of 2008, affected credit availability, liquidity, and investor confidence worldwide. The relationship was strengthened because BRIC countries’ stock markets reacted similarly to changes in the U.S. market because they were also deeply entwined with international supply chains and financial markets. The governments and central banks, including those in the U.S. and the BRIC countries, implemented coordinated monetary and fiscal policies in 2019 as well. Incentives such as stimulus packages, interest rate reductions, and quantitative easing increased liquidity, stabilised markets, and aided in the recovery. Global stock markets consequently moved in lockstep, strengthening the interconnections between them. In contrast, the Russia–Ukraine war caused substantial volatility in the markets for commodities, especially petrol and oil. Although Russia briefly profited from rising energy prices, major energy importers like China and India faced inflationary pressures. Divergent effects were produced on each stock market as a result.
Regarding the spillover across the markets during different sample periods, Brazil is the major contributor (56.38%) to FEVD in the whole sample period, followed by China (54.9%) and the USA (54.43%). India is the lowest contributor to FEVD in the long run and is the net receiver of shocks from other markets. China highly spills over to the USA (16.25%), followed by Russia (14.01) and Brazil (12.48%). The U.S. market spills 15.93% to Brazil, 14.08% to India, and 12.68% and 11.75% to Russia and China, respectively. There is a high level of information transmission from the USA and China to India. According to earlier research, China’s economic reforms, which began in 1978, have strengthened its position as the world’s largest economy. There are significant concerns regarding China’s potential threat to other transition economies due to its expansionist policies and increasing dominance in the 21st century. China has developed a stronghold on the global economy over time. China now contributes 15% of the global economy, and in the near future, this is predicted to rise to 30% (Chen et al. 2020). Similarly to China, the USA has long been a superpower with enormous influence over international relations, trade, and economic expansion. With robust trade and external relations with the aforementioned nations, India’s economy is among the fastest-growing in the world. Although China is India’s top importer, the USA is the country’s largest export market. India’s imports from China reportedly increased by 51.7% to USD 68.4 billion in 2021, while the country’s exports increased by 42.5% to USD 21.9 billion. Apart from trade, India is the recipient of the largest amount of foreign investment from the United States of America. Furthermore, China’s and the United States’ foreign policies greatly influence India’s foreign policy, both internally and externally.

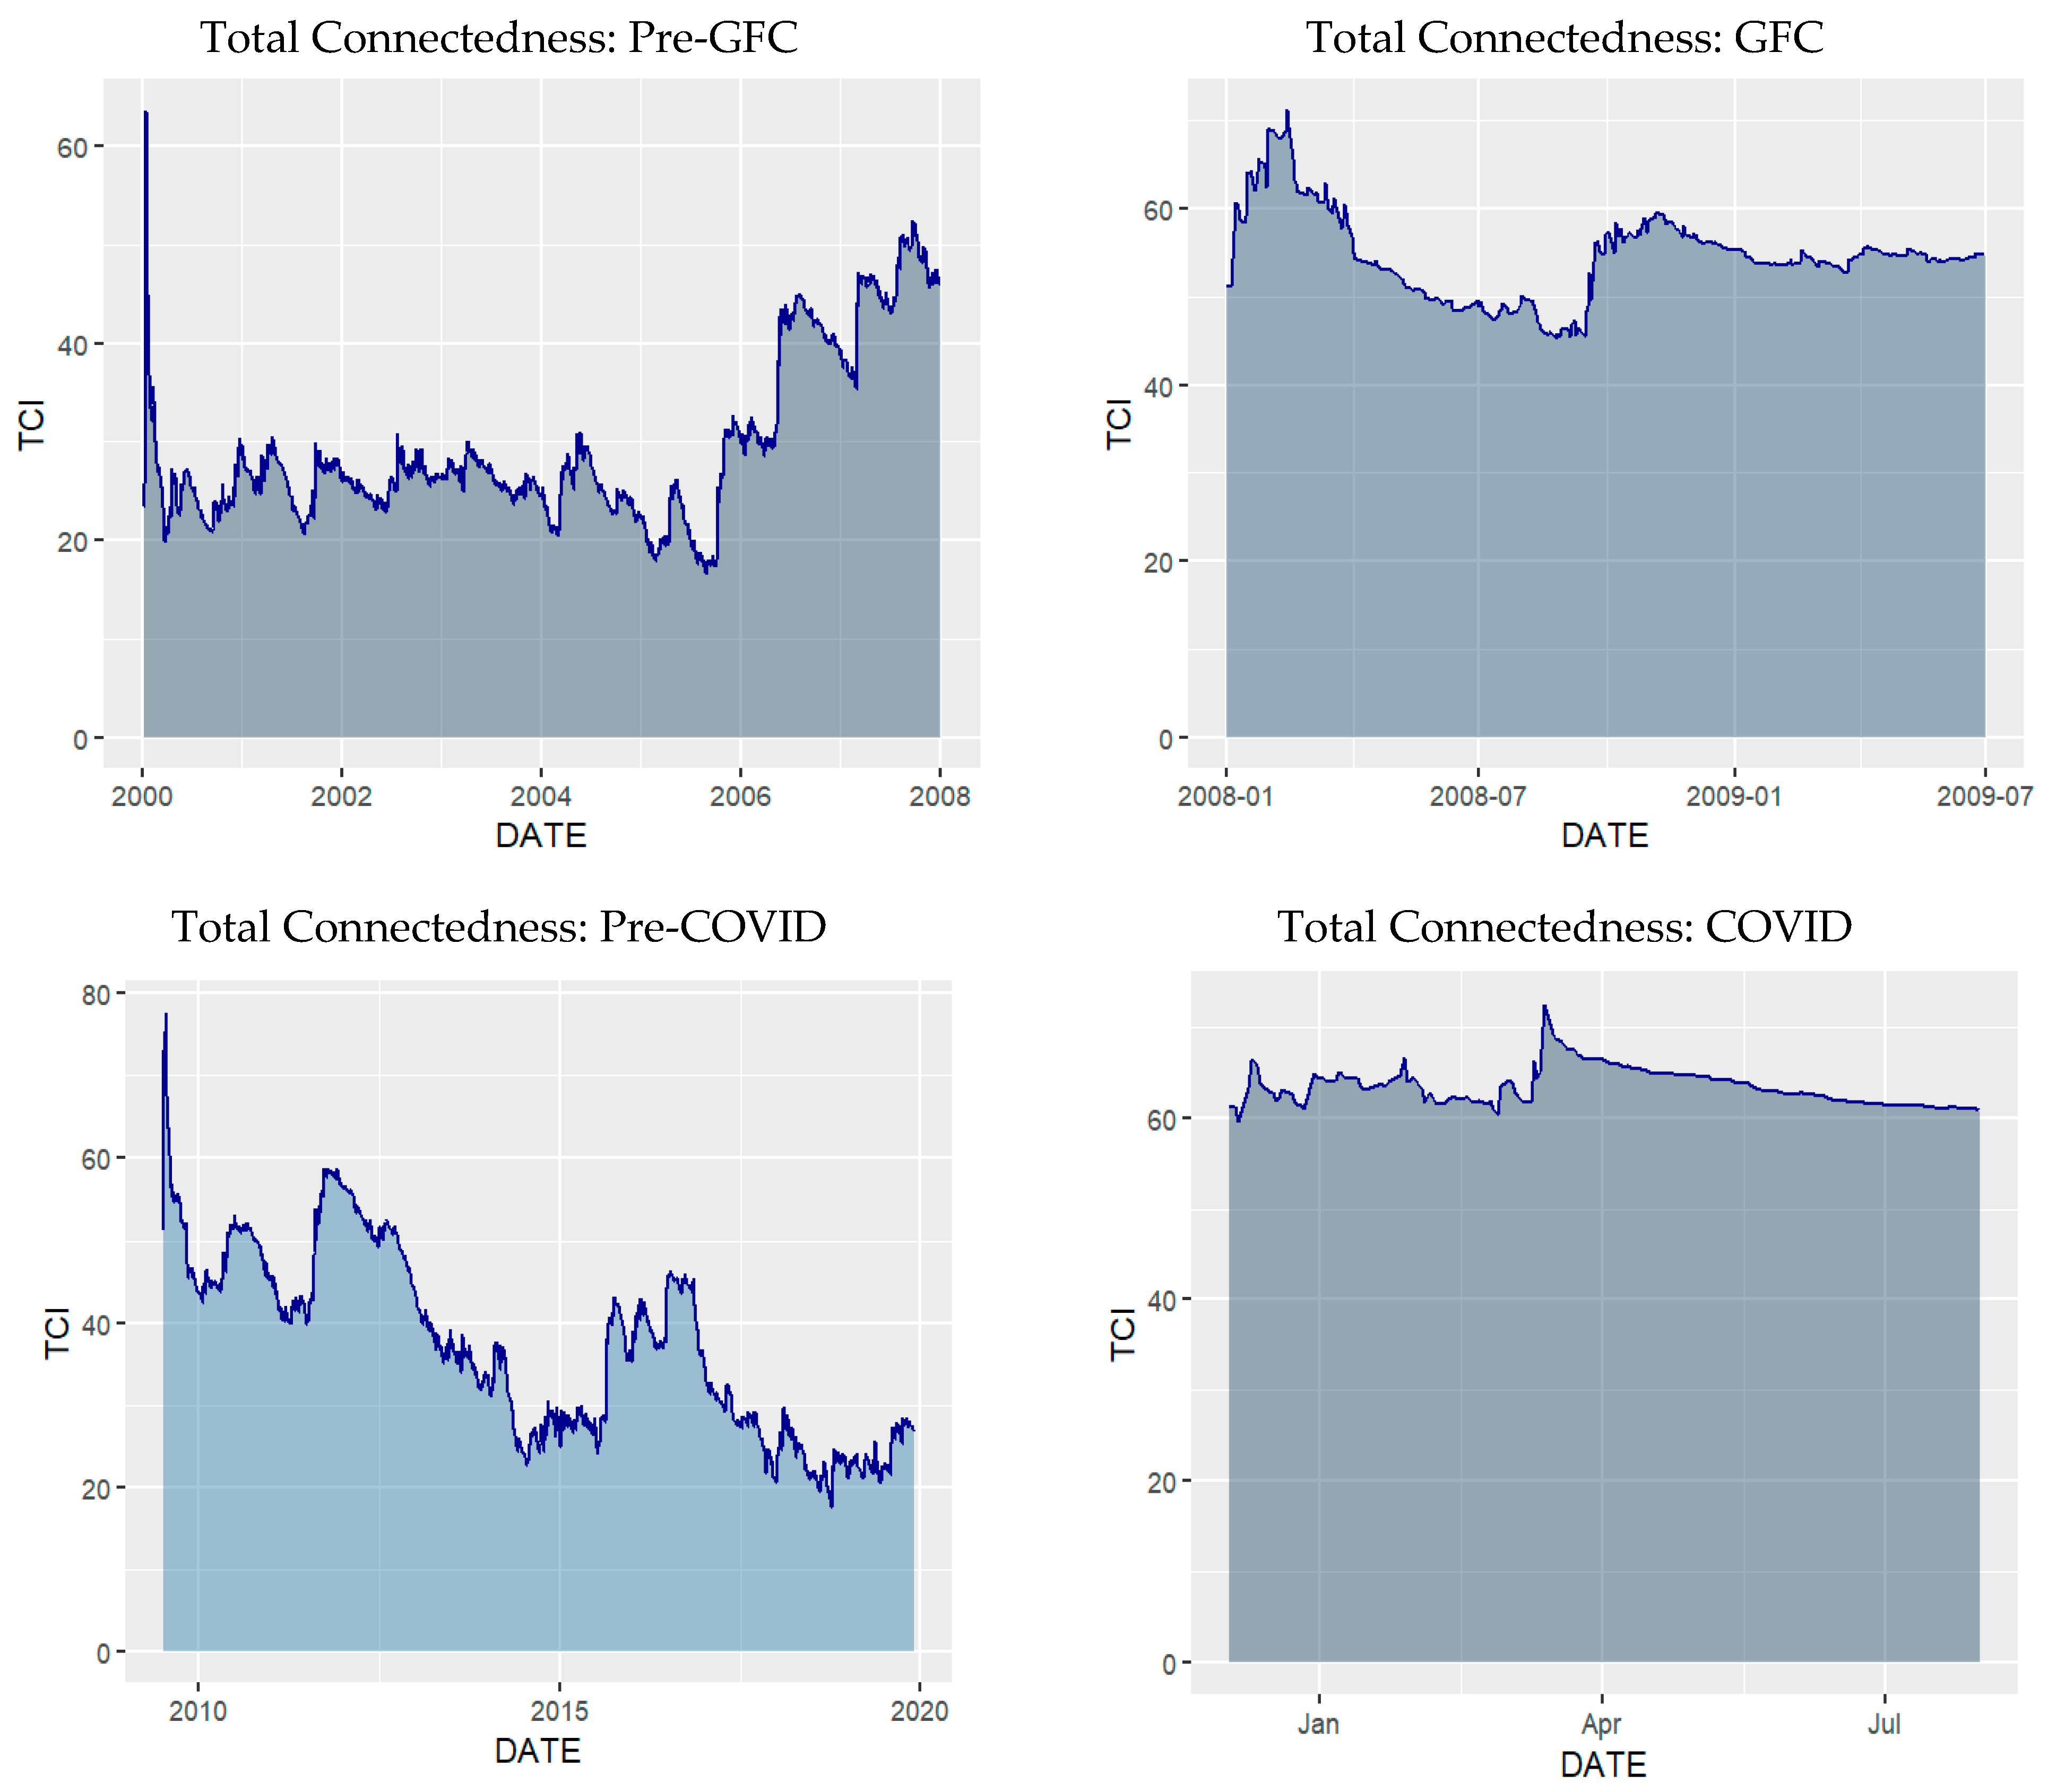
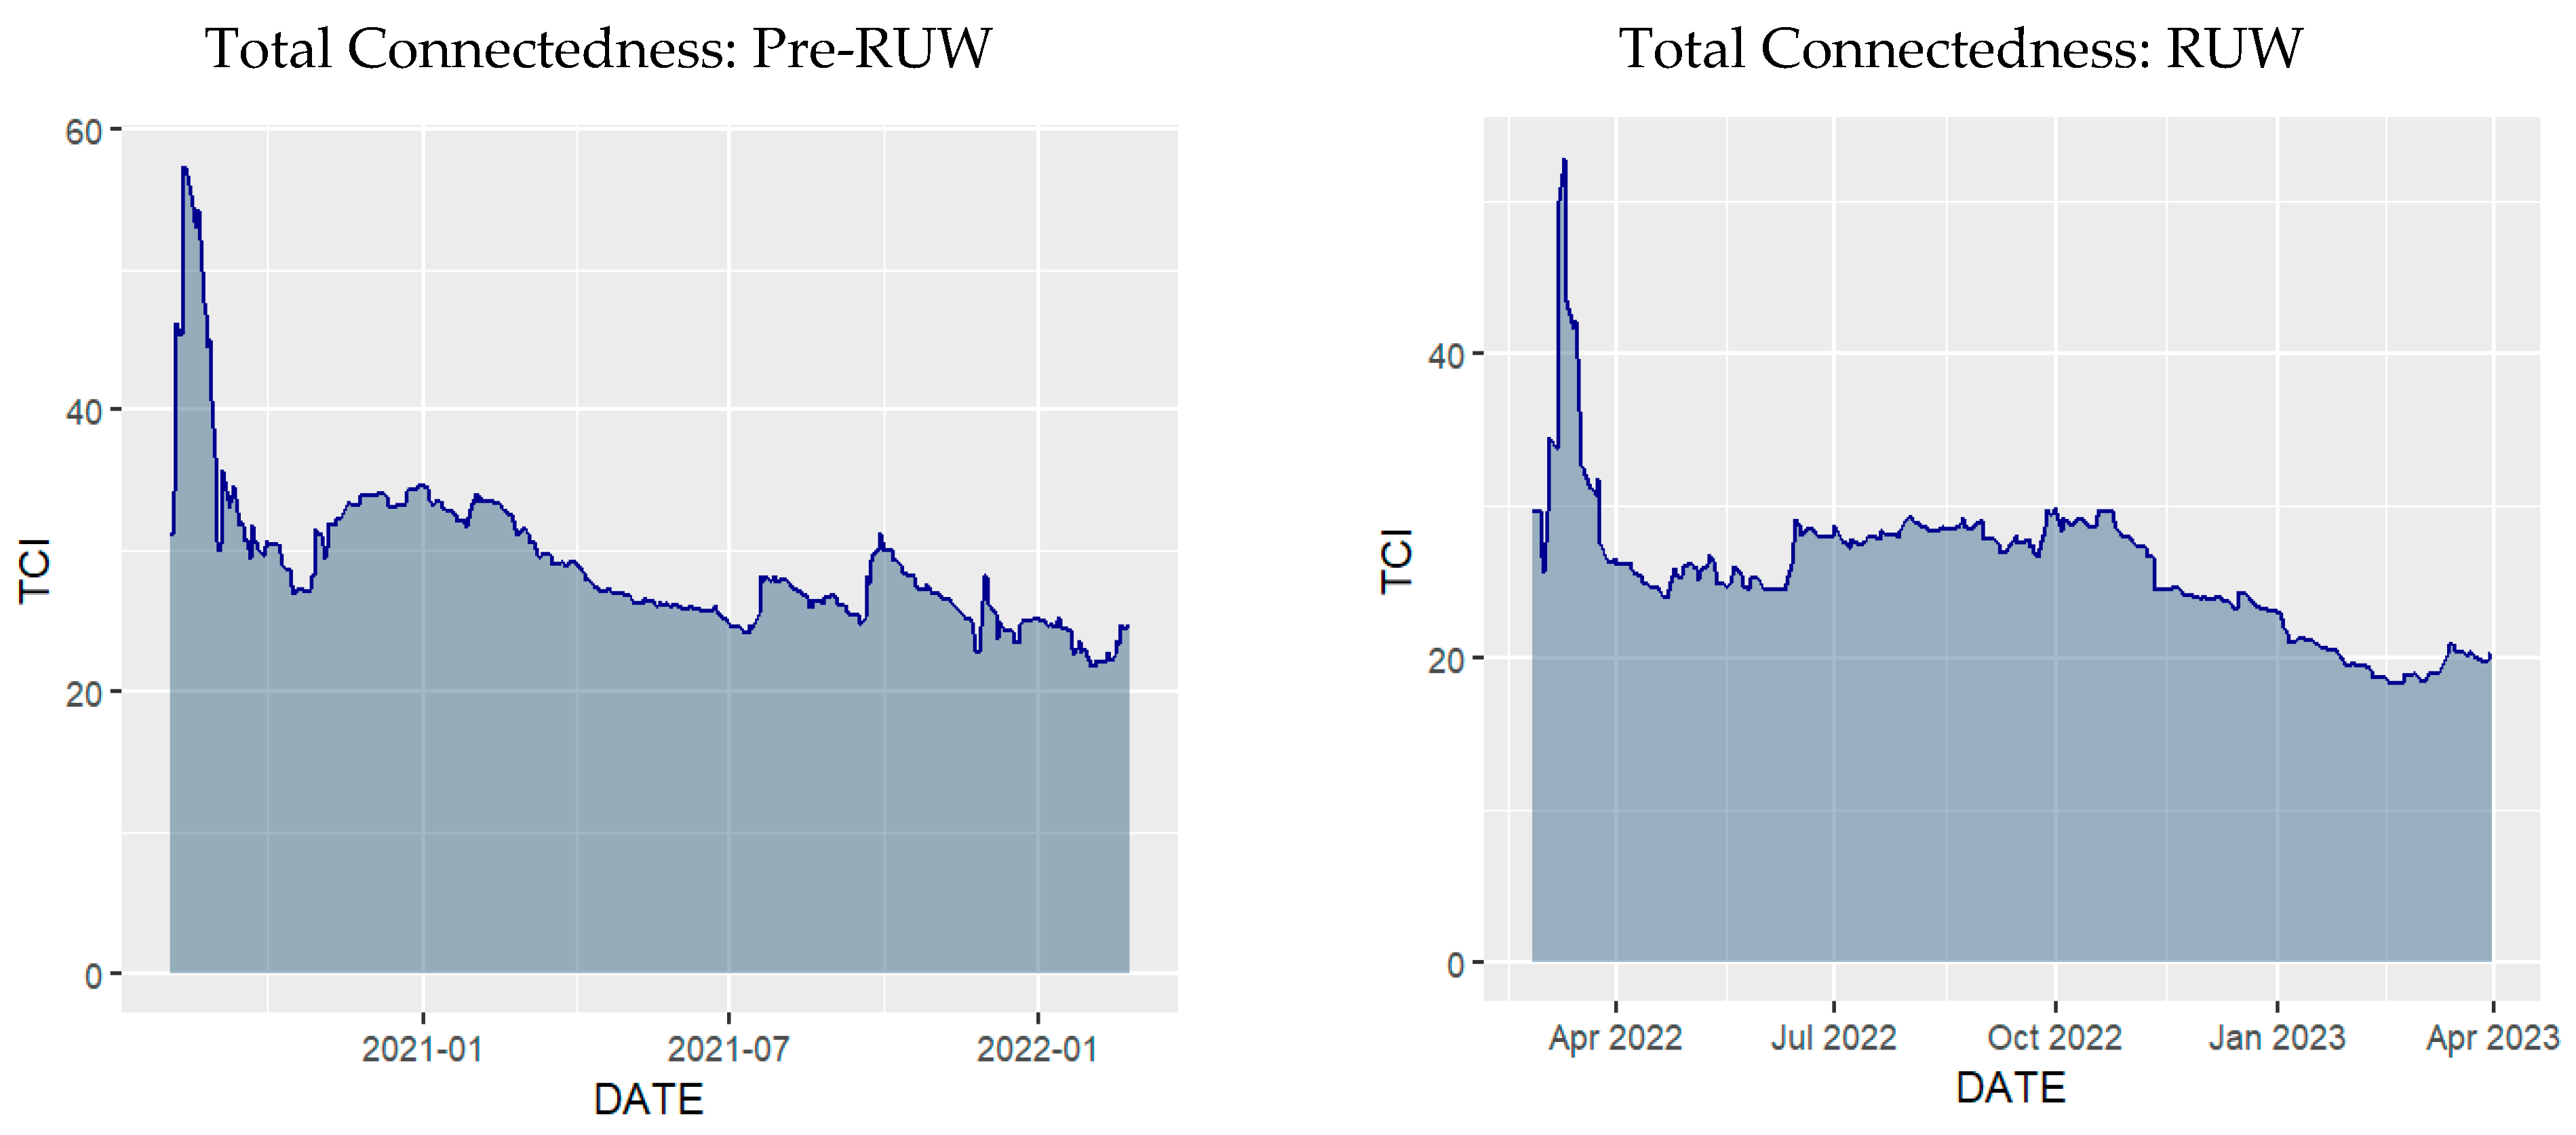
4.4. Total Dynamic Connectedness Among Markets

In addition to the static connectedness among the markets, this study also discusses dynamic connectedness through time-varying total connectedness and net connectedness. The total connectedness of markets over different sample periods is depicted in Figure 1. There is a noticeable increase in overall connectedness during the COVID-19 pandemic and the global financial crisis (GFC), with peak levels of roughly 65% during these times. This increased interconnectedness suggests that the economic disruptions that occurred during these crises had profound effects on international markets. On the other hand, the overall connectedness decreased during the conflict between Russia and Ukraine, indicating that the economic shocks were not as widely dispersed or intricately linked. Total connectedness varied frequently before the crises, indicating a less stable and more dynamic economic environment. Nonetheless, complete interconnectedness stayed nearly constant during the crises themselves, underscoring the persistent and widespread character of economic disruptions during these periods. This pattern highlights the relative containment of the impact of the Russia–Ukraine war on global market connectivity, as well as the strong and extensive effects of the GFC and COVID-19 pandemic in comparison to previous periods.

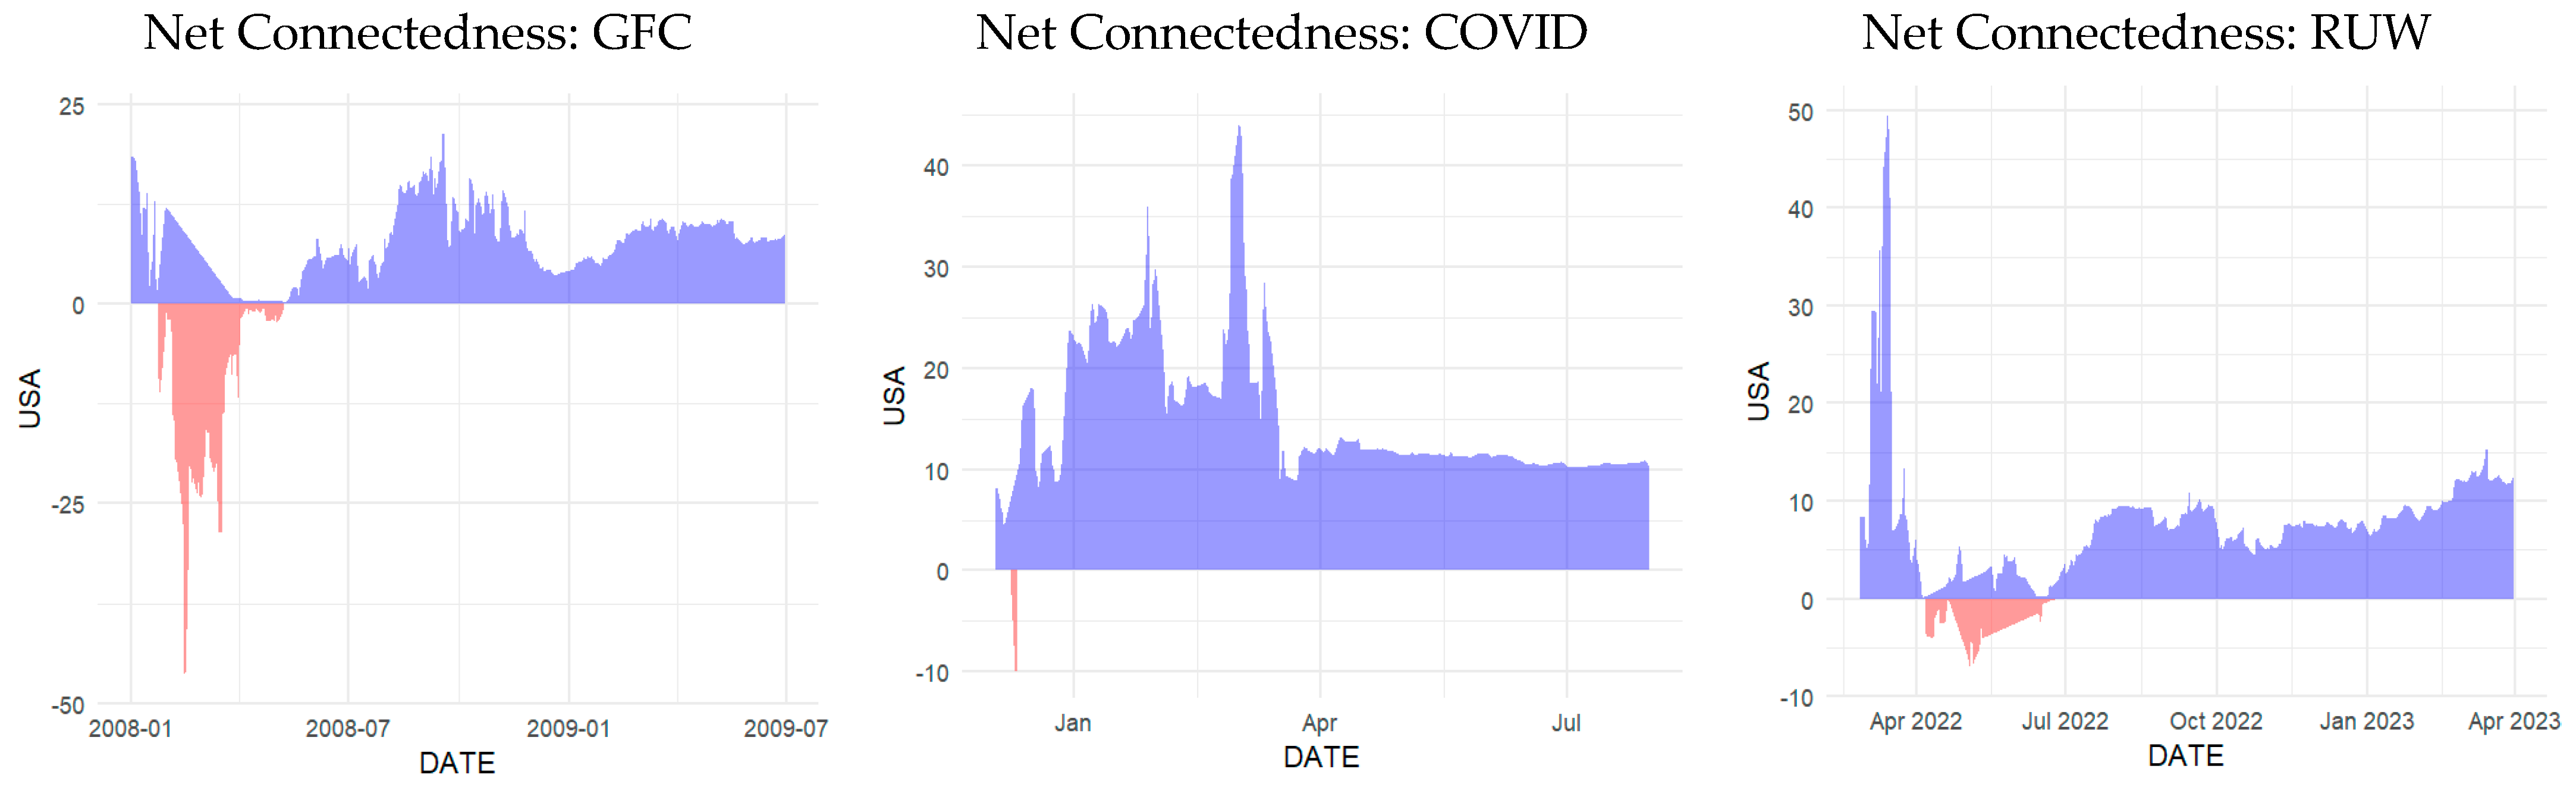
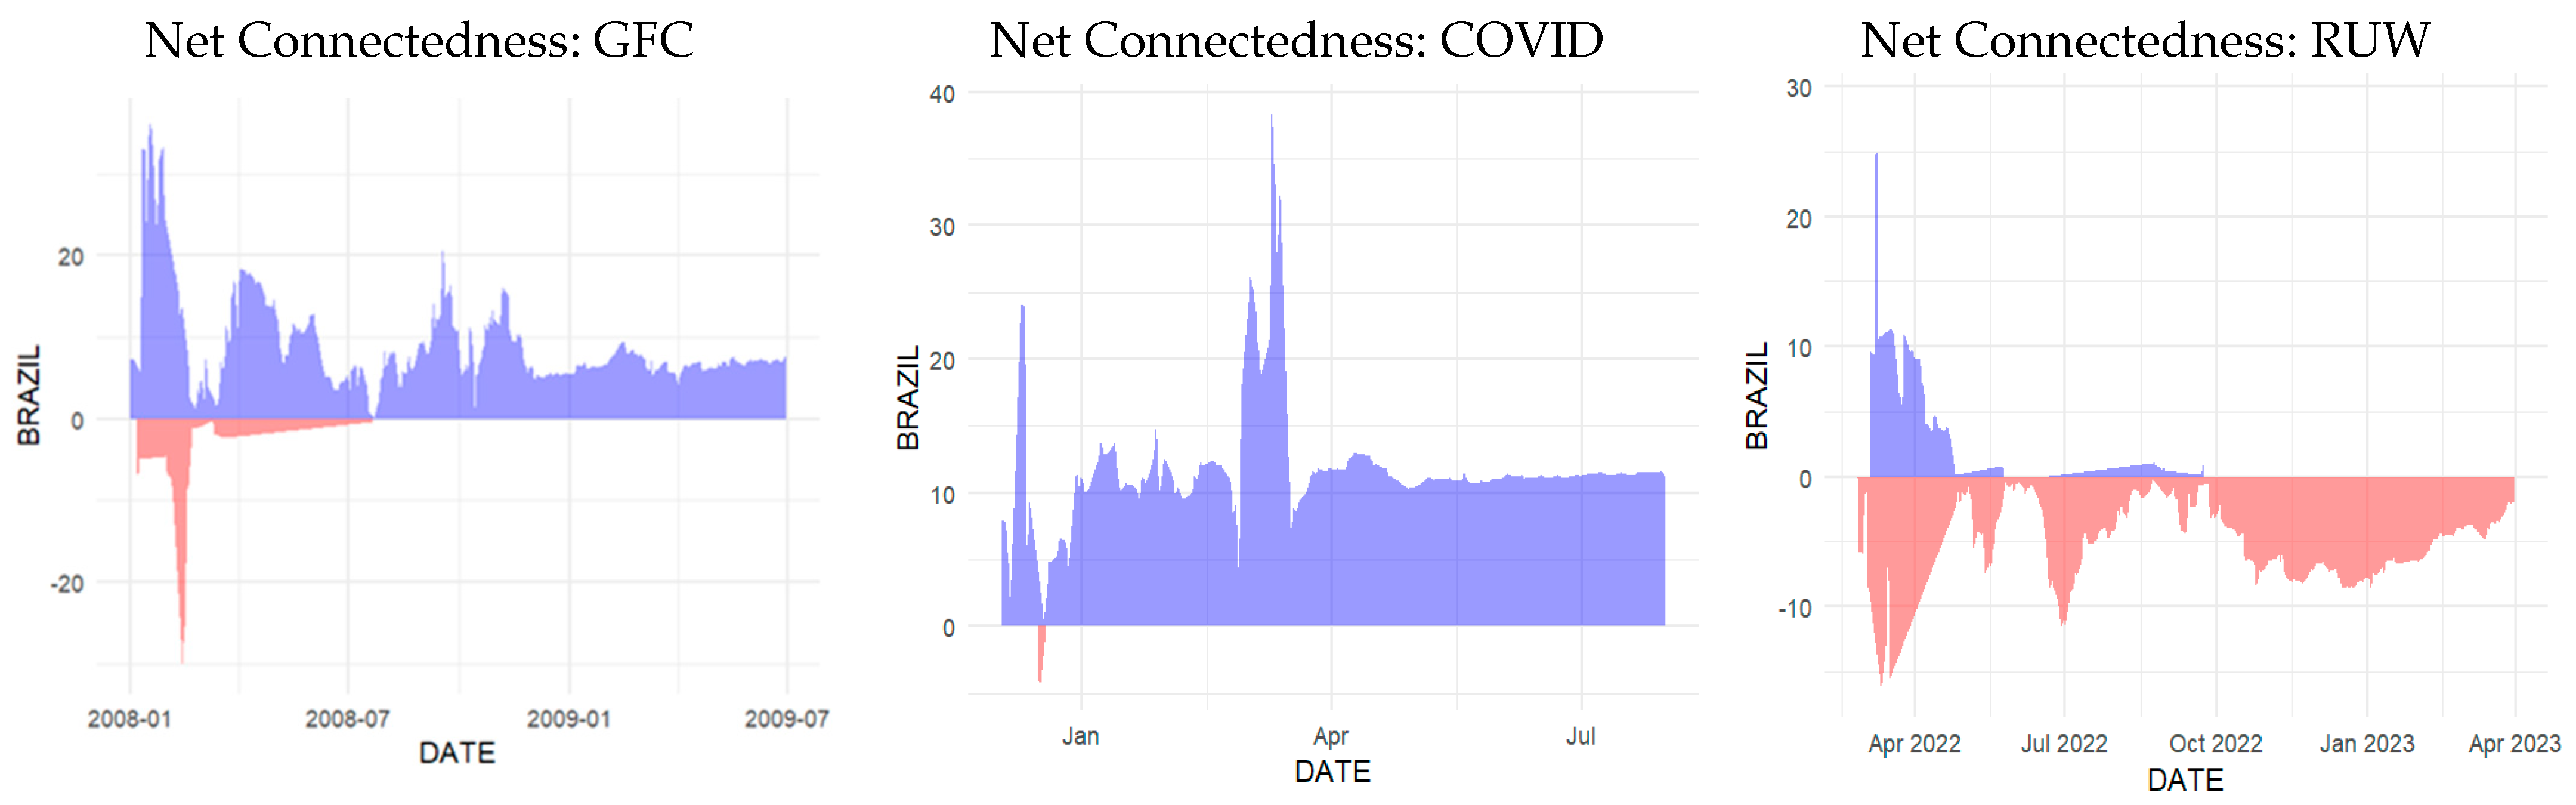
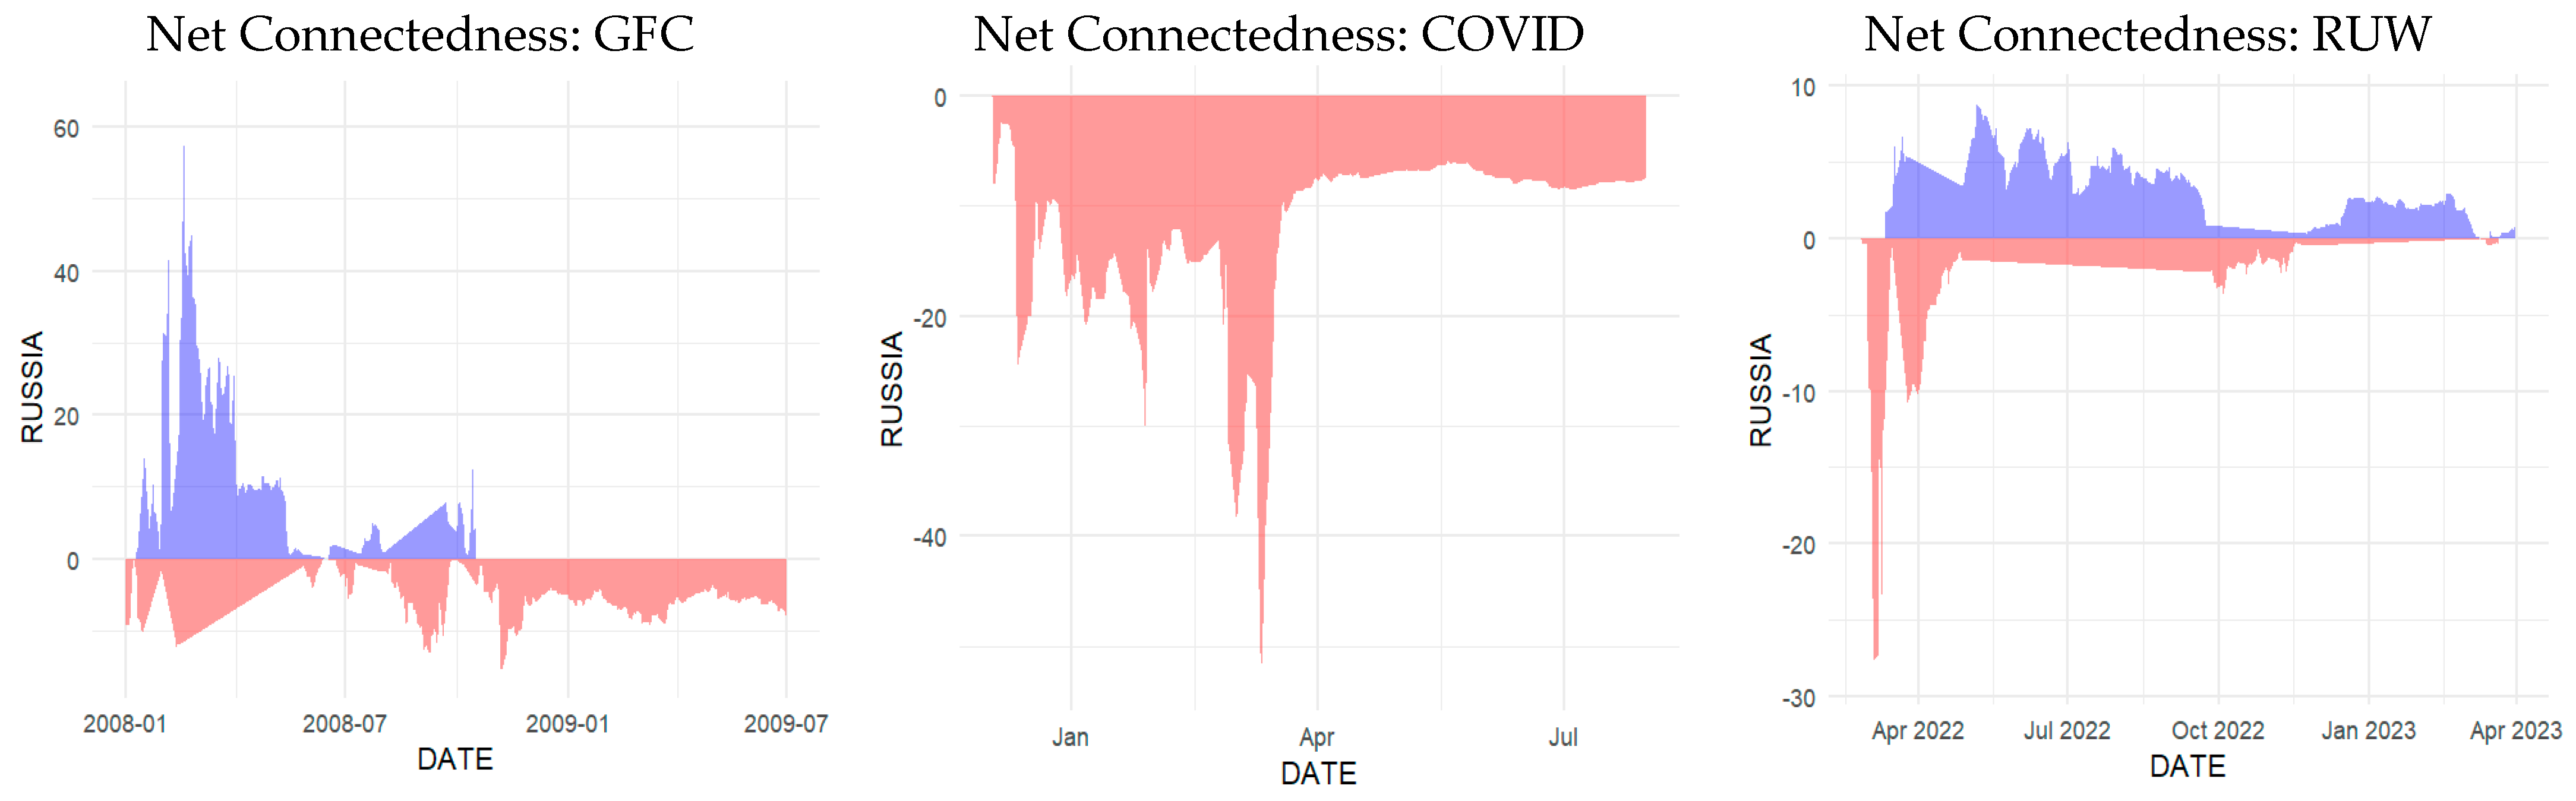
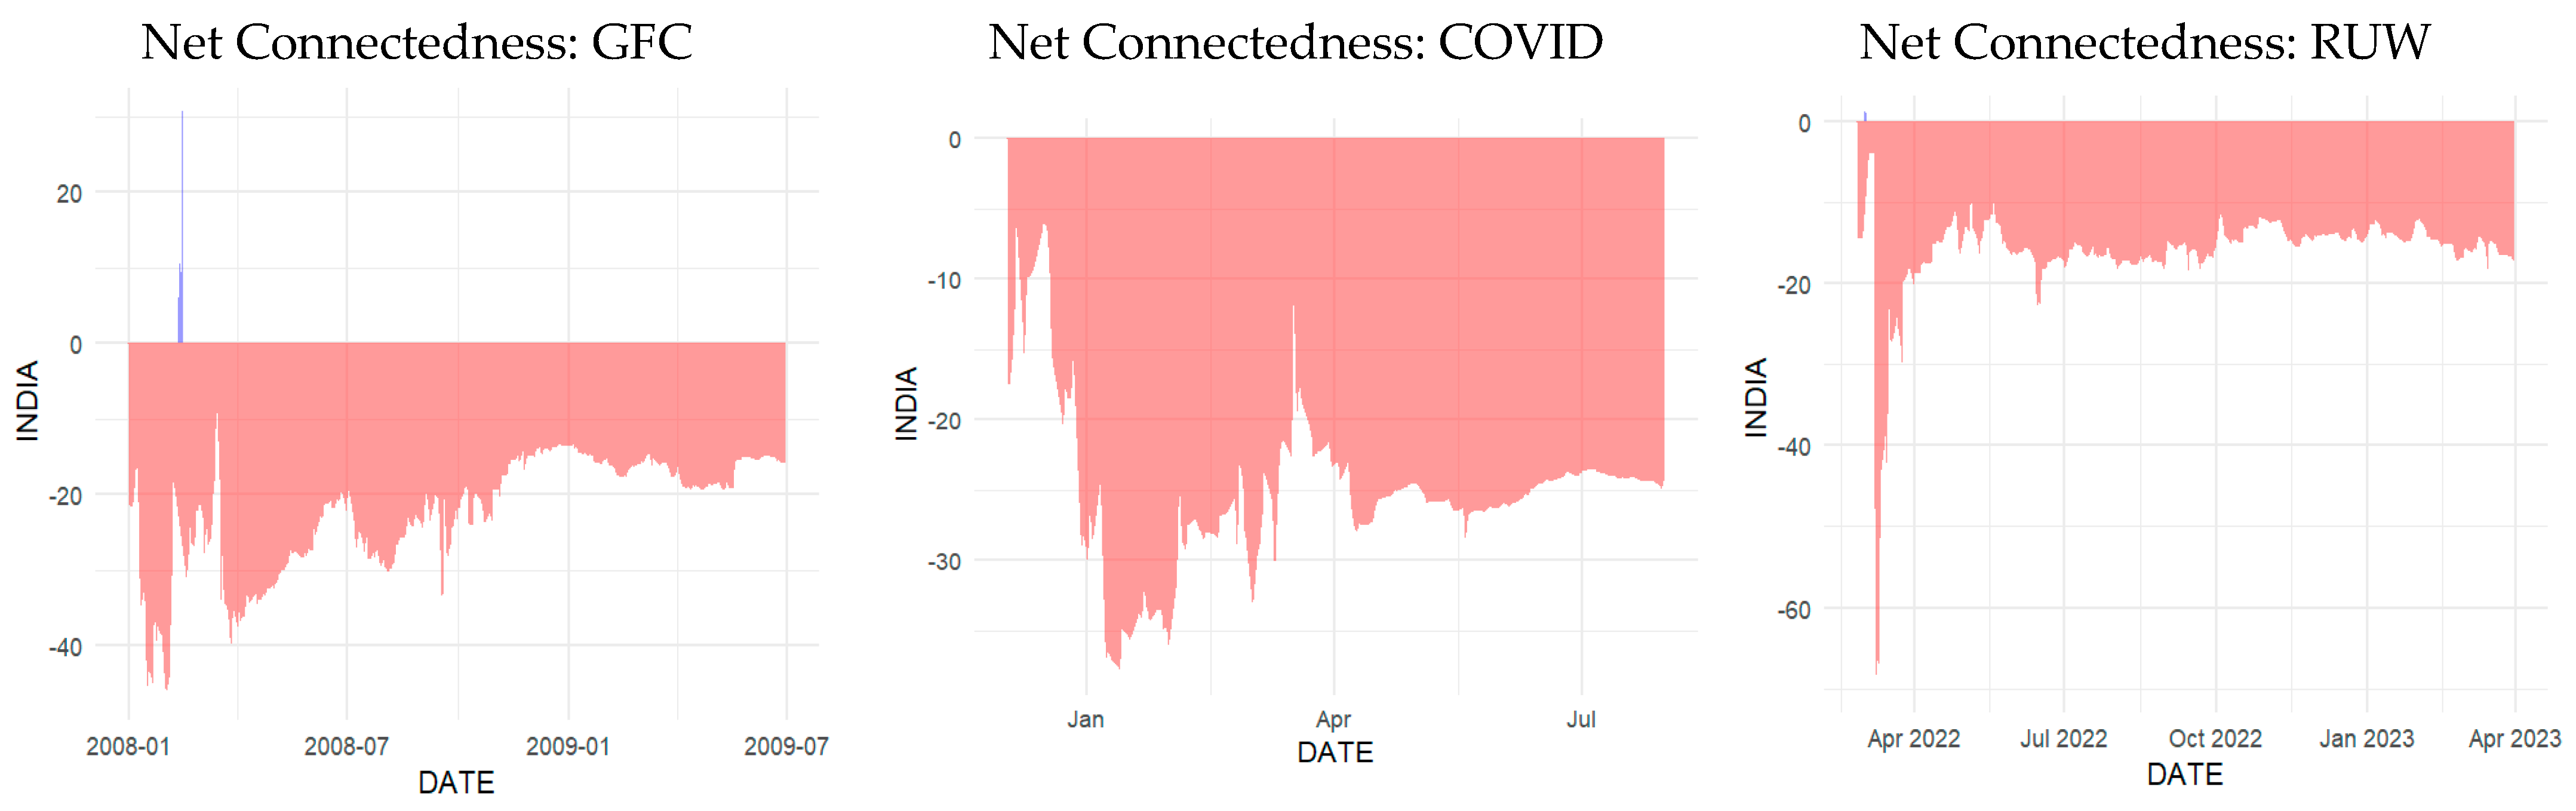
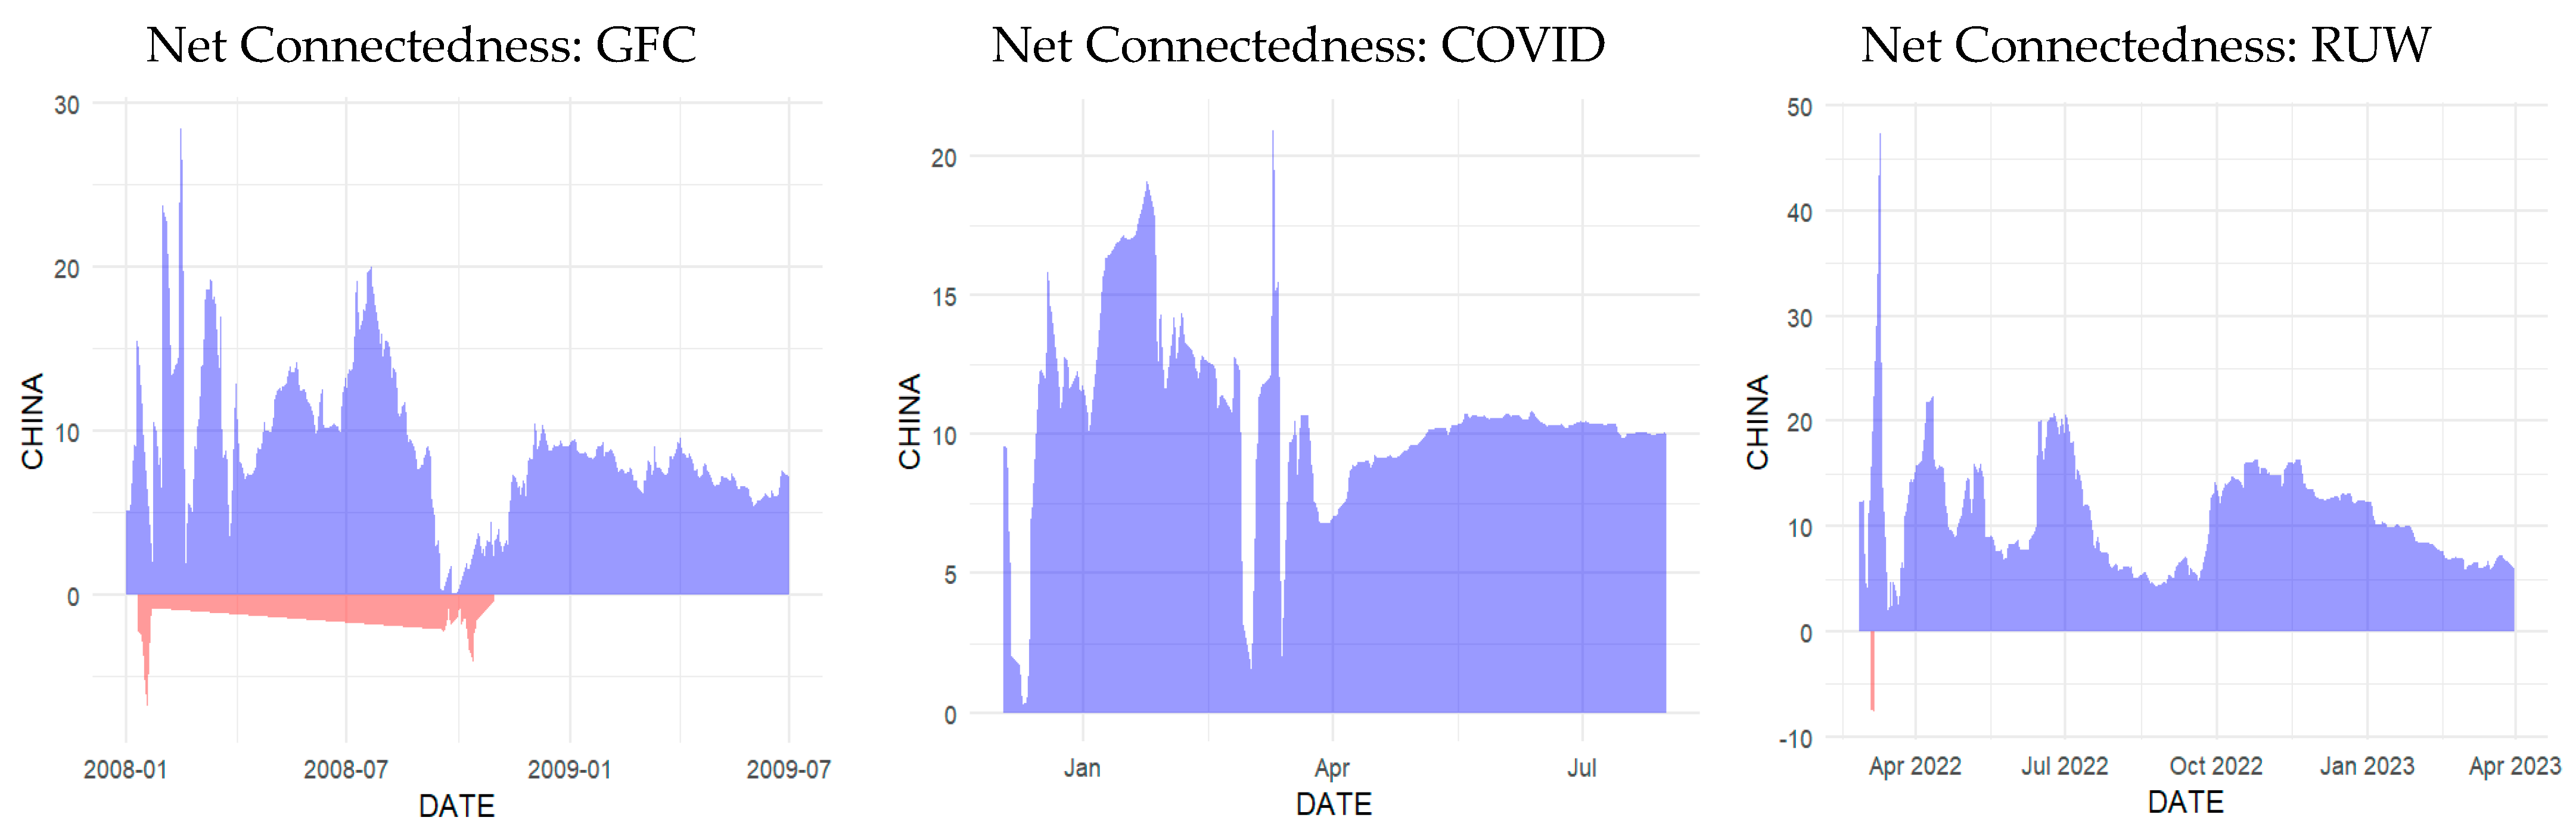
4.5. Dynamic Net Directional Connectedness Among Markets

The dynamic net connectedness of each of the markets in different sample periods is depicted in Figure 2, Figure 3, Figure 4, Figure 5 and Figure 6. The net dynamic figure will help to identify the nature and pattern of spillover in each of the markets and its variation in different sample periods (pre-crisis and crisis periods). The blue-shaded area (positive region) in the figures indicates that the market is the net transmitter of return shocks, and the red-shaded area (negative region) indicates that the market is the net receiver of return shocks.
The U.S. market’s dynamic net connectedness over different sample periods is depicted in Figure 2. In the pre-COVID-19 pandemic and pre-global financial crisis (GFC) eras, the U.S. market acted mainly as a net transmitter of shocks, spreading ripples of uncertainty to other markets. But in the early years of the great financial crisis, this role was reversed, and external economic disruptions had a significant impact on the U.S. market, making it a net receiver of shocks. After this first stage, the U.S. market reverted back to being a net transmitter, and it remained in this position all the way to the end of the period under observation. This trend highlights how the U.S. market’s impact on international markets varies, changing from a source of shocks to a recipient during crises and back to a transmitter in the recovery phase.
The dynamic net connectedness of the Brazilian market is illustrated in Figure 3. Brazil primarily functioned as a net transmitter of shocks during the COVID-19 pandemic and the global financial crisis (GFC), exerting significant influence over other markets through its economic disruptions. But the onset of the conflict between Russia and Ukraine marked a significant change, with Brazil turning into a net recipient of shocks, suggesting a greater susceptibility to outside economic shocks. Notably, Brazil’s shock transmission peaked during the COVID-19 crisis, and the country’s market contributed roughly 40% of the spillover, demonstrating the country’s extraordinary level of influence on the world stage during this health crisis.
The Russian market’s time-varying net connectedness is depicted in Figure 4. The Russian market primarily functioned as a net receiver of shocks during the pre-COVID-19 pandemic, the pre-Russia-Ukraine war, and the pre-global financial crisis (GFC) periods, demonstrating its vulnerability to outside economic disruptions. Interestingly, the COVID-19 pandemic severely disrupted economic activities, as evidenced by its greater impact on the Russian market than that of the GFC or the Russia–Ukraine war. Prior to the conflict between Russia and Ukraine, Russia continued to receive shocks. But as the conflict dragged on, the market remained more of a net receiver, highlighting its susceptibility to outside economic forces.
The net dynamic connectedness of the Indian and Chinese markets is depicted in Figure 5 and Figure 6, respectively. The case of India is different from that of other markets, as the market acts as the net receiver of shocks from others during whole sample periods, especially before and during the global financial crisis, the COVID-19 pandemic, and the Russia–Ukraine war periods. Particularly during the crisis and war periods, the net receipt of shocks crossed the range of −30%. This indicates the sensitivity of the Indian market to crises and external shocks. Among the BRIC markets, the Chinese market stands in a different position. In almost all the sample periods, the Chinese market acts as the net transmitter of shocks to others, especially during the COVID-19 pandemic (this may be due to the fact that COVID-19 emerged from China). During the Russia–Ukraine war, the Chinese market transmitted more shocks to others than it received from others.

4.6. Short and Long-Term Connectedness

Table 6 presents the total spillover over short and long periods to differentiate the connectedness among the U.S. and BRIC stock markets across these frequencies. It is evident that the long-run connectedness (40.72%) is stronger than the short-run connectedness (38.98%). In long- and short-run connectedness, the U.S., Brazil, and China are the net transmitters of shock. While Russia and India are the net receivers of shock. This indicates that there is a difference in connectedness among the markets in the short and long term.

5. Discussions

This study’s results support the findings of previous researchers Zhang et al. (2020) and Cepoi (2020), who discovered that stock market dependencies increased significantly during a health crisis outbreak. This outcome was expected since it is commonly known that stock markets are linked and dependent on one another (Morales and Andreosso-O’Callaghan 2012) and that the interdependence of the global stock market is increased during times of crisis (Jondeau and Rockinger 2006; Mokni and Mansouri 2017). As Majdoub and Mansour (2014) said, the U.S. market has not been a prominent channel for the transmission of shocks. The increased interconnection among developed and emerging markets can be attributed to globalisation, liberalisation, and the increased trade and investment among the economies (Singh and Singh 2017; Wen et al. 2019). The BRICS nations are primary receivers of global investment flows and significant consumers of commodities. Furthermore, the security markets of the U.S., China, and India may be interconnected by investment, trade, and macroeconomic fundamentals, whereas the stock markets of the U.S., Russia, and Brazil may be associated through energy demand (Bekiros 2014). Consequently, changes in global economic factors may serve as a channel for the transmission of fluctuations in global economic and financial conditions, such as the global financial crisis and the COVID-19 pandemic, to the BRIC stock markets, thereby impacting their economic growth (Dakhlaoui and Aloui 2016). As highlighted by Sarwar and Khan (2017), the robust economic and commercial relationships between the U.S. and Brazil elucidate the evidence of cross-market information flow.
The influence of the Russian–Ukrainian conflict on emerging economies appears to be significantly distinct from the repercussions observed during the global financial crisis and the COVID-19 pandemic in financial markets. In contrast to the COVID-19 pandemic, the influence of the Russian–Ukrainian conflict is more evident in the international oil and commodity markets. Upon reflection, it is evident that, aside from Russia, the conflicting party, the repercussions on other developing markets were transient and restricted, whereas the effects on established economies, particularly those in Europe, were comparatively enduring and significant. The conflict between Russia and Ukraine has significantly affected the markets of industrialised economies that are reliant on Russian energy. Nonetheless, for rising markets, exemplified by those of China and India, there have been no energy supply disruptions from Russia, and their stock markets have exhibited a comparatively subdued reaction to geopolitical tensions. Consequently, we have not identified substantial evidence of notable increases in market correlation during this timeframe (Anyikwa and Phiri 2023). This suggests differing levels of interconnectedness and integration between the U.S. and BRICS stock markets during various phases of financial crises.
The pivotal role of the U.S. in information transmission to BRICS markets can be linked to peer effects. The primary manifestation of these peer effects is that markets characterised by inferior-quality information, such as inferior financial conditions, low market capitalisation, and elevated stock idiosyncratic volatility, frequently imitate markets regarded as possessing superior-quality information in the aforementioned domains. Markets situated at the centre of an interlocking network or possessing greater influence take a leading role in peer influence due to their access to superior information (Dong et al. 2023; Mugerman et al. 2014).
Furthermore, increased connectedness among the markets during market crisis periods compared to normal periods can be attributed to the contagion effect (Bouzzine and Lueg 2020; Corbet et al. 2022; Singh and Singh 2017). Contagion denotes the transmission of shocks to other nations, with herding behaviour serving as a conduit for contagion. This phenomenon is sometimes termed ‘shift-contagion’, whereby financial shocks propagate to other nations, with transmissions being more pronounced during periods of crisis than in stable times (Singh and Singh 2017). The complexities of these net spillovers underscore the necessity of identifying the timing and location of changes in these classifications. These findings are crucial for market policymakers to create decoupling techniques to mitigate contagion risks.

6. Conclusions

With the inclusion of prominent crises that impacted international stock markets between 2000 and 2023, this study analyses the nature of stock market connectedness among the U.S. and BRIC stock markets. This study uses a multimodal approach, combining dynamic conditional correlation (DCC) GARCH and time-varying parameter (TVP) VAR models. This study came to four important conclusions: First, the degree of market connectivity varies over time and is heavily impacted by market crises. Second, during significant global events like the COVID-19 pandemic and the 2008 financial crisis, stock markets exhibit stronger interconnections. Third, events that are country- or region-specific typically have less of an effect on stock market integration. Finally, there is evidence that the Indian stock market is more closely linked to the U.S. and Chinese stock markets, which means that any disruptions in these markets will probably have a direct impact on the Indian market.
This study’s conclusions demonstrate that the degree of market conditions that determines how related the U.S. and BRIC equities are is crucial for developing effective risk management methods for investors. The study recommends that investors closely monitor the U.S. and Chinese economic landscapes and policy decisions prior to making any short-term investments in the Indian stock market. During uncertain times, any movement in the Chinese market will strongly spill over to the Indian stock market. Further, during global crises, investors often switch between risk-on and risk-off positions, leading to coordinated movements in global markets and increased regional stock market correlations. In anticipating portfolio market risk exposures and assessing the diversification benefits from the U.S. and BRICS stock markets, it is essential to acknowledge the influence of spillovers in diminishing these benefits, particularly during tumultuous moments. From an asset allocation standpoint, the magnitude of the spillovers necessitates the development of a new diversification strategy. Portfolio investors in the U.S. and BRICS markets may allocate their resources to a safe-haven asset like gold, potentially mitigating downside risk amid heightened spillover intensity during turbulent periods.
These results have significant consequences for policymakers and portfolio investors engaged with the U.S. and BRICS stock markets for anticipating portfolio market risk exposures and assessing the presence of diversification benefits in the analysed markets. From an asset allocation standpoint, risk-averse investors may, for instance, allocate additional assets to the Russian stock market to mitigate portfolio risks during moments of stress. To mitigate larger risks, investors may implement an international diversification approach by incorporating Islamic financial assets into their portfolios and constructing optimal portfolio designs appropriately. From a policymakers’ perspective, the findings assist in formulating decoupling techniques (e.g., in the Russian instance) to safeguard against contagion risks.
Future research should investigate the effects of the Russia–Ukraine war on interconnections’ energy-intensive economies. Furthermore, examining the impact of developing technologies on volatility prediction and broadening the investigation to encompass additional emerging markets could improve the comprehension of global financial interconnection and risk management techniques. Additionally, with the use of hedge instruments (e.g., gold), researchers can analyse the hedging effectiveness among these markets across varied crisis periods.
While this study provides valuable insights, its scope is confined exclusively to stock market data, potentially overlooking other macroeconomic factors (such as interest rates, inflation, or fiscal policies) that significantly affect market interconnectedness during crises. Furthermore, it lacks hedging effectiveness among these markets during crisis periods.

Author Contributions

Conceptualization, N.C. and M.S.M.A.-A.; Methodology, N.C., J.A.N. and M.I.T.; Validation, T.M.N.; Formal analysis, M.I.T.; Investigation, J.A.N.; Resources, T.M.N. and M.S.M.A.-A.; Data curation, J.A.N.; Writing—original draft, N.C.; Writing—review & editing, T.M.N., M.I.T. and M.S.M.A.-A. All authors have read and agreed to the published version of the manuscript.

Funding

This research received no external funding.

Data Availability Statement

The data presented in this study are available on request from the corresponding author. The data are not publicly available due to their use in other projects.

Conflicts of Interest

The uthors declare no conflicts of interest.

References

  1. Alfreedi, Ajab A. 2019. Shocks and Volatility Spillover Between Stock Markets of Developed Countries and GCC Stock Markets. Journal of Taibah University for Science 13: 112–20. [Google Scholar] [CrossRef]
  2. Aloui, Riadh, Mohamed Safouane Ben Aïssa, and Duc Khuong Nguyen. 2011. Global financial crisis, extreme interdependences, and contagion effects: The role of economic structure? Journal of Banking and Finance 35: 130–41. [Google Scholar] [CrossRef]
  3. Antonakakis, Nikolaos, Ioannis Chatziantoniou, and David Gabauer. 2020. Refined measures of dynamic connectedness based on time-varying parameter vector autoregressions. Journal of Risk and Financial Management 13: 84. [Google Scholar] [CrossRef]
  4. Anyikwa, Izunna, and Andrew Phiri. 2023. Quantile connectedness amongst BRICS equity markets during the COVID-19 pandemic and Russia–Ukraine war. Cogent Economics and Finance 11: 2251300. [Google Scholar] [CrossRef]
  5. Bekaert, Geert, and Campbell R. Harvey. 2000. Foreign speculators and emerging equity markets. The Journal of Finance 55: 565–613. [Google Scholar] [CrossRef]
  6. Bekaert, Geert, and Campbell R. Harvey. 2003. NBER Working Paper Series Market Integration and Contagion. Available online: http://www.nber.org/papers/w9510 (accessed on 25 July 2024).
  7. Bekaert, Geert, Michael Ehrmann, Marcel Fratzscher, and Arnaud Mehl. 2014. The Global Crisis and Equity Market Contagion. Journal of Finance 69: 2597–649. [Google Scholar] [CrossRef]
  8. Bekiros, Stelios D. 2014. Contagion, decoupling and the spillover effects of the US financial crisis: Evidence from the BRIC markets. International Review of Financial Analysis 33: 58–69. [Google Scholar] [CrossRef]
  9. Ben Amar, Amine, Fateh Bélaïd, Adel Ben Youssef, and Khaled Guesmi. 2021. Connectedness among regional financial markets in the context of the COVID-19. Applied Economics Letters 28: 1789–96. [Google Scholar] [CrossRef]
  10. Bhar, Ramaprasad, and Biljana Nikolova. 2007. Analysis of Mean and Volatility Spillovers Using BRIC Countries, Regional and World Equity Index Returns. Source: Journal of Economic Integration 22: 369–81. [Google Scholar] [CrossRef]
  11. Bhar, Ramaprasad, and Biljana Nikolova. 2009. Return, volatility spillovers and dynamic correlation in the BRIC equity markets: An analysis using a bivariate EGARCH framework. Global Finance Journal 19: 203–18. [Google Scholar] [CrossRef]
  12. Bhuyan, Rafiqul, Mohammad G. Robbani, Bakhtear Talukdar, and Ajeet Jain. 2016. Information transmission and dynamics of stock price movements: An empirical analysis of BRICS and US stock markets. International Review of Economics and Finance 46: 180–95. [Google Scholar] [CrossRef]
  13. Bollerslev, Tim. 1986. Generalized Autoregressive Conditional Heteroskedasticity. Journal of Econometrics 31: 307–27. [Google Scholar] [CrossRef]
  14. Bouri, Elie, Donald Lien, David Roubaud, and Syed Jawad Hussain Shahzad. 2018. Fear Linkages Between the US and BRICS Stock Markets: A Frequency-Domain Causality. International Journal of the Economics of Business 25: 441–54. [Google Scholar] [CrossRef]
  15. Bouzzine, Yassin Denis, and Rainer Lueg. 2020. The contagion effect of environmental violations: The case of Dieselgate in Germany. Business Strategy and the Environment 29: 3187–202. [Google Scholar] [CrossRef]
  16. Carrieri, Francesca, Vihang Errunza, and Ked Hogan. 2007. Characterizing World Market Integration through Time. Journal of Financial and Quantitative Analysis 42: 915–40. [Google Scholar] [CrossRef]
  17. Cepoi, Cosmin-Octavian. 2020. Asymmetric dependence between stock market returns and news during COVID-19 financial turmoil. Finance Research Letters 36: 101658. [Google Scholar] [CrossRef]
  18. Chakrabarti, Prasenjit, Mohammad Shameem Jawed, and Manish Sarkhel. 2021. COVID-19 pandemic and global financial market interlinkages: A dynamic temporal network analysis. Applied Economics 53: 2930–45. [Google Scholar] [CrossRef]
  19. Chen, Anthony W., Jim Chen, and V. Reddy Dondeti. 2020. The US-China trade war: Dominance of trade or technology? Applied Economics Letters 27: 904–9. [Google Scholar] [CrossRef]
  20. Christodoulakis, George A., and Stephen E. Satchell. 2002. Correlated ARCH (CorrARCH): Modelling the time-varying conditional correlation between financial asset returns. European Journal of Operational Research 139: 351–70. [Google Scholar] [CrossRef]
  21. Corbet, Shaen, Yang Hou, Yang Hu, and Les Oxley. 2022. Financial contagion among COVID-19 concept-related stocks in China. Applied Economics 54: 2439–52. [Google Scholar] [CrossRef]
  22. Dahir, Ahmed Mohamed, Fauziah Mahat, Bany-Ariffin Amin Noordin, and Nazrul Hisyam Ab Razak. 2020. Dynamic connectedness between Bitcoin and equity market information across BRICS countries: Evidence from TVP-VAR connectedness approach. International Journal of Managerial Finance 16: 357–71. [Google Scholar] [CrossRef]
  23. Dakhlaoui, Imen, and Chaker Aloui. 2016. The interactive relationship between the US economic policy uncertainty and BRIC stock markets. International Economics 146: 141–57. [Google Scholar] [CrossRef]
  24. Das, Sanjiv Ranjan, and Raman Uppal. 2004. Systemic risk and international portfolio choice. Journal of Finance 59: 2809–34. [Google Scholar] [CrossRef]
  25. Derbali, Abdelkader, Kamel Naoui, Mounir Ben Sassi, and Mohamed Marouen Amiri. 2022. Do COVID-19 Epidemic Explains the Dynamic Conditional Correlation between China’s Stock Market Index and International Stock Market Indices? Chinese Economy 55: 227–42. [Google Scholar] [CrossRef]
  26. Diebold, Francis X., and Kamil Yilmaz. 2012. Better to give than to receive: Predictive directional measurement of volatility spillovers. International Journal of Forecasting 28: 57–66. [Google Scholar] [CrossRef]
  27. Diebold, Francis X., and Kamil Yilmaz. 2014. On the network topology of variance decompositions: Measuring the connectedness of financial firms. Journal of Econometrics 182: 119–34. [Google Scholar] [CrossRef]
  28. Dimitriou, Dimitrios, Dimitris Kenourgios, and Theodore Simos. 2013. Global financial crisis and emerging stock market contagion: A multivariate FIAPARCH-DCC approach. International Review of Financial Analysis 30: 46–56. [Google Scholar] [CrossRef]
  29. Dong, Jichang, Xiaoting Liu, Kangxian Ji, Xiuting Li, and Zhi Dong. 2023. Peer Effects in Financial Investment of Board-interlocked Firms: An Information Sharing Perspective. Economic Analysis and Policy 80: 1490–508. [Google Scholar] [CrossRef]
  30. Dungey, Mardi, George Milunovich, Susan Thorp, and Minxian Yang. 2015. Endogenous crisis dating and contagion using smooth transition structural GARCH. Journal of Banking and Finance 58: 71–79. [Google Scholar] [CrossRef]
  31. Engle, Robert. 2002. Dynamic conditional correlation: A simple class of multivariate generalized autoregressive conditional heteroskedasticity models. Journal of Business and Economic Statistics 20: 339–50. [Google Scholar] [CrossRef]
  32. Engle, Robert. F., and Kevin Sheppard. 2001. NBER Working Paper Series Theoretical and Empirical Properties of Dynamic Conditional Correlation Multivariate GARCH. Available online: http://weber.ucsd.edu/~ksheppar/research/frames.htm (accessed on 15 August 2024).
  33. Forbes, Kristin J., and Roberto Rigobon. 2002. No contagion, only interdependence: Measuring stock market comovements. The Journal of Finance 57: 2223–61. [Google Scholar] [CrossRef]
  34. Gębka, Bartosz, and Dobromił Serwa. 2007. Intra- and inter-regional spillovers between emerging capital markets around the world. Research in International Business and Finance 21: 203–21. [Google Scholar] [CrossRef]
  35. Gong, Chen, Pan Tang, and Yutong Wang. 2019. Measuring the network connectedness of global stock markets. Physica A: Statistical Mechanics and Its Applications 535: 122351. [Google Scholar] [CrossRef]
  36. Greenwood-Nimmo, Matthew, Viet Hoang Nguyen, and Yongcheol Shin. 2021. Measuring the Connectedness of the Global Economy. International Journal of Forecasting 37: 899–919. [Google Scholar] [CrossRef]
  37. Habiba, Umm E., Shen Peilong, Wenlong Zhang, and Kashif Hamid. 2020. International stock markets Integration and dynamics of volatility spillover between the USA and South Asian markets: Evidence from Global financial crisis. Journal of Asia Business Studies 14: 779–94. [Google Scholar] [CrossRef]
  38. Hammoudeh, Shawkat, Sang Hoon Kang, Walid Mensi, and Duc Khuong Nguyen. 2016. Dynamic Global Linkages of the BRICS Stock Markets with the United States and Europe Under External Crisis Shocks: Implications for Portfolio Risk Forecasting. World Economy 39: 1703–27. [Google Scholar] [CrossRef]
  39. Jondeau, Eric, and Michael Rockinger. 2006. The Copula-GARCH model of conditional dependencies: An international stock market application. Journal of International Money and Finance 25: 827–53. [Google Scholar] [CrossRef]
  40. Koop, Gary, M. Hashem Pesaran, and Simon M. Potter. 1996. Impulse response analysis in nonlinear multivariate models. Journal of Econometrics 74: 119–47. [Google Scholar] [CrossRef]
  41. Kumar, Rakesh, and Raj S. Dhankar. 2017. Financial instability, integration and volatility of emerging South Asian stock markets. South Asian Journal of Business Studies 6: 177–90. [Google Scholar] [CrossRef]
  42. Lakshmi, P., S. Visalakshmi, and Kavitha Shanmugam. 2015. Intensity of shock transmission amid US-BRICS markets. International Journal of Emerging Markets 10: 311–28. [Google Scholar] [CrossRef]
  43. Majdoub, Jihed, and Walid Mansour. 2014. Islamic equity market integration and volatility spillover between emerging and US stock markets. North American Journal of Economics and Finance 29: 452–70. [Google Scholar] [CrossRef]
  44. McIver, Ron P., and Sang Hoon Kang. 2020. Financial crises and the dynamics of the spillovers between the U.S. and BRICS stock markets. Research in International Business and Finance 54: 101276. [Google Scholar] [CrossRef]
  45. Mensi, Walid, Ferihane Zaraa Boubaker, Khamis Hamed Al-Yahyaee, and Sang Hoon Kang. 2018. Dynamic volatility spillovers and connectedness between global, regional, and GIPSI stock markets. Finance Research Letters 25: 230–38. [Google Scholar] [CrossRef]
  46. Mensi, Walid, Shawkat Hammoudeh, Duc Khuong Nguyen, and Sang Hoon Kang. 2016. Global financial crisis and spillover effects among the U.S. and BRICS stock markets. International Review of Economics and Finance 42: 257–76. [Google Scholar] [CrossRef]
  47. Mensi, Walid, Shawkat Hammoudeh, Juan Carlos Reboredo, and Duc Khuong Nguyen. 2014. Do global factors impact BRICS stock markets? A quantile regression approach. Emerging Markets Review 19: 1–17. [Google Scholar] [CrossRef]
  48. Miyakoshi, Tatsuyoshi. 2003. Spillovers of stock return volatility to Asian equity markets from Japan and the US. Journal of International Financial Markets, Institutions and Money 13: 383–99. [Google Scholar] [CrossRef]
  49. Mokni, Khaled, and Faysal Mansouri. 2017. Conditional dependence between international stock markets: A long memory GARCH-copula model approach. Journal of Multinational Financial Management 42–43: 116–31. [Google Scholar] [CrossRef]
  50. Morales, Lucia, and Bernadette Andreosso-O’Callaghan. 2012. The Current Global Financial Crisis: Do Asian Stock Markets Show Contagion or Interdependence Effects? Journal of Asian Economics 23: 616–26. [Google Scholar] [CrossRef]
  51. Mugerman, Yevgeny, Orly Sade, and Moses Shayo. 2014. Long term savings decisions: Financial reform, peer effects and ethnicity. Journal of Economic Behavior and Organization 106: 235–53. [Google Scholar] [CrossRef]
  52. Muguto, Lorraine, and Paul-Francois Muzindutsi. 2022. A Comparative Analysis of the Nature of Stock Return Volatility in BRICS and G7 Markets. Journal of Risk and Financial Management 15: 85. [Google Scholar] [CrossRef]
  53. Nath Mukherjee, Kedar, and Ram Kumar Mishra. 2010. Stock market integration and volatility spillover: India and its major Asian counterparts. Research in International Business and Finance 24: 235–51. [Google Scholar] [CrossRef]
  54. Panda, Pradiptarathi, Shobana Vasudevan, and Babita Panda. 2021. Dynamic connectedness among BRICS and major countries stock markets. Journal of Public Affairs 21: e2265. [Google Scholar] [CrossRef]
  55. Pesaran, H. Hashem, and Yongcheol Shin. 1998. Generalized impulse response analysis in linear multivariate models. Economics Letters 58: 17–29. [Google Scholar] [CrossRef]
  56. Rehman, Mobeen Ur, Nasir Ahmad, Syed Jawad Hussain Shahzad, and Xuan Vinh Vo. 2022. Dependence dynamics of stock markets during COVID-19. Emerging Markets Review 51: 100894. [Google Scholar] [CrossRef]
  57. Rejeb, Aymen Ben, and Adel Boughrara. 2015. Financial integration in emerging market economies: Effects on volatility transmission and contagion. Borsa Istanbul Review 15: 161–79. [Google Scholar] [CrossRef]
  58. Sahadudheen, I., and P. K. Kumar. 2023. On the Time-varying Correlations and Hedging Effectiveness: An Analysis of Crude Oil, Gold, and Stock Market. International Journal of Energy Economics and Policy 13: 353–63. [Google Scholar] [CrossRef]
  59. Sarwar, Ghulam, and Walayet Khan. 2017. The effect of US stock market uncertainty on emerging market returns. Emerging Markets Finance and Trade 53: 1796–811. [Google Scholar] [CrossRef]
  60. Singh, Amanjot, and Manjit Singh. 2017. A revisit to stock market contagion and portfolio hedging strategies: BRIC equity markets and financial crisis. International Journal of Law and Management 59: 618–35. [Google Scholar] [CrossRef]
  61. Syriopoulos, Theodore, Beljid Makram, and Adel Boubaker. 2015. Stock market volatility spillovers and portfolio hedging: BRICS and the financial crisis. International Review of Financial Analysis 39: 7–18. [Google Scholar] [CrossRef]
  62. Škrinjarić, Tihana, and Boško Šego. 2020. Risk connectedness of selected CESEE stock markets: A spillover index approach. China Finance Review International 10: 447–72. [Google Scholar] [CrossRef]
  63. Todea, Alexandru. 2016. Cross-correlations between volatility, volatility persistence and stock market integration: The case of emergent stock markets. Chaos, Solitons and Fractals 87: 208–15. [Google Scholar] [CrossRef]
  64. Tse, Yiu Kuen, and Albert K. C. Tsui. 2002. A multivariate generalized autoregressive conditional heteroscedasticity model with time-varying correlations. Journal of Business and Economic Statistics 20: 351–62. [Google Scholar] [CrossRef]
  65. Wang, Lihong. 2014. Who moves East Asian stock markets? The role of the 2007–2009 global financial crisis. Journal of International Financial Markets, Institutions and Money 28: 182–203. [Google Scholar] [CrossRef]
  66. Wang, Ping, and Peijie Wang. 2010. Price and volatility spillovers between the Greater China Markets and the developed markets of US and Japan. Global Finance Journal 21: 304–17. [Google Scholar] [CrossRef]
  67. Wen, Fenghua, Aojie Shui, Yuxiang Cheng, and Xu Gong. 2022. Monetary policy uncertainty and stock returns in G7 and BRICS countries: A quantile-on-quantile approach. International Review of Economics and Finance 78: 457–82. [Google Scholar] [CrossRef]
  68. Wen, Fenghua, Longhao Xu, Guangda Ouyang, and Gang Kou. 2019. Retail investor attention and stock price crash risk: Evidence from China. International Review of Financial Analysis 65: 101376. [Google Scholar] [CrossRef]
  69. Xu, Haifeng, and Shigeyuki Hamori. 2012. Dynamic linkages of stock prices between the BRICs and the United States: Effects of the 2008-09 financial crisis. Journal of Asian Economics 23: 344–52. [Google Scholar] [CrossRef]
  70. Yadav, Miklesh Prasad, Sudhi Sharma, and Indira Bhardwaj. 2023. Volatility Spillover Between Chinese Stock Market and Selected Emerging Economies: A Dynamic Conditional Correlation and Portfolio Optimization Perspective. Asia-Pacific Financial Markets 30: 427–44. [Google Scholar] [CrossRef]
  71. Yousaf, Imran, Ritesh Patel, and Larisa Yarovaya. 2022. The reaction of G20+ stock markets to the Russia–Ukraine conflict “black-swan” event: Evidence from event study approach. Journal of Behavioral and Experimental Finance 35: 100723. [Google Scholar] [CrossRef]
  72. Yu, Honghai, Wangyu Chu, Yu’ang Ding, and Xuezhou Zhao. 2021. Risk contagion of global stock markets under COVID-19: A network connectedness method. Accounting and Finance 61: 5745–82. [Google Scholar] [CrossRef]
  73. Yu, Xiaoling, Kaitian Xiao, and Junping Liu. 2022. Dynamic co-movements of COVID-19 pandemic anxieties and stock market returns. Finance Research Letters 46: 102219. [Google Scholar] [CrossRef]
  74. Zhang, Bing, Xindan Li, and Honghai Yu. 2013. Has recent financial crisis changed permanently the correlations between BRICS and developed stock markets? North American Journal of Economics and Finance 26: 725–38. [Google Scholar] [CrossRef]
  75. Zhang, Dayong, Min Hu, and Qiang Ji. 2020. Financial markets under the global pandemic of COVID-19. Finance Research Letters 36: 101528. [Google Scholar] [CrossRef] [PubMed]
Figure 1. Total Dynamic Connectedness among the markets. Note: The figure depicts the dynamic total connectedness among the U.S and BRIC markets during the pre-global financial crisis, global financial crisis, pre-COVID-19 pandemic, COVID-19 pandemic, pre-Russia–Ukraine war, and Russia–Ukraine war periods.
Risks 12 00202 g001aRisks 12 00202 g001b
Figure 2. Net dynamic connectedness of the U.S. stock market. Note: The figure presents the net dynamic connectedness of the U.S. market during the global financial crisis, the COVID-19 pandemic, and the Russia–Ukraine war periods. The blue (red)-coloured area above (below) the neutral line indicates that the market functioned as the net transmitter (receiver) of shock.
Risks 12 00202 g002
Figure 3. Net dynamic connectedness of the Brazilian stock market. Note: The figure presents the net dynamic connectedness of the Brazilian market during the global financial crisis, the COVID-19 pandemic, and the Russia–Ukraine war periods. The blue (red)-coloured area above (below) the neutral line indicates that the market functioned as the net transmitter (receiver) of shock.
Risks 12 00202 g003
Figure 4. Net dynamic connectedness of the Russian stock market. Note: The figure presents the net dynamic connectedness of the Russian market during the global financial crisis, the COVID-19 pandemic, and the Russia–Ukraine war periods. The blue (red)-coloured area above (below) the neutral line indicates that the market functioned as the net transmitter (receiver) of shock.
Risks 12 00202 g004
Figure 5. Net dynamic connectedness of the Indian stock market. Note: The figure presents the net dynamic connectedness of the Indian market during the global financial crisis, the COVID-19 pandemic, and the Russia–Ukraine war periods. The blue (red)-coloured area above (below) the neutral line indicates that the market functioned as the net transmitter (receiver) of shock.
Risks 12 00202 g005
Figure 6. Net dynamic connectedness of the Chinese stock market. Note: The figure presents the net dynamic connectedness of the Chinese market during the global financial crisis, the COVID-19 pandemic, and the Russia–Ukraine war periods. The blue (red)-coloured area above (below) the neutral line indicates that the market functioned as the net transmitter (receiver) of shock.
Risks 12 00202 g006
Table 1. Unit root test.
Unit Root TestsUSABrazilRussiaIndiaChina
Whole periodADF−86.401 ***−79.793 ***−74.875 ***−23.428 ***−80.403 ***
PP−86.743 ***−79.855 ***−74.853 ***−74.069 ***−80.387 ***
GFCADF−17.737 ***−20.072 ***−18.922 ***−18.030 ***−9.403 ***
PP−23.312 ***−20.266 ***−18.906 ***−17.964 ***−19.997 ***
COVIDADF−8.971 ***−17.230 ***−13.157 ***−4.8211 ***−7.581 ***
PP−18.610 ***−16.689 ***−13.345 ***−15.070 ***−14.455 ***
Russia–Ukraine warADF−17.222 ***−15.246 ***−12.366 ***−16.084 ***−17.323 ***
PP−17.231 ***−15.182 ***−13.663 ***−16.082 ***−17.310 ***
Source: Authors’ own calculations. Note: The table depicts the unit root test result of ADF (Augmented Dickey–Fuller), and PP (Phillips–Perron) tests for the whole period and for sub-sample periods. *** indicates rejection of the unit root at a 1% level of significance.
Table 2. Summary statistics.
Whole Sample Period
USABrazilRussiaIndiaChina
Mean0.0001670.0002970.0004610.000404−0.000075
Maximum0.1095720.1367820.2522610.159990.108742
Minimum−0.12765−0.15994−0.40467−0.14102−0.185411
Std. Dev.0.0122810.0172960.0199120.0139710.015022
Skewness−0.37998−0.36564−1.50107−0.36382−0.591315
Kurtosis13.6194510.0437146.2068913.1140412.07948
Jarque–Bera28,644.5612,672.96474,042.425,984.2921,185.96
Observations60656065606560656065
GFC Period
USABrazilRussiaIndiaChina
Mean−0.0012−0.00052−0.00168−0.00081−0.001787
Maximum0.1095720.1367820.2522610.1599000.108742
Minimum−0.0947−0.12096−0.20657−0.11604−0.085991
Std. Dev.0.0242160.0295230.0411660.0270910.023571
Skewness−0.034670.1560460.1346260.3596400.198653
Kurtosis6.3562296.30112711.062036.7002106.075616
Jarque–Bera183.1226 ***178.6662 ***1057.367 ***230.8949 ***156.2806 ***
Observations390390390390390
COVID-19 Period
USABrazilRussiaIndiaChina
Mean0.000241−0.00021−7.7E−05−0.00045−0.000967
Maximum0.0896830.1302280.0743490.0859470.085495
Minimum−0.12765−0.15994−0.08646−0.14102−0.185411
Std. Dev.0.0250840.0326110.0181990.0233870.025413
Skewness−0.76243−1.3346−0.87346−1.47954−2.662569
Kurtosis9.58866111.0916210.4156612.5539120.90228
Jarque–Bera329.6777 ***523.3176 ***418.3986 ***721.0735 ***2514.619 ***
Observations173173173173173
RUW Period
USABrazilRussiaIndiaChina
Mean−0.0002−0.000260.0006340.0002140.000290
Maximum0.0539530.0539340.1826200.0286460.067144
Minimum−0.0442−0.03407−0.09256−0.02783−0.064385
Std. Dev.0.0144060.0132090.0208150.0094920.015064
Skewness−0.082490.0017941.8135610.034353−0.452916
Kurtosis3.6524153.34517325.317093.5468945.798817
Jarque–Bera5.377739 ***1.414991 ***6070.602 ***3.607790 ***102.7651 ***
Observations285285285285285
Source: Authors’ own calculations. Note: The table displays the summary statistics of the return series of broad market indices of the U.S. and BRIC stock markets. *** denotes significance at a 1% level.
Table 3. GARCH (1,1) model.
MarketsParametersFull Sample PeriodPre-GFC PeriodGFC PeriodPre-COVID-19 PeriodCOVID-19 PeriodPre-RUW PeriodRUW Period
USA
Mean Equation0.0005879
(6.498) ***
0.000322
(2.166) **
0.000432
(2.321) **
0.000676
(8.787) ***
0.001837
(3.500) ***
0.000877
(3.737) ***
0.000632
(2.087) *
Variance Equationω0.020422
(4.562) ***
0.009340
(1.853) *
0.057420
(2.635) *
3.281429
(4.299) ***
0.051629
(2.572) **
10.571124
(2.075) **
0.670556
(2.433) **
α0.113992
(9.293) ***
0.061329
(5.983) ***
0.1068897
(4.854) ***
0.158134
(6.715) ***
0.498028
(2.890) **
0.198597
(2.450) **
0.047034
(2.927) **
β0.871696
(68.87) ***
0.930407
(78.51) ***
0.883479
(47.72) ***
0.806534
(34.97) ***
0.633315
(9.610) ***
0.690326
(6.761) ***
0.928259
(26.37) ***
Brazil
Mean Equation0.000594
(3.327) ***
0.001069
(2.831) **
0.000461
(2.447) **
0.000440
(1.842) *
0.002805
(2.832) ***
0.000234
(2.447) **
0.000872
(2.065) **
Variance Equationω0.06372
(4.383) ***
0.097427
(1.920) *
0.194173
(3.980) **
0.086248
(2.881) **
0.617885
(3.919) ***
0.088692
(2.476) **
0.054143
(1.780) *
α0.06965
(7.709) ***
0.050696
(3.579) ***
0.083052
(3.041) **
0.063634
(4.188) ***
0.733887
(2.004) **
0.040674
(3.842) ***
0.016067
(2.9940) **
β0.906499
(75.52) ***
0.918045
(34.26) ***
0.888660
(23.13) ***
0.890693
(33.70) ***
0.427400
(1.782) **
0.903952
(19.38) ***
0.952687
(50.48) ***
Russia
Mean Equation0.000879
(4.403) ***
0.001760
(4.349) ***
0.003521
(2.311) *
0.000631
(2.921) **
0.001828
(1.990) **
0.000751
(2.608) **
0.000432
(1.998) *
Variance Equationω0.037590
(2.522) ***
0.167927
(2.878) **
0.107360
(3.2406) ***
0.034789
(2.978) **
0.034761
(2.221) **
0.0524335
(3.0422) ***
0.063553
(2.115) **
α0.095274
(4.889) ***
0.102866
(5.027) ***
0.138664
(4.617) ***
0.063924
(3.995) ***
0.285345
(1.799) *
0.069171
(3.642) ***
0.0953147
(2.806) **
β0.897911
(48.13) ***
0.856273
(31.38) ***
0.869230
(20.72) ***
0.914625
(36.89) ***
0.760668
(7.823) ***
0.844911
(57.22) ***
0.826081
(30.79) ***
India
Mean Equation0.000820
(5.699) ***
0.001368
(4.540) ***
0.006422
(3.358) **
0.000614
(3.381) ***
0.000970
(2.314) **
0.0001483
(2.986) **
0.000156
(2.097) **
Variance Equationω0.021997
(3.892) ***
0.093540
(2.418) **
0.493278
(2.166) **
1.403304
(2.270) **
0.109995
(2.519) **
0.046170
(2.242) **
0.332010
(2.124) **
α0.098485
(7.976) ***
0.138956
(4.183) ***
0.111842
(2.442) **
0.057700
(4.372) ***
0.297892
(2.819) **
0.075352
(2.039) **
0.072550
(3.753) ***
β0.89159
(68.33) ***
0.819878
(17.39) ***
0.828468
(24.05) ***
0.927276
(53.69) ***
0.722456
(11.641) ***
0.893663
(31.53) ***
0.917331
(19.31) ***
China
Mean Equation0.000423
(3.485) ***
0.000401
(2.178) **
0.000532
(2.065) **
0.000461
(1.985) *
0.001558
(2.454) **
0.000855
(3.115) ***
0.001332
(1.689) *
Variance Equationω0.024070
(3.721) ***
0.013246
(2.483) **
0.077611
(2.154) **
0.041020
(2.603) **
0.059569
(2.887) *
0.164314
(2.145) **
0.328271
(2.310) **
α0.099782
(7.331) ***
0.083252
(4.738) ***
0.115248
(2.376) **
0.084019
(4.687) ***
0.415478
(2.023) **
0.099299
(2.701) **
0.234947
(2.294) **
β0.893009
(65.93) ***
0.907074
(49.55) ***
0.87482
(22.23) ***
0.898721
(43.61) ***
0.704481
(7.055) ***
0.772168
(9.9175) ***
0.619684
(5.643) ***
Source: Authors’ own calculations. Note: The table presents the results of the GARCH (1,1) model. The values in ( ) represent the t-values and ***, **, and * represent significance at a 1%, 5%, and 10% level, respectively.
Table 4. Market interrelationships: DCC GARCH with Correlation Targeting.
DCC with Correlation Targeting
Full Sample PeriodPre-GFC PeriodGFC PeriodPre-COVID-19 PeriodCOVID-19 PeriodPre-RUW PeriodRUW Period
ρ t B U 0.51596 [0.0259]
(19.86) ***
0.535842 [0.03078]
(17.40) ***
0.705684 [0.02985]
(23.64) ***
0.49906 [0.02405]
(20.75) ***
0.57780 [0.07720]
(7.484) ***
0.41570 [0.0454]
(9.137) ***
0.40977 [0.0938]
(4.366) ***
ρ t R U 0.23082 [0.0352]
(6.554) ***
0.168647 [0.03755]
(4.490) ***
0.372997 [0.04648]
(8.024) ***
0.30788 [0.03155]
(9.757) ***
0.38560 [0.06792]
(5.677) ***
0.31395 [0.0491]
(6.389) ***
0.0441 [0.06811]
(0.6482)
ρ t I U 0.18540 [0.0307]
(6.032) ***
0.111953 [0.03702]
(3.024) ***
0.314770 [0.03846]
(8.184) ***
0.22590 [0.03141]
(7.191) ***
0.29458 [0.07772]
(3.790) ***
−0.06248 [0.0533]
(−1.170)
0.1909 [0.08170]
(2.338) **
ρ t C U 0.49965 [0.0249]
(20.01) ***
0.459456 [0.0404]
(11.36) ***
0.608969 [0.03152]
(19.32) ***
0.53332 [0.02066]
(25.80) ***
0.63125 [0.04890]
(12.91) ***
0.46859 [0.0480]
(9.762) ***
0.5378 [0.05451]
(9.864) ***
ρ t R B 0.24056 [0.0330]
(7.275) ***
0.208511 [0.03720]
(5.605) ***
0.434715 [0.04352]
(9.987) ***
0.29501 [0.03453]
(8.542) ***
0.35407 [0.07237]
(4.892) ***
0.26689 [0.0504]
(5.290) ***
0.0321 [0.06381]
(0.5040)
ρ t I B 0.18792 [0.0290]
(6.466) ***
0.135223 [0.03643]
(3.712) ***
0.277899 [0.05031]
(5.523) ***
0.21806 [0.02548]
(8.558) ***
0.24336 [0.07348]
(3.312) ***
−0.0162 [0.0604]
(−0.2689)
0.1513 [0.08541]
(1.772) **
ρ t C B 0.34727 [0.0290]
(11.95) ***
0.338266 [0.03668]
(9.221) ***
0.542671 [0.03480]
(15.59) ***
0.35186 [0.02505]
(14.04) ***
0.47542 [0.08263]
(5.753) ***
0.28937 [0.0563]
(5.135) ***
0.2422 [0.07581]
(3.195) ***
ρ t I R 0.22407 [0.0371]
(6.026) ***
0.189175 [0.0374]
(5.050) ***
0.328020 [0.05189]
(6.321) ***
0.27010 [0.03456]
(7.816) ***
0.31707 [0.09379]
(3.381) ***
−0.03736 [0.0549]
(−0.6799)
0.0605 [0.07205]
(0.8398)
ρ t C R 0.35447 [0.0403]
(8.793) ***
0.30632 [0.03600]
(8.509) ***
0.584128 [0.04131]
(14.14) ***
0.39285 [0.03467]
(11.33) ***
0.52788 [0.05624]
(9.386) ***
0.55056 [0.0410]
(13.42) ***
0.1252 [0.08515]
(1.470)
ρ t C I 0.27529 [0.0351]
(7.821) ***
0.219546 [0.03846]
(5.708) ***
0.456858 [0.04655]
(9.813) ***
0.29939 [0.02811]
(10.65) ***
0.45236 [0.06561]
(6.894) ***
−0.0211 [0.0502]
(−0.4200)
0.3112 [0.07307]
(4.260) ***
Alpha0.00715 [0.00201]
(3.554) ***
0.00778 [0.00482]
(1.613)
0.05833 [0.02580](2.260) **0.01419 [0.0119](1.192)0.08169 [0.9619](1.3375) ***0.02967 [0.0147](2.017) *0.01422 [0.0060](2.345) *
Beta0.98771 [0.00490]
(201.3) ***
0.98208 [0.01951]
(50.32) ***
0.148711 [0.22340](0.6657)0.95431 [0.0612](15.58) ***0.96431 [0.02454](39.29)0.77267 [0.1259](6.134) ***0.9523 [0.01467](64.88) ***
Source: Authors’ own calculations. Note: The values in [ ] represent the standard errors and values in ( ) represent the t-values. ***, **, and * represent significance at a 1%, 5%, and 10% level, respectively. ρ t B U   = the correlation between Brazil and the USA; ρ t R U = the correlation between Russia and the USA; ρ t I U = the correlation between India and the USA; ρ t C U = the correlation between China and the USA; ρ t R B = the correlation between Russia and Brazil; ρ t I B = the correlation between India and Brazil; ρ t C B = the correlation between China and Brazil; ρ t I R = the correlation between India and Russia; ρ t C R = the correlation between China and Russia; ρ t C I = the correlation between China and India.
Table 5. Static connectedness among markets.
Full Sample Period: Long Run
USABrazilRussiaIndiaChinaFrom
USA49.1113.5410.8810.2216.2550.89
Brazil15.9347.8813.5610.1512.4852.12
Russia12.6815.8346.0711.4214.0153.93
India14.0813.113.664613.1754
China11.7513.9112.539.1652.6547.35
To54.4356.3850.6240.9455.9258.28
Inc.Own103.55104.2796.6986.94108.56TCI
NET3.554.27−3.31−13.068.5651.65%
Pre-GFC Period GFC Period
USABrazilRussiaIndiaChinaFrom USABrazilRussiaIndiaChinaFrom
USA66.2411.294.254.1214.153.76USA50.5124.75.043.2416.5149.49
Brazil11.2644.2217.8611.0615.655.78Brazil23.1749.028.464.414.9550.98
Russia3.9520.1349.411.6514.8750.6Russia5.6219.5644.128.6122.0955.88
India5.1818.9119.144511.7855India12.695.8211.3746.1823.9453.82
China13.6316.0115.029.1846.1653.84China19.9314.9915.311.3238.4761.53
To34.0266.3856.2736.0256.34248.98To61.465.0640.1727.5777.49271.69
Inc.Own100.26110.56105.6781.01102.5TCIInc.Own111.91114.0884.2973.75115.96TCI
NET0.2610.565.67−18.992.549.79%NET11.9114.08−15.71−26.2515.9654.33%
Pre-COVID-19 Period COVID-19 Period
USABrazilRussiaIndiaChinaFrom USABrazilRussiaIndiaChinaFrom
USA55.2711.738.1910.5114.2944.73USA23.2415.229.152.9529.4676.76
Brazil7.862.5813.663.6712.2937.42Brazil15.6425.8521.024.7332.7774.15
Russia12.2314.5757.27.968.0442.8Russia15.69.6741.311.631.8158.69
India11.3613.698.9951.7814.1848.22India16.3819.1622.6212.6329.2187.37
China1219.1112.135.1351.6248.38China15.916.324.253.2640.2959.71
To43.3959.1142.9827.2848.8221.55To63.5260.3397.0312.55123.25356.68
Inc.Own98.66121.69100.1879.05100.42TCIInc.Own86.7686.18138.3525.17163.54TCI
NET−1.3421.690.18−20.950.4244.31%NET−13.24−13.8238.35−74.8363.5471.33%
Pre-RUW Period RUW Period
USABrazilRussiaIndiaChinaFrom USABrazilRussiaIndiaChinaFrom
USA33.099.7126.711.8928.666.91USA59.9311.320.565.2522.9440.07
Brazil1.7793.671.341.521.76.33Brazil19.2264.880.57.927.4835.12
Russia26.211.2932.312.5627.5467.69Russia7.464.3481.61.275.3218.4
India4.151.285.3483.795.5416.21India7.565.320.2177.659.2722.35
China28.039.3227.462.7932.4167.59China18.387.232.0410.1262.2437.76
To60.2531.660.858.7463.29224.73To52.6228.213.324.5645.01153.7
Inc.Own93.34125.2693.1692.5395.7TCIInc.Own112.5493.184102.21107.25TCI
NET−6.6625.26−6.64−7.47−4.344.94%NET12.54−6.9−15.12.217.2530.74%
Source: Authors’ own calculations. Note: The table reports the total, directional, and net return spillover among the markets. “To” represents the spillover from one market to other markets, and “From” represents the spillover from other markets to a particular market. “NET” represents the net spillover effect. The “TCI” represents the total connectedness index, which is determined by dividing the sum of “To others” or “From others” by the total number of variables (here there are five) for each of the markets.
Table 6. Short and long period spillover.
Short-Term Spillover
USABrazilRussiaIndiaChinaFROM
USA56.2716.725.684.6616.6843.73
Brazil17.7660.836.474.4110.5339.17
Russia9.589.0564.865.3911.1135.14
India9.817.786.1467.189.0932.82
China18.3710.269.216.1755.9844.02
TO55.5343.8227.5020.6347.41194.88
Inc.Own111.79104.6592.3687.81103.39TCI
NET11.794.6−7.64−12.193.3938.98
Long-Term Spillover
USABrazilRussiaIndiaChinaFROM
USA54.9416.816.145.1216.9845.06
Brazil17.9259.236.924.9710.9640.77
Russia10.429.4962.765.9211.4137.24
India10.428.446.6864.859.6135.15
China18.5610.609.666.5754.6145.39
TO57.3245.3329.4022.5948.96203.60
Inc.Own112.26104.5792.1687.44103.57TCI
NET12.264.5−7.84−12.563.5740.72
Source: Author’s own calculations. Note: The table depicts the short- and long-run connectedness among the U.S. and BRIC stock markets.
Disclaimer/Publisher’s Note: The statements, opinions and data contained in all publications are solely those of the individual author(s) and contributor(s) and not of MDPI and/or the editor(s). MDPI and/or the editor(s) disclaim responsibility for any injury to people or property resulting from any ideas, methods, instructions or products referred to in the content.

