Abstract
The greatest technological transformation the world has ever seen was brought about by artificial intelligence (AI). It presents significant opportunities for the financial sector to enhance risk management, democratize financial services, ensure consumer protection, and improve customer experience. Modern machine learning models are more accessible than ever, but it has been challenging to create and implement systems that support real-world financial applications, primarily due to their lack of transparency and explainability—both of which are essential for building trustworthy technology. The novelty of this study lies in the development of an explainable AI (XAI) model that not only addresses these transparency concerns but also serves as a tool for policy development in credit risk management. By offering a clear understanding of the underlying factors influencing AI predictions, the proposed model can assist regulators and financial institutions in shaping data-driven policies, ensuring fairness, and enhancing trust. This study proposes an explainable AI model for credit risk management, specifically aimed at quantifying the risks associated with credit borrowing through peer-to-peer lending platforms. The model leverages Shapley values to generate AI predictions based on key explanatory variables. The decision tree and random forest models achieved the highest accuracy levels of 0.89 and 0.93, respectively. The model’s performance was further tested using a larger dataset, where it maintained stable accuracy levels, with the decision tree and random forest models reaching accuracies of 0.90 and 0.93, respectively. To ensure reliable explainable AI (XAI) modeling, these models were chosen due to the binary classification nature of the problem. LIME and SHAP were employed to present the XAI models as both local and global surrogates.
1. Introduction
One of the major problems faced by financial organizations is risk management, particularly credit risk management. Technological advancements are making it possible to analyze an abundance of client data, thereby reducing lending risks for banks. The available data are analyzed and reduced to a single quality metric, known as a credit score, using statistical and machine learning (ML) approaches. High predictive accuracy in determining a customer’s credit risk has been demonstrated with the use of sophisticated machine learning algorithms. However, these innovative and cutting-edge methods lack the transparency required to display how and why a specific borrower is approved for a loan or not. Specifically, these models are produced by an algorithm straight from data. In financial services businesses, data are viewed as a key strategic asset and a source of competitive advantage. The application of AI models to utilize data offers several benefits. Financial services that must abide by specific rules are not appropriate for black box artificial intelligence (AI).
Explainable AI models that include specifics or justifications to make AI action transparent or understandable are required to solve this issue. Explainable AI (XAI) refers to the design and development of artificial intelligence (AI) systems that can provide understandable and interpretable explanations for their decisions or predictions. Traditional AI models, such as deep learning neural networks, often function as black boxes, meaning that they generate results without clear explanations of how those results were reached. This lack of transparency can be problematic, especially in critical applications such as healthcare, finance, and autonomous vehicles, where trust, accountability, and fairness are crucial. Credit risk analysis utilizing explainable AI makes use of machine learning models and algorithms that produce clear and understandable outcomes. To create such models, it is first necessary to comprehend what “explainable” means in this context. At the institutional level, significant benchmark definitions have been offered this year. We discuss a few of these proposed in the European Union.
The European GDPR European Union (2016) regulation states that “The existence of automated decision-making should be accompanied by meaningful disclosure of the underlying logic, as well as the significance and intended effects of such processing on the data subject”. The Bank of England states Joseph (2020) that “Explainability means that an interested stakeholder can comprehend the main drivers of a model-driven decision”. The Financial Stability Board (FSB) Bussmann et al. (2020) suggests that “lack of interpretability and auditibility of AI and ML methods could become a macro-level risk”. The Ethics Guidelines for Trustworthy Artificial Intelligence were finally released in April 2019 by the High-Level Expert Group on AI of the European Commission. To be considered trustworthy, AI systems must adhere to a set of seven essential criteria presented in these guidelines.
1.1. Various Aspects of XAI
Among the seven aforementioned criteria, the following three are connected to XAI:
- Human agency and oversight: Judgments must be informed, and human monitoring is required.
- Transparency: AI system decisions should be conveyed in a form that is suitable for the relevant stakeholder. People need to be aware that they are engaging with artificial intelligence systems.
- Accountability: Mechanisms for accountability, auditability, and assessment of algorithms, data, and design processes must be implemented in AI systems. To improve decision making and risk assessment, it is important to comprehend the elements and characteristics that influence credit risk projections.
1.2. Major Contributions of the Proposed Work
The major contributions of the proposed work are as follows:
- Analysis of the feature importance and significance in determining model output.
- Presentation of a model in both local and global surrogates.
- Presentation of both a classification analysis and a regression analysis.
- XAI scenarios for both acceptance and rejection, along with a description of the features.
- A description of the preprocessing and feature selection techniques used to ensure accurate classification without any class imbalances.
1.3. Structure of the Work
- Data gathering and preparation: We assemble pertinent credit information, such as client details, credit history, bank documents, and transactional records. The data are preprocessed by cleaning, normalized, and formatting to allow their use in analysis.
- Feature engineering: We extrapolate useful characteristics from the data that can be used to forecast credit risk. The characteristics of the consumer, their income and job history, the quantity of the loan, their credit utilization ratio, their payment history, and other factors could be among these. We ensure that the features are relevant, informative, and nonredundant.
- Model selection: It is important to choose a machine learning algorithm or model that can provide explainable results. Popular algorithms for credit risk analysis include logistic regression, decision tree, random forest, and gradient boosting models. These algorithms often provide feature importance measures that can be used to interpret the model’s predictions.
- Training the model: After splitting the data into training and testing sets, we use the training set to train the chosen model on historical credit data. During this phase, the model learns patterns and relationships between features and credit risk outcomes.
- Model interpretation: After training, the model’s feature importance scores or coefficients are analyzed. These values indicate the relative importance of each feature in predicting credit risk. Higher values suggest stronger influences, while lower values suggest weaker influences.
- Model evaluation: We assess the performance of the model on the testing set by using appropriate evaluation metrics such as accuracy, precision, recall, and F1-score to evaluate the model’s predictive power, generalization ability, and reliability.
- Model deployment and monitoring: After evaluating the model, we deploy it for credit risk analysis. We continuously monitor the model’s performance and periodically retrain it with new data to maintain accuracy and adapt to changing credit risk patterns.
- Explanations and insights: We provide explanations for the model’s predictions. This could involve explaining why a particular applicant is classified with a high or low credit risk by highlighting the significant factors influencing the decision. For this, we utilize techniques such as feature importance plots, partial dependence plots, and individual instance explanations to enhance transparency. The explainability of an AI model is crucial in credit risk analysis, as it is important to gain the trust of stakeholders and ensure compliance with regulations. XAI enables lenders, regulators, and customers to understand the reasoning behind credit decisions and identify any potential biases or unfair practices.
2. Literature Review
Model interpretation refers to the process of understanding and explaining the inner workings and decision-making methods of a machine learning model Mestikou et al. (2023). It involves analyzing the model’s predictions, understanding the status of input features, and gaining insights into how the model arrives at its decisions. Various techniques can be applied to understand and to interpret the models in a more precise manner.
The distinct characteristics of AI models, together with increased processing capacity, make new sources of information (big data) available for creditworthiness assessments. When used together, AI and big data can detect weak signals, such as interactions or nonlinearity across explanatory variables, which appear to improve prediction over traditional creditworthiness metrics. At the macroeconomic level, this translates into good economic growth projections. On a smaller scale, the use of AI in credit analysis enhances financial inclusion and loan access for previously underserved borrowers. However, due to potential biases and ethical, legal, and regulatory issues, AI-based credit analysis systems present long-term concerns. These constraints need the implementation of a new generation of financial regulations as per the paper Sadok et al. (2022).
AI (artificial intelligence) is a key technological innovation that is generating a lot of excitement due to its enormous potential. Researchers have assessed the impact of supervised artificial intelligence techniques, i.e., machine learning techniques, on Pakistani nonfinancial enterprises, and focus on the practical application of AI techniques for accurate prediction of corporate hazards being automated, resulting in the automation of corporate risk management. They employed financial ratios to accurately assess risk and automate corporate risk management by building machine learning algorithms employing techniques such as random forest, decision tree, naive Bayes, and KNN, as per the paper Hu and Su (2022). The credit risk analysis can be rendered with greater support by XAI Giudici and Raffinetti (2020); Misheva et al. (2021) and de Lange et al. (2022). Benchmarking approaches for machine learning models are investigated in the paper Vincenzo Moscato (2021). A review of various aspects of XAI is presented in the paper Heng and Subramanian (2022). The General Data Protection Regulation (GDPR) and the Equal Credit Opportunity Act (ECOA) have added explainability for the right to explanation policy in the proposed work Demajo et al. (2020). The application of the SHAP values with various plots for 20 features is presented by the work Torrent et al. (2021). The contributions of LIME and Shapley values for credit risk analysis are investigated in the paper Gramegna and Giudici (2021). Banks do not have to decrease prediction accuracy for model transparency to meet regulatory standards. With the demonstration, a black box model’s forecasts of credit losses can be simply explained in terms of their inputs. Because black box models are better at detecting complex patterns in data, banks should include the credit loss determinants identified by these models in lending choices and credit exposure pricing. XAI models for credit loss with regression analysis are given in the paper Bastos and Matos (2022). The work of financial technical management with credit analysis of 15,000 small and medium companies was carried out using the SHAPELY XAI tool. Lending operations, particularly for small and medium-sized firms (SMEs), are increasingly dependent on financial technologies and were addressed by the authors of Bussmann et al. (2020).
Machine learning models are opaque and difficult to explain, which are important components for developing a dependable technology. The research compares single classifiers (logistic regression, decision trees, LDA, QDA), heterogeneous ensembles (AdaBoost, random forest), and sequential neural networks. Ensemble classifiers and neural networks outperform others, according to the results. Furthermore, two powerful post hoc model-agnostic explainability tools—LIME and SHAP—were used to evaluate ML-based models in Tyagi (2022).
The study proposed by Galindo and Tamayo (2000) involved a comparative analysis of statistical and machine learning methods, introducing a novel modeling approach based on error curves. More than 9000 models were built, with the findings highlighting CART decision tree models as the most effective, boasting an average 8.31% error rate. This work emphasized the limitations associated with data availability, suggesting a potential 7.32% error rate with a larger dataset. While neural networks and K-nearest neighbor outperformed the standard Probit algorithm, it is important to approach the interpretation of results cautiously. This work underscores the potential of XAI in enhancing credit risk assessment and stresses the importance of addressing data limitations for more accurate predictions.
The authors of Biecek et al. (2021) suggested that leveraging advanced modeling techniques presents an opportunity to improve credit scoring analytics, underscoring the difficulty of balancing accuracy and interpretability. Their study compared various predictive models, such as logistic regression, logistic regression with weight of evidence transformations, and modern artificial intelligence algorithms, highlighting the superior predictive capability of advanced tree-based models in anticipating client default. To tackle the interpretability challenge linked with black box models, the authors showcased methods to enhance accessibility for credit risk practitioners. While the approach enhances model accuracy, its drawback lies in potential implementation and interpretation complexities, particularly in widespread deployment.
The study by Guan et al. (2023) introduced an innovative approach, merging machine learning with human expertise through ripple-down rules to enhance responsible lending decisions. Confronted with limited and potentially biased data in credit risk evaluation, the authors applied machine learning to a smaller training set, complementing it with human expertise to rectify errors. The impact was twofold: the resultant model demonstrated comparable performance to larger datasets, underlining the effectiveness of integrating human expertise to surmount data limitations. Furthermore, the rules devised by the human expert not only rectified errors but also notably enhanced the decision making of the machine learning model. This adaptable approach extends beyond lending decisions, showcasing its potential to improve responsible decision making in areas with restricted machine learning training data.
The authors of Walambe et al. (2020) underscore the significance of automated credit risk assessment in artificial intelligence but recognize the limitations of traditional black box AI models due to global regulations emphasizing data security, privacy, and interpretability, exemplified by the General Data Protection Regulation (GDPR). To address this challenge, the paper proposes a novel system that utilizes blockchain’s secure and immutable features to store machine learning model explanations for credit scoring. The proposed system provides end-users with a secure means to request explanations for credit-scoring decisions, aligning with the imperative of interpretability in automated credit risk assessment within the regulatory framework.
The authors of Demajo et al. (2020) introduced an inventive credit scoring model that incorporates explainable AI (XAI) principles to improve interpretability. They achieved outstanding classification performance on the Home Equity Line of Credit (HELOC) and Lending Club (LC) datasets using the extreme gradient boosting (XGBoost) model. Significantly, the model’s interpretability is reinforced by a comprehensive explanation framework, offering global, local feature-based, and local instance-based explanations. Assessment through varied analyses affirms the model’s simplicity, consistency, and adherence to predefined hypotheses, establishing its accuracy and interpretability. This approach advances credit scoring in the realm of AI and FinTech by harmonizing precision with regulatory requirements for transparency and understandability in algorithmic decision making.
The study proposed by the authors Qadi et al. (2021) addresses the crucial role of credit assessments for credit insurance companies and their impact on closing the trade finance gap. They underscored the need for robust models in estimating default probabilities and highlighted the potential of artificial intelligence to automate risk assessment and streamline loan approval processes. However, the inherent opacity of AI techniques poses challenges for widespread adoption, necessitating a focus on explainability. The primary methodology involves evaluating machine learning models for company credit scoring, incorporating explainable artificial techniques, particularly Shapley additive explanations (SHAP), to enhance interpretability. This approach provides scores aligning with expert judgment, offering insights into the alignment between credit risk experts and model decisions. Ultimately, this contributes to more ethical and precise decision making in credit assessments.
It is possible to escape the “curse of dimensionality” by employing dimensionality reduction techniques to view a vast feature space. By projecting the feature space to a subspace, it is possible to see how a model is motivated to make certain decisions. In addition to PCA (principle component analysis), self-organizing maps (SOM), variational autoencoders (VAC) Doersch (2021), various learning (t-SNE) Wattenberg et al. (2016), and hierarchical clustering are a few more well-liked techniques. Decision trees are more easily understood models that aid in the better visualization of data and features, as well as the comprehension of cause-and-effect linkages and the development of conclusions.
For assessing models, a variety of metrics are available, including accuracy, recall, ROC, RSME, and others. These metrics are essential for assessing the performance of a particular model as well as for hyperparameter optimization and fine-tuning. Analysis of the model’s performance in supervised learning classification applications benefits greatly from the use of the confusion matrix and ROC curve Hand (2009). However, for regression issues, RMSE, MAE, and R square error are typically used. For unsupervised learning, however, additional methods are employed Pedregosa et al. (2012). The models should be clear and straightforward to understand for business stakeholders to have confidence in them (regression is frequently used). However, because complexity is not fully accounted for in the model design, simpler models are typically less accurate. They frequently have to use machine learning models that may be nonlinear and more sophisticated in nature due to the complexity of real-world datasets. Characteristically, it is impossible to use conventional approaches to understand such models. As a result, data scientists must balance model performance with interpretability.
Several model interpretation strategies aim to overcome the restrictions and difficulties of conventional model explanation techniques and the well-known trade-off between interpretability and model performance, such as RETAIN (used in recurrent neural networks). Some of the more model-indifferent approaches are Shapley values, LIME, and SHAP Choi et al. (2017); Lundberg and Lee (2017a); Nag et al. (2024); Ribeiro et al. (2016); Ul Islam Khan et al. (2024). The two most well-known strategies that are independent of models are SHAP and LIME. Shapley values, or the average of the predictor’s involvement to a certain forecast, are what SHAP (Shapley additive explanation) employs. The efficiency attribute of Shapley values ensures that the difference between the forecast’s anticipated value and expected value throughout the complete distribution is allocated fairly across all features. Shapley values’ computation time and lack of consideration for ancillary attributes are drawbacks Molnar (2022). The accuracy of Shapley values is paired with other model interpretable methods in SHAP Lundberg and Lee (2017b), such as the faster calculation times of LIME. The Shapley value estimation is expressed using a linear model. By utilizing several methods, such as Kernel-SHAP and Tree SHAP, SHAP speeds up the computation required to find these Shapley values.
LIME is one of the more often used explainability tests, mainly due to its model neutrality. It is a method of local explanation that seeks to identify a model that maximizes the fidelity and understandability of a particular model. LIME tries to use data samples taken close to the location of the relevant data to build a local interpretable model (such as linear regression). LIME, therefore, considers a global model to have local linear behavior. Given that linear models are simpler for people to understand, it then employs this linear model to explain things. There are methods to improve the interpretability of local linear models as well. Since they are not dependent on a model’s internal workings and can automatically generate explanations for any given machine learning system, model-agnostic approaches like LIME and SHAP have promising futures. An automated and interpretable decision system using black box models, such as neural networks or ensemble methods, would benefit the most from a model-agnostic approach to assist attain both accuracy and interpretability. As demonstrated by Fahner (2018), who also showed how complex ML models compete quite well with cutting-edge credit-risk assessment methods, transparent generalized additive model trees (TGAMT) can be used to achieve levels of accuracy comparable to those of these ML models without the interpretability issue. To identify crucial factors influencing decision making in the credit-scoring problem, a modified version of Ribeiro et al.’s Anchoring Algorithm methods Ribeiro et al. (2018) was used. A demonstration of this model-independent approach of interpretation was presented as part of the FICO explainable machine learning challenge Liao et al. (2020) and Liao et al. (2020). To make the algorithm more versatile and suitable for a wider range of application scenarios, ViCE Liao et al. (2020), a counterfactual explanations tool that can be utilized by subject-matter experts for model verification, was developed. ViCE’s calculation times are faster than LIME’s in SHAP, which is an approach similar to LIME’s speedier calculation times Srivastava et al. (2022) and Salih et al. (2023).
A linear model is used to represent the Shapley value estimation. To expedite the lookup for these Shapley values Cohen et al. (2023), SHAP employs several techniques Giudici and Raffinetti (2020), including Kernel-SHAP. Several methods for explainable AI have been described; some of them are covered here. The integration of both of these technologies, as a first step towards responsible AI development, is not, however, proven in the literature. In this article, we investigate a method for applying safe and innovative technology for credit risk analysis, which is becoming more and more dependent on such technology. The significant research works on the existing systems are discussed in Table 1.

Table 1.
Significant research works on the existing systems.
With the emphasis on both global and local surrogates, with the implementation of model-based and model-agnostic, and with the presence of LIME and Shapley implementation with feature importance analysis, the proposed work provides better modeling and analysis compared with the existing works discussed in Table 1.
The Figure 1 illustrates a pie chart of various research papers and technologies discussed, highlighting the key areas of focus within the surveyed topics.
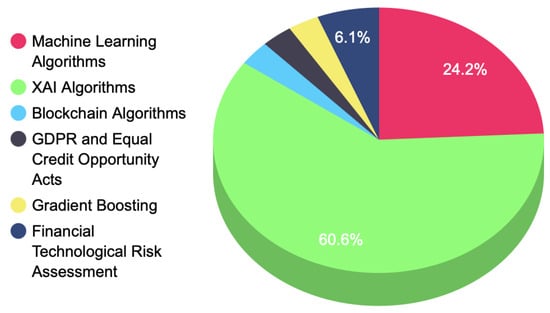
Figure 1.
Analysis of the papers surveyed and the technologies discussed.
3. System Model and Architecture
Figure 2, mentioned above, shows a diagram depicting the functionality of the credit risk evaluation system. The customers avail of various loan products like credit cards, car loans, etc. The application arrives at the bank, through e-document, for further processing. These requests are formulated as a dataset from the bank’s server. This dataset is preprocessed and classified into 13 features that are relevant for the credit risk assessment. These features are classified into two classes based on the credit report analysis, that is, the loan is accepted or rejected.
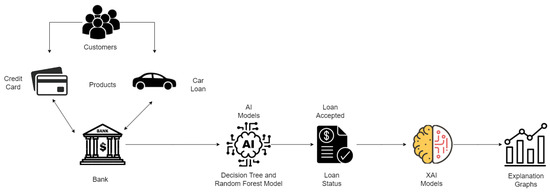
Figure 2.
Credit risk evaluation architecture.
These features are classified by two algorithms: a decision tree and a random forest, the output of which is further explained by the XAI models LIME and SHAP values. The LIME model explains how features develop relationships with each other in local surrogates, which means how the feature importance and relationships are explained for the instance of the dataset. This tool also helps us to evaluate the importance of these features for the prediction of the target attribute. The SHAP values explain the dependency of the features and their significance in determining the target in both global and local surrogates. This uses various plots to describe the relationship between the target attribute with independent features, such as the summary plot, dependency plot, and decision plot. These plots explain the overall dataset and the loan classification problem. The results are discussed in the next section in detail with relevant models of interest.
3.1. System Model
This section deals with the various mathematical models which are present in the work such as decision trees, random forest machine learning models, and the LIME and SHAP explainability models.
3.1.1. Decision Tree
Decision tree is a supervised learning algorithm that works for both classification and regression problems. It contains the structure as per the name, that is a tree with nodes, where the branches are formed up for certain criteria. The decision tree separates the branches until it reaches the threshold criteria for the decision. The decision tree contains the root node, leaf node, and child nodes. The recursion is carried out through node traversal. This can work with any linear model without the support of any other algorithm. This handles the large volume of the data with less time. This contains various processes like the following:
- Splitting: When a dataset is supplied to the tree, it divides by splitting the dataset into various categories.
- Pruning: It works for the shredding of the trees. Furthermore, it works for classification by subsiding the data in a better way. The pruning ends when the leaf node is reached.
- Selection: The best tree model is selected from the available trees that works smoothly for the data. This selection is based on the below factors.
- Entropy: This is the measure of the homogeneity of the trees. If the trees are homogeneous, then it would be zero.
- Information gain: When the entropy decreases, the information gain increases; this allows a further split of the trees into branches for further classification.
The entropy of the decision tree is explained as per Equation (1). In the E(X), where X is the state of the decision tree and Pi is the probability of an instance, the entropy is represented as per Equation (1).
The information gain is represented as the difference between the entropy before splitting a node and after splitting the node as per Equation (2).
where E(T) is the tree node before splitting. Finally, the Gini index is the measure of the sum of the class probabilities from one. This is the cost function that estimates the efficiency of the splitting. The Gini index is represented as for the probability function Pi, which is expressed as per Equation (3).
3.1.2. Random Forest
Random forest uses the bagging method. This performs the classification based on the majority voting of various decision trees. This follows bagging after splitting. Since it follows the majority voting, it avoids overfitting problems. It also takes a lot of time to execute. This algorithm is used for classification and regression analysis. This is also used for the feature importance. Equation (4) expressed below describes the feature importance Fij for the classification parameters. These features are classified for I nodes for j and k splits for Classification C and several nodes n, represented as per Equation (4).
3.1.3. LIME
Local Interpretable Model Agnostic Explainer (LIME) is an XAI model that explains the feature importance of various attributes in the prediction of the output. This provides the weight of the features in determining the target class. The prediction of the same is limited to a local instance called local surrogate, which is related to the rest of the features either through linear regression or the LASSO method.
The local surrogate’s explanation for the target variable y with the instance position x concerning the surrogates is expressed as per Equation (5).
The target y belongs to either 0 or 1 because it is a binary function as per Equation (6).
The n represents a single machine learning model of the subset g, which contains all the similar models. The n is the binary vector represented as follows, in Equations (7) and (8).
The complexity function of the subset is represented as , which is a loss function that needs to be minimized to enhance the prediction of the LIME model. The loss function is illustrated in Equation (9).
3.1.4. SHAP
The best model could explain itself. However, the ensemble models or deep neural network models are complex, and they cannot explain themselves because they are complex and not easy to understand. The explainers like SHAP can explain such complex models in both local and global surrogates. The mathematical representation of the SHAP is presented as if f is the original function and e is the explainer. Local methods provide prediction for the input x as a function of f(x). The simplified input x’ has a relationship with the original input presented in Equation (10).
The contribution of features is analyzed for the determination of the target variable as per the Shapley value in Equation (11).
R is the number of players and is the possible coalitions. y is the reward for every feature and is the objective function that determines the contribution of each feature in determining the target of the problem.
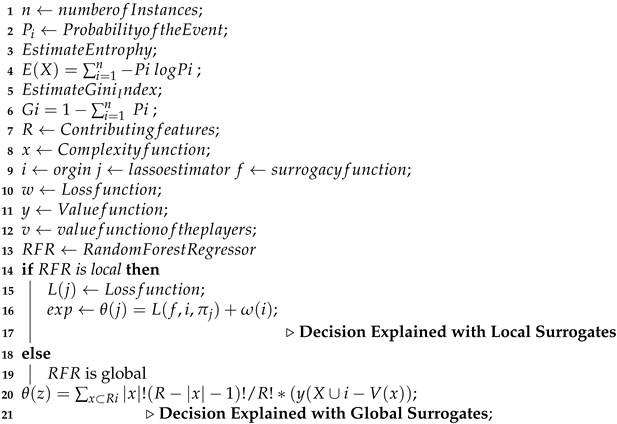
Algorithm 1 illustrates the credit risk analysis process as a mathematical model. It begins with the design of decision trees and then the generation of a random forest model through ensemble voting. Later, the algorithm is expanded with local and global surrogacy explanation with LIME and SHAP values XAI models. The algorithm represents the estimation of feature importance and determination of output with the magnitude of the features.
| Algorithm 1: Algorithm for credit explanation. |
 |
4. Results
The problem is binary classification and exponentially invariant. Hence, we selected two machine learning models to evaluate the performance of the classification. The 13 features and 1125 instances are classified as 900 risk-free data and 225 risk-oriented data. The dataset is preprocessed and missing value imputation is also performed. The accuracy of the models is presented in Table 2.

Table 2.
Comparison of machine learning models for binary classification.
A larger dataset with 32581 instances and 12 features was tested to understand the reliability of the model. There are 25,473 instances with risk and 7108 with no risk. There are features like person_age, person_income, person_home_ownership, person_emp_length, loan_grade, loan_amnt, loan_int_rate, loan_status, loan_percent_income, cb_person_ default_on_file, cb_person_cred_hist_length. There are 891 missing values in the dataset and person_emp_length, and 3116 missing instances in loan_int_rate. These missing values were addressed with mean imputation. Later, the classification was applied with the same decision tree and random forest classifiers, and the results show the stability of the model with an increase in the data samples. The accuracy is presented in Table 3. The confusion matrix for the classification is presented in Figure 3 and Figure 4. This confusion matrix shows the stability of the model in presenting the accuracy, precision, recall, and F1-score even with the increase in the data samples. The pruning of the decision tree and bagging of the random forest are generally capable of dealing with bias and overfitting of the data. But, in spite of the application of these models, there were imbalances in the dataset. The data imbalance in both cases on both datasets was substituted with a random oversampling technique. This bias in the training dataset can influence many machine learning algorithms, leading some to ignore the minority class entirely. This is a problem as it is typically the minority class for which predictions are most important.

Table 3.
Comparison of machine learning models for binary classification for larger dataset.
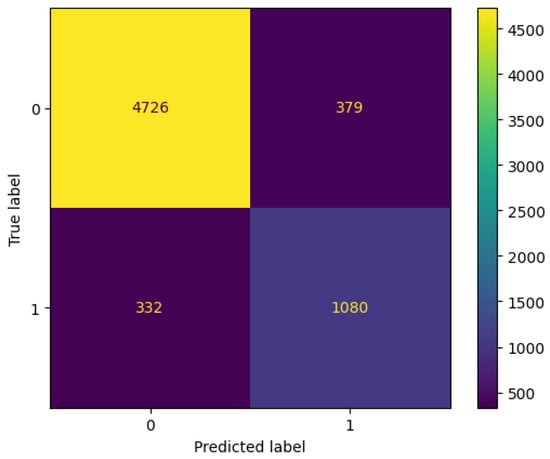
Figure 3.
Confusion matrix for the decision tree classifier.
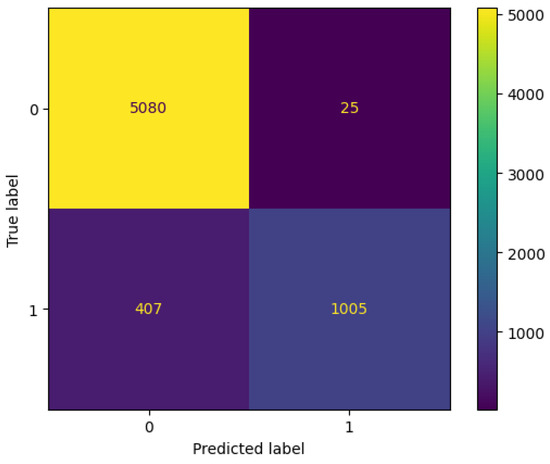
Figure 4.
Confusion matrix for the random forest classifier.
Random Oversampling
Random oversampling addresses the problem of class imbalance by randomly resampling the training dataset. There are two approaches for randomly resampling an imbalanced dataset. The first is to delete the samples from the majority class, called undersampling. The second is to synthetically generate the minority samples, which will increase the population of the minority class and, thus, bring balance to the classification problem. The proposed model uses the random oversampler where class 0 and class 1 are separated with a 50:50 constituency before the model training and the classification process. For the majority of the classes involved with the risk, the application of the random sampling becomes essential in the proposed work for the unbiased classification and in order to avoid the undesirable effects of the overfitting.
After the classification process, the random forest regressor model (RFR) is generated with a single random state. This model relates the features and arranges them for explainability. Then, this RFR model is applied to LIME for local explainability. The LIME provides the feature importance and the positive and negative impact of the features in determining the target output. The “red” color indicates a negative impact, and the “green” color indicates a positive impact towards the output, as depicted by Figure 2.
Id, fea2, fea3, and fea7 are negative towards the prediction. The remaining features are positive towards the prediction, as depicted by Figure 5.
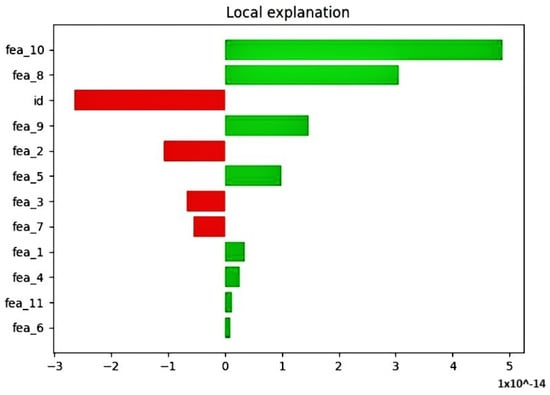
Figure 5.
Credit risk explanation with local surrogates.
The next representation is the summary plot which provides the order of the features based on determining the output magnitude. This is also a global explanation, where each feature is assigned a weight of importance, as depicted by Table 4.

Table 4.
Feature importance based on Shapley value prediction.
The summary plot provides a low- to high-risk trend line in which the contributing features show a “high” or “low” impact towards the prediction of high and low output. The red color has strong importance and the blue color shows weaker importance in determining the binary output. Figure 6 shows that has a low impact on predicting the output, and and have a high impact on predicting the output. This XAI graph shows feature importance by comparing it to the percentage of determining the output values, as shown in Figure 5.
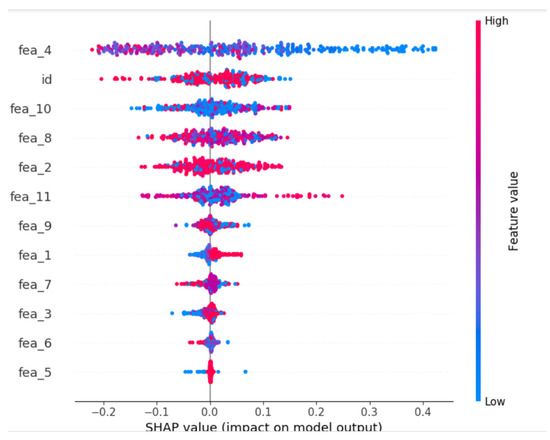
Figure 6.
Summary plot for feature important versus output magnitude.
The next implementation is the global surrogate model using SHAP values. This XAI model provides feature importance, dependencies, and what features are influencing the magnitude of the output. It contains various applications like force plot, summary plot, dependency plot, and decision plot. The force plot shows the overall distribution of the feature values, from high–low and low–high, as depicted by Figure 7.

Figure 7.
Force plot explanation for the distribution of data.
The dependency plot shows the dependency between two features in the global perception. This is an extended version of the partial dependency plot (PDP) used for the explanation of feature relationships. Figure 8, illustrates the relationship of with an id of the customer. The red dotted area indicates a stronger relationship and the blue area indicates a weaker one. It gives the dependency on the global perception, unlike the PDP.
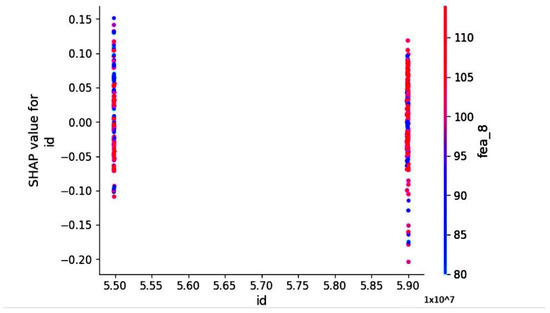
Figure 8.
Dependency plot in global explanation.
The final plot is the decision plot. This plot tells us the behavior of the model in local surrogacy, but it tells us what specific values of the feature the model behavior would evolve around. This plot is more meaningful for the classification problem than the regression. For example, this model can explain what values on features would lead to a credit risk or no risk classification.
This plot is a clear indicator of what features need to be improved to obtain the desired classification. The customer can understand by the handling of what features would he/she be able to increase their credit score. This plot is depicted in Figure 9. In this plot, the feature values are less than the threshold levels and lead the classification to the low-risk category. The and are slightly above the threshold levels. However, because their importance levels in determining the magnitude of the output are not trivial. they do not force the particular instance to the “high”-risk classification.
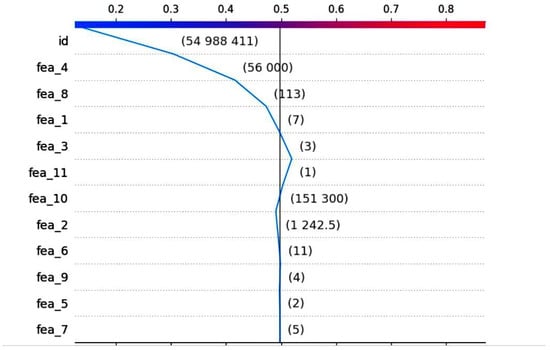
Figure 9.
Decision plot in global explanation for low risk.
5. Discussion
The study implemented decision tree and random forest models, both yielding remarkably high accuracy levels of 0.90 and 0.94, respectively. This robust predictive performance highlights the strength of explainable AI (XAI) models in enhancing the precision and reliability of credit risk assessments. Shapley values played a pivotal role in providing insights into the contribution of underlying explanatory variables to the overall risk prediction, fostering a transparent and understandable credit risk evaluation process.
The integration of Local Interpretable Model-agnostic Explanations (LIME) and Shapley models in both local and global surrogates further strengthened the interpretability of the developed XAI models. This not only aids in comprehending individual predictions but also provides a holistic view of the model’s decision-making process on a larger scale.
When compared to traditional credit scoring models such as logistic regression and linear discriminant analysis, the proposed XAI model demonstrates clear advantages. Traditional models, while effective, often rely on simplified assumptions about the relationship between variables, which may overlook complex, nonlinear patterns in the data. In contrast, the decision tree and random forest models used in this study capture these intricate relationships, leading to higher predictive accuracy. Furthermore, traditional models generally lack the ability to provide interpretable insights into their predictions. By using Shapley values and LIME, our model not only maintains high performance but also offers transparency—a key requirement in regulatory environments and for building trust with financial institutions and borrowers.
While the study achieved impressive accuracy levels, it is essential to acknowledge certain limitations inherent in the proposed approach. The transparency introduced by Shapley values and the interpretability provided by LIME and Shapley models come at the cost of computational complexity. The processing time required for these models may be a concern, particularly in real-time financial applications where quick decision making is crucial.
This study focused on binary classification for credit risk assessment, which may not fully capture the nuanced nature of creditworthiness. Future research could explore more sophisticated models that consider multiclass scenarios and adapt to the dynamic nature of financial markets. To address the computational complexity associated with Shapley values, further research could explore optimization techniques or alternative explainability methods that strike a balance between accuracy and efficiency. Integrating real-time data streams and continuously updating models can enhance their adaptability to evolving financial landscapes.
Moreover, expanding the scope of the study to incorporate a wider range of features and variables, such as socioeconomic factors and macroeconomic indicators, could lead to a more comprehensive understanding of credit risk. The development of hybrid models combining traditional credit scoring methods with XAI approaches could potentially leverage the strengths of both paradigms, offering a well-rounded solution to modern credit risk management challenges.
In addition to credit risk management, the proposed XAI model holds promise for other areas within finance, such as fraud detection, portfolio optimization, and operational risk management. The model’s transparency and interpretability enable it to provide valuable insights into risk factors across various financial contexts. For instance, in fraud detection, the ability of XAI to identify the key contributing factors to anomalous activities can enhance decision making. Similarly, in portfolio management, the model’s explainability can help assess investment risks more effectively by revealing underlying factors driving market performance. The adaptability of XAI models across different financial domains underscores their potential for enhancing trust and transparency in decision making across the sector.
6. Conclusions
The results show that the XAI models can explain both classification and regression-based results obtained from the machine learning algorithm. The random forest model fetched the best accuracy of 0.94 in both the datasets used for the study. The technical aspects of this proposed work are interesting and useful. However, there are many challenges like privacy, security, and integrity. The XAI models are transparent, so it is extremely important to discriminate what details of the customer can be utilized for explanation and what details are to be kept private. Thus, it makes it difficult to use XAI in next-generation blockchain non-fungible token (NFT)-based transactions. These areas and collaboration of XAI with meta-verse, Industry 5.0, Web 3.0, and 6G need more effort and detailed research. Credit risk evaluation is extremely useful and helps the bank to safeguard themselves from legal challenges, and it is also useful for the customers to enhance their credit scores to improve the possibility of availing various loans.
The presented research marks a significant step forward in utilizing XAI for credit risk management. While acknowledging the achieved accuracy and transparency, it is imperative to address computational complexities and expand the scope for a more nuanced and adaptable credit risk assessment in the ever-evolving financial landscape. The findings lay a foundation for future advancements that aim to revolutionize the intersection of artificial intelligence and financial risk management.
Author Contributions
Original writing—M.K.N., H.C. and V.G.; review—M.K.N.; formal analysis—M.K.N., P.J., J.B., V.P.M. and B.B.; investigation—M.K.N.; project management—B.B.; validation—P.J., J.B. and V.P.M.; supervision—J.B., V.P.M. and I.A.H.; editing—V.P.M. and I.A.H.; funding—I.A.H.; visualization and resources—B.B.; software—M.K.N.; methodology—M.K.N. and V.G. All authors have read and agreed to the published version of the manuscript.
Funding
This research was funded by the Norwegian University of Science and Technology, Norway.
Data Availability Statement
Publicly available datasets were analyzed in this study. These data can be found at Yahoo Finance.
Conflicts of Interest
The authors declare that there are no conflicts of interest.
References
- Bastos, João A., and Sara M. Matos. 2022. Explainable models of credit losses. European Journal of Operational Research 301: 386–94. [Google Scholar] [CrossRef]
- Biecek, Przemysław, Marcin Chlebus, Janusz Gajda, Alicja Gosiewska, Anna Kozak, Dominik Ogonowski, Jakub Sztachelski, and Piotr Wojewnik. 2021. Enabling machine learning algorithms for credit scoring–explainable artificial intelligence (xai) methods for clear understanding complex predictive models. arXiv arXiv:2104.06735. [Google Scholar]
- Bussmann, Niklas, Paolo Giudici, Dimitri Marinelli, and Jochen Papenbrock. 2020. Explainable ai in fintech risk management. Frontiers in Artificial Intelligence 3: 26. [Google Scholar] [CrossRef] [PubMed]
- Choi, Edward, Mohammad Taha Bahadori, Joshua A. Kulas, Andy Schuetz, Walter F. Stewart, and Jimeng Sun. 2017. Retain: An interpretable predictive model for healthcare using reverse time attention mechanism. Paper presented at NIPS’16: Proceedings of the 30th International Conference on Neural Information Processing Systems, Long Beach, CA, USA, December 4–9. [Google Scholar]
- Cohen, Joseph, Xun Huan, and Jun Ni. 2023. Shapley-based explainable ai for clustering applications in fault diagnosis and prognosis. arXiv arXiv:2303.14581. [Google Scholar] [CrossRef]
- de Lange, Petter Eilif, Borger Melsom, Christian Bakke Vennerød, and Sjur Westgaard. 2022. Explainable ai for credit assessment in banks. Journal of Risk and Financial Management 15: 556. [Google Scholar] [CrossRef]
- Demajo, Lara Marie, Vince Vella, and Alexiei Dingli. 2020. Explainable AI for interpretable credit scoring. In Computer Science and Information Technology. Chennai: AIRCC Publishing Corporation. [Google Scholar] [CrossRef]
- Doersch, Carl. 2021. Tutorial on variational autoencoders. arXiv arXiv:1606.05908v3. [Google Scholar]
- European Union. 2016. Regulation (EU) 2016/867 of the European Central Bank of 18 May 2016 on the collection of granular credit and credit risk data (ECB/2016/13). Official Journal of the European Union CELEX:32016R0867. [Google Scholar]
- Fahner, Gerald. 2018. Developing transparent credit risk scorecards more effectively: An explainable artificial intelligence approach. Paper presented at Data Analytics 2018, Athens, Greece, November 18–22. [Google Scholar]
- Galindo, Jorge, and Pablo Tamayo. 2000. Credit risk assessment using statistical and machine learning: Basic methodology and risk modeling applications. Computational Economics 15: 107–143. [Google Scholar] [CrossRef]
- Giudici, Paolo, and Emanuela Raffinetti. 2020. Shapley-lorenz decompositions in explainable artificial intelligence. SSRN Electronic Journal 1: 1–15. [Google Scholar] [CrossRef]
- Gramegna, Alex, and Paolo Giudici. 2021. Shap and lime: An evaluation of discriminative power in credit risk. Frontiers in Artificial Intelligence 4: 752558. [Google Scholar] [CrossRef]
- Guan, Charles, Hendra Suryanto, Ashesh Mahidadia, Michael Bain, and Paul Compton. 2023. Responsible credit risk assessment with machine learning and knowledge acquisition. Human-Centric Intelligent Systems 3: 232–43. [Google Scholar] [CrossRef]
- Hand, David J. 2009. Measuring classifier performance: A coherent alternative to the area under the roc curve. Machine Learning 77: 103–23. [Google Scholar] [CrossRef]
- Heng, Yi, and Preethi Subramanian. 2022. A Systematic Review of Machine Learning and Explainable Artificial Intelligence (XAI) in Credit Risk Modelling. Berlin: Springer, pp. 596–614. [Google Scholar] [CrossRef]
- Hu, Yong, and Jie Su. 2022. Research on credit risk evaluation of commercial banks based on artificial neural network model. Procedia Computer Science 199: 1168–76. [Google Scholar] [CrossRef]
- Joseph, Andreas. 2020. Parametric Inference with Universal Function Approximators. arXiv arXiv:1903.04209. [Google Scholar]
- Liao, Q. Vera, Moninder Singh, Yunfeng Zhang, and Rachel K. E. Bellamy. 2020. Introduction to explainable ai. Paper presented at the Extended Abstracts of the 2020 CHI Conference on Human Factors in Computing Systems, CHI EA ’20, New York, NY, USA, April 25–30; pp. 1–4. [Google Scholar] [CrossRef]
- Lundberg, Scott, and Su-In Lee. 2017a. A Unified Approach to Interpreting Model Predictions. Paper presented at the NIPS’17: Proceedings of the 31st International Conference on Neural Information Processing Systems, Long Beach, CA, USA, December 4–9. [Google Scholar]
- Lundberg, Scott M, and Su-In Lee. 2017b. A unified approach to interpreting model predictions. In Advances in Neural Information Processing Systems. Edited by I. Guyon, U. V. Luxburg, S. Bengio, H. Wallach, R. Fergus, S. Vishwanathan and R. Garnett. Red Hook: Curran Associates, Inc., vol. 30. [Google Scholar]
- Mestikou, Mohamed, Katre Smeti, and Yassine Hachaïchi. 2023. Artificial intelligence and machine learning in financial services market developments and financial stability implications. Financial Stability Board 1: 1–6. [Google Scholar] [CrossRef]
- Misheva, Branka, Joerg Osterrieder, Ali Hirsa, Onkar Kulkarni, and Stephen Lin. 2021. Explainable ai in credit risk management. Social Science Research Network 1: 1–16. [Google Scholar]
- Molnar, Christoph. 2022. Interpretable Machine Learning, 2nd ed. Morrisville: Lulu Press. Available online: http://christophm.github.io/interpretable-ml-book/ (accessed on 31 July 2024).
- Nag, Anindya, Md Mehedi Hassan, Dishari Mandal, Nisarga Chand, Md Babul Islam, VP Meena, and Francesco Benedetto. 2024. A review of machine learning methods for iot network-centric anomaly detection. Paper presented at the 2024 47th International Conference on Telecommunications and Signal Processing (TSP), Virtually, July 10–12; pp. 26–31. [Google Scholar]
- Pedregosa, Fabian, Gael Varoquaux, Alexandre Gramfort, Vincent Michel, Bertrand Thirion, Olivier Grisel, Mathieu Blondel, Peter Prettenhofer, Ron Weiss, Vincent Dubourg, and et al. 2012. Scikit-learn: Machine learning in python. Journal of Machine Learning Research 12: 2825–30. [Google Scholar]
- Qadi, Ayoub El, Natalia Diaz-Rodriguez, Maria Trocan, and Thomas Frossard. 2021. Explaining credit risk scoring through feature contribution alignment with expert risk analysts. arXiv arXiv:2103.08359. [Google Scholar]
- Ribeiro, Marco Tulio, Sameer Singh, and Carlos Guestrin. 2016. “Why should i trust you?”: Explaining the predictions of any classifier. arXiv arXiv:1602.04938. [Google Scholar]
- Ribeiro, Marco Tulio, Sameer Singh, and Carlos Guestrin. 2018. Anchors: High-precision model-agnostic explanations. Paper presented at the Thirty-Second AAAI Conference on Artificial Intelligence and Thirtieth Innovative Applications of Artificial Intelligence Conference and Eighth AAAI Symposium on Educational Advances in Artificial Intelligence, New Orleans, LA, USA, February 2–7. [Google Scholar]
- Sadok, Hicham, Fadi Sakka, and Mohammed El Hadi El Maknouzi. 2022. Artificial intelligence and bank credit analysis: A review. Cogent Economics & Finance 10: 2023262. [Google Scholar] [CrossRef]
- Salih, Ahmed, Zahra Raisi, Ilaria Boscolo Galazzo, Petia Radeva, Steffen Petersen, Gloria Menegaz, and Karim Lekadir. 2023. Commentary on explainable artificial intelligence methods: Shap and lime. arXiv arXiv:2305.02012v3. [Google Scholar]
- Srivastava, Gautam, Rutvij H Jhaveri, Sweta Bhattacharya, Sharnil Pandya, Rajeswari, Praveen Kumar Reddy Maddikunta, Gokul Yenduri, Jon G. Hall, Mamoun Alazab, and Thippa Reddy Gadekallu. 2022. Xai for cybersecurity: State of the art, challenges, open issues and future directions. arXiv arXiv:2206.03585. [Google Scholar]
- Torrent, Neus Llop, Giorgio Visani, and Enrico Bagli. 2021. Psd2 explainable ai model for credit scoring. arXiv arXiv:2011.10367. [Google Scholar]
- Tyagi, Swati. 2022. Analyzing machine learning models for credit scoring with explainable ai and optimizing investment decisions. arXiv arXiv:2209.09362. [Google Scholar]
- Ul Islam Khan, Mahbub, Md Ilius Hasan Pathan, Mohammad Mominur Rahman, Md Maidul Islam, Mohammed Arfat Raihan Chowdhury, Md Shamim Anower, Md Masud Rana, Md Shafiul Alam, Mahmudul Hasan, Md Shohanur Islam Sobuj, and et al. 2024. Securing electric vehicle performance: Machine learning-driven fault detection and classification. IEEE Access 12: 71566–84. [Google Scholar] [CrossRef]
- Vincenzo Moscato, Antonio Picariello, and Giancarlo Sperlí. 2021. A benchmark of machine learning approaches for credit score prediction. Expert Systems with Applications 165: 113986. [Google Scholar] [CrossRef]
- Walambe, Rahee, Ashwin Kolhatkar, Manas Ojha, Akash Kademani, Mihir Pandya, Sakshi Kathote, and Ketan Kotecha. 2020. Integration of explainable ai and blockchain for secure storage of human readable justifications for credit risk assessment. Paper presented at the International Advanced Computing Conference, Panaji, India, December 5–6; pp. 55–72. [Google Scholar]
- Wattenberg, Martin, Fernanda Viégas, and Ian Johnson. 2016. How to Use t-Sne Effectively. Distill 1: 1–6. [Google Scholar] [CrossRef]
Disclaimer/Publisher’s Note: The statements, opinions and data contained in all publications are solely those of the individual author(s) and contributor(s) and not of MDPI and/or the editor(s). MDPI and/or the editor(s) disclaim responsibility for any injury to people or property resulting from any ideas, methods, instructions or products referred to in the content. |
© 2024 by the authors. Licensee MDPI, Basel, Switzerland. This article is an open access article distributed under the terms and conditions of the Creative Commons Attribution (CC BY) license (https://creativecommons.org/licenses/by/4.0/).