Article

Cryptocurrency Portfolio Allocation under Credibilistic CVaR Criterion and Practical Constraints

by
Hossein Ghanbari
1,
Emran Mohammadi
1,*,
Amir Mohammad Larni Fooeik
1,
Ronald Ravinesh Kumar
2,
Peter Josef Stauvermann
3 and
Mostafa Shabani
1
1
Department of Industrial Engineering, Faculty of Industrial Engineering, Iran University of Science and Technology, Tehran 13114-16846, Iran
2
Department of Economics and Finance, The Business School, RMIT University, Saigon South Campus, Ho Chi Minh City 700000, Vietnam
3
School of Global Business & Economics, Changwon National University, Gyeongnam, 9, Sarim Dong, Changwon 641-773, Republic of Korea
*
Author to whom correspondence should be addressed.
Risks 2024, 12(10), 163; https://doi.org/10.3390/risks12100163
Submission received: 5 September 2024 / Revised: 5 October 2024 / Accepted: 10 October 2024 / Published: 11 October 2024
(This article belongs to the Special Issue Cryptocurrency Pricing and Trading)

Abstract

:
The cryptocurrency market offers attractive but risky investment opportunities, characterized by rapid growth, extreme volatility, and uncertainty. Traditional risk management models, which rely on probabilistic assumptions and historical data, often fail to capture the market’s unique dynamics and unpredictability. In response to these challenges, this paper introduces a novel portfolio optimization model tailored for the cryptocurrency market, leveraging a credibilistic CVaR framework. CVaR was chosen as the primary risk measure because it is a downside risk measure that focuses on extreme losses, making it particularly effective in managing the heightened risk of significant downturns in volatile markets like cryptocurrencies. The model employs credibility theory and trapezoidal fuzzy variables to more accurately capture the high levels of uncertainty and volatility that characterize digital assets. Unlike traditional probabilistic approaches, this model provides a more adaptive and precise risk management strategy. The proposed approach also incorporates practical constraints, including cardinality and floor and ceiling constraints, ensuring that the portfolio remains diversified, balanced, and aligned with real-world considerations such as transaction costs and regulatory requirements. Empirical analysis demonstrates the model’s effectiveness in constructing well-diversified portfolios that balance risk and return, offering significant advantages for investors in the rapidly evolving cryptocurrency market. This research contributes to the field of investment management by advancing the application of sophisticated portfolio optimization techniques to digital assets, providing a robust framework for managing risk in an increasingly complex financial landscape.

1. Introduction

Investing is a crucial aspect of personal finance and economic growth (Keller and Siegrist 2006; Shane 2012). In recent years, the investment landscape has become increasingly diverse, with a proliferation of market options available to investors (Greenwood et al. 2000). One such market that has gained significant attention is the cryptocurrency market (Babaioff et al. 2012). The cryptocurrency market, which includes digital currencies like Bitcoin and Ethereum, offers investors the opportunity to participate in a rapidly evolving and potentially lucrative asset class (Elbahrawy et al. 2017; Bouri et al. 2019). The cryptocurrency market is seen as an attractive investment option for several reasons. Firstly, the high volatility and potential for substantial returns in the cryptocurrency market have attracted many risk-tolerant investors seeking to capitalize on this emerging asset class. Additionally, the cryptocurrency market has the potential to bring about transformative changes in the global financial landscape. The underlying blockchain technology that supports cryptocurrencies has numerous applications beyond digital currencies, such as enabling secure and transparent transactions, smart contracts, and decentralized finance solutions. As the cryptocurrency market continues to evolve and mature, it is likely to play an increasingly important role in the overall investment landscape, offering investors new opportunities for diversification and potential growth (Wątorek et al. 2021).
However, while these markets can offer significant opportunities, they also come with heightened risks, characterized by substantial price volatility and regulatory uncertainties (Canh et al. 2019; Almeida et al. 2022). The cryptocurrency market, in particular, is known for its high degree of volatility, with digital currencies experiencing dramatic price swings that can lead to significant gains or losses for investors. Additionally, the regulatory landscape surrounding cryptocurrencies remains fluid, with various governments and financial authorities around the world taking different approaches to the classification and oversight of these assets. Therefore, developing a sound investment strategy is essential for navigating this complex landscape. Among the various strategies available, stock portfolio optimization stands out as an effective approach, enabling investors to balance risk and return by strategically allocating assets within a well-diversified portfolio. By leveraging this strategy, investors can enhance their chances of achieving favorable outcomes in the dynamic environment of cryptocurrency markets.
Portfolio optimization is one of the most dynamic and evolving topics in modern financial theory (Mansini et al. 2014; Kolm et al. 2014; Khosravi et al. 2024), with its foundations tracing back to the pioneering work of Markowitz (1952). In his seminal paper published that year, Markowitz put forward the mean-variance model for portfolio selection, framing it as a bi-criteria optimization problem with a tradeoff between risk and profit. This contribution laid the foundation for modern portfolio theory, which has since become a fundamental aspect of investment management and financial decision-making. The core premise of portfolio optimization is the recognition that risk and return are inextricably linked, and that by carefully balancing the composition of an investment portfolio, investors can potentially enhance their risk-adjusted returns. Portfolio selection problems have, consequently, attracted significant attention in the realm of risk management, with variance emerging as a prominent tool for quantifying and managing investment risk. In the pursuit of more sophisticated risk measures, researchers have developed a variety of alternative approaches, with Value at Risk (VaR) (Longerstaey and Spencer 1996) and Conditional Value at Risk (CVaR) (Rockafellar and Uryasev 2000, 2002) garnering considerable attention and adoption in the financial industry (Ghanbari et al. 2023). However, it is important to note that uncertainty remains a prevalent aspect of capital markets, as much of the information used to make investment decisions is inherently uncertain, imprecise, or incomplete (Eskorouchi et al. 2024). To address the challenges posed by uncertainty, researchers have explored alternative approaches, such as the fuzzy set theory introduced by Zadeh (1965). One of the more recent developments in this domain is credibility theory, which was introduced by Liu (2004) and further developed in Liu’s (2007) work. In the context of fuzzy decision systems, portfolio optimization problems have been studied using credibility-based models, with researchers proposing innovative credibility measures for modeling asset returns.
While extensive research has focused on these portfolio optimization techniques and their applications in traditional financial markets, there remains a significant gap in the literature regarding the integration of cryptocurrency markets into these optimization frameworks. The unique characteristics of the cryptocurrency market, such as its high volatility and regulatory uncertainties, necessitate the development of specialized approaches to portfolio management and risk mitigation in this rapidly evolving domain.
This paper aims to address this gap by proposing a novel portfolio allocation model that incorporates the cryptocurrency market within a credibilistic CVaR optimization framework. CVaR is selected as the primary risk measure due to its focus on downside risk, specifically targeting extreme losses, which makes it particularly effective for managing the heightened risk of sharp downturns in highly volatile markets like cryptocurrencies. The model incorporates credibility theory and trapezoidal fuzzy variables to more accurately reflect the uncertainty and volatility inherent in digital assets. Additionally, the approach includes practical constraints such as cardinality and floor and ceiling constraints, ensuring the portfolio remains diversified, balanced, and aligned with real-world factors like transaction costs and regulatory requirements. By leveraging credibility theory to capture the uncertainty in asset returns and incorporating practical investment constraints, the proposed model allows investors to build well-diversified portfolios that effectively balance risk and return in the cryptocurrency market. This research represents a significant step forward in the application of advanced portfolio optimization techniques to the dynamic and rapidly changing landscape of digital assets.
The remainder of this paper is organized as follows: Section 2 presents a comprehensive literature review, examining the existing research on portfolio optimization techniques, with a particular focus on the integration of cryptocurrency markets and the application of fuzzy set theory and credibility theory in this domain. This section identifies the research gaps and outlines the motivation for the current study. Section 3 delves into the key concepts and definitions of fuzzy numbers and credibility theory within the context of cryptocurrency investing. This section establishes the mathematical foundations, including the computational formulas for CVaR under the credibility theory framework, which are essential for the proposed portfolio optimization model. In Section 4, the paper provides an in-depth description of the suggested portfolio selection model. This model incorporates the unique characteristics of the cryptocurrency market and leverages the principles of credibility theory to capture the inherent uncertainty in asset returns. Section 5 presents the empirical results and computational analysis of the proposed portfolio optimization model using real-world cryptocurrency market data. Section 6 offers an in-depth discussion, critically analyzing both the theoretical framework and empirical performance of the proposed model. It delves into the underlying assumptions, justifications, and mechanisms driving the model, while also evaluating its practical outcomes. Finally, Section 7 encapsulates the key conclusions drawn from the study and explores potential avenues for further development of the proposed approach.

2. Literature Review

This section presents a comprehensive review of the relevant literature underpinning the concepts and methodologies utilized in this article. The review examines three key areas: (1) the existing research on portfolio optimization techniques focusing on cryptocurrency markets; (2) the application of credibility theory and fuzzy set principles in portfolio optimization, exploring the theoretical foundations and advantages of these approaches in capturing uncertainty; and (3) the research gap that the current study aims to address.

2.1. Cryptocurrency Portfolio Optimization

Cryptocurrency portfolio optimization has garnered substantial attention recently, driven by the growing complexity and volatility of digital asset markets. Researchers and financial analysts have increasingly focused on developing various models and strategies to manage risk and enhance returns in cryptocurrency investments. This literature review is dedicated to exploring the diverse methodologies and approaches employed in cryptocurrency portfolio optimization, emphasizing the key findings and advancements that shape this rapidly evolving field.
James and Menzies (2023) explored whether the cryptocurrency market has recently displayed mathematical characteristics similar to those of the equity market. Rather than using traditional portfolio theory, which is based on the financial behavior of equity securities, they shifted their focus to the purchasing behaviors of retail cryptocurrency investors. Their study concentrated on collective market dynamics and portfolio diversification in the cryptocurrency space, assessing the extent to which findings from the equity market apply to cryptocurrencies. Bowala and Singh (2022) optimized the portfolio risk associated with cryptocurrencies by employing data-driven risk measures that account for the high skewness and kurtosis of cryptocurrency returns. The authors argue that traditional risk measures, which often assume normality in asset returns, tend to underestimate the risks associated with cryptocurrency investments due to their failure to account for the non-normal distribution of returns. To address this issue, the paper introduces a novel approach to risk forecasting that leverages high-frequency data to better capture the volatility and risk dynamics of cryptocurrencies. The paper’s objective is to demonstrate that this data-driven method is superior to traditional methods in optimizing cryptocurrency portfolios. Sahu et al. (2024) investigated and compared different portfolio optimization methods and short-term investment strategies for the cryptocurrency market. Focusing on the top ten cryptocurrencies by market capitalization, the study employs high-frequency data to evaluate the effectiveness of two primary optimization strategies—Sharpe ratio maximization and kurtosis minimization—with the aim to determine the strategy that could offer the best performance in terms of optimizing returns and managing risks, particularly for short-term investment horizons. Chen (2023) evaluated the applicability and effectiveness of modern portfolio theory (MPT) by examining whether traditional MPT principles, such as diversification and risk–return optimization, remain relevant and effective when applied to portfolios that incorporate cryptocurrencies. Jeleskovic et al. (2024) assessed the effectiveness of integrating cryptocurrencies into traditional portfolios using a GARCH-Copula model within the Markowitz framework to determine if these techniques improve portfolio optimization, particularly by enhancing the Sharpe ratio and overall stability. The study examined the risk–return profile across three portfolio types: traditional assets, cryptocurrencies, and a combination of both (hybrid). (Kim et al. 2024) empirically investigated the impact of incorporating cryptocurrencies into global asset portfolios using ensemble approaches and tracing strategies. The study specifically evaluates the performance of portfolios with cryptocurrency allocations of 1%, 3%, and 5% across several portfolio optimization strategies, including minimum variance, maximum diversification, equal risk contribution, and hierarchical risk parity. The study demonstrated how different allocation ratios of cryptocurrencies affect portfolio performance metrics such as returns, volatility, the Sharpe ratio, and maximum drawdown. (Hrytsiuk et al. 2019) developed and applied a modified Markowitz model for optimizing cryptocurrency portfolios using a VaR measure instead of the traditional variance as a risk metric. The study challenges the assumption of normally (Gaussian) distributed financial asset returns, which underpins the standard Markowitz model, by demonstrating that cryptocurrency returns follow a Cauchy distribution. The authors aimed to improve risk assessment and portfolio optimization by incorporating this non-normal distribution, which better captures the heavy tails and extreme risks associated with cryptocurrencies. Brauneis and Mestel (2019) applied the Markowitz mean-variance framework to assess the risk–return benefits of diversified cryptocurrency portfolios. Analyzing three years of daily data from 500 top cryptocurrencies, they examined how combining different cryptocurrencies can reduce risk compared to single investments. The study evaluates various portfolio strategies, including naively diversified portfolios and those optimized for maximum return and minimum variance, providing empirical evidence on the advantages of diversified cryptocurrency portfolios versus focusing on individual cryptocurrencies like Bitcoin. Ma et al. (2020) explored the impact of adding five major cryptocurrencies—Bitcoin, Ethereum, Ripple, Bitcoin Cash, and Litecoin—to traditional asset portfolios to enhance diversification and optimize returns. By analyzing data from 2015 to 2019, the research evaluates how these additions affect the risk–return profile across various asset classes, and compares different portfolio optimization techniques, focusing on which cryptocurrencies, especially between Ethereum and Bitcoin, offer better diversification benefits. Mba et al. (2018) developed and compared two novel models, the GARCH-DE and GARCH-DE-t-copula, against the traditional Differential Evolution (DE) model for optimizing cryptocurrency portfolios across single- and multi-period frameworks. The study aims to enhance portfolio risk management by capturing the complex dependency structures and extreme risks inherent in cryptocurrencies, particularly using t-copula in the GARCH-DE-t-copula model. The objective is to determine which model provides better risk control and higher returns in the context of the highly volatile cryptocurrency market. Aljinović et al. (2021) proposed a multicriteria approach using the PROMETHEE II method for optimizing cryptocurrency portfolios. The study incorporates a wide range of criteria beyond the traditional return and risk, including market capitalization, trading volume, VaR, CVaR, and the attractiveness of cryptocurrencies. By applying this model to a dataset from January 2017 to February 2020, the authors aim to demonstrate that this multicriteria approach yields superior portfolio performance compared to commonly used portfolio optimization models, particularly in out-of-sample performance across various risk and return metrics. Maghsoodi (2023) developed a hybrid decision support system for cryptocurrency portfolio management, combining time series forecasting using the Prophet Forecasting Model (PFM) with an enhanced CLUS-MCDA II algorithm. The study aims to guide investors in optimizing their portfolio allocation with over 70 cryptocurrencies by integrating advanced clustering methods like DBSCAN with multicriteria decision analysis (MCDM) techniques such as VIKOR and MULTIMOORA. The objective is to provide a robust tool for investors to make informed decisions in the highly dynamic and complex cryptocurrency market. Mba and Mwambi (2020) developed a Markov-switching COGARCH-R-vine (MSCOGARCH) model to optimize cryptocurrency portfolios by capturing structural breaks, heavy tails, and volatility clustering. The study compares the performance of the MSCOGARCH model with a single-regime COGARCH model, demonstrating that the MSCOGARCH model provides a better risk estimation and portfolio optimization by accommodating regime changes in volatility. The research offers a more flexible approach to portfolio management in the volatile cryptocurrency market.

2.2. Application of Credibility Theory in Portfolio Optimization Problems

Credibilistic portfolio optimization has garnered substantial attention in recent years due to its effectiveness in managing uncertainty and ambiguity in financial markets. The application of credibility theory, which leverages fuzzy logic to model and handle uncertain information, has been increasingly recognized as a valuable approach to portfolio optimization problems. Researchers have explored various aspects of credibilistic optimization, including its ability to incorporate subjective judgments and expert opinions into the decision-making process. This approach has proven particularly useful in markets characterized by high volatility and limited historical data. This literature review is dedicated to exploring the application of credibility theory in portfolio optimization, highlighting key methodologies, advancements, and empirical findings in this emerging field.
Liu et al. (2018) introduced a new portfolio optimization model using a credibilistic CVaR criterion to manage the market risk associated with financial asset price fluctuations. The study extends the traditional mean-variance models by incorporating the CVaR of fuzzy variables as a risk measure, which better captures downside risks. The model is designed to separate undesirable downside movements from desirable upside movements, providing a more effective risk management tool. The paper also demonstrates the computational advantages of the proposed model by solving it using deterministic mixed-integer programming techniques. Mohebbi and Najafi (2018) developed a multi-period fuzzy portfolio optimization model that integrates credibility theory with scenario tree analysis to manage market uncertainty. The study aims to optimize portfolios by considering transaction costs and risk-free investments, using a bi-objective VaR approach. The model incorporates real-world constraints, such as cardinality, threshold, class, and liquidity, and is solved using an interactive dynamic programming method. The objective is to provide a more practical and effective solution for investors by addressing the inherent uncertainties in financial markets through fuzzy set theory and scenario analysis. Deng et al. (2018) proposed a fuzzy mean-entropy portfolio model incorporating transaction costs, based on credibility theory, to better measure risk and optimize portfolio selection. The study introduces entropy as a more effective risk measure compared to variance, particularly in the context of fuzzy financial markets. The authors also conduct a sensitivity analysis to examine how changes in model parameters affect the optimal portfolio solution. The objective is to provide investors with a robust model that accommodates transaction costs and offers a more stable portfolio optimization in uncertain financial environments. Liu et al. (2016) introduced a multi-period portfolio optimization model that integrates bankruptcy control within a fuzzy economic environment using credibility theory. The study aims to maximize terminal wealth while minimizing cumulative risk and uncertainty over the investment horizon. The model incorporates affine recourse to account for the influence of historical prediction biases on current portfolio decisions. Additionally, the authors develop a hybrid particle swarm optimization algorithm to solve the model, offering a practical solution for investors to manage risk and avoid bankruptcy in multi-period investment scenarios. Gupta et al. (2021) developed a multi-period portfolio optimization model using coherent fuzzy numbers within a credibilistic environment. The study aims to offer investors greater flexibility in specifying risk tolerance by employing mean absolute semi-deviation and CVaR as risk measures. The model incorporates various real-world constraints, such as cardinality, skewness, and transaction costs, to optimize investment plans over different time horizons. The paper also demonstrates the effectiveness of the model through real-life case studies involving assets from the National Stock Exchange of India and major U.S. stock indices. Mehlawat et al. (2021) proposed a multiobjective portfolio optimization model that uses coherent fuzzy numbers within a credibilistic environment. The study extends the traditional portfolio optimization by allowing investors to incorporate their attitudes (pessimistic, optimistic, or neutral) toward financial markets, using a new credibility function. The model replaces the traditional variance with mean-absolute semi-deviation as a more realistic risk measure and includes skewness to capture the asymmetry of returns. The paper demonstrates the effectiveness of this approach through numerical examples and a genetic algorithm solution method, providing greater flexibility and accuracy in modeling investor preferences and market uncertainties. García et al. (2019) extend the traditional mean-semivariance portfolio selection model by introducing a multiobjective credibilistic model that includes the Price-to-Earnings Ratio (PER) as an additional criterion for portfolio performance. The study aims to address the limitations of the classic mean-variance framework by incorporating L-R power fuzzy numbers to model uncertainty in asset returns and PER, and by applying real-world constraints such as budget, bounds, and cardinality. The model is tested using stocks from the Latin American Integrated Market, demonstrating that the model effectively generates a diversified set of efficient portfolios under multiple objectives. García et al. (2020) proposed a novel multiobjective portfolio optimization model that extends the stochastic mean-variance framework to incorporate fuzzy multiobjective criteria, specifically return, risk, and liquidity, using trapezoidal fuzzy numbers. The study introduces the credibilistic Sortino ratio and STARR ratio to evaluate and select optimal portfolios along the efficient frontier. The model is solved using the NSGA-II algorithm and tested with empirical data from the S&P 100 index, demonstrating that the proposed approach can outperform traditional benchmarks in terms of return and risk during the analyzed period.

2.3. Research Gap and Hypotheses Development

Despite the growing interest in cryptocurrency investments, the literature on portfolio allocation under uncertainty in the cryptocurrency market remains limited. The unique characteristics of this market, including extreme volatility and regulatory uncertainties, necessitate the development of specialized portfolio management and risk mitigation strategies. These challenges highlight the critical need for integrating uncertainty modeling techniques into optimization frameworks. Although traditional risk measures and their applications in portfolio optimization have been widely studied, the use of fuzzy logic—specifically the credibilistic approach—to address the inherent uncertainty and ambiguity in cryptocurrency markets is still underexplored. Moreover, essential practical constraints such as cardinality and floor and ceiling constraints are frequently overlooked in existing models, resulting in a significant gap in the creation of robust and practical portfolio strategies. This study seeks to bridge these gaps by applying the credibilistic CVaR criterion to cryptocurrency portfolio allocation, incorporating practical constraints to enhance the realism and applicability of the proposed models.
Drawing from the insights gained through the reviewed literature, we propose the following hypotheses to address the identified research gaps and advance the understanding of portfolio optimization in cryptocurrency markets:
  • The credibilistic CVaR framework with trapezoidal fuzzy variables will optimize cryptocurrency portfolios more effectively than traditional models;
  • Practical constraints like cardinality and floor and ceiling constraints will create well-diversified portfolios with improved risk-adjusted returns;
  • The proposed model will enhance risk management and decision-making for cryptocurrency investors.

3. Preliminaries

In this section, we will revisit several foundational concepts and definitions that are essential for understanding the subsequent material. Our focus will be particularly on the theory of fuzzy numbers and credibility theory, both of which play a crucial role in the analytical framework of this work.

3.1. Fuzzy Set Theory

The classical set theory evaluates elements according to binary criteria, determining whether an element is either a member of a set or not. In contrast, fuzzy set theory presents mathematical frameworks that permit a more nuanced evaluation of element membership within a set. This is represented through a membership function that assigns each element a membership grade between zero and one. This approach effectively addresses the vagueness and uncertainty inherent in various scenarios, which can be defined as follows:
Definition 1 (fuzzy set). 
Let   X  represent a universe, with its generic element denoted as  x . A fuzzy set  A  can be characterized as a collection of ordered pairs defined within the universe  X , expressed as follows:
A = x , μ A x |   x X
where  μ A x  represents the membership function or the degree of membership of an element  x X , which is defined within the real interval [0, 1]. The value of  μ A x  indicates how strongly  x X  belongs to the set  A. As previously noted, it is typical for experts to convey their assessments using fuzzy numbers in practical scenarios.
Triangular and trapezoidal fuzzy numbers are two specific forms of fuzzy numbers that can be characterized as follows:
Definition 2 (triangular fuzzy number). 
Let  A ˜  be represented as a triangular fuzzy number defined by the parameters  a 1 ,   a 2 ,   a 3 , where a 1 ,  a 2 , and  a 3  are real numbers with  a 1 a 2 a 3 . The membership function  μ A x  associated with   A ˜ is defined piecewise as:
μ A ˜ x = 0 , x , a 1 x a 1 a 2 a 1 , x a 1 , a 2 a 3 x a 3 a 2 , x a 2 , a 3 0 , x a 3 , +
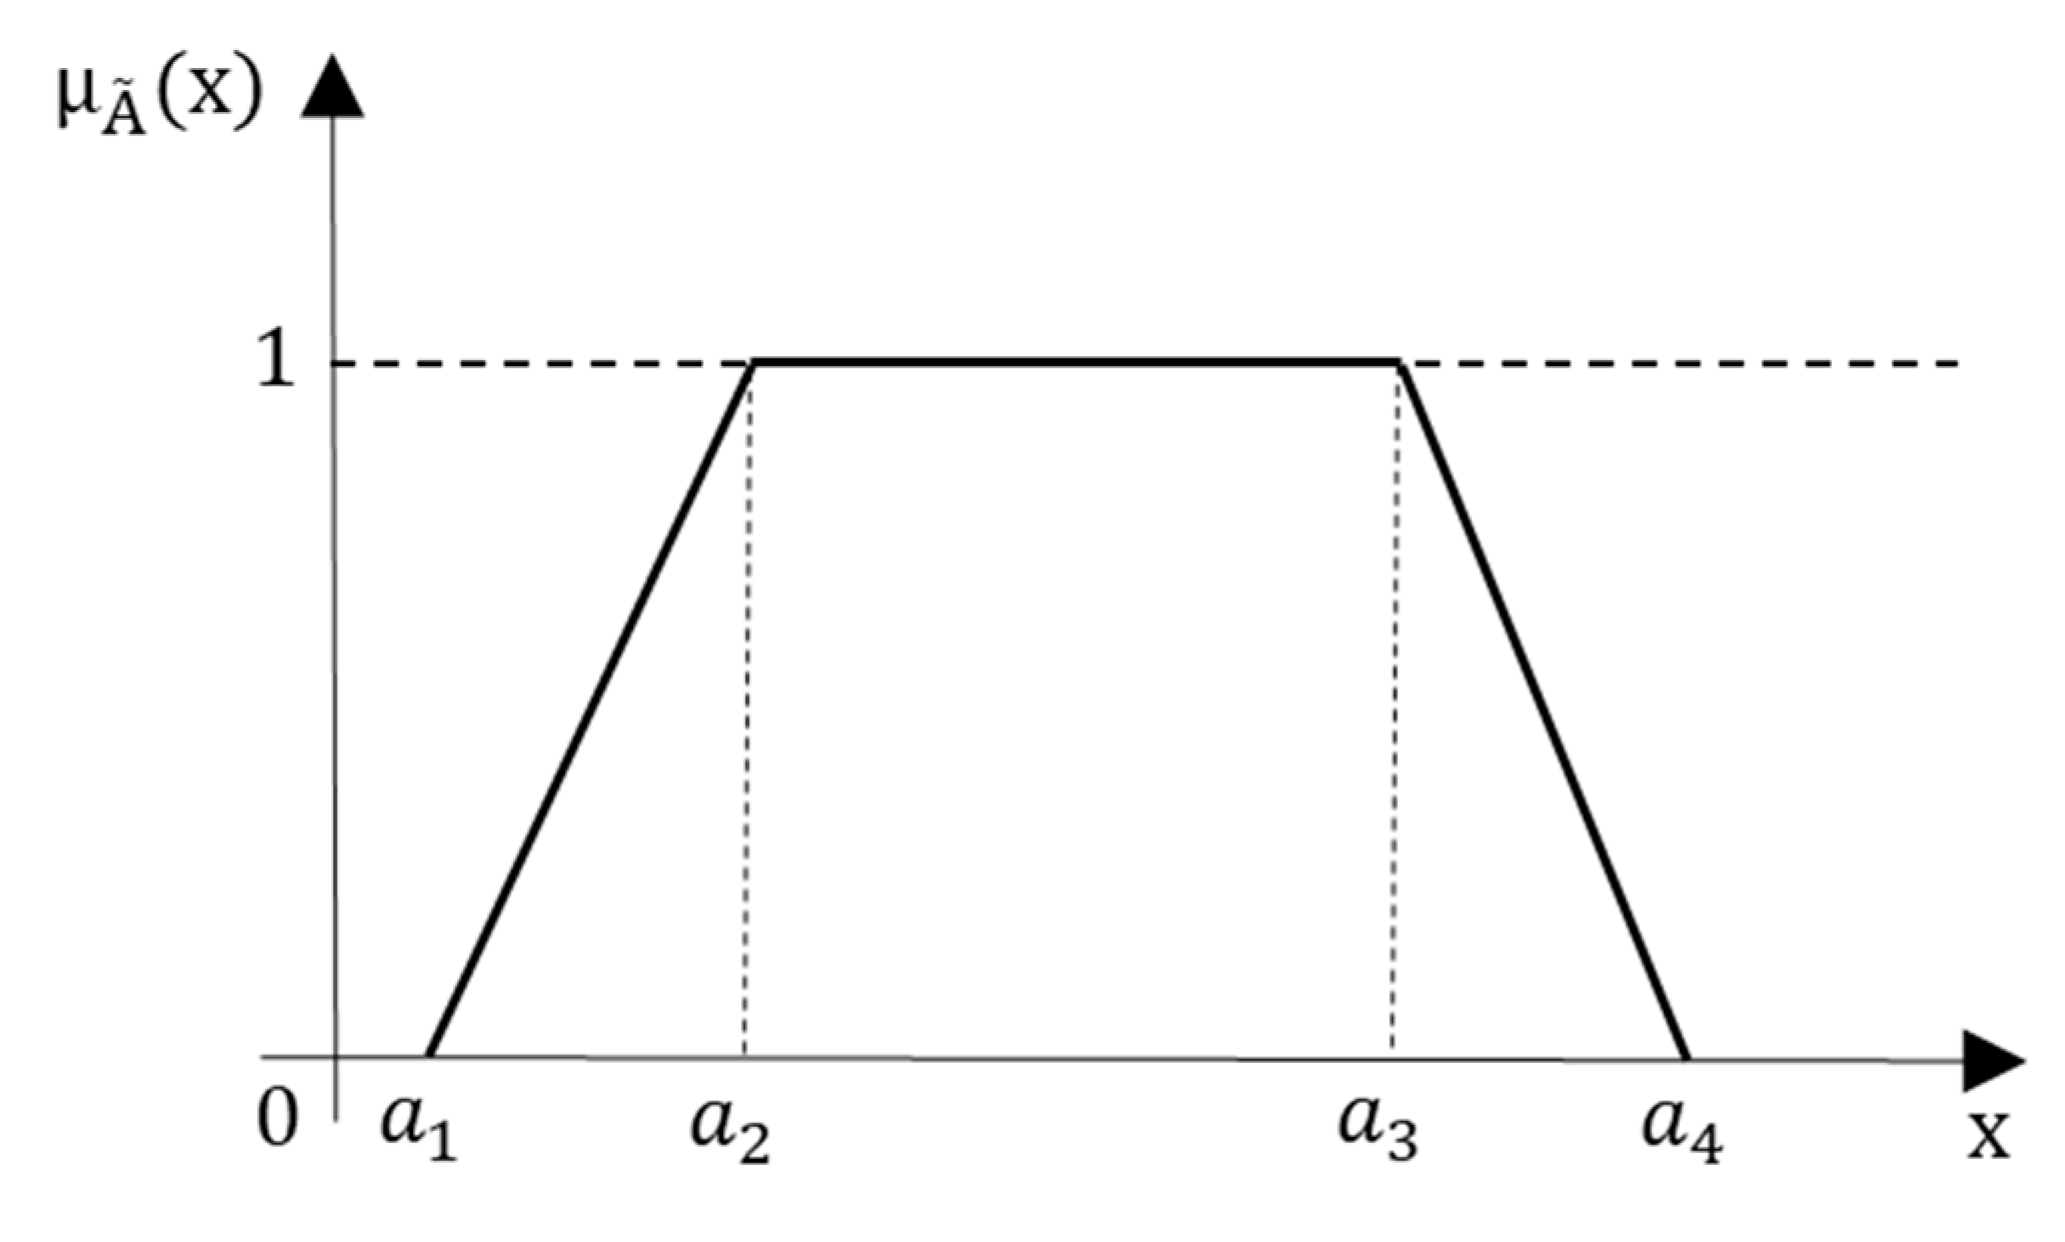
where the fuzzy number  A ˜  reaches its maximum membership value of 1 at  x = a 2 . The values decrease linearly to 0 as  x  moves away from   a 2  towards  a 1  or  a 3 , forming the triangular shape (Figure 1).
Definition 3 (trapezoid fuzzy number). 
Let  A ˜  be represented as a trapezoid fuzzy number defined by the parameters  a 1 ,   a 2 ,   a 3 ,   a 3 , where  a 1 ,  a 2 ,   a 3  and  a 4  are real numbers with  a 1 a 2 a 3 a 4 . The membership function  μ A x  corresponding to  A ˜  is defined as:
μ A ˜ x = 0 , x , a 1 x a 1 a 2 a 1 , x a 1 , a 2 1 , x a 2 , a 3 a 4 x a 4 a 3 , x a 3 , a 4 0 , x a 4 , +  
The membership function for a trapezoidal fuzzy number forms a trapezoid shape, where the fuzzy number A ˜ has a constant maximum membership value of 1 over the interval [ a 2 , a 3 ] . The membership values decrease linearly towards 0 outside this interval, on either side towards a 1 and a 4 (Figure 2).

3.2. Credibility Theory

Credibility theory, initially introduced by Liu (2004) and extended in Liu’s subsequent work (Liu 2007), is a robust mathematical framework designed for the analysis and modeling of fuzzy phenomena. This theory plays a crucial role in the development of credibility fuzzy programming, a method that enables decision-makers to quantify and assess their level of confidence in achieving specific constraints under uncertainty. Credibility theory offers a flexible approach to handling various types of fuzzy data, such as triangular and trapezoidal fuzzy numbers, which are commonly used to represent uncertain information in decision-making processes. By incorporating these fuzzy numbers, the theory allows for a more nuanced and realistic representation of uncertainty, which is often encountered in real-world scenarios. Liu (2004, 2007) presents the fundamental definitions and notations that underpin credibility theory. These include the concept of the credibility measure, a key tool used to evaluate the likelihood or degree of confidence that a certain event or condition will occur within a fuzzy environment. As noted by Liu and Liu (2002), the calculation of the credibility measure is conducted as follows:
C r ξ A = 1 2 P o s ξ A + N e s ξ A
where P o s ξ A represents the possibility measure of the event ξ A , while N e s ξ A denotes the necessity measure of the same event. These two measures are fundamental to fuzzy set theory:
  • Possibility Measure Pos : This measure quantifies the maximum degree of membership within the fuzzy set A , essentially reflecting the most plausible degree to which the event ξ A can occur. It is defined as:
    P o s ξ A = s u p   µ x x A
  • Necessity Measure Nes : The necessity measure quantifies the degree to which the event ξ A is certain, calculated as the complement of the maximum degree of membership in the complement set A c . It is expressed as:
    N e s ξ A = 1 sup µ x x A c
Given that P o s ξ A = s u p   µ x x A and N e s ξ A = 1 sup µ x x A c , the credibility measure can also be expressed as:
C r ξ A = 1 2 s u p   µ x x A + 1 sup µ x x A c
This formulation highlights that the credibility measure balances both the possibility and the necessity of the event ξ A , providing a comprehensive assessment of its likelihood in a fuzzy environment.
When considering a specific fuzzy event characterized by ξ r , where r is a real number, the credibility measure is given by
C r ξ r = 1 2 s u p   µ x x r + 1 sup µ x x > r
This equation provides a way to evaluate the credibility that a fuzzy variable ξ will take a value less than or equal to a given real number r . The measure takes into account both the maximum membership value within the interval , r and the complement membership value in the interval r , + , thus offering a balanced view of the likelihood of the event.
The expected value of a fuzzy variable ξ is another important concept within credibility theory, reflecting the “average” outcome of ξ when considering its fuzzy nature. It is calculated using the following expression:
E ξ = 0 + C r ξ r d r 0 C r ξ r d r
This formula integrates the credibility measures over the entire real line, effectively capturing the expected value of ξ by balancing the contributions from both the positive and negative domains. The first integral considers the credibility of ξ being greater than or equal to r , while the second integral accounts for the credibility of ξ being less than or equal to r .
The subsequent sections of the paper focus on the application of the credibility measure to specific types of fuzzy variables, particularly triangular and trapezoidal fuzzy numbers.
Definition 4 (triangular fuzzy variable). 
Consider a fuzzy variable defined by the triplet  a 1 , a 2 , a 3  of crisp numbers where  a 1 < a 2 < a 3 . Based on the general formula for the credibilistic expected value (Equation (9)), it can be shown that the credibilistic expected value of a triangular fuzzy variable  ξ  is expressed as follows:
E ξ = a 1 + 2 a 2 + a 3 4
Next, the credibility measure C r ξ r for a triangular fuzzy number is determined using Equation (11):
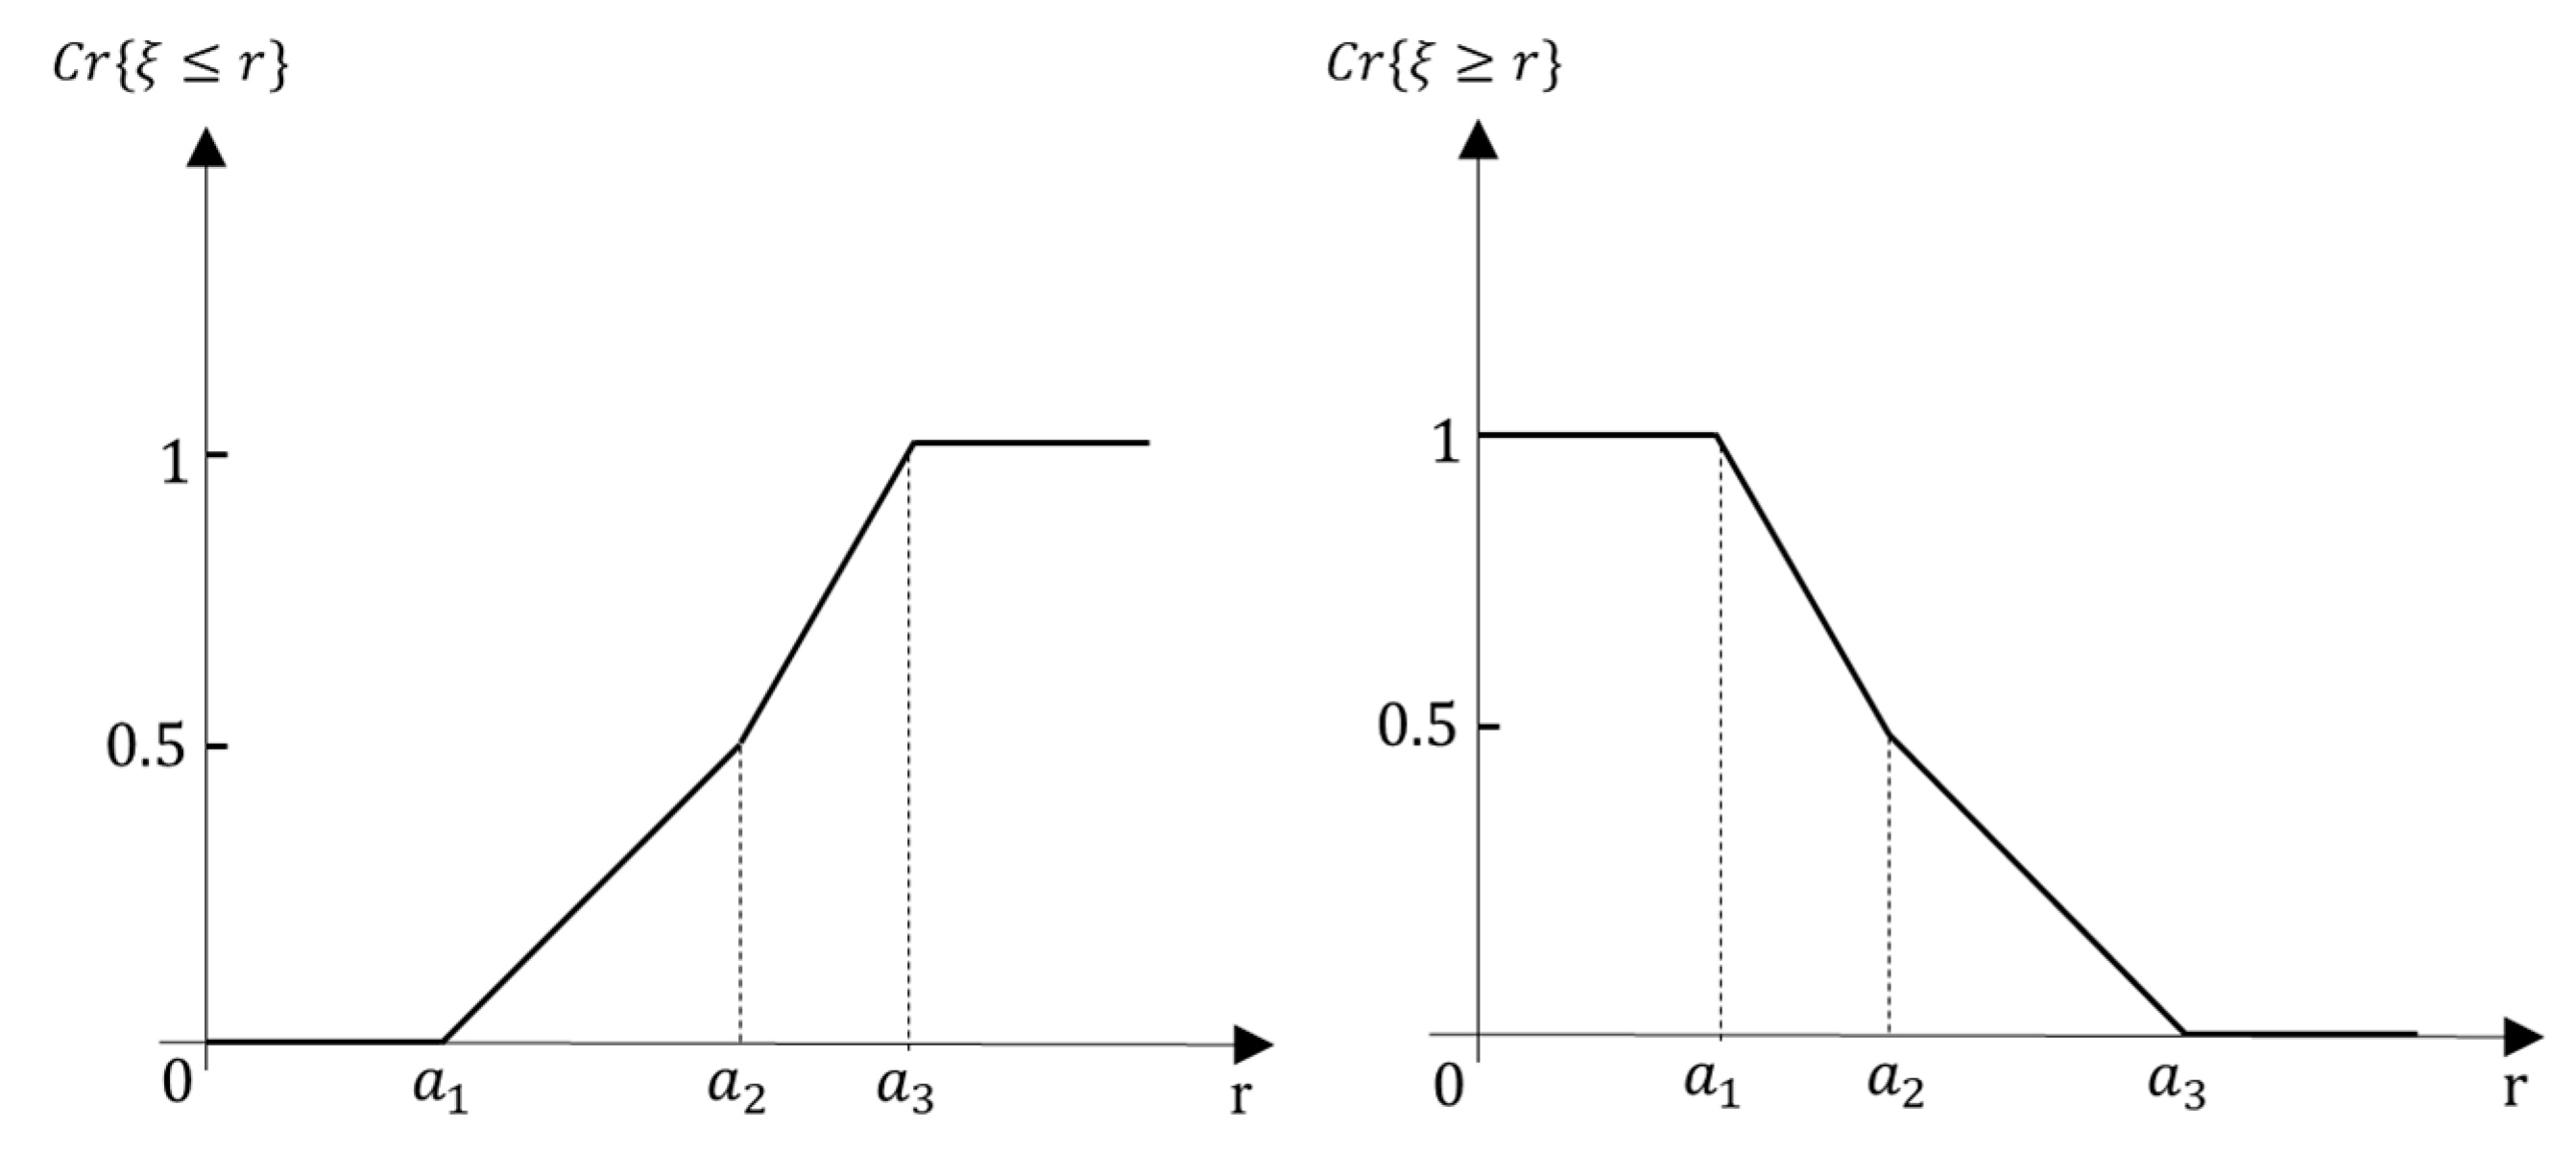
C r ξ r = 0 , r a 1 r a 1 2 a 2 a 1 ,   a 1 r a 2 a 3 2 a 2 + r 2 a 3 a 2 ,   a 2 r a 3 1 ,   a 3 r
Similarly, the credibility measure C r ξ r for a triangular fuzzy number can be determined as follows:
C r ξ r = 1 ,   r a 1 2 a 2 a 1 r 2 a 2 a 1 ,   a 1 r a 2 a 3 r 2 a 3 a 2 ,   a 2 r a 3 0 ,   a 3 r
Figure 3 visually represents these credibility measures, illustrating the likelihood of various events in the context of a triangular fuzzy variable.
Definition 5 (trapezoidal fuzzy variable). 
Consider a fuzzy variable characterized entirely by a quadruplet  a 1 , a 2 , a 3 , a 4  of crisp numbers, where  a 1 < a 2 < a 3 < a 4 . Based on the general formula for the credibilistic expected value (Equation (9)), we can establish the definition of the credibilistic expected value for a trapezoidal fuzzy variable  ξ  as follows:
E ξ = a 1 + a 2 + a 3 + a 4 4
Then, the credibility measure C r ξ r of a trapezoidal fuzzy number is given by
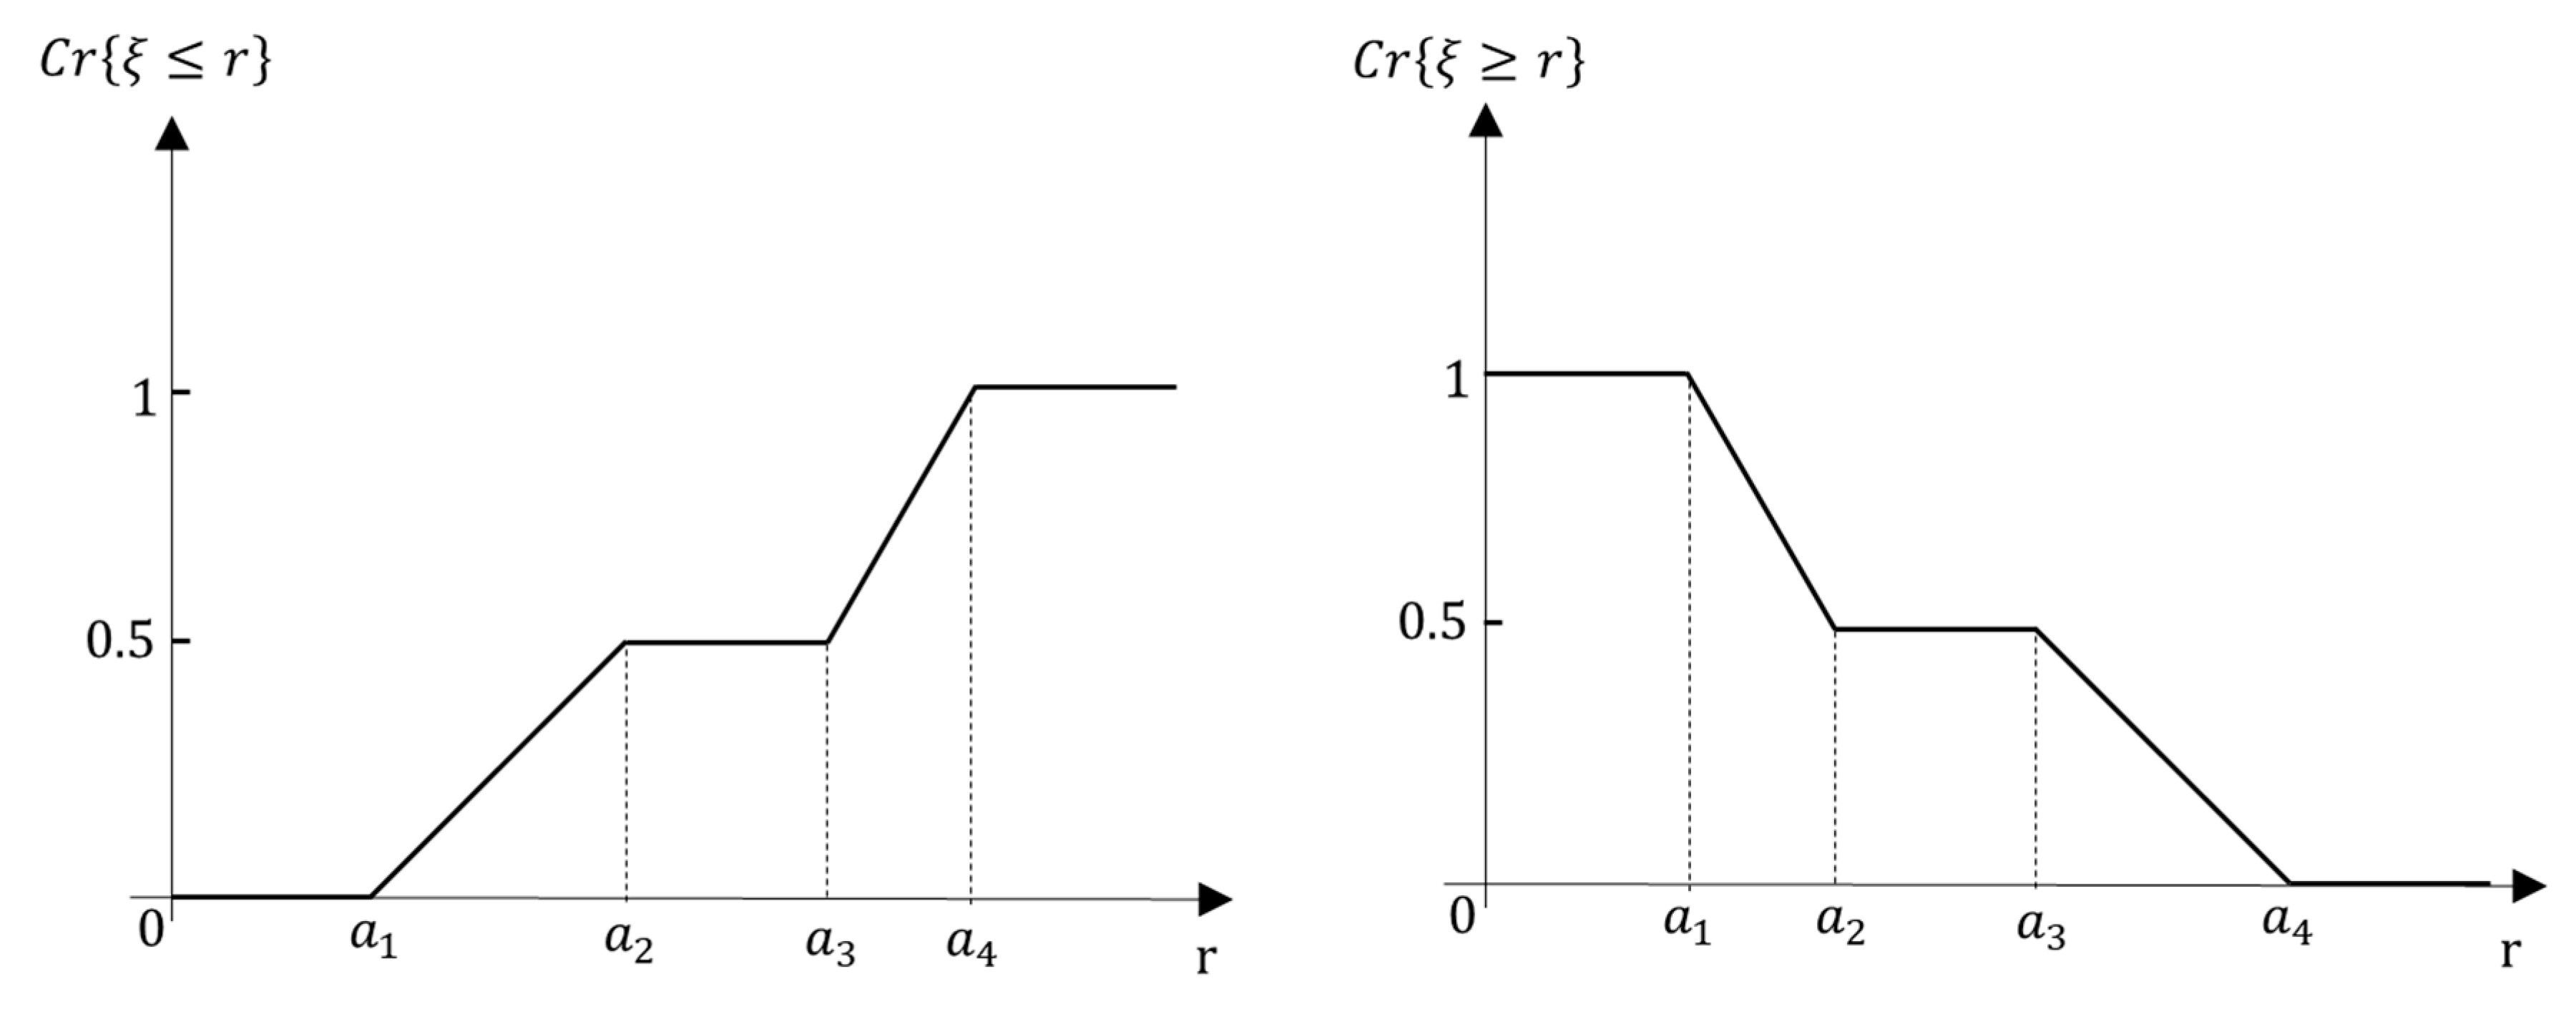
C r ξ r = 0 , r a 1 r a 1 2 a 2 a 1 , a 1 r a 2 1 2 , a 2 r a 3 a 4 2 a 3 + r 2 a 4 a 3 , a 3 r a 4 1 , a 4 r
Similarly, the credibility measure C r ξ r for a trapezoidal fuzzy number can be derived as follows:
C r ξ r = 1 , r a 1 2 a 2 r a 1 2 a 2 a 1 , a 1 r a 2 1 2 , a 2 r a 3 a 4 r 2 a 4 a 3 , a 3 r a 4 0 , a 4 r
Figure 4 visually represents these credibility measures, illustrating the likelihood of various events in the context of a trapezoidal fuzzy variable.

4. The Proposed Portfolio Optimization Model

In this section, we introduce a comprehensive portfolio optimization model that integrates the CVaR measure within the framework of credibility theory. This approach aims to enhance the robustness of portfolio selection by considering both the probabilistic and fuzzy nature of risk. We will first define CVaR, discuss its adaptation under credibility theory, and then outline the additional practical constraints that are essential for realistic portfolio optimization.

4.1. Conditional Value at Risk (CVaR)

A primary goal of risk management is to evaluate and improve the performance of financial investments by carefully considering the risks taken to generate profits. One widely adopted method for quantifying these risks is VaR, which has become a standard tool for measuring potential losses. However, despite its popularity, VaR has several inherent limitations, particularly its inability to capture extreme or tail-end risks fully. In response to these shortcomings, CVaR has gained recognition as a more advanced and comprehensive risk measure. Often referred to as mean excess loss, mean shortfall, or tail VaR, CVaR provides a deeper understanding of risk by focusing on the potential losses that exceed the VaR threshold.
CVaR is a prominent risk measure that extends beyond traditional VaR by focusing on the tail of the loss distribution. Unlike VaR, which only provides the maximum loss within a specified confidence level, CVaR captures the expected loss that occurs beyond this VaR threshold, thereby offering a more comprehensive view of potential extreme losses. This characteristic makes CVaR especially useful in scenarios where tail risk is a significant concern, such as in financial risk management, insurance, and portfolio optimization. One of the key advantages of CVaR is its coherence, meaning it satisfies desirable mathematical properties like sub-additivity, translation invariance, monotonicity, and positive homogeneity. Sub-additivity ensures that the risk of a combined portfolio is never greater than the sum of the risks of individual portfolios, promoting diversification. These properties make CVaR a robust and reliable measure for assessing risk in various contexts. The CVaR of a random variable ξ at a confidence level α is mathematically expressed as
C V a R x , η = η + ( 1 α ) 1 ξ ε R n f X , ξ η + p ( ξ ) d ξ
where is expressed as
f X , ξ η + def = f X , ξ η 0                     i f     f X , ξ η > 0                     i f     f X , ξ η 0
Here, η represents the VaR threshold, α is the confidence level, f X , ξ denotes the loss function, and p ξ is the probability density function of ξ . This formulation leverages linear programming techniques to efficiently calculate CVaR, making it highly applicable in financial optimization scenarios.

4.2. CVaR under Credibility Theory

Incorporating credibility theory into the calculation of CVaR allows for the treatment of uncertainty in a more flexible and nuanced manner. Credibility theory, particularly useful in situations with fuzzy data, provides an alternative approach to traditional probability-based methods. For a fuzzy variable ξ and a confidence level α 0 ,   1 , the VaR under credibility theory can be defined as
ξ V a R α = s u p x C r ξ x α
This definition identifies the maximum value of x for which the credibility measure Cr ξ x is less than or equal to α , providing a fuzzy analog to the traditional VaR measure. Similarly, the alternative expression for VaR under credibility theory is
ξ V a R α = i n f x | C r ξ x α = i n f x | Φ x α = Φ 1 α
where Φ x represents the cumulative credibility distribution function.
The CVaR under credibility theory, denoted as ξ C V a R , is obtained by integrating the VaR function over the confidence interval:
ξ C V a R = 1 1 α α 1 ξ V a R r d r
Considering the information presented, the CVaR for a triangular fuzzy variable characterized by parameters ξ = a 1 ,   a 2 ,   a 3 and a confidence level α 0 ,   1 can be calculated in the following formula:
ξ C V a R α = α a 1 1 + α a 2 α 0 ,   0.5 α 1 a 2 α a 3 α 0.5 ,   1
Similarly, the CVaR for a trapezoidal fuzzy variable characterized by parameters ξ = a 1 ,   a 2 ,   a 3 , a 4 and a confidence level α 0 ,   1 can be calculated as follows:
ξ C V a R α = α a 1 1 + α a 2 α 0 ,   0.5 α 1 a 3 α a 4 α 0.5 ,   1

4.3. Additional Practical Constraints

In real-world portfolio optimization, several practical constraints must be considered to ensure that the model reflects actual investment scenarios. Incorporating these constraints enhances the realism of the portfolio selection process and aligns the model with practical investment considerations.

4.3.1. Cardinality Constraint

The cardinality constraint limits the number of assets that can be included in a portfolio. This constraint is crucial for managing transaction costs and ensuring portfolio diversification. The selection status of an asset is represented by the binary variable Z i , and the constraint is formulated as follows:
i = 1 N Z i = K
and
Z i 0 , 1 ,   i = 1 , 2 , , N
where N is the total number of available assets, and K is the maximum number of assets allowed in the portfolio.

4.3.2. Floor and Ceiling Constraints

Floor and ceiling constraints, also known as buy-in thresholds, establish the minimum and maximum limits for the proportion of the portfolio allocated to each asset. These constraints ensure that the portfolio does not become overly concentrated in a single asset or include insignificant positions. The constraints are expressed as
l i Z i x i u i Z i ,       i = 1 , 2 , , N
and
0 l i u i 1
where l i and u i represent the lower and upper bounds on the proportion x i allocated to asset i .

4.4. Proposed Portfolio Optimization Problem Formulation

This section introduces the proposed credibilistic CVaR model, tailored for portfolio optimization within the framework of trapezoidal fuzzy variables. The model is designed to handle uncertainty in financial markets by incorporating fuzzy variables, which better reflect the imprecise and ambiguous nature of real-world data compared to traditional probabilistic methods. By employing trapezoidal fuzzy numbers, the model offers a more flexible and realistic approach to assessing risk and making investment decisions. The credibilistic CVaR model is particularly suited for scenarios where the confidence level, denoted by α , plays a critical role in determining the degree of risk aversion. In this model, the confidence level is restricted to the interval α 0 ,   0.5 , ensuring that the assessment of risk remains conservative. This constraint on α allows the model to capture extreme downside risk more effectively, making it a valuable tool for investors who prioritize avoiding significant losses. In addition to the focus on CVaR minimization, the proposed model also incorporates cardinality, floor, and ceiling constraints. These constraints add further realism and practicality to the portfolio optimization process. The cardinality constraint limits the number of assets in the portfolio, reflecting real-world limitations such as transaction costs and regulatory requirements. Meanwhile, the floor and ceiling constraints set lower and upper bounds on the allocation to each asset, ensuring a diversified and balanced portfolio. Together, these constraints enhance the model’s ability to generate feasible and well-structured portfolios that align with investors’ practical concerns. The proposed portfolio optimization model is set up as follows:
M i n   C V a R = i = 1 n x i α a 1 i 1 + α a 2 i          
Such that:
            i = 1 n x i a 1 i + a 2 i + a 3 i + a 4 i 4 R
          l i Z i x i u i Z i
i = 1 n Z i = K
i = 1 n x i = 1
          Z i = 0 , 1
          x i 0 ,       i = 1 ,   2 ,   ,   n
where Equation (27) defines the objective of the model, which is to minimize the credibilistic CVaR, and Equations (28)–(33) are the constraints. Equation (28) introduces the expected return constraint, ensuring that the portfolio achieves at least the required return R , balancing the trade-off between risk and return. Equation (29) outlines the floor and ceiling constraints, which enforce lower and upper bounds on each asset’s allocation, where Z i is a binary variable indicating whether an asset is included in the portfolio. Equation (30) describes the cardinality constraint, limiting the number of assets in the portfolio to K , which reflects practical considerations like transaction costs and portfolio manageability. Equation (31) sets forth the budget constraint, ensuring that the entire budget is allocated across the selected assets. Lastly, Equations (32) and (33) establish the binary and non-negativity constraints, mandating that Z i is binary (indicating the inclusion or exclusion of an asset) and that x i is non-negative, thereby preventing short positions.

5. Numerical Experiments

In this section, we implement the proposed fuzzy portfolio optimization model using a real-world case study from the cryptocurrency market. The aim is to demonstrate the practical applicability of the model in constructing an optimal portfolio that balances risk and returns in the highly volatile and uncertain environment of digital assets. To achieve this, we selected a diverse dataset of 36 cryptocurrencies from the https://www.investing.com/crypto (accessed on 20 August 2021) website (Cryptocurrency Prices—Real Time Market Data—Investing.com 2021), representing a broad spectrum of the market. These assets, detailed in Table 1, include a mix of well-established cryptocurrencies like Ethereum (ETH) and Litecoin (LTC), as well as emerging digital assets such as Solana (SOL) and Polygon (MATIC).
The analysis and results, based on 10 months of historical (monthly return) data from August 2021, reveal key insights into the performance of selected cryptocurrency assets. The descriptive statistics provide a detailed overview, highlighting mean returns, variance, standard deviation, and price movement ranges. These metrics illustrate the varying levels of risk and return, with certain assets showing a higher volatility and potential for significant price swings. The mean values represent average returns, while variance and standard deviation offer insights into the volatility of these returns. The maximum and minimum values underscore the potential gains and losses, reflecting the inherent uncertainty and risk of the cryptocurrency market. Table 2 presents a summary of the performance characteristics of these assets over the 10-month period.
Table 3 presents a trapezoidal fuzzy data set for the returns of various cryptocurrencies, capturing the uncertainty and variability in their historical performance. Each asset is represented by four key points: the minimum return, a lower median, an upper median, and the maximum return. These points form a trapezoidal fuzzy number that reflects the range of possible outcomes for each cryptocurrency, accounting for both optimistic and pessimistic scenarios. For instance, Asset A3 (Avalanche) has a return range from −1 to 2.254 percent, indicating significant volatility and the potential for large gains or losses. Similarly, Asset A29 (Stellar) exhibits an even broader range, from −0.43 to 6.455 percent, highlighting its high-risk, high-reward nature. This fuzzy representation is particularly useful in the context of cryptocurrency markets, where uncertainty and rapid price fluctuations are common. By using trapezoidal fuzzy numbers, this approach provides a more flexible and realistic model for assessing the risk and return profiles of these digital assets.
The results of the proposed model, evaluated under various scenarios, are summarized in Table 4. These scenarios were designed to cater to different types of investors by adjusting the constraints on the number of assets and the bounds for investment allocations. In the formulation of the proposed model, the α value was set to 0.05. This parameter is used in the optimization of the conditional CVaR objective function, as described by Equation (27). The analysis included scenarios with different values for k (the number of assets in the portfolio) and various lower ( l i ) and upper ( u i ) bounds on asset allocations to evaluate the model’s robustness and adaptability under various conditions.
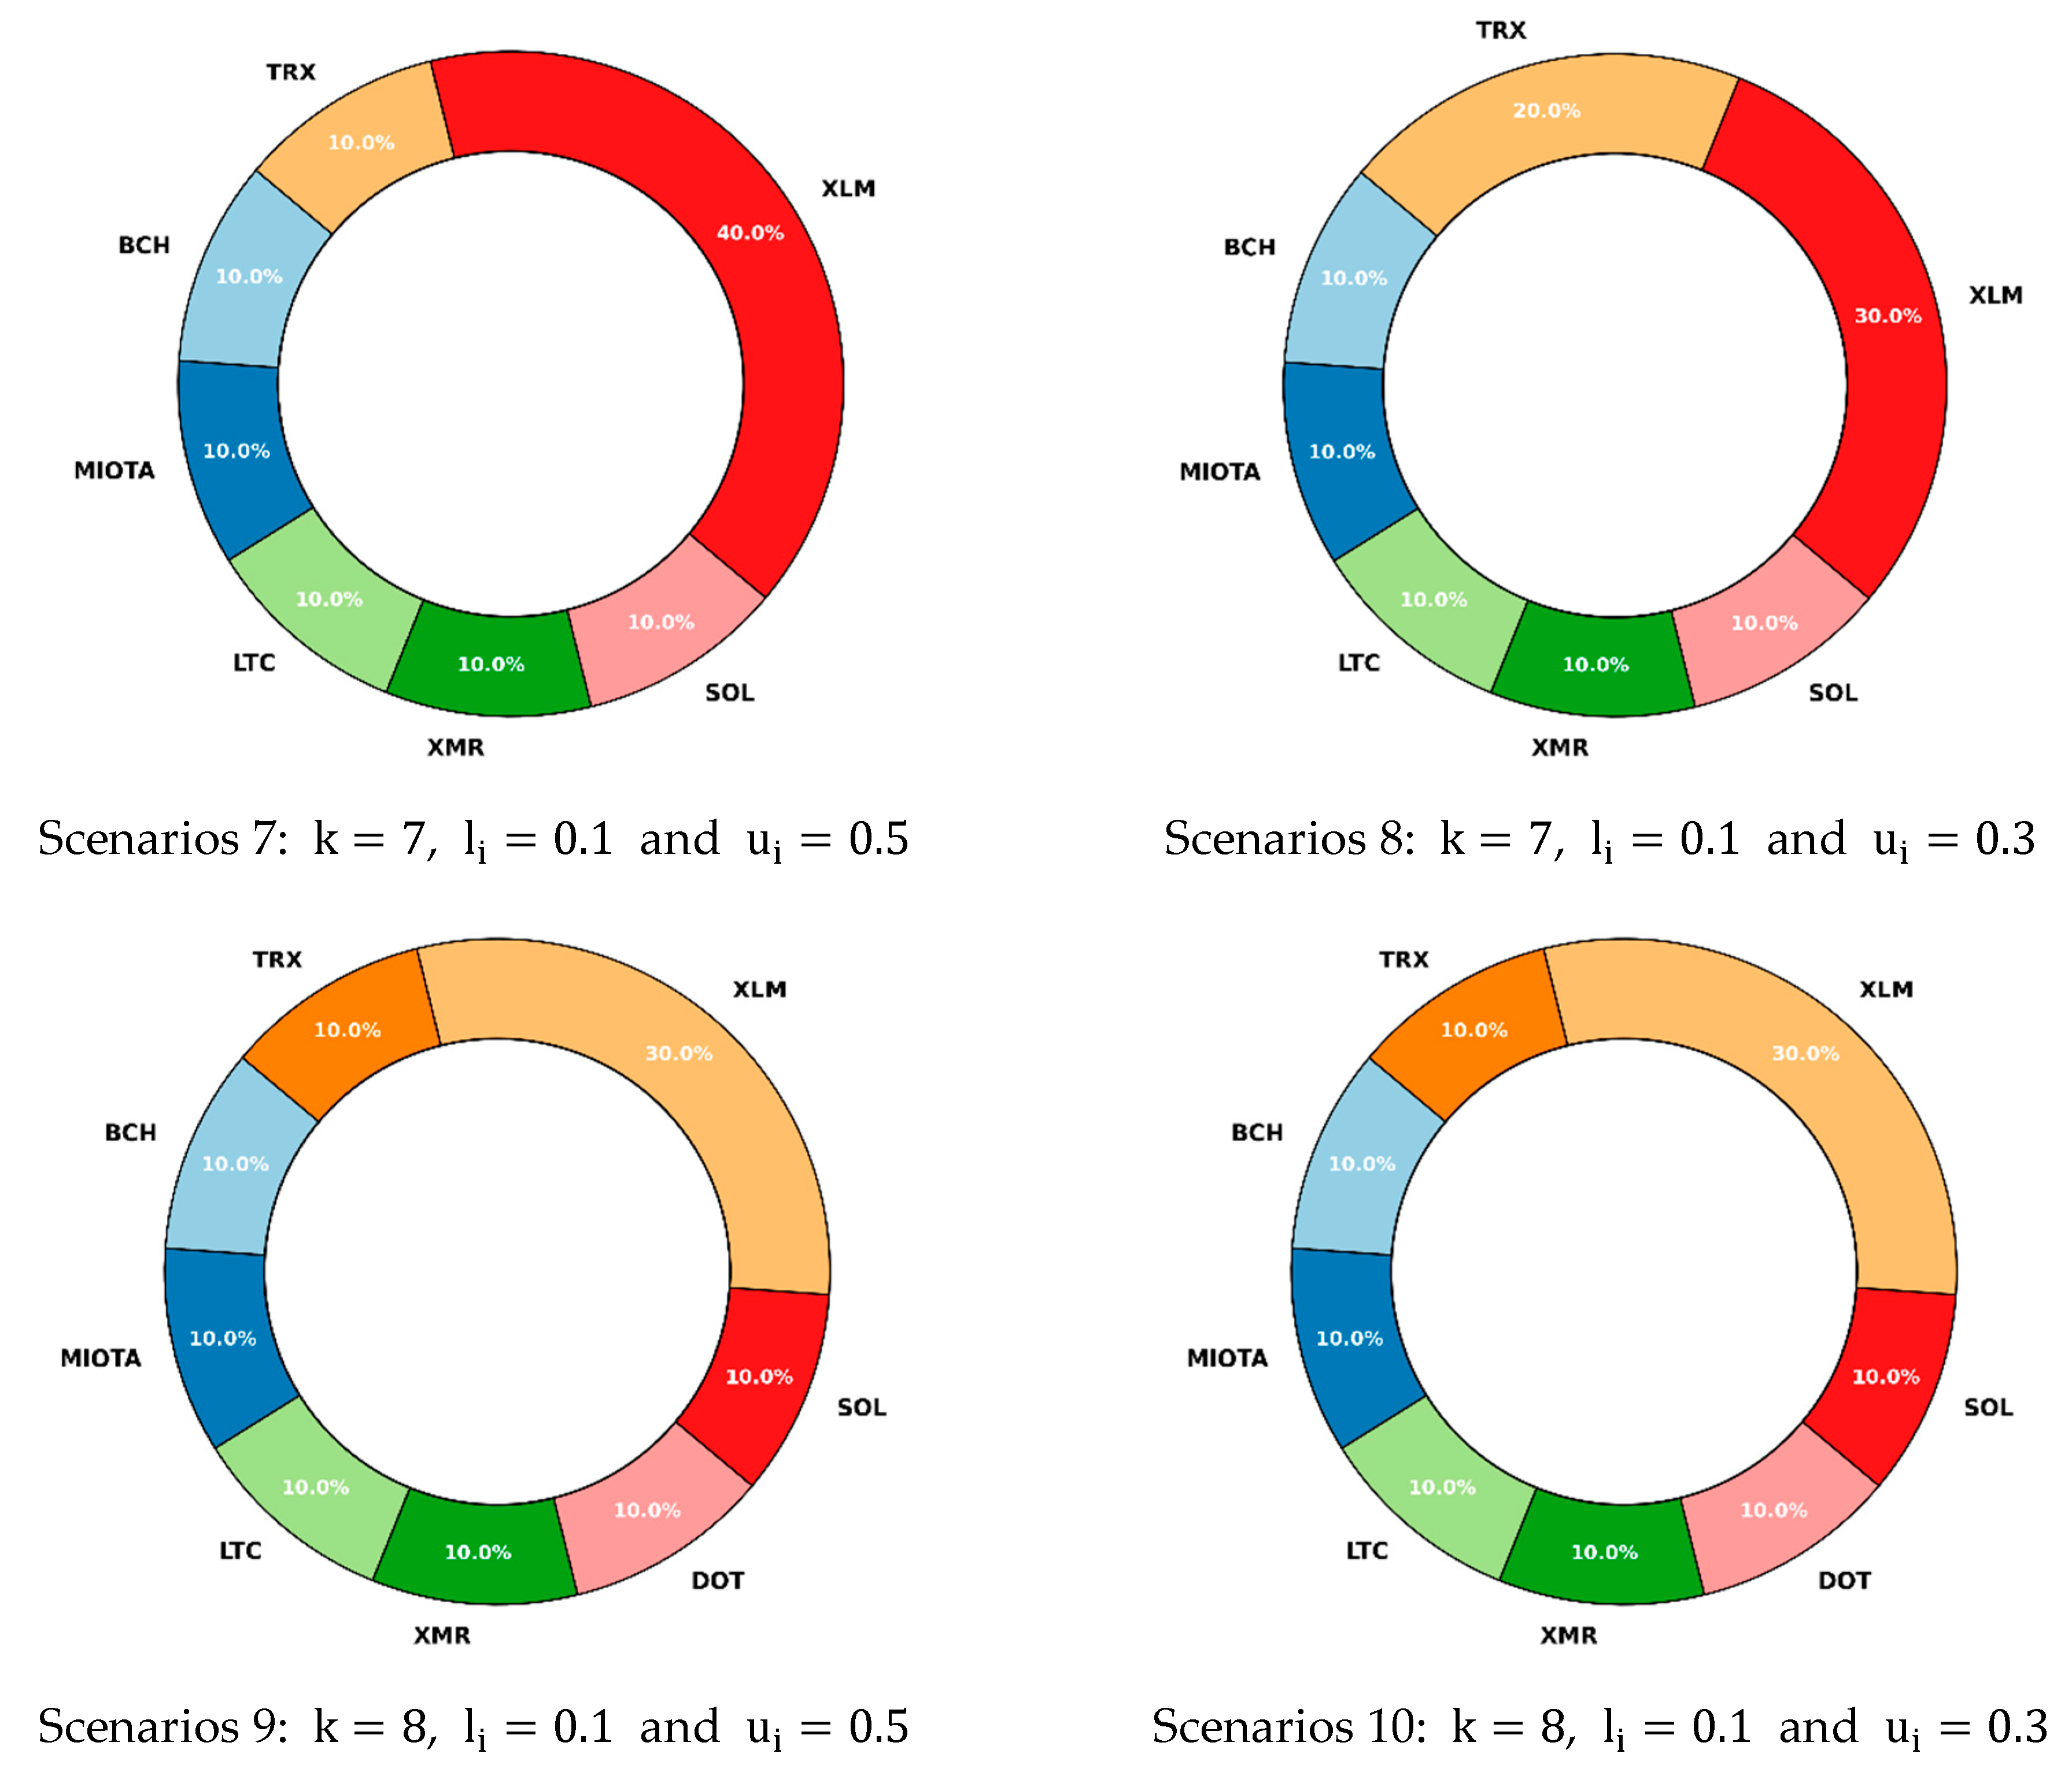
Table 4 presents the objective function values and the corresponding asset allocations for each scenario. For example, in the scenario with k = 4 and bounds of l i = 0.1 and u i = 0.5 , the optimal objective function value is 1.088, with specified allocations across selected assets. Similarly, other scenarios, such as those with k = 7 and l i = 0.1 to u i = 0.3 , yield different results, demonstrating the model’s flexibility in accommodating varying investment constraints and preferences. This analysis underscores the model’s ability to provide tailored solutions for diverse investment strategies.
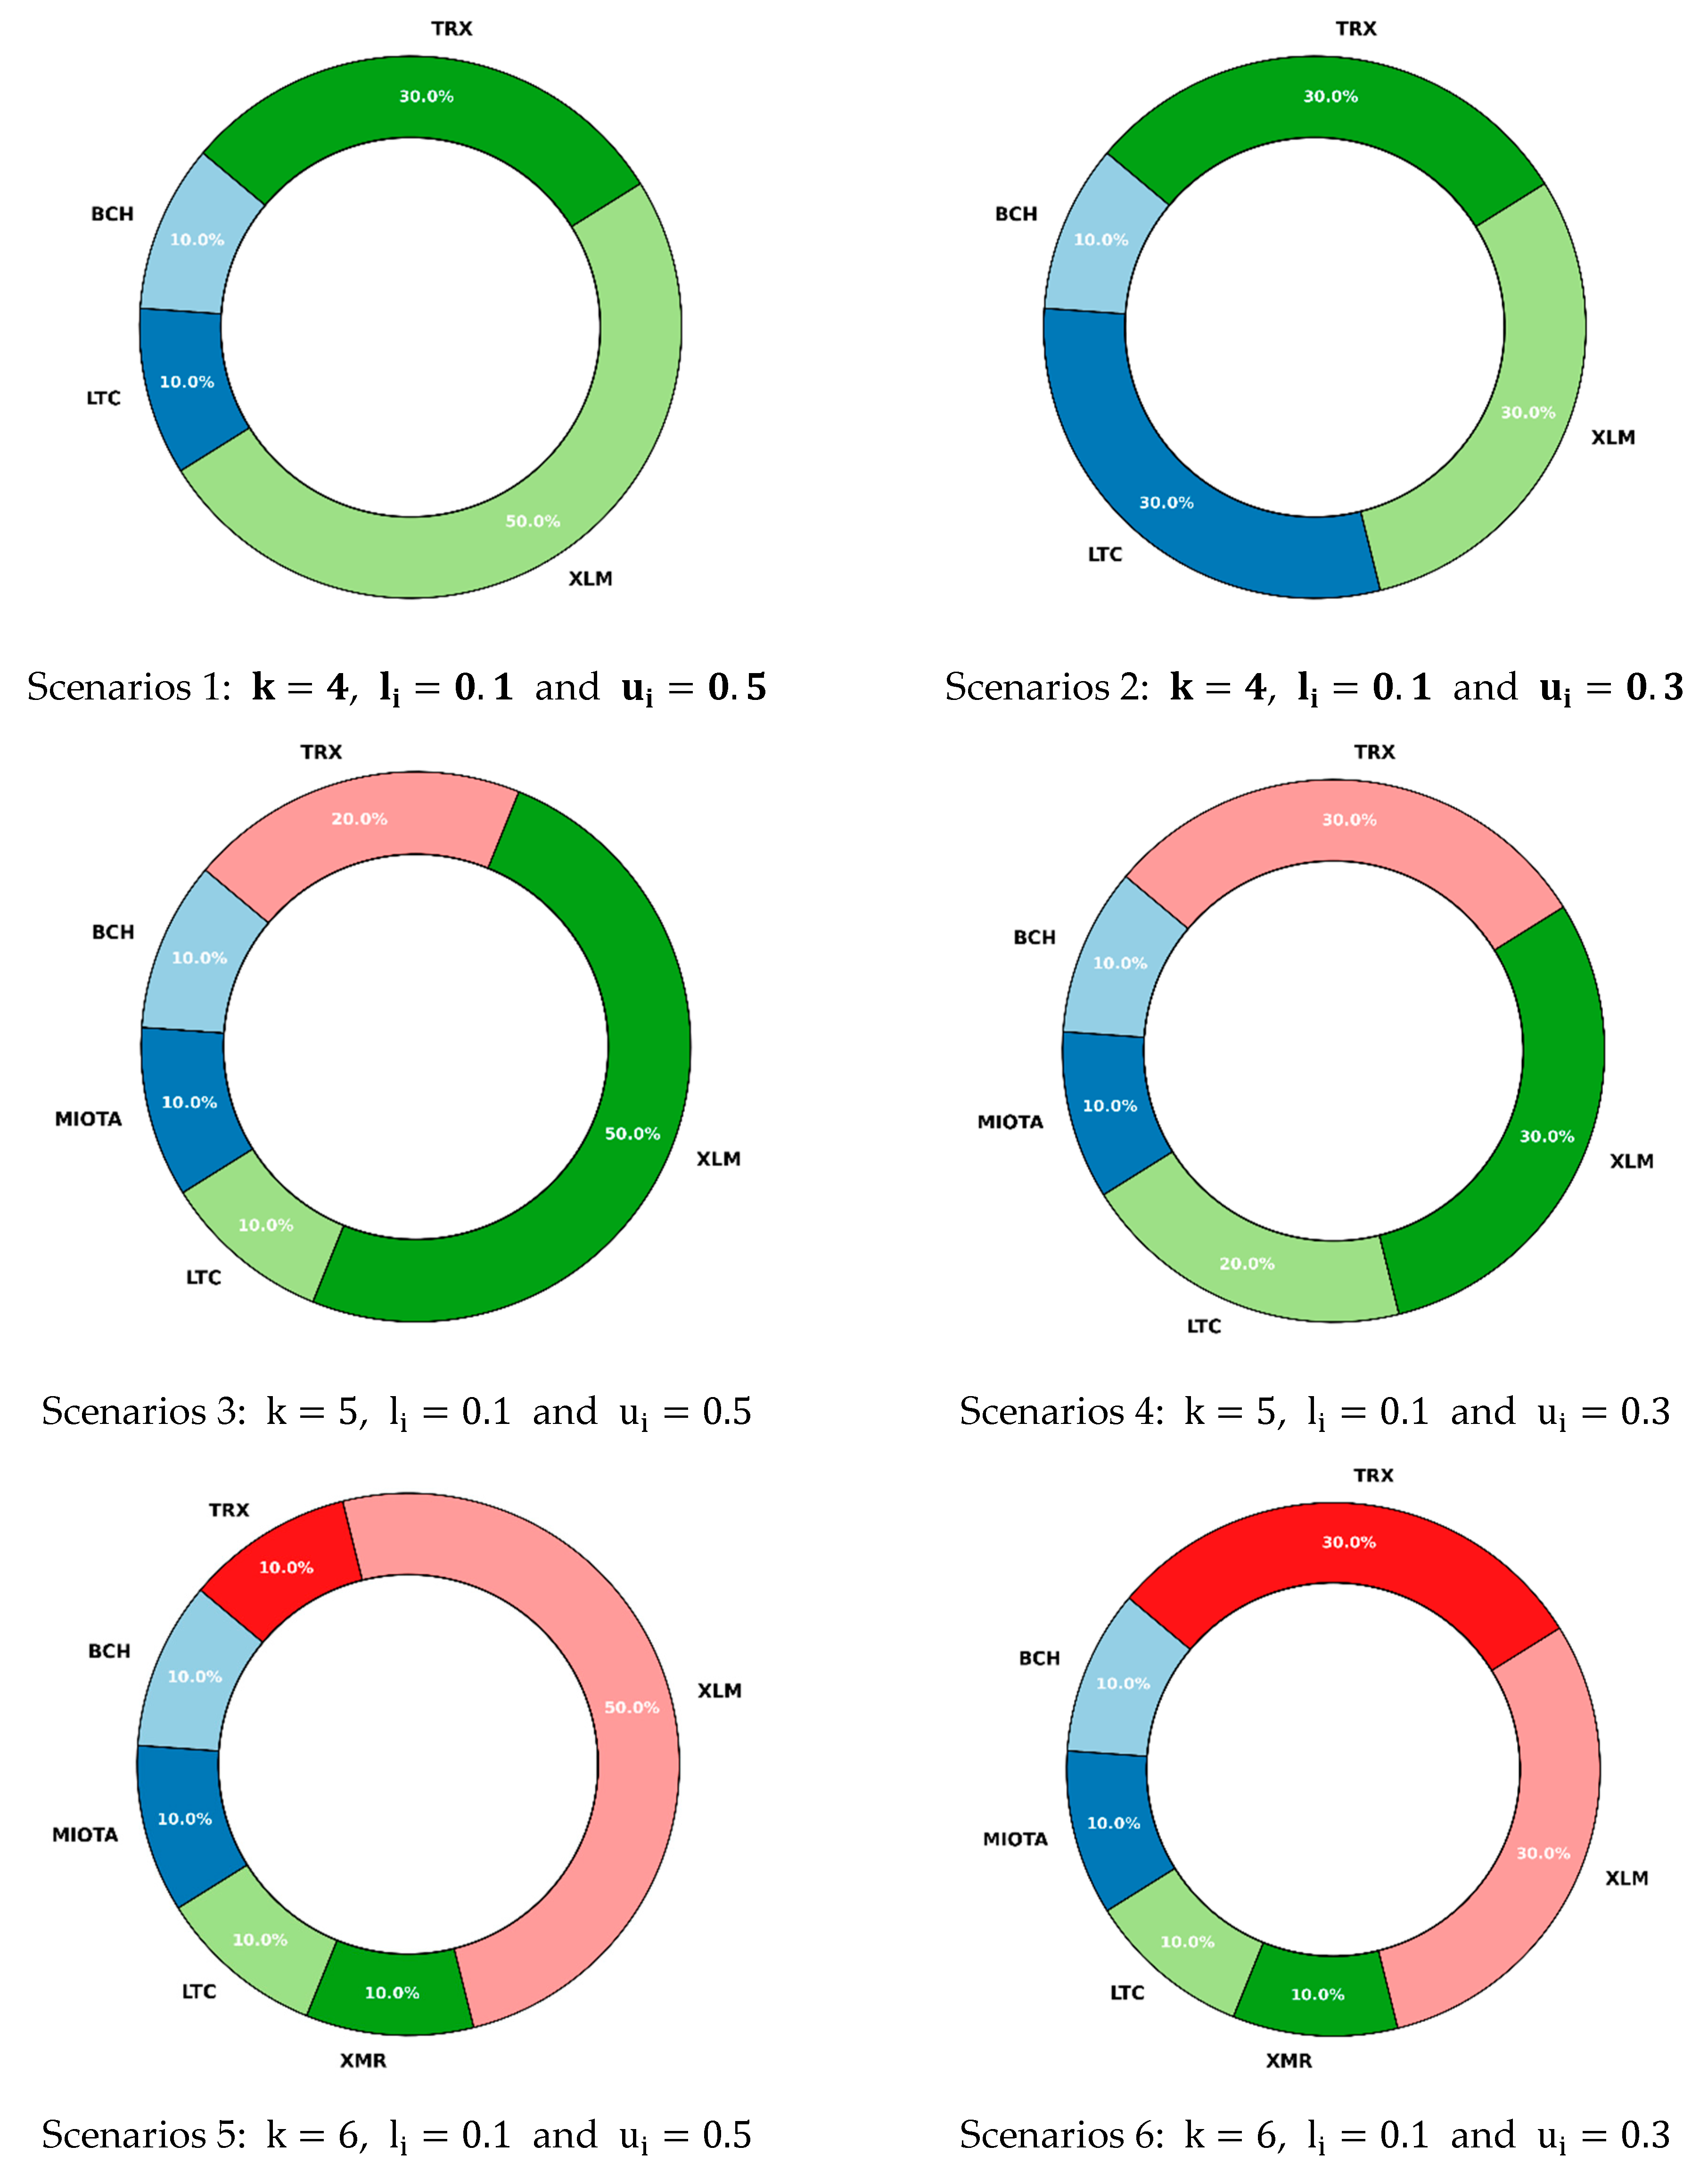
Figure 5 presents the portfolio allocations under the different scenarios through pie charts, providing a visual representation of the asset distributions for each case. These charts illustrate how the proposed model adjusts asset allocations according to varying constraints on the number of assets and investment bounds, as detailed in Table 4.
As evidenced in Table 4 and Figure 5, XLM (A29) and TRX (A33) consistently receive the largest allocations across all scenarios, underscoring their significance in the optimized portfolios. This outcome is not merely coincidental but is deeply rooted in the underlying financial characteristics of these assets. In Table 2, which presents the descriptive statistics of the selected cryptocurrency assets, XLM and TRX are shown to have the highest mean returns among all the assets analyzed. This naturally positions them as attractive options for inclusion in the portfolio. Moreover, Table 3 further corroborates the robustness of XLM and TRX as key assets. In this table, which employs a trapezoid fuzzy dataset to evaluate the potential of cryptocurrency returns, experts have assigned high potential data to XLM and TRX. Therefore, the prominence of XLM and TRX in the portfolio allocations is both a rational and data-driven outcome. Their high mean returns, coupled with favorable expert evaluations, justify their substantial presence across all scenarios, demonstrating the robustness and adaptability of the proposed model in achieving optimal investment outcomes.
The analysis presented in this study highlights the effectiveness and flexibility of the proposed fuzzy portfolio optimization model within a credibilistic CVaR framework for the cryptocurrency market. By incorporating trapezoidal fuzzy variables and varying constraints, the model offers a more nuanced approach to portfolio management compared to traditional probabilistic methods. The empirical findings reveal that varying the number of assets and the bounds on asset allocations significantly affect the portfolio’s risk–return profile. For instance, scenarios with higher asset limits and narrower allocation bounds generally yield lower objective function values, indicating improved risk management and return optimization. This adaptability underscores the model’s robustness across different market conditions and investment strategies. Managers can leverage this adaptability to construct portfolios that align with their client’s risk tolerance and investment goals, enhancing overall portfolio performance and risk management.

6. Discussion

This study presents a novel portfolio optimization model for the cryptocurrency market, utilizing a credibilistic CVaR framework integrated with trapezoidal fuzzy variables. The findings highlight the effectiveness of this approach in managing the unique uncertainties and volatilities associated with digital assets.
The theoretical foundation of this model draws upon the principles of portfolio theory, initially proposed by Markowitz (1952), as part of modern portfolio theory, which emphasizes the trade-off between risk and return. Over time, postmodern portfolio theory emerged, incorporating more advanced tools to address the limitations of the original framework. Among these advancements is the use of CVaR, a more robust risk measure that focuses on extreme losses, offering a better assessment of downside risk compared to traditional variance-based methods. Researchers such as Rockafellar and Uryasev (2000, 2002) have championed CVaR for its ability to more effectively manage risk in volatile markets. In parallel, the integration of fuzzy logic, particularly credibility theory, offers a more nuanced approach to handling uncertainty. Unlike conventional probabilistic methods, which can struggle to fully capture the uncertainty inherent in financial markets, credibility theory allows for a more flexible and accurate representation of risk. Liu (2004) demonstrated that credibilistic measures significantly improve risk assessment in portfolio optimization, further validating the theoretical foundation of our model.
Empirically, our results align with findings from recent studies that emphasize the necessity of adapting portfolio management strategies to the unique characteristics of cryptocurrency markets. For instance, Brauneis and Mestel (2019) illustrated the advantages of diversified cryptocurrency portfolios using the Markowitz framework, while Kim et al. (2024) evaluated various portfolio strategies incorporating cryptocurrencies, confirming that innovative approaches yield improved performance metrics. In our study, the proposed model demonstrated superior risk-adjusted returns compared to state-of-the-art methods. Specifically, the integration of fuzzy variables allowed for better modeling of the inherent uncertainties, leading to more reliable portfolio allocations under volatile conditions. This finding is consistent with the work of Hrytsiuk et al. (2019), who suggested that using alternative risk measures can enhance portfolio optimization in volatile markets.
Our model offers a distinct improvement over existing portfolio optimization techniques applied to cryptocurrency markets by addressing critical challenges like extreme volatility, uncertainty, and non-normal returns. Traditional methods, such as Markowitz’s mean-variance optimization, have been applied by researchers like Brauneis and Mestel (2019) and Schmitz and Hoffmann (2020), but these approaches often fail to manage the unique risks posed by cryptocurrencies. These models rely on assumptions of normal return distributions, which are unsuitable in the context of digital assets characterized by frequent tail events and extreme price swings. Recent advancements, such as the modified Markowitz model using VaR presented by Hrytsiuk et al. (2019), have attempted to address this limitation. However, these models focus primarily on normalizing risk without incorporating the full spectrum of downside risk, which is a key feature of our credibilistic CVaR approach.
Furthermore, our model leverages credibilistic CVaR, which provides a more robust downside risk measure, crucial for handling the frequent extreme losses that occur in cryptocurrency markets. Several recent studies have attempted to address these challenges with advanced risk measures. For example, (Aljinović et al. 2021) proposed a multicriteria decision-making approach using CVaR alongside other risk metrics, highlighting the limitations of mean-variance methods when applied to volatile assets. Our model builds on this by integrating credibilistic CVaR with trapezoidal fuzzy variables, offering a more flexible approach that better captures uncertainty in cryptocurrency markets. This provides a more precise measure of downside risk, addressing the shortfalls of traditional models in capturing tail risks. Additionally, more complex models like entropy-based approaches (see Giunta et al. 2024) have been explored for cryptocurrency portfolio optimization. While these methods effectively capture extreme risk events, they often lack the adaptability needed to incorporate real-world investment constraints, such as transaction costs, liquidity issues, and regulatory factors. Our model, however, integrates practical constraints like cardinality, floor, and ceiling limits, ensuring a well-diversified portfolio that accounts for these factors, making it more practical for investors. We also note that Demircan and Dirinda (2023) explored the use of fuzzy sets in cryptocurrency portfolio selection, emphasizing the need for alternative techniques to manage the inherent uncertainty in financial markets. Our model shares this perspective but goes further by explicitly incorporating credibilistic measures to better address the unpredictability of digital assets.
Overall, the integration of credibilistic CVaR and trapezoidal fuzzy variables in our model not only addresses significant gaps in the existing literature but also enhances the robustness of portfolio optimization strategies in cryptocurrency markets. The empirical validation provided in this study supports its effectiveness compared to traditional and state-of-the-art methods, offering valuable insights for investors navigating the complexities of digital asset investments.

7. Conclusions

This study introduces a novel approach to cryptocurrency portfolio optimization within a credibilistic CVaR framework. The model leverages the principles of credibility theory and utilizes trapezoidal fuzzy variables to address the significant uncertainty and high volatility that characterize digital asset markets. By doing so, it offers a more nuanced and adaptive risk management strategy compared to traditional probabilistic methods. The inclusion of practical constraints, such as cardinality and floor and ceiling constraints, ensures that the model remains relevant and practical for real-world applications. These constraints not only reflect the realities of transaction costs and regulatory requirements but also promote diversification and balanced asset allocation. The empirical analysis validates the model’s effectiveness in constructing well-diversified portfolios that balance risk and return, making it an essential tool for investors navigating the complex and rapidly evolving cryptocurrency market. The proposed model represents a significant advancement in the application of advanced portfolio optimization techniques to digital assets, contributing valuable insights to the field of investment management.
Although the proposed model provides a step forward in portfolio optimization, several opportunities for further research remain. One area worth exploring is the application of alternative fuzzy number representations, such as triangular or Gaussian fuzzy numbers, to assess their impact on portfolio performance and risk management. Moreover, the integration of machine learning, deep learning, and artificial intelligence techniques presents a promising avenue for enhancing the model’s predictive capabilities. These techniques could be employed not only to estimate fuzzy parameters more accurately, adapting to ever-changing market conditions and improving the model’s responsiveness to market signals, but also as effective preselection methods. By preselecting relevant assets or features, these techniques can further streamline the optimization process, leading to more refined and targeted portfolio construction. Expanding the model to accommodate multi-period investment horizons is another crucial direction for future research. By considering the temporal dimension of investment, such an extension would allow the model to account for the dynamic nature of asset prices and evolving market conditions, offering a more comprehensive tool for long-term portfolio management.
It is important to acknowledge that digital assets, particularly cryptocurrencies, are in a state of constant evolution, characterized by significant volatility and inherent risk. The values of most cryptocurrencies are predominantly driven by speculative trading, where market sentiment plays a pivotal role. This speculation is influenced by a multitude of factors, including the practical applications of the underlying technologies, regulatory clarity, the level of community acceptance, and real-time news events that can rapidly shift investor sentiment. In this study, we have deliberately chosen a specific set of cryptocurrencies to illustrate the application of our proposed methodology. This selection was not intended to endorse any particular cryptocurrency for investment purposes but rather to demonstrate the versatility and effectiveness of the optimization approach we developed. Importantly, our optimization method is designed to be flexible and can be seamlessly applied to various alternative sets of cryptocurrencies, which may yield different results based on market conditions and asset characteristics. Consequently, it is essential to interpret the findings of this study as a demonstration of the proposed optimization technique rather than as prescriptive financial advice. Investors should exercise caution and conduct a thorough due diligence before making investment decisions in the cryptocurrency space, recognizing its speculative nature and the myriad factors that can influence market dynamics. Ultimately, while our study provides valuable insights into portfolio optimization within the context of cryptocurrencies, it should not be seen as a definitive guide for investment but rather as a foundation for the future exploration and application of advanced optimization methodologies in this rapidly changing market.

Author Contributions

Conceptualization, H.G., E.M., A.M.L.F. and M.S.; methodology, H.G., E.M., A.M.L.F. and M.S.; software, H.G.; validation, H.G., E.M., A.M.L.F. and M.S.; formal analysis, H.G.; investigation, H.G., E.M., A.M.L.F., R.R.K., P.J.S. and M.S.; resources, H.G., E.M., A.M.L.F. and M.S.; data curation, H.G., E.M., A.M.L.F. and M.S.; writing—original draft preparation, H.G., E.M., A.M.L.F. and M.S.; writing—review and editing, H.G., E.M., A.M.L.F., R.R.K., P.J.S. and M.S.; visualization, H.G.; supervision, E.M., A.M.L.F. and R.R.K.; project administration, H.G., E.M., A.M.L.F. and R.R.K.; funding acquisition, R.R.K. and P.J.S. All authors have read and agreed to the published version of the manuscript.

Funding

This research received no external funding.

Data Availability Statement

Data is available in a publicly accessible repository, and a link is provided in the manuscript.

Acknowledgments

All authors are thankful to the editor and the anonymous reviewers for the helpful suggestions and comments. Peter J. Stauvermann thanks Changwon National University for financially supporting him in his research for the year 2023–2024. The usual disclaimer applies.

Conflicts of Interest

The authors declare that they have no known competing financial interests or personal relationships that could have appeared to influence the work reported in this paper.

References

  1. Aljinović, Zdravka, Branka Marasović, and Tea Šestanović. 2021. Cryptocurrency portfolio selection—A multicriteria approach. Mathematics 9: 1677. [Google Scholar] [CrossRef]
  2. Almeida, Dora, Andreia Dionísio, Isabel Vieira, and Paulo Ferreira. 2022. Uncertainty and Risk in the Cryptocurrency Market. Journal of Risk and Financial Management 15: 532. [Google Scholar] [CrossRef]
  3. Babaioff, Moshe, Shahar Dobzinski, Sigal Oren, and Aviv Zohar. 2012. On bitcoin and red balloons. Paper presented at the 13th ACM Conference on Electronic Commerce, Valencia, Spain, June 4–8; pp. 56–73. [Google Scholar]
  4. Bouri, Elie, Syed Jawad Hussain Shahzad, and David Roubaud. 2019. Co-explosivity in the cryptocurrency market. Finance Research Letters 29: 178–83. [Google Scholar] [CrossRef]
  5. Bowala, Sulalitha, and Japjeet Singh. 2022. Optimizing Portfolio Risk of Cryptocurrencies Using Data-Driven Risk Measures. Journal of Risk and Financial Management 15: 427. [Google Scholar] [CrossRef]
  6. Brauneis, Alexander, and Roland Mestel. 2019. Cryptocurrency-portfolios in a mean-variance framework. Finance Research Letters 28: 259–64. [Google Scholar] [CrossRef]
  7. Canh, Nguyen Phuc, Udomsak Wongchoti, Su Dinh Thanh, and Nguyen Trung Thong. 2019. Systematic risk in cryptocurrency market: Evidence from DCC-MGARCH model. Finance Research Letters 29: 90–100. [Google Scholar] [CrossRef]
  8. Chen, Shuai. 2023. The Implementation of Modern Portfolio Theory on New Financial Assets: Evidence from Cryptocurrencies. Advances in Economics, Management and Political Sciences 56: 209–13. [Google Scholar] [CrossRef]
  9. Cryptocurrency Prices—Real Time Market Data—Investing.com. 2021. Available online: https://www.investing.com/crypto (accessed on 20 August 2021).
  10. Demircan, Murat Levent, and Tayfun Dirinda. 2023. Analysis of Various Portfolio Allocation Decision-Making Techniques in Crypto Assets Using Fuzzy Sets. In Intelligent and Fuzzy Systems. INFUS 2023. Lecture Notes in Networks and Systems. Edited by Cengiz Kahraman, Irem Ucal Sari, Basar Oztaysi, Selcuk Cebi, Sezi Cevik Onar and Çağrı Tolga. Cham: Springer, vol. 758, pp. 699–707. [Google Scholar] [CrossRef]
  11. Deng, Xue, Junfeng Zhao, and Zhongfei Li. 2018. Sensitivity Analysis of the Fuzzy Mean-Entropy Portfolio Model with Transaction Costs Based on Credibility Theory. International Journal of Fuzzy Systems 20: 209–18. [Google Scholar] [CrossRef]
  12. Elbahrawy, Abeer, Laura Alessandretti, Anne Kandler, Romualdo Pastor-Satorras, and Andrea Baronchelli. 2017. Evolutionary dynamics of the cryptocurrency market. Royal Society Open Science 4: 170623. [Google Scholar] [CrossRef]
  13. Eskorouchi, Amirhossein, Hossein Ghanbari, and Emran Mohammadi. 2024. Exploring the Evolution of Robust Portfolio Optimization: A Scientometric Analysis. Scientometric Analysis. Iranian Journal of Accounting, Auditing and Finance 8: 75–92. [Google Scholar] [CrossRef]
  14. García, Fernando, Jairo González-Bueno, Francisco Guijarro, Javier Oliver, and Rima Tamošiūnienė. 2020. Multiobjective approach to portfolio optimization in the light of the credibility theory. Technological and Economic Development of Economy 26: 1165–86. [Google Scholar] [CrossRef]
  15. García, Fernando, Jairo González-Bueno, Javier Oliver, and Rima Tamošiūnienė. 2019. A credibilistic mean-semivariance-PER portfolio selection model for Latin America. Journal of Business Economics and Management 20: 225–43. [Google Scholar] [CrossRef]
  16. Ghanbari, Hossein, Mojtaba Safari, Rouzbeh Ghousi, Emran Mohammadi, and Nawapon Nakharutai. 2023. Bibliometric analysis of risk measures for portfolio optimization. Accounting 9: 95–108. [Google Scholar] [CrossRef]
  17. Giunta, Nicolò, Giuseppe Orlando, Alessandra Carleo, and Jacopo Maria Ricci. 2024. Exploring Entropy-Based Portfolio Strategies: Empirical Analysis and Cryptocurrency Impact. Risks 12: 78. [Google Scholar] [CrossRef]
  18. Greenwood, Jeremy, Zvi Hercowitz, and Per Krusell. 2000. The role of investment-specific technological change in the business cycle. European Economic Review 44: 91–115. [Google Scholar] [CrossRef]
  19. Gupta, Pankaj, Mukesh Kumar Mehlawat, and Ahmad Zaman Khan. 2021. Multi-period portfolio optimization using coherent fuzzy numbers in a credibilistic environment. Expert Systems with Applications 167: 114135. [Google Scholar] [CrossRef]
  20. Hrytsiuk, Petro, Tetiana Babych, and Larysa Bachyshyna. 2019. Cryptocurrency Portfolio Optimization Using Value-at-Risk Measure. Amsterdam: Atlantis Press, pp. 385–89. Available online: https://www.atlantis-press.com/proceedings/smtesm-19/125917683 (accessed on 20 August 2021).
  21. James, Nick, and Max Menzies. 2023. Collective Dynamics, Diversification and Optimal Portfolio Construction for Cryptocurrencies. Entropy 25: 931. [Google Scholar] [CrossRef] [PubMed]
  22. Jeleskovic, Vahidin, Claudio Latini, Zahid Younas, and Mamdouh Al-Faryan. 2024. Cryptocurrency portfolio optimization: Utilizing a GARCH-copula model within the Markowitz framework. Journal of Corporate Accounting & Finance 35: 139–55. [Google Scholar] [CrossRef]
  23. Keller, Carmen, and Michael Siegrist. 2006. Investing in stocks: The influence of financial risk attitude and values-related money and stock market attitudes. Journal of Economic Psychology 27: 285–303. [Google Scholar] [CrossRef]
  24. Khosravi, Arman, Seyed Jafar Sadjadi, and Hossein Ghanbari. 2024. A bibliometric analysis and visualization of the scientific publications on multi-period portfolio optimization: From the current status to future directions. Accounting 10: 107–20. [Google Scholar] [CrossRef]
  25. Kim, Myungwan, Ye Jin Jeong, and Jaehong Jeong. 2024. Two Empirical Studies of Portfolio Optimization Using Cryptocurrency Allocation Ratios. IEEE Access 12: 63827–38. [Google Scholar] [CrossRef]
  26. Kolm, Petter, Reha Tütüncü, and Frank Fabozzi. 2014. 60 Years of portfolio optimization: Practical challenges and current trends. European Journal of Operational Research 234: 356–71. [Google Scholar] [CrossRef]
  27. Liu, Baoding. 2004. Credibility Theory. In Uncertainty Theory. Studies in Fuzziness and Soft Computing. Berlin/Heidelberg: Springer, vol. 154, pp. 79–135. [Google Scholar] [CrossRef]
  28. Liu, Baoding. 2007. Uncertainty Theory 4th Edition. Springer Uncertainty Research. Berlin/Heidelberg: Springer. [Google Scholar]
  29. Liu, Baoding, and Yian-Kui Liu. 2002. Expected value of fuzzy variable and fuzzy expected value models. IEEE Transactions on Fuzzy Systems 10: 445–50. [Google Scholar] [CrossRef]
  30. Liu, Naiqi, Yanju Chen, and Yankui Liu. 2018. Optimizing portfolio selection problems under credibilistic CVaR criterion. Journal of Intelligent & Fuzzy Systems 34: 335–47. [Google Scholar] [CrossRef]
  31. Liu, Yong-Jun, Wei-Guo Zhang, and Qun Zhang. 2016. Credibilistic multi-period portfolio optimization model with bankruptcy control and affine recourse. Applied Soft Computing 38: 890–906. [Google Scholar] [CrossRef]
  32. Longerstaey, Jacques, and Martin Spencer. 1996. Riskmetrics Technical Document. New York: Morgan Guaranty Trust Company of New York, vol. 51. [Google Scholar]
  33. Maghsoodi, Abtin Ijadi. 2023. Cryptocurrency portfolio allocation using a novel hybrid and predictive big data decision support system. Omega (Westport) 115: 102787. [Google Scholar] [CrossRef]
  34. Mansini, Renata, Wlodzimierz Ogryczak, and Maria Grazia Speranza. 2014. Twenty years of linear programming based portfolio optimization. European Journal of Operational Research 234: 518–35. [Google Scholar] [CrossRef]
  35. Markowitz, Harry Max. 1952. Portfolio selection. The Journal of Finance 7: 77–91. [Google Scholar] [CrossRef]
  36. Ma, Yechi, Ferhana Ahmad, Miao Liu, and Zilong Wang. 2020. Portfolio optimization in the era of digital financialization using cryptocurrencies. Technological Forecasting and Social Change 161: 120265. [Google Scholar] [CrossRef]
  37. Mba, Jules Clement, and Sutene Mwambi. 2020. A Markov-switching COGARCH approach to cryptocurrency portfolio selection and optimization. Financial Markets and Portfolio Management 34: 199–214. [Google Scholar] [CrossRef]
  38. Mba, Jules Clement, Edson Pindza, and Ur Koumba. 2018. A differential evolution copula-based approach for a multi-period cryptocurrency portfolio optimization. Financial Markets and Portfolio Management 32: 399–418. [Google Scholar] [CrossRef]
  39. Mehlawat, Mukesh K., Pankaj Gupta, and Ahmad Z. Khan. 2021. Multiobjective portfolio optimization using coherent fuzzy numbers in a credibilistic environment. International Journal of Intelligent Systems 36: 1560–94. [Google Scholar] [CrossRef]
  40. Mohebbi, Negin, and Amir Abbas Najafi. 2018. Credibilistic multi-period portfolio optimization based on scenario tree. Physica A: Statistical Mechanics and Its Applications 492: 1302–16. [Google Scholar] [CrossRef]
  41. Rockafellar, Tyrrell, and Stanislav Uryasev. 2000. Optimization of conditional value-at-risk. The Journal of Risk 2: 21–41. [Google Scholar] [CrossRef]
  42. Rockafellar, Tyrrell, and Stanislav Uryasev. 2002. Conditional value-at-risk for general loss distributions. Journal of Banking & Finance 26: 1443–71. [Google Scholar] [CrossRef]
  43. Sahu, Sonal, José Hugo Ochoa Vázquez, Alejandro Fonseca Ramírez, and Jong-Min Kim. 2024. Analyzing Portfolio Optimization in Cryptocurrency Markets: A Comparative Study of Short-Term Investment Strategies Using High-Frequency Data. Journal of Risk and Financial Management 17: 125. [Google Scholar] [CrossRef]
  44. Schmitz, Tim, and Ingo Hoffmann. 2020. Re-Evaluating Cryptocurrencies’ Contribution to Portfolio Diversification—A Portfolio Analysis with Special Focus on German Investors. Available online: https://arxiv.org/abs/2006.06237v2 (accessed on 27 September 2024).
  45. Shane, Scott. 2012. The Importance of Angel Investing in Financing the Growth of Entrepreneurial Ventures. The Quarterly Journal of Finance 2: 1250009. [Google Scholar] [CrossRef]
  46. Wątorek, Marcin, Stanisław Drożdż, Jarosław Kwapień, Ludovico Minati, Paweł Oświęcimka, and Marek Stanuszek. 2021. Multiscale characteristics of the emerging global cryptocurrency market. Physics Reports 901: 1–82. [Google Scholar] [CrossRef]
  47. Zadeh, Lotfi. 1965. Fuzzy sets. Information and Control 8: 338–53. [Google Scholar] [CrossRef]
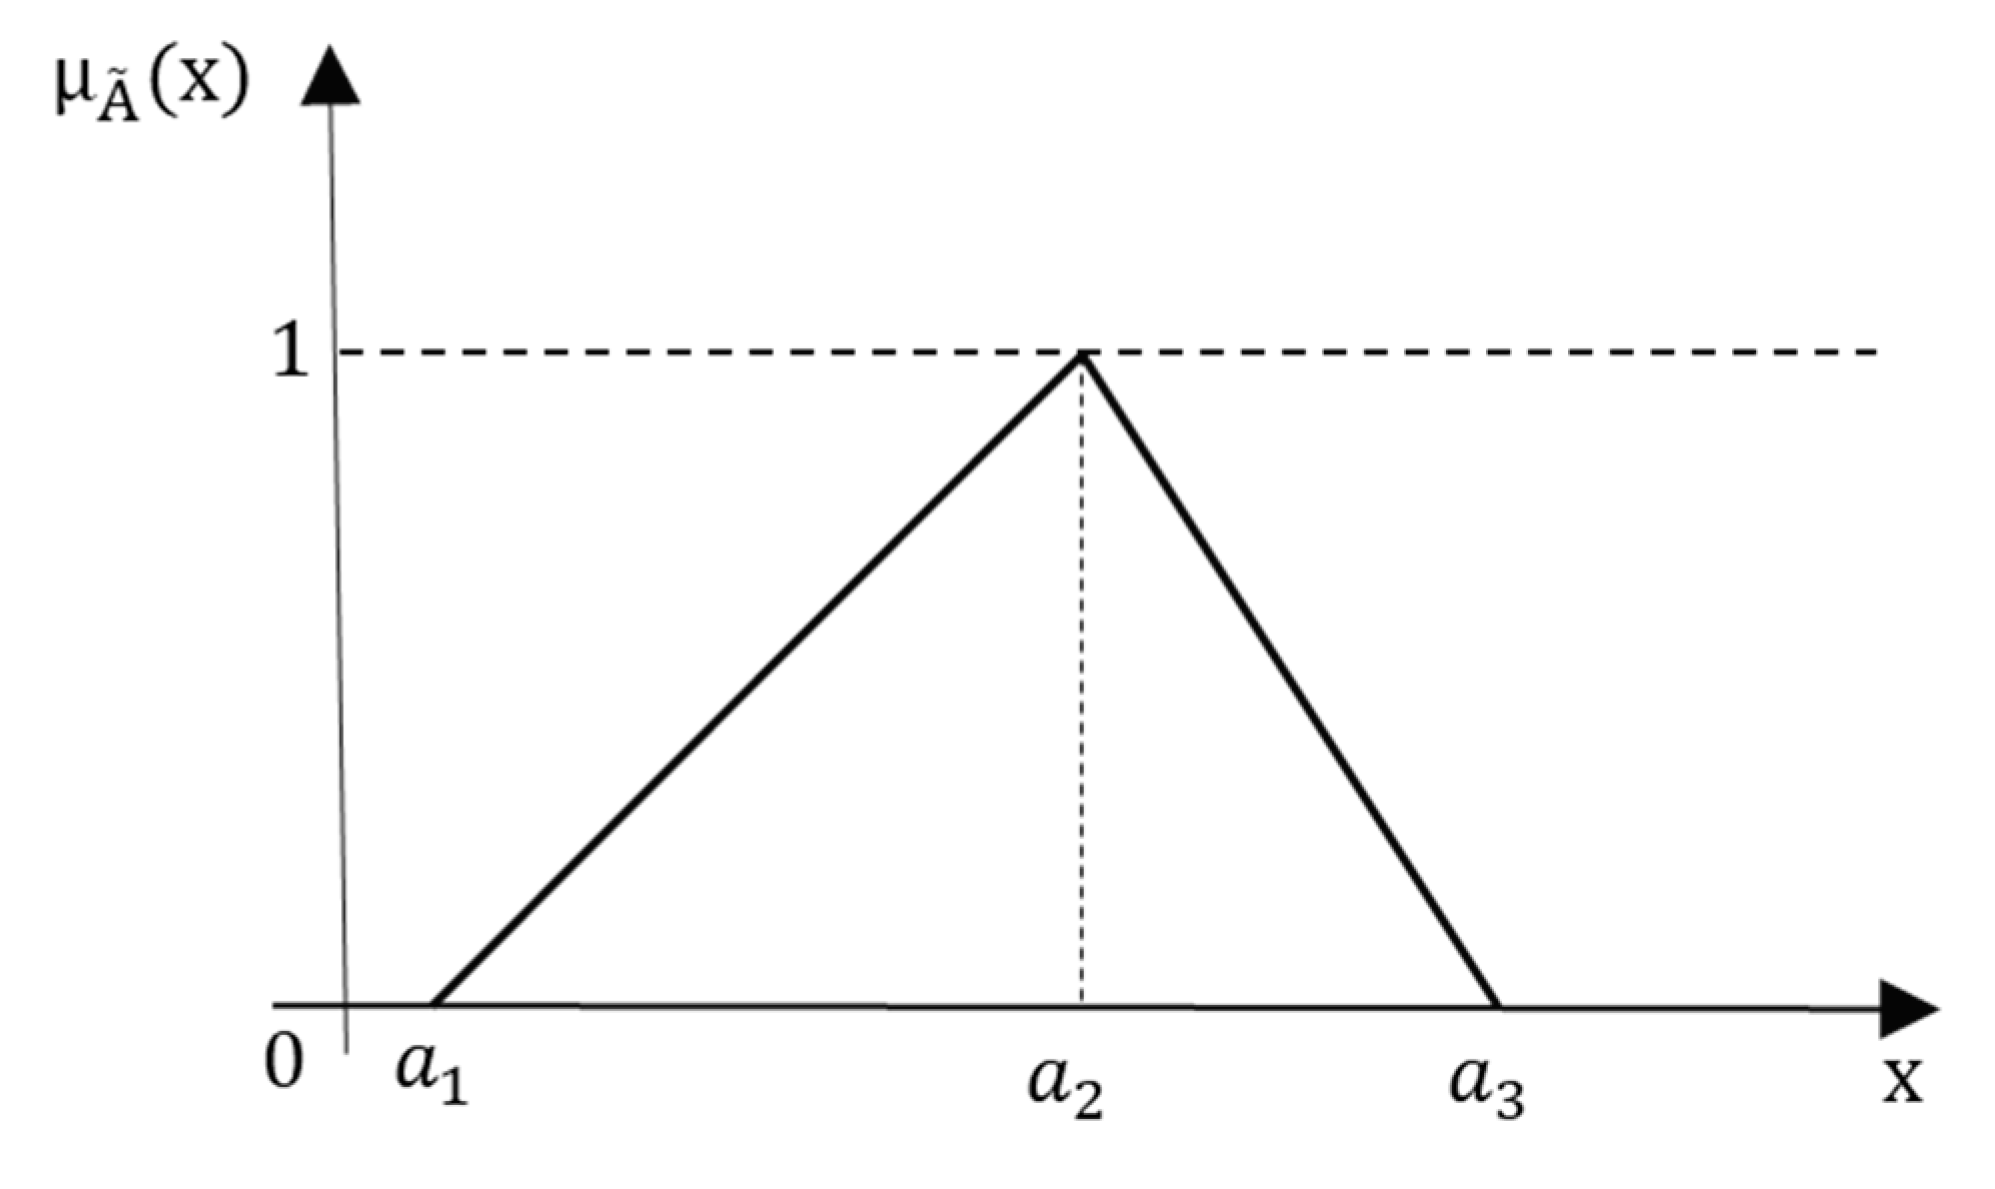
Figure 1. A triangular fuzzy number.
Risks 12 00163 g001
Figure 2. A trapezoid fuzzy number.
Risks 12 00163 g002
Figure 3. Credibility of triangular fuzzy variable.
Risks 12 00163 g003
Figure 4. Credibility of trapezoidal fuzzy variable.
Risks 12 00163 g004
Figure 5. The presentation of portfolios under different scenarios. Source: Authors’ own estimation.
Risks 12 00163 g005aRisks 12 00163 g005b
Table 1. Selected cryptocurrency assets for portfolio optimization.
IDCryptocurrencyTickerIDCryptocurrencyTicker
A1AaveAAVEA19FTX TokenFTT
A2AlgorandALGOA20IOTAMIOTA
A3AvalancheAVAXA21Unus Sed LeoLEO
A4Binance CoinBNBA22LitecoinLTC
A5Bitcoin CashBCHA23MakerMKR
A6Bitcoin SVBSVA24MoneroXMR
A7BitTorrentBTTA25NeoNEO
A8CardanoADAA26PolkadotDOT
A9ChainlinkLINKA27PolygonMATIC
A10CosmosATOMA28SolanaSOL
A11Crypto.com CoinCROA29StellarXLM
A12DaiDAIA30TetherUSDT
A13DashDASHA31TezosXTZ
A14DogecoinDOGEA32THETATHETA
A15EOSEOSA33TronTRX
A16EthereumETHA34USD CoinUSDC
A17Ethereum ClassicETCA35WavesWAVES
A18FilecoinFILA36ProtonXPR
Source: Authors’ own compilation.
Table 2. Descriptive statistics of selected cryptocurrency assets.
IDTickerMeanVarianceSDMaxMin
A1AAVE−0.04420.12680.35611.0000−0.5000
A2ALGO−0.02170.03430.18510.3834−0.4161
A3AVAX0.17490.45540.67482.2547−1.0000
A4BNB0.14190.16200.40251.2642−0.4009
A5BCH0.07230.23170.48141.6334−0.3865
A6BSV0.06770.07740.27820.9346−0.4409
A7BTTOLD−0.03170.02170.14720.1955−0.4302
A8ADA−0.06020.05260.22930.7322−0.3360
A9LINK0.02070.04470.21130.3810−0.3333
A10ATOM0.01840.02840.16860.4864−0.2356
A11CRO0.00700.07380.27170.8871−0.4334
A12DAI−0.00300.00010.01160.0146−0.0421
A13DASH0.06890.04710.21700.7127−0.3962
A14DOGE0.09230.15590.39481.1473−0.4494
A15EOS0.07820.15800.39741.2145−0.4845
A16ETH0.01900.02400.15510.4324−0.2106
A17ETC0.02870.04190.20470.5893−0.2989
A18FIL0.02790.00080.02860.13550.0026
A19FTT0.01380.00610.07800.2226−0.1401
A20MIOTA0.11990.23270.48241.7847−0.4594
A21LEO−0.01900.00390.06250.1577−0.2215
A22LTC0.06600.03500.18710.8401−0.0762
A23MKR0.00930.03900.19750.5126−0.2961
A24XMR0.12920.27300.52252.2258−0.6400
A25NEO0.01930.04770.21840.6457−0.4059
A26DOT0.11020.07370.27150.9136−0.2534
A27MATIC0.02310.06300.25110.9202−0.4954
A28SOL0.16760.14920.38621.0682−0.2688
A29XLM0.32601.67281.29346.4552−0.4303
A30USDT−0.00010.00040.01970.0300−0.0757
A31XTZ−0.03100.02090.14450.3020−0.3053
A32THETA0.00400.06080.24660.5861−0.4348
A33TRX0.33791.34871.16135.5693−0.3176
A34USDC0.00010.00000.00120.0041−0.0021
A35WAVES−0.02560.04880.22100.5596−0.3933
A36XPR0.00820.09830.31361.0554−0.4997
Source: Authors’ own estimation.
Table 3. Trapezoid fuzzy data set for cryptocurrency returns.
IDTrapezoidal Fuzzy DataIDTrapezoidal Fuzzy Data
A1(−0.5, −0.125, 0.625, 1)A19(−0.140, −0.049, 0.131, 0.222)
A2(−0.416, −0.216, 0.183, 0.383)A20(−0.459, 0.101, 1.223, 1.784)
A3(−1, −0.186, 1.441, 2.254)A21(−0.221, −0.126, 0.062, 0.157)
A4(−0.400, 0.015, 0.847, 1.264)A22(−0.076, 0.152, 0.611, 0.840)
A5(−0.386, 0.118, 1.128, 1.633)A23(−0.296, −0.093, 0.310, 0.512)
A6(−0.440, −0.097, 0.590, 0.934)A24(−0.64, 0.076, 1.509, 2.225)
A7(−0.430, −0.273, 0.039, 0.195)A25(−0.405, −0.143, 0.382, 0.645)
A8(−0.336, −0.068, 0.465, 0.732)A26(−0.253, 0.038, 0.621, 0.913)
A9(−0.333, −0.154, 0.202, 0.380)A27(−0.495, −0.141, 0.566, 0.920)
A10(−0.235, −0.055, 0.305, 0.486)A28(−0.268, 0.065, 0.733, 1.068)
A11(−0.433, −0.103, 0.556, 0.887)A29(−0.430, 1.291, 4.733, 6.455)
A12(−0.042, −0.027, 0.000, 0.014)A30(−0.075, −0.049, 0.003, 0.03)
A13(−0.396, −0.118, 0.435, 0.712)A31(−0.305, −0.153, 0.150, 0.301)
A14(−0.449, −0.050, 0.748, 1.147)A32(−0.434, −0.179, 0.330, 0.586)
A15(−0.484, −0.059, 0.789, 1.214)A33(−0.317, 1.154, 4.097, 5.569)
A16(−0.210, −0.049, 0.271, 0.432)A34(−0.002, 0.000, 0.002, 0.004)
A17(−0.298, −0.076, 0.367, 0.589)A35(−0.393, −0.155, 0.321, 0.559)
A18(0.002, 0.035, 0.102, 0.135)A36(−0.499, −0.110, 0.666, 1.055)
Source: Authors’ own estimation.
Table 4. The results of the proposed model under different scenarios.
k l i u i Objective Function x i
x 5 x 20 x 22 x 24 x 26 x 28 x 29 x 33
k = 4 l i = 0.1 u i = 0.5 1.088 x 5 = 0.1 - x 22 = 0.1 --- x 29 = 0.5 x 33 = 0.3
l i = 0.1 u i = 0.3 0.845 x 5 = 0.1 - x 22 = 0.3 --- x 29 = 0.3 x 33 = 0.3
k = 5 l i = 0.1 u i = 0.5 0.978 x 5 = 0.1 x 20 = 0.1 x 22 = 0.1 --- x 29 = 0.5 x 33 = 0.2
l i = 0.1 u i = 0.3 0.842 x 5 = 0.1 x 20 = 0.1 x 22 = 0.2 --- x 29 = 0.3 x 33 = 0.3
k = 6 l i = 0.1 u i = 0.5 0.866 x 5 = 0.1 x 20 = 0.1 x 22 = 0.1 x 24 = 0.1 -- x 29 = 0.5 x 33 = 0.1
l i = 0.1 u i = 0.3 0.836 x 5 = 0.1 x 20 = 0.1 x 22 = 0.1 x 24 = 0.1 -- x 29 = 0.3 x 33 = 0.3
k = 7 l i = 0.1 u i = 0.5 0.737 x 5 = 0.1 x 20 = 0.1 x 22 = 0.1 x 24 = 0.1 - x 28 = 0.1 x 29 = 0.4 x 33 = 0.1
l i = 0.1 u i = 0.3 0.722 x 5 = 0.1 x 20 = 0.1 x 22 = 0.1 x 24 = 0.1 - x 28 = 0.1 x 29 = 0.3 x 33 = 0.2
k = 8 l i = 0.1 u i = 0.5 0.604 x 5 = 0.1 x 20 = 0.1 x 22 = 0.1 x 24 = 0.1 x 26 = 0.1 x 28 = 0.1 x 29 = 0.3 x 33 = 0.1
l i = 0.1 u i = 0.3 0.604 x 5 = 0.1 x 20 = 0.1 x 22 = 0.1 x 24 = 0.1 x 26 = 0.1 x 28 = 0.1 x 29 = 0.3 x 33 = 0.1
Source: Authors’ own estimation.
Disclaimer/Publisher’s Note: The statements, opinions and data contained in all publications are solely those of the individual author(s) and contributor(s) and not of MDPI and/or the editor(s). MDPI and/or the editor(s) disclaim responsibility for any injury to people or property resulting from any ideas, methods, instructions or products referred to in the content.