Abstract
This paper introduces a new family of distortion functions for measuring risks, developed using transmutation techniques. We identify the parameter spaces where the proposed distortions exhibit concavity. Considering that the choice of distortion parameters can be influenced by political factors or users’ risk aversion levels, we generate plots of the distortion functions to examine how these parameters impact the tasks and users’ attitudes toward risk. The coherent properties of the resulting risk measures are explored, outlining the conditions under which the transmuted Kumaraswamy and transmuted truncated normal distortions ensure coherence. Numerical analyses demonstrate the effects of parameter variations on the derived risk measures, highlighting the effectiveness of the proposed distortion functions in accurately assessing risk.
1. Introduction
Risk measures are statistical instruments employed to calculate insurance premiums corresponding to specified risks as discussed in the actuarial literature. These measures are crucial for calculating the suitable premium or necessary capital for a specific risk portfolio considering its potential losses. They also assist in evaluating the reserve capital needed to cover unforeseen losses and maintain financial stability. One fundamental quantile-based risk measure is the Value at Risk (VaR), which summarizes the loss distribution at a given confidence level . Formally, for a non-negative loss or risk random variable X with cumulative distribution function (CDF) the VaR at level q is defined as Va for Another risk measure is the Conditional Tail Expectation (CTE), defined as . It represents the average value of losses that exceed the VaR cutoff value and is inherently greater than the VaR. For further discussions on recent risk measures and their applications to credit risk, refer to Fischer et al. (2018), Furman et al. (2017), and Eugene et al. (2021).
Hardy (2006) discusses fundamental risk measures specifically designed for actuarial purposes, establishing a basis for calculating insurance premiums in relation to risk evaluation. Among the crucial premium calculation methods introduced are the following:
- (1)
- The expected value premium principle, which is defined as where represents a loading factor added to the expected loss.
- (2)
- The standard deviation premium principle, expressed as with denoting the variance of the loss random variable, for some .
- (3)
- The variance premium principle, given by for some .
Each of these principles results in a premium higher than the expected loss, creating a buffer against potential adverse outcomes. The expected value premium principle simply adds a consistent percentage to the expected loss, making it suitable for risks with low variability. Conversely, the standard deviation and variance premium principles account for the variability in losses, with the standard deviation addressing typical fluctuations and the variance accommodating scenarios where extreme outcomes may be more impactful. Given their distinct approaches to risk loading, these principles are generally used in different contexts rather than simultaneously.
Artzner et al. (1997, 1999) discussed risk measures’ desired behaviors and characteristics, focusing on coherency. A risk measure ρ(X) associated with a loss random variable X is deemed coherent if it satisfies the following four axioms:
- (1)
- Monotonicity: if ⇒ .
- (2)
- Subadditivity: .
- (3)
- Positive homogeneity: for any , .
- (4)
- Translation invariance: for any , .
Monotonicity ensures that if one portfolio (Y) always incurs smaller or equal losses compared to another portfolio (X), then the risk measure of X should be greater than or equal to that of Y, reflecting the ordering of risks where larger potential losses result in a higher risk measure. Subadditivity implies that the risk of a combined portfolio (X + Y) should not exceed the sum of the risks of the individual portfolios, promoting diversification by ensuring that combining portfolios does not increase overall risk disproportionately. Positive homogeneity indicates that if the size of a portfolio is scaled by a positive factor c, the risk measure should scale proportionally, ensuring that the risk measure is consistent with the size of the portfolio. Translation invariance means that adding a certain amount c to a portfolio’s value should increase the risk measure by the same amount, reflecting the principle that shifting the entire distribution of potential losses by a constant amount should directly translate into an equivalent shift in the risk measure. Research by Denuit et al. (2005) has shown that the VaR fails to meet the subadditivity axiom. In contrast, the CTE, introduced by Rockafellar and Uryasev (2002), adheres to this and other relevant axioms.
Introduced by Denneberg (1994), a distortion risk measure is a type of risk measure used to calculate insurance premiums by altering or distorting the cumulative distribution function of the loss variable. A distortion function is a non-decreasing function mapping [0, 1] to itself, satisfying and . The risk-adjusted or distortion risk measure for a non-negative loss random variable is given by
where the survival function , F(x) is the CDF, is the probability density function (PDF) of random variable , and is the first derivative of . The distortion risk can be interpreted as the expected utility with a utility function of relative to the loss distribution or, equivalently, as the mean of a random variable Y whose CDF is given by (Pflug 2009).
Wang (1995, 2000) introduced two types of distortion operators for pricing financial and insurance risk: proportional hazards and power distortion. The proportional hazards distortion is given by , where , while the power distortion is given by , with representing the standard normal cumulative distribution function and being a scalar. Additionally, power distortion results in the dual-power distortion function for . It is demonstrated that if the distortion function is concave, the resulting risk measure is coherent.
Wirch and Hardy (1999) examined the beta distribution distortion, defined as follows:
where . The beta distortion function is concave for and . This distortion function employs the beta probability density function as its generating function. When , the beta distortion transforms into the dual-power distortion, and it becomes the power distortion when .
Samanthi and Sepanski (2018) introduced novel classes of distortion functions by substituting the beta PDF with alternative probability density functions. Yin and Zhu (2018) expanded on this by proposing three distinct methods for developing new distortion function classes: combining two existing distortions, creating convex linear mixtures of distortions, and utilizing copula CDFs. Minasyan (2020) explored two innovative classes of financial risk measures, which are defined by applying a power function to the VaR and CTE. Furthermore, Minasyan (2021) advanced the field by introducing the concept of variance distortion, which involves distorting the variance instead of the mean using well-known distortion functions that generate the VaR and CTE. Recent studies, such as Sepanski and Wang (2023), introduced a new method for constructing classes of distortion functions based on transforming a non-negative random variable with a generating distribution. They derived closed-form expressions for risk measures related to uniform, exponential, and Lomax losses, ensuring coherency by restricting the parameter space where the distortion function is concave.
The remainder of this paper is organized as follows. Section 2 develops a new family of distortion functions using transmutation techniques. Section 3 introduces the new family of transmuted distortion functions and examines their coherence properties, with a focus on transmuted Kumaraswamy and transmuted truncated normal distortions. In Section 4, we apply the proposed distortion functions to derive risk measures for exponential, Lomax, and log-normal loss distributions. Numerical and graphical comparisons are presented in Section 5. Finally, a summary and conclusion are presented in Section 6.
2. Distribution Distortions
This section develops a new family of distortion functions using transmutation techniques. Transmutation is the functional composition of the cumulative distribution function of one distribution with the reverse cumulative distribution function. This technique has been applied to develop families of transmuted probability distributions in the literature. A thorough review of transmuted probability distributions is given by Dey et al. (2021). A new family of transmuted distortion risk measures will be studied by applying the transmutation technique.
Let be a random variable with PDF, , and CDF . The corresponding PDF and CDF of the transmuted random variable generated by using the transmuted mapping are defined as follows:
where . For , and coincide with and , respectively.
It is seen that the CDF of a random variable with support in [0, 1] is a distortion function. Therefore, one can define the transmuted distortion function as follows. Given a valid distortion function , the corresponding transmuted family of distortion function is defined as follows:
From (1), we obtain the transmuted distortion risk measure in the following:
3. Coherent Property of Transmuted Distortion Function
The necessary condition to ensure the coherent properties of a distortion risk measure is the concavity of the distortion function. The following theorem derives the general condition for concavity of the general transmuted distortion without imposing any constraints on the parameters of .
Theorem 1.
Conditions of Concavity for Transmuted Distortion
Let 2 be a transmuted distortion, where is a differentiable function on [0, 1] and . The concavity of on [0, 1] is determined by its second derivative:
is concave wherever
Proof.
The first and second derivatives of are given by the following, respectively:
Let us analyze the expression for :
- Consider :
- is non-negative and at most 1.
- Therefore, ranges from (when ) to (when ).
- Case analysis on :
- If :
- ∎
- The term is non-positive since and .
- If :
- ∎
- The term is positive but bounded above by .
- Consider the negative term :
- This term is always non-positive for any since .
- Combining the terms:
- To ensure , the negative contribution from must dominate.
- Given that , the term is strictly negative or zero.
- Even if , the product is positive but not large enough to counter the strong negative term .
- Bounding the terms:
- Since and
- ∎
- is strictly negative or zero and provides the necessary concavity.
Conclusion:
For , the negative term ensures that remains non-positive, establishing the concavity of on Thus, the lemma is proven for in the interval □
From Theorem 1, the general condition for to be concave down will depend on the values and signs of , and . In the subsequent subsections, we identify the parameter spaces where the proposed distortion exhibits concavity. Given that the choice of distortion parameters may be influenced by political factors or the users’ risk aversion levels, we will generate plots of the distortion functions to examine how these parameters impact the functions and users’ attitudes toward risk.
In this study, we chose the Kumaraswamy and truncated normal distributions for transmutation due to their distinct advantages in modeling risk measures. The Kumaraswamy distribution offers flexibility in modeling a wide range of shapes with bounded support, making it particularly suitable for actuarial applications where the range of outcomes is naturally limited. The truncated normal distribution, on the other hand, provides a familiar and widely applicable framework that allows us to capture the effects of transmuted distortions intuitively and consistently with established financial modeling practices.
3.1. Transmuted Kumaraswamy Distortion
The CDF of the Kumaraswamy distribution with support [0, 1] is given by the following:
where and are non-negative parameters.
The transmuted distortion function is defined as follows:
replacing , the transmuted Kumaraswamy distortion function is as follows:
When , the distortion reduces to which is a CDF of Kumaraswamy distribution. If we set and , the distortion simplifies to , which is the PDF of the uniform distribution on .
The corresponding risk measure is given by
Lemma 1.
The distortion in (4) is concave if and , with parameter .
Proof.
Using Theorem 1, is given by the following:
where the second derivative is . □
It is seen that when and , is non-positive. Since also depends on , we need to derive the domain of where will be negative.
Now, consider the first term of :
Since and , . Thus, is non-negative, and since is non-positive, is non-positive for .
For the term :
- If , is non-positive.
- If , the term is zero.
For , both terms in are non-positive. Therefore, is concave for , , and .
Figure 1, Figure 2, Figure 3 and Figure 4 display the concave curve distribution of for different parameters. Belles-Sampera et al. (2016) utilize the area beneath the distortion function to measure global risk attitude. It is important to note that the area under a concave curve on [0, 1] always exceeds half. A larger area signifies a higher risk tolerance, whereas a smaller area signifies a higher risk aversion.
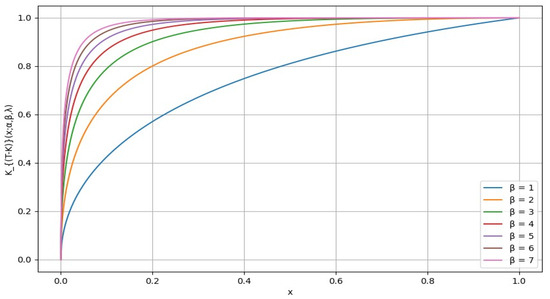
Figure 1.
The distortion for different values of from 1 to 7, where and are fixed at 0.5.
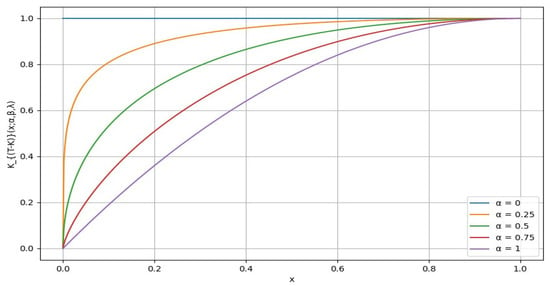
Figure 2.
The distortion for different values of , with fixed and at 1.
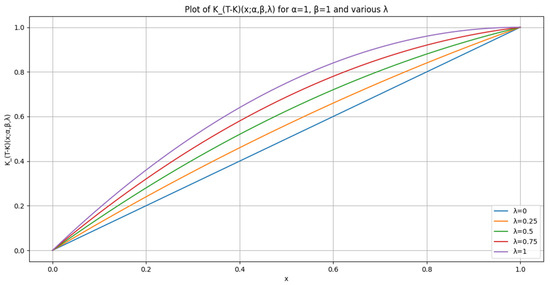
Figure 3.
The distortion for different values of , with fixed and at 1.
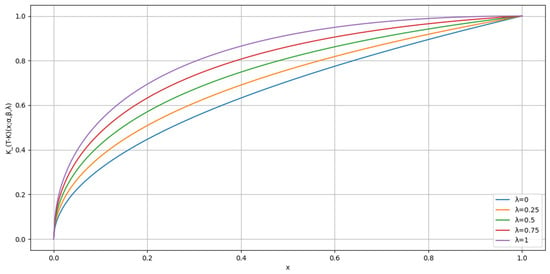
Figure 4.
The distortion for different values of , where , and is 0.5.
The plot below illustrates how the shape of the distortion function changes with varying values of the shape parameter . A small value of results in a relatively flat curve that gradually increases towards 1. As increases, the curves become steeper and narrower, indicating that the function becomes more concentrated around a specific value of . Parameter controls the right-tail risk aversion. It appears that the choice of a larger value reflects a higher level of global risk-tolerant attitude.
Figure 2 shows a plot of the distribution for different values of parameter {0, 0.25, 0.5,0.75, 1}, while fixing and at 1. From the graph, we can observe that the value of decreases, the curve becomes steeper, and this indicates that the distribution becomes more concentrated around a specific higher peak value. On the other hand, as the value of increases, the curve becomes flatter and wider, indicating a more spread-out distribution. Parameter controls the rate of convergence. It appears that the choice of a smaller value reflects a higher level of global risk-tolerant attitude.
For the area under a concave curve to be 0.5 (equivalent to the area under the diagonal line), the curve would have to coincide with this diagonal line from (0,0) to (1,1) over the entire interval [0, 1]. In the transmuted Kumaraswamy distortion function, when the function coincides with the diagonal line, this suggests that there is no distortion of probabilities. This implies that the perceived probabilities align perfectly with the true probabilities. For the transmuted Kumaraswamy distortion function to coincide with the diagonal line (indicating no distortion), it would require and , as shown in Figure 3.
Figure 4 illustrates the distortion for different values of the parameter {0, 0.25, 0.5, 0.75, 1} with fixed at 1 and fixed at 0.5. From the graph, it is evident that as the value of λ increases, the curve becomes steeper. This steepness indicates that the distribution is more concentrated around a higher peak value, suggesting a higher level of risk aversion. Conversely, when λ is smaller, the curve becomes flatter and more spread out, indicating a more even distribution of values. Thus, a higher λ reflects a distribution that is more sharply peaked, implying a higher level of global risk-tolerant attitude.
3.2. Transmuted Truncated Normal Distortion
The CDF of a truncated normal distribution, supported on [0, 1] and derived from an original normal distribution with mean and standard deviation , is expressed as
for Here, and represent the standard normal PDF and CDF, respectively. The transmuted truncated normal distortion is defined as
The corresponding risk measure is defined as
The following lemma defines the parameter spaces for the transmuted truncated normal distortion to preserve the coherence of the resulting risk measures.
Lemma 2.
The distortion in (6) with parameters and is concave if .
Proof.
Using the theorem of concavity for transmuted distortion, we have the following:
The second derivative is ; since is always positive and and , the term is non-negative. Thus, is non-positive.
For :
; since is in the range , and ,
. Thus, is non-negative, and since is non-positive, is non-positive.
For :
- If , is non-positive.
- If , the term is zero.
For , both terms in are non-positive. Therefore, ensuring that is concave for and , and □
It is important to note that μ and σ are location and scale parameters, respectively, and do not affect the shape of the distortion function. Therefore, varying these parameters does not change the overall pattern of the graphs but simply shifts or scales them. For simplicity, we chose μ = −0.5 and σ = 1 in Figure 5 to illustrate the effect of the distortion function under these conditions.
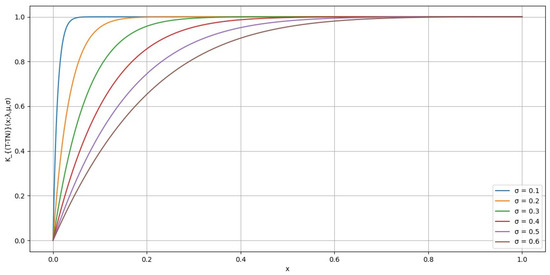
Figure 5.
The distortion for different values of , where , and
In Figure 5, when and , a higher value of is associated with a lower level of global risk tolerance and higher risk aversion. As decreases, the distortion function curves upwards more rapidly, indicating a higher level of global risk tolerance. When , the area under the curve is close to 1, reflecting a conservative global risk-tolerant attitude.
Figure 6 shows the effects of varying values while keeping and constant at 0.5. All values are negative in this figure. A lower (more negative) value leads to a steeper curve, indicating a higher level of global risk tolerance. Conversely, higher (less negative) values produce flatter curves, reflecting increased risk aversion. This indicates that is inversely related to risk tolerance, with lower (more negative) values corresponding to a more risk-tolerant attitude.
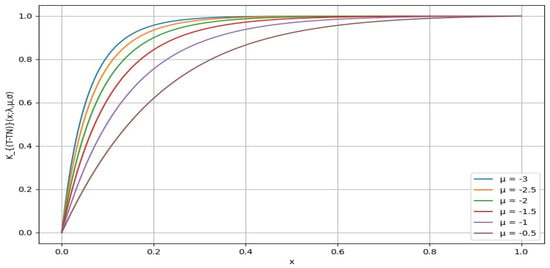
Figure 6.
The distortion for different values of , where and are fixed at 0.5.
In Figure 7, as increases, the curve becomes steeper, which signifies a greater tolerance for risk. Conversely, lower values result in a flatter curve, indicating a higher level of risk aversion. This shows that directly affects risk attitude, with higher values leading to greater risk tolerance.
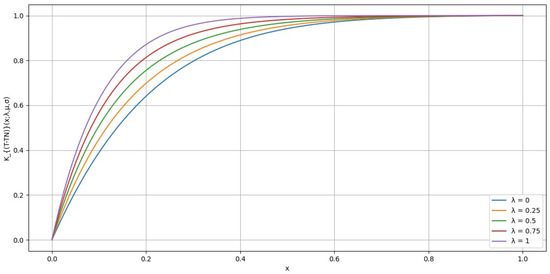
Figure 7.
The distortion for different values of , where and .
4. Examples of Transmuted Distortion Risk Measures
In this section, we calculate the distortion risk measures defined in (3) for transmuted Kumaraswamy distortion and transmuted truncated normal distortion for exponential, Lomax, and log-normal losses.
The exponential, Lomax, and log-normal loss distributions were selected to cover a range of risk scenarios, from light-tailed to heavy-tailed distributions. The exponential distribution was chosen due to its simplicity and relevance in modeling time-to-event data, where the hazard rate is constant. The Lomax distribution, with its heavy-tailed characteristics, is particularly suitable for scenarios involving high variability and extreme values, such as those found in insurance claims. The log-normal distribution is well suited for financial applications, where data often exhibit skewness and non-negative values. These selections provide a robust testing ground for the proposed transmuted distortion functions, ensuring their applicability across different risk management contexts.
4.1. Exponential Loss
An exponential loss random variable with parameter is characterized by the density function . It has a mean of and a variance of . The survival function is for , and the inverse survival function is for
Using (5), the transmuted Kumaraswamy distortion risk measure is
Distortion risk measures are computed for different parameter combinations to examine the extent of their impacts. To facilitate comparisons, the parameters are selected so that each has a mean loss of 1.
Table 1 presents for various combinations of and using the exponential loss with parameter . The table shows that increasing generally leads to a decrease in the distortion risk measure across all values of . Conversely, increasing results in a higher distortion risk measure for any fixed . These trends underscore the sensitivity of the distortion risk measure to changes in both and , with having a reducing effect and having an increasing effect on the risk measure. This pattern highlights the importance of carefully selecting these parameters to manage the distortion risk measure effectively.

Table 1.
for various combinations of and using the exponential loss with parameter .
Using (7), the transmuted truncated normal distortion measure is
Table 2 presents the distortion risk measure for various combinations of m and σ using the exponential loss with parameter . The table illustrates that increasing consistently decreases the distortion risk measure across all m values. For example, when m is −0.5, the measure decreases from 3.23 to 1.52 as increases from 0.25 to 1. Additionally, as m becomes more negative, the distortion risk measure increases for any fixed . These trends highlight the sensitivity of the distortion risk measure to changes in both m and , with an increasing reducing the risk measure and a more negative m increasing it.

Table 2.
for various combinations of and using the exponential loss with parameter .
4.2. Lomax Loss
A Lomax loss random variable with parameters has a density function , for It has mean of for variance of for a survival function , and an inverse survival function for
The transmuted Kumaraswamy distortion risk measure is
Table 3 presents the distortion risk measure for various combinations of and using the Lomax loss with parameters and . The table shows that increasing leads to a significant increase in the distortion risk measure across all values of . For instance, when is 0.35, the measure rises dramatically from 39.09 to 182.85 as increases from 1 to 5. Conversely, increasing α results in lower distortion risk measures. For example, when is 1, the measure decreases from 39.09 to 0.80 as increases from 0.35 to 1.00. These trends highlight the sensitivity of the distortion risk measure to changes in both and , with having a dampening effect and having an amplifying effect on the risk measure.

Table 3.
for various combinations of and using the Lomax loss with parameters ().
The transmuted truncated normal distortion measure is
Table 4 presents the distortion risk measure for various combinations of μ and using the Lomax loss with parameters and . The table reveals that increasing decreases the distortion risk measure across all values of μ. For example, when μ is −0.5, the measure decreases from 4.55 to 1.64 as increases from 0.25 to 1. Additionally, as μ becomes more negative, the distortion risk measure increases for any fixed . For instance, with σ at 0.25, the measure rises from 4.55 to 9.62 as changes from −0.5 to −2. These trends highlight the sensitivity of the distortion risk measure to changes in both and , with an increasing reducing the risk measure and a more negative increasing it.

Table 4.
for various combinations of and using the Lomax loss with parameters ().
4.3. Log-Normal Loss
A random variable characterizes a log-normal distribution such that follows a normal distribution with a mean and variance . The PDF for is for The mean of is , and the variance is . The survival function, which represents the probability that exceeds a value , is , where is the cumulative distribution function of the standard normal distribution. The inverse survival function, which finds the value such that the survival function is , is employing , the inverse function of the standard normal CDF.
The transmuted Kumaraswamy distortion risk measure is
Table 5 displays the distortion risk measure for various combinations of and using a log-normal loss with parameters and . The values indicate that increasing results in a higher distortion risk measure for any given . For instance, with at 0.35, the measure rises from 4.84 to 14.68 as increases from 1 to 5. Conversely, increasing results in a lower distortion risk measure across all values of . For example, when is fixed at 1, the measure decreases from 4.84 to 0.76 as increases from 0.35 to 1.00. These observations emphasize the sensitivity of the distortion risk measure to both and , where reduces and amplifies the risk measure.

Table 5.
for various combinations of and using a log-normal loss with parameters ().
The transmuted truncated normal distortion measure is
Table 6 presents the distortion risk measure for various combinations of m and using a log-normal loss with parameters and . The table shows that as increases, the distortion risk measure generally rises for any given m. For example, when m is −0.5, the measure increases from 0.93 to 1.55 as increases from 0.25 to 1. Additionally, more negative values of μ lead to lower distortion risk measures across all values of . For instance, with fixed at 0.25, the measure decreases from 0.93 to 0.25 as m becomes more negative from −0.5 to −2. These patterns highlight the sensitivity of the distortion risk measure to changes in both m and , with an increasing raising the risk measure and a more negative m lowering it.

Table 6.
for various combinations of and using a log-normal loss with parameters ().
5. Numerical Analyses
In Section 4, we analyze three distinct loss distributions: the exponential distribution with , the Lomax distribution with parameters and , and the log-normal distribution with mean and standard deviation . These distributions are chosen to demonstrate different behaviors of loss models under various parametric conditions. To facilitate comparisons, all distributions are normalized to have a mean loss of 1, although their variances vary due to the unique characteristics of each distribution.
In this section, numerical evaluations of distortion risk measures ( and were conducted in comparison with the widely adopted VaR and CTE for three different loss distributions: exponential, Lomax, and log-normal.
In Figure 8, the probability density functions for these three widely utilized loss random variables are plotted. The first distribution, characterized by a lighter tail, quickly diminishes as the variable increases, representing a typical exponential decay. The second distribution exhibits a heavier tail, decreasing at a slower rate than the first but faster than the third distribution, indicative of a Lomax or heavy-tailed behavior. The third distribution has the heaviest tail among the three, showing a much slower decay, which is often seen in financial modeling scenarios like stock returns. Each distribution provides unique insights into different risk measures, illustrating the varying levels of tail risk associated with each type of loss function.
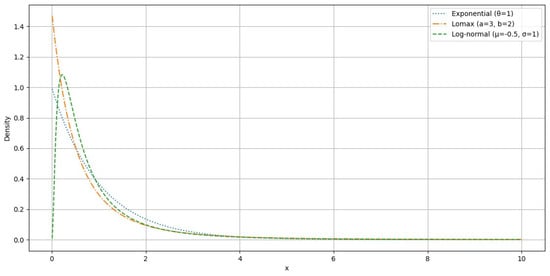
Figure 8.
PDF of exponential, Lomax, and log-normal losses.
The risk measures VaR and CTE at a given confidence level for the three selected loss functions are presented in the following.
- Exponential loss with a CDF of forVaR and CTE =
- Lomax loss with a CDF of forVaR and CTE =
- Log-normal loss with a CDF of forVaR and CTE =
Table 7 displays the VaR and CTE values for each loss distribution across different percentile levels. These values provide benchmarks for comparison and offer insights into the behavior of the upper tails of the analyzed loss random variables.

Table 7.
VaR and CTE values at levels of 0.25, 0.5, 0.75, 0.95, and 0.99 for exponential (1), Lomax (3, 2), and log-normal () losses.
Table 8 and Table 9 present the distortion risk measures for various loss distributions using different distortion functions. In Table 8, for the distortion, the risk measures increase as parameter α decreases and parameter β increases, with the Lomax loss showing the highest sensitivity. Table 9 shows the risk measures for the distortion, where the measures increase as the mean μ decreases and the standard deviation σ decreases. Again, the Lomax loss demonstrates the highest variance and skewness among the three distributions. Overall, these tables highlight the significant impact of parameter selection on risk assessment across different loss distributions and distortion functions.

Table 8.
The distortion risk measure for exponential (1), Lomax (3, 2), and log-normal () losses.

Table 9.
The distortion risk measure for exponential (1), Lomax (3, 2), and log-normal () losses.
Comparing these results with traditional risk measures like the VaR and CTE in Table 7, the transmuted distortion functions provide a broader and more flexible risk assessment. For instance, while the VaR for the Lomax distribution at the 99th percentile is 7.30, and the CTE is 8.30, the transmuted Kumaraswamy distortion shows a significantly higher risk measure of 182.85 (Table 8). This demonstrates the greater sensitivity of the transmuted distortions to tail risks, offering a more nuanced evaluation.
Loss distributions with higher kurtosis or tail heaviness, such as Lomax and log-normal, are particularly sensitive to these transmuted distortions. For example, in the log-normal distribution, the VaR at the 99th percentile is 6.21, and the CTE is 10.24 (Table 7). However, the transmuted truncated normal distortion increases the risk measure substantially, reflecting the distribution’s heavy-tailed nature more accurately.
This increased sensitivity indicates that the transmuted Kumaraswamy and transmuted truncated normal distortions are better equipped to capture the complexities of tail risk, making them valuable for managing scenarios involving extreme events. Overall, the comparison between the transmuted distortion measures and traditional methods like the VaR and CTE underscores the practical advantages of the proposed functions. Their ability to capture a broader range of risk scenarios, particularly in heavy-tailed distributions, highlights their importance in providing a more accurate and comprehensive risk assessment.
6. Summary and Conclusions
The framework employed in this study was motivated by the potential to enhance risk assessment through the development of new distortion functions using transmutation techniques. By leveraging the flexibility of transmuted distributions, particularly the Kumaraswamy and truncated normal distributions, we introduced distortion functions that better capture the nuances of tail risks in loss distributions. These functions provide an alternative to traditional risk measures such as the VaR and CTE, offering a more adaptable and comprehensive approach to evaluating extreme risks.
The transmutation technique opens up new possibilities for generating distortion functions, allowing us to extend beyond existing methods. Our study explored the parameter spaces within which these new distortion functions retain coherence, ensuring that the resulting risk measures meet the necessary criteria for practical application. The proposed framework not only reproduces some well-known distortions but also introduces new functions that can be tailored to reflect varying risk attitudes.
We demonstrated the application of these new distortion functions by calculating distortion risk measures for exponential, Lomax, and log-normal loss distributions. Through numerical analysis, we examined how the choice of distortion parameters influences risk assessments and reflects risk tolerance. This exploration sheds light on the practical implications of our theoretical contributions, particularly in settings where understanding and managing tail risks are crucial.
While this study provides a solid foundation for the development and application of new distortion functions, there are areas that warrant further investigation. One such area is the influence of external factors, such as political considerations and varying levels of risk aversion, on the selection and calibration of distortion parameters. Understanding these influences could significantly enhance the practical applicability of the proposed methods.
Additionally, future research should explore the performance of these distortion functions under different economic conditions and across various types of financial instruments. Expanding the framework to incorporate other generating distributions or applying it to different areas, such as credit risk assessment or portfolio optimization, could yield valuable insights. The potential for bias in the estimation of distortion risk measures, particularly in heavy-tailed loss distributions, also warrants further exploration. Investigating methods to correct these biases, possibly through advanced techniques such as bootstrapping or extreme value theory, could further refine the effectiveness of the proposed distortion functions.
In conclusion, the transmutation framework presented in this study offers a promising avenue for advancing risk assessment methodologies. The flexibility and adaptability of the new distortion functions make them valuable tools for both theoretical research and practical applications in high-risk industries.
Author Contributions
Conceptualization, C.L.; Software, M.A.; Formal analysis, M.A.; Writing—original draft, M.A.; Writing—review & editing, C.L. and F.F.; Supervision, C.L. and F.F. All authors have read and agreed to the published version of the manuscript.
Funding
This research received no external funding.
Data Availability Statement
Data is contained within the article.
Acknowledgments
We are very grateful for two anonymous reviewers and the editor for their thorough reviews of this manuscript with many constructive comments and suggestions. These comments and suggestions have helped to greatly improve this article.
Conflicts of Interest
The authors declare no conflict of interest.
References
- Artzner, Philippe, Freddy Delbaen, Jean-Marc Eber, and David Heath. 1997. Thinking coherently. Risk 10: 68–71. [Google Scholar]
- Artzner, Philippe, Freddy Delbaen, Jean-Marc Eber, and David Heath. 1999. Coherent Measures of Risk. Mathematical Finance 9: 203–28. [Google Scholar] [CrossRef]
- Belles-Sampera, Jaume, Montserrat Guillen, and Miguel Santolino. 2016. What attitudes to risk underlie distortion risk measure choices? Insurance, Mathematics and Economics 68: 101–9. [Google Scholar] [CrossRef]
- Denneberg, Dieter. 1994. Non-Additive Measure and Integral. Theory and Decision Library. Dordrecht: Springer, vol. 27. [Google Scholar]
- Denuit, Michel, Jan Dhaene, Marc Goovaerts, and Rob Kaas. 2005. Measures, orders and models. In Actuarial Theory for Dependent Risks. New York: John Wiley & Sons, Ltd. [Google Scholar]
- Dey, Sanku, Devendra Kumar, Mohammed Zafar Anis, Saralees Nadarajah, and Idika Okorie. 2021. A Review of Transmuted Distributions. Journal of the Indian Society for Probability and Statistics 22: 47–111. [Google Scholar] [CrossRef]
- Eugene, A. J., Mila Novita, and Siti Nurrohmah. 2021. Gini Shortfall: A Gini mean difference-based risk measure. Journal of Physics: Conference Series 1725: 012094. [Google Scholar] [CrossRef]
- Fischer, Matthias, Thorsten Moser, and Marius Pfeuffer. 2018. A discussion on recent risk measures with application to credit risk: Calculating risk contributions and identifying risk concentrations. Risks 6: 142. [Google Scholar] [CrossRef]
- Furman, Edward, Ruodu Wang, and Ričardas Zitikis. 2017. Gini-type measures of risk and variability: Gini shortfall, capital allocations, and heavy-tailed risks. Journal of Banking & Finance 3: 70–84. [Google Scholar] [CrossRef]
- Hardy, Mary R. 2006. An Introduction to Risk Measures for Actuarial Applications: Construction and Evaluation of Actuarial Models Study Note. Schaumburg: Society of Actuaries. [Google Scholar]
- Minasyan, Vigen. 2020. New ways to measure catastrophic financial risks: VaR to the power of t measures and how to calculate them. Finance: Theory and Practice 24: 92–109. [Google Scholar] [CrossRef]
- Minasyan, Vigen. 2021. New risk measures for variance distortion and catastrophic financial risk measures. Finance: Theory and Practice 25: 165–84. [Google Scholar] [CrossRef]
- Pflug, Georg. 2009. On distortion functionals. Statistics and Decisions 27: 201–9. [Google Scholar] [CrossRef]
- Rockafellar, R. Tyrrell, and Stanislav Uryasev. 2002. Conditional value-at-risk for general loss distributions. Journal of Banking & Finance 26: 1443–71. [Google Scholar] [CrossRef]
- Samanthi, Ranadeera G. M., and Jungsywan Sepanski. 2018. Methods for Generating Coherent Distortion Risk Measures. Annals of Actuarial Science 13: 400–16. [Google Scholar] [CrossRef]
- Sepanski, Jungsywan H., and Xiwen Wang. 2023. New classes of distortion risk measures and their estimation. Risks 11: 194. [Google Scholar] [CrossRef]
- Wang, Shaun. 1995. Insurance pricing and increased limits ratemaking by proportional hazards transforms. Insurance: Mathematics and Economics 17: 43–54. [Google Scholar] [CrossRef]
- Wang, Shaun S. 2000. A class of distortion operations for pricing financial and insurance risks. Journal of Risk and Insurance 67: 15. [Google Scholar] [CrossRef]
- Wirch, Julia Lynn, and Mary R. Hardy. 1999. A synthesis of risk measures for capital adequacy. Insurance: Mathematics and Economics 25: 337–47. [Google Scholar]
- Yin, Chuancun, and Dan Zhu. 2018. New class of distortion risk measures and their tail asymptotic with emphasis on VaR. Journal of Financial Risk Management 7: 12–38. [Google Scholar] [CrossRef]
Disclaimer/Publisher’s Note: The statements, opinions and data contained in all publications are solely those of the individual author(s) and contributor(s) and not of MDPI and/or the editor(s). MDPI and/or the editor(s) disclaim responsibility for any injury to people or property resulting from any ideas, methods, instructions or products referred to in the content. |
© 2024 by the authors. Licensee MDPI, Basel, Switzerland. This article is an open access article distributed under the terms and conditions of the Creative Commons Attribution (CC BY) license (https://creativecommons.org/licenses/by/4.0/).