1. Introduction
Business failure prediction is an essential area of finance that helps identify the probability of organizations failing and eventually going bankrupt. The failure of a business can cause significant losses for creditors and stockholders; the principal investors in any company. As a result, many users of financial statements place a high value on their capacity to anticipate insolvency. These users include, for instance, businesses, investors, credit rating organizations, auditors, and regulators. Using a model to predict bankruptcy and identify early warning signs becomes increasingly essential during a financial and economic crisis. Many studies have been conducted over the years, developing various statistical and machine learning models to predict bankruptcy (
Qu et al. 2019;
Tunio et al. 2021).
In emerging economies like Pakistan, predicting whether a company will fail financially is a significant challenge for stock market investors. In the past, traditional statistical models were used to predict bankruptcy. However, they often have limitations, such as assuming a linear relationship between variables and relying on a subjective selection of variables. Meanwhile, machine learning models have gained popularity for this task due to their ability to analyze large amounts of data and identify complex patterns that may be difficult for humans to detect (
Islam et al. 2022). Machine learning models are increasingly being used because they can continuously improve accuracy by learning from and adapting to new data in real-time. Machine learning models can handle non-linear correlations and automatically select the most significant predictor variables. Decision trees, random forests, neural networks, and support vector machines are some widely used machine learning models that can predict whether a business will fail. Using machine learning models for predicting bankruptcies can result in more accurate and reliable predictions when applied extensively.
Different fundamentals apply to emerging economies like Pakistan, such as the limited availability of historical data, lax bankruptcy laws, volatile stock markets, and unstable political and economic environments. By utilizing advanced algorithms to effectively analyze extensive data, machine learning models can assist in overcoming some of these difficulties. These algorithms can spot patterns and connections in the data that previous statistical analyses like multiple discriminant analysis (MDA) might miss, giving information about potential hazards and opportunities in the financial world. Hence, machine learning models provide an essential tool for predicting financial failure in developing nations like Pakistan, allowing investors and related financial institutions to make better judgments and more successfully manage risk against the financial failures of the companies.
For several reasons, understanding the intricacies of bankruptcy prediction in emerging markets is crucial for a global readership. Firstly, with the increasing interconnectedness of global financial systems, comprehending risks in one market can have broader implications for international investors, financial institutions, and policymakers. Additionally, international investors often seek diversification by investing in emerging markets, and insights from studies in this context can aid in better risk assessments and informed decision-making (
Li et al. 2021). Furthermore, extending the application of established models to emerging markets enriches the academic discourse, either by strengthening the general applicability of the models or highlighting their limitations (
Patel et al. 2022). Lastly, while the focus may be on Pakistani companies, the challenges faced in emerging markets are often similar, making the findings potentially transferable to other emerging or frontier markets (
Wang et al. 2021).
By juxtaposing machine learning models, which are widely accepted in developed contexts, against the backdrop of a quintessential emerging market like Pakistan, our study aims to bridge a significant gap in the literature. The insights, challenges, and lessons drawn from this analysis are relevant to local stakeholders and resonate with a global audience seeking a comprehensive understanding of global financial landscapes (
Khan et al. 2021). This research contributes to the existing body of knowledge and offers valuable insights for academia, practitioners, and policymakers alike.
Prior research has extensively evaluated bankruptcy prediction, but mainly in the context of established economies, potentially rendering them less applicable to emerging markets (
Papana and Spyridou 2020). Predicting bankruptcy in such environments is complicated due to data paucity, unpredictable stock markets, and a fluid political landscape (
Kliestik et al. 2020). The research leverages advanced machine learning to decipher intricate data patterns, eclipsing traditional statistical methods. The goal is to discern the most efficient model and relevant financial ratios tailored to the Pakistani backdrop, providing invaluable insights to investors and lenders. This work innovates by holistically assessing machine learning models for bankruptcy predictions within Pakistan, aiming to bolster informed decision-making and fortify the nation’s financial milieu (
Kanapickienė et al. 2023).
This study aims to identify the most effective method for predicting business failure in Pakistani non-financial firms by applying multiple machine learning models to 36 financial ratios to answer two critical questions: the suitability of model selection and the selection of the most appropriate ratios. Before investing or lending money, stakeholders such as shareholders, managers, banks, and creditors must evaluate a company’s financial condition. This study seeks to contribute to the literature on business failure prediction by shedding light on the most effective methods for predicting business failure in Pakistan. This study also has practical implications for investors, lenders, and regulators, who can use the findings to make informed judgments regarding investing in or lending money to non-financial companies in Pakistan.
2. Literature Review
Bankruptcy studies began in the 1930s with ratio analyses to predict future bankruptcy and continued through the mid-1960s using single factor/ratio analyses for comparison purposes.
Beaver (
1966) introduced a univariate analysis in the late 1960s, which provided the first statistical justification for the ability of financial ratios to account for defaults. It employed MDA techniques to estimate the likelihood of bankruptcy in a sample of enterprises. In the early phases of bankruptcy prediction, Altman utilized discriminant analysis in 1968, a widely used method for model development (
Altman 1968). Following this, various bankruptcy prediction studies were encountered, each with unique models and factors in their quantity and variation.
Altman’s (
1968) original model is a five-factor multivariate discriminant analysis model, whereas
Jo et al.’s (
1997) model has 57 factors. In other models, the number of factors considered ranges from one to 57. Since then, creditors, tribunals, auditors, accountants, and researchers have all come to adopt the Z-score methodology (
Deakin 1972;
Edmister 1972;
Altman et al. 1977;
Laitinen 1991;
Grice and Ingram 2001). However, the multinormality hypothesis was ultimately refuted in favor of the hypothesis that explanatory variables have distinct distributions. In order to anticipate bankruptcy, the logit (
Ohlson 1980) and probit models were frequently used (
Zmijewski 1984).
In the 1990s, neural networks (
Lennox 1999) and the genetic algorithm (
Shin and Lee 2002) from the machine learning subfield of artificial intelligence were introduced. They generated compelling forecasting results without requiring statistical restrictions. Using data from 1985 to 2013,
Barboza et al. (
2017) compared the accuracy of five machine learning models for predicting bankruptcy to more established statistical methods (discriminant analysis and logistic regression). Comparing the new machine learning techniques to traditional ones significantly increased the accuracy of bankruptcy forecasts and provided greater precision than the statistical methods (
Aziz and Dar 2006).
The model and its financial ratios must be appropriately chosen to predict bankruptcy accurately (
Tang and Chi 2005). Statisticians have devised numerous techniques for selecting relevant predictor variables, such as principal components analysis (PCA), MDA, and the least absolute shrinkage and selection operator (LASSO) technique (
Pompe and Bilderbeek 2005). The initial list of explanatory variables may include up to 50 ratios derived from detailed information obtained from balance accounts and income statements. However, typically, only 5 to 10 ratios are chosen for the model (
Tian et al. 2015). Variable selection procedures may differ depending on the data used, such as annual or quarterly financial data or ratios averaging several years before the bankruptcy (
Fan and Li 2001). The effects of model accuracy during periods of economic decline have been studied, and bankruptcy prediction models for SMEs and publicly traded companies have been developed (
Du Jardin 2015). However, these models need more access to the necessary data of some businesses (
Karas and Režňáková 2014;
Ciampi 2015).
Shi and Li (
2019) show that logit and neural network models are the most popular and extensively researched methods for predicting bankruptcy.
Mai et al. (
2019) evaluated conventional learning machine models with convolutional neural networks on an extensive database of public corporations and discovered that the simplified models performed reliably.
Hosaka (
2019) discovered that convolutional neural networks provide more accurate predictions. However, there has yet to be an agreement on how to use convolutional neural networks to predict bankruptcy. In recent years, artificial intelligence algorithms and machine learning models have demonstrated promising results in predicting business failure without requiring statistical assumptions. Numerous researchers have compared the accuracy of traditional statistical models to machine learning techniques and discovered that machine learning techniques function more effectively. However, consensus on the most influential business failure prediction model is still needed. This paper seeks to investigate the existing models and techniques used to predict business failure and to determine the most effective approach.
Logistic regression has been recognized as a straightforward and comprehensible model that has demonstrated strong performance in the context of binary classification tasks (
Mood 2010). Nevertheless, it is worth noting that the model may encounter challenges in dealing with intricate non-linear relationships and can be influenced by the exclusion of factors, even if these variables are not directly related to the independent variables in the model. Random forests (RFs) have been demonstrated to be beneficial in managing high-dimensional data and large datasets while also exhibiting resilience against overfitting. Nevertheless, they compromise a certain degree of interpretability. The simplicity and efficiency of naive Bayes have been demonstrated, particularly in text classification.
Shetty et al. (
2022) conducted a comprehensive study comparing the bankruptcy prediction power of five machine learning models with traditional statistical techniques. Using North American firms’ data from 1985 to 2013, they found that machine-learning models outperformed discriminant analysis and logistic regression in accuracy. Their results demonstrated the potential of machine learning techniques in enhancing bankruptcy prediction.
Another study by
Kitowski et al. (
2022) focused on identifying symptoms of bankruptcy risk based on bankruptcy prediction models in Poland. They employed various machine learning techniques, including extreme gradient boosting (XGBoost), support vector machines (SVMs), and deep neural networks. By utilizing easily obtainable financial ratios, they achieved 82–83% global accuracy in predicting bankruptcies for Polish enterprises. Their model proved simple yet accurate, providing a user-friendly tool for discriminating between bankrupt and non-bankrupt firms. In the agricultural sector, they explored bankruptcy risk prediction to ensure the sustainable operation of agriculture companies. They applied different Z-score models and calculated bankruptcy probabilities on a sample of agricultural companies listed on the Belgrade Stock Exchange. Their research highlighted the importance of bankruptcy prediction in maintaining the sustainability of agricultural businesses.
Lombardo et al. (
2022) developed a dataset and benchmarks for bankruptcy prediction in the context of the American stock market. Their study focused on machine learning techniques and their application in predicting bankruptcy in the American stock market. They investigated the design and application of different machine learning models for estimating survival probabilities over time and default prediction using time-series accounting data. The dataset used in their experiments included 8262 different public companies listed on the American stock market between 1999 and 2018.
Furthermore,
Kainth and Wahlstrøm (
2021) investigated the impact of International Financial Reporting Standards (IFRS) on bankruptcy prediction for privately held Swedish and Norwegian companies. Their study examined the transparency promoted by IFRS and its influence on bankruptcy prediction.
Nevertheless, the method assumes naive independence among characteristics. Decision trees provide transparency and versatility (
Liang et al. 2016). Nevertheless, it is essential to acknowledge that these models are susceptible to overfitting and instability. The performance of machine learning algorithms, such as AdaBoost and GBT, was enhanced with the integration of weak learners, as demonstrated by
Bühlmann and Hothorn (
2007). Nevertheless, these models exhibit sensitivity to noisy data and necessitate hyperparameter adjustment.
3. Data Design and Methodology
The Pakistan Stock Exchange (PSX) provided the data for this investigation. The imperative to comprehend the nuanced fluctuations in the economic landscape is not only an exercise in intellectual curiosity but also a matter of practical necessity. This research delves into the financial health of firms by leveraging a dataset from the PSX spanning the years 2016 to 2021. This period was crucial, enabling us to discern patterns that indicate either an ascent or descent in the broader economic context of Pakistan.
For our sample constitution, rigorous criteria were indispensable. We began with a focus on non-financial firms with a continuous listing on the PSX, leading to the inclusion of 385 publicly traded entities. These companies, diverse in their economic sectors, were the bedrock of our analysis. Essential to our approach was the extraction of 36 financial ratios from their financial disclosures. These ratios, when integrated, functioned as the independent variables in our machine learning algorithms. Moreover, to uphold the integrity of our study, firms with ambiguous or incomplete financial data within the selected duration were systematically excluded.
Our methodological rigor was further enhanced using a paired sampling technique. This method entailed contrasting firms boasting positive cash flows or operational profits over five years with those manifesting a hostile trajectory. Such an approach was strategic, especially considering the overarching economic disturbances, notably the disruptions caused by the COVID-19 pandemic.
Guided by the pivotal work of
Piatt and Piatt (
2002), our study embraced a binary classification approach. A company’s financial vulnerability was characterized by its incapacity to address fiscal responsibilities, significantly when marred by negative operating income, which is often a precursor to bankruptcy or insolvency. These financial tribulations could emanate from internal oversights or shifting external market dynamics, such as regulatory changes, amplified competition, or other externalities. Based on our criteria, firms with a negative trajectory in net operating income and operating cash flows for three successive years were identified as financially unstable.
In widening our analytical lens,
Nehrebecka (
2021) guided us to consider scenarios influenced by external shocks. While insights were gleaned from the financial outlines of dominant market entities as of March 2020, our methodology consciously bypassed firms from sectors profoundly affected by the reverberations of COVID-19. This crisis was crucial to ensure our analysis centered on companies whose trajectories were more influenced by intrinsic determinants than sweeping externalities like the pandemic.
For a thorough investigation, we meticulously extracted 36 financial ratios from the financial statements of these companies. The ratios were categorized into six classes, each fulfilling a particular analytical objective.
The initial course, profitability measures (Class 1), comprises a set of eight measures specifically formulated to assess the profitability and operational effectiveness of the organization. The statistics encompass net profit margin, asset turnover, return on assets, financial leverage, return on equity, gross profit margin, operating return on assets, and return on capital employed.
In the second class (Class 2), liquidity ratios, the emphasis is placed on evaluating a corporation’s short-term financial well-being by examining three primary indicators: current ratio, quick ratio, and cash current liabilities ratio.
Cash flow ratios, specifically those discussed in (Class 3), encompass a collection of five ratios: cash flow from operations to sales, cash return on assets, cash return on equity, cash to income, and debt coverage ratio. These ratios offer valuable insights into the company’s cash flow management and capacity to maintain long-term financial stability.
Class 4, which focuses on activity ratios, encompasses a comprehensive set of eight ratios. These ratios include the inventory turnover ratio, number of days in inventory, receivables turnover ratio, number of days in receivables, payable turnover ratio, number of days in payable, working capital turnover, and cash conversion cycle. These measurements provide insights into the effectiveness of the company’s operational actions.
The fifth category (Class 5), valuation variables, encompasses seven variables essential for evaluating a company’s market and investment appeal. The ratios encompass the paid-up value of shares, market price per share, basic earnings per share, price–earnings ratio, dividend payout ratio, cash dividend per share, and book value per share.
Finally, Class 6 encompasses four fundamental solvency ratios: the debt equity ratio, debt-to-assets ratio, debt-to-capital ratio, and interest cover ratio. These ratios provide valuable insights into the company’s capacity to fulfil its long-term financial commitments.
The utilization of a systematic classification of financial ratios offers a methodical framework for assessing many aspects of firms’ financial performance and stability. This process serves as the fundamental basis for our comprehensive examination, facilitating the derivation of significant conclusions and insights from the collected data.
Ensuring that models are resilient and generalizable is paramount in the expansive realm of modelling. A meticulous methodology was employed in building a predictive model for discerning between bankrupt and non-bankrupt entities.
Central to our strategy was the k-fold cross-validation technique. This method subdivided the dataset into ‘k’ distinct subsets or ‘folds’. Each fold, in turn, was systematically designated for validation, with the model being trained on the remaining k − 1 folds. The rigorous iterative cycle was repeated k times, guaranteeing that every fold was used a validation set once. The culmination of these iterations was the computation of an aggregate performance metric, such as accuracy or F1-score, derived from the average across all the validation iterations. The advantage of this approach is its inclusivity: every data point is used both in a validation set once and in a training set k − 1 times. This comprehensive evaluation starkly contrasts the traditional train–test division, offering a broader and more nuanced assessment of model performance.
Our adherence to rigor continued. The selection of explanatory variables was executed with unparalleled precision, ensuring a foundation built on theoretical and empirical robustness. Critical variables were spotlighted by harnessing code capabilities to perform feature selection based on the relative mean differences between the bankrupt and non-bankrupt firms. This discernment was bolstered through Monte Carlo hypothesis testing, ensuring the statistical significance of the observed mean differences. Drawing inspiration from time-tested methodologies, such as the Altman Z-score, we included only specific independent variables in our model, aligning with the best practices from prior research.
Given the criticality of addressing overfitting, multiple strategies were employed. Regularization techniques, applicable to algorithms like logistic regression and SVMs, were integral in thwarting the development of overly intricate models. For decision trees, pruning was our tool of choice to reduce the model’s complexity. Ensemble methods like random forests and gradient boosting became our bulwark against overfitting, offering the strength of multiple base estimators.
Furthermore, a grid search and cross-validation fusion guided us to the most suitable hyperparameters. Such meticulous tuning was vital not just for model performance but also as a bulwark against overfitting. Iterative models, specifically gradient boosting, were endowed with early stopping; a mechanism to halt training once no further improvements in validation error were observed. Recognizing the importance of data volume, we endeavored to incorporate a rich dataset, and for model simplification, only the most pertinent features were retained.
A holistic analysis was conducted, with hyperparameter selection being a pivotal aspect. This endeavor allowed the model complexity to be for precisely calibrated against accuracy, ensuring impeccable tailoring to our specific objective. Our exploration was thorough, examining various hyperparameters across multiple machine learning algorithms. To further strengthen our model, techniques like Synthetic Minority Oversampling Technique (SMOTE) were used to address data imbalance issues, and PCA was employed for dimensionality reduction.
Overall, our commitment to a judicious approach, rooted in both empirical evidence and theoretical robustness, culminated in a predictive model of exceptional reliability, resilience, and relevance.
3.1. Support Vector Machine Model
Support Vector Machines (SVMs) are supervised machine learning algorithms used for classification analysis. SVMs function by locating the optimal hyperplane that distinguishes classes in a dataset. The goal of SVMs is to find a hyperplane that maximizes the margin between the two classes in a binary classification problem given a set of training data, where is the input vector and is the corresponding binary output label (+1 or −1). The margin separates the nearest data points for each class and the hyperplane.
The equation of a hyperplane in a SVM is given by:
where
w is a vector perpendicular to the hyperplane,
b is the bias term, and
x is the input vector. The distance between a point
x and the hyperplane is given by:
where the denominator is the norm of the vector
w.
SVMs are used in quadratic optimization problems to identify the best hyperplane. The objective function is given by:
subject to:
where
C regulates the trade-off between maximizing the margin and other factors and minimizing the classification.
is the slack variable that allows for some misclassification, and
is the decision function that divides the two classes.
Lagrange multipliers can be used to solve the optimization problem, and the solution can be described in terms of the support vectors, which are the data points that lie closest to the hyperplane. One possible way to express the decision function is as follows:
where
are the Lagrange multipliers,
is the kernel function that maps the input vectors to a higher-dimensional feature space, and
sgn is the sign function that returns +1 or −1 depending on the sign of the argument. This function transfers the input vectors to a higher-dimensional feature space.
SVMs excel in high-dimensional spaces and are effective in datasets with abundant features, but they have limitations that need to be considered. Their training time increases significantly with larger datasets, and they do not provide direct probability estimates. The choice of the kernel function is also critical and requires expertise in the specific domain. Researchers and practitioners should carefully evaluate these factors when using SVMs in their applications.
3.2. Logistic Regression Model
Logistic regression is renowned for its unique capability to offer a transparent probabilistic interpretation of its outputs, enabling straightforward adjustments of decision thresholds. Its design inherently incorporates regularization techniques, which serve as a protective measure against overfitting. Moreover, logistic regression is adaptable when integrating new data, mainly through techniques like stochastic gradient descent. However, its limitation lies in assuming a linear decision boundary, rendering it unsuitable for handling non-linear complexities. This linear constraint often results in inferior performance compared to more advanced algorithms that handle intricate patterns.
Logistic regression (LR) a practical tool for predicting a company’s financial failure using binary data. It estimates the likelihood of an outcome using one or more prediction factors. Bankruptcy prediction uses financial ratios or other criteria to predict bankruptcy. LR uses a logistic function to convert the linear combination of predictor variables into an outcome probability.
Logistic functions are S-shaped curves that reflect event probability from 0 to 1. The logistic equation is as follows:
where
is the likelihood that a bankruptcy will occur,
z is the linear combination of predictor variables, and
e is the base of the natural logarithm.
An expression for the linear combination of predictor variables is:
where
is the intercept and
,
, …,
are the coefficients of the predictor variables
,
, …,
.
After training, the model can predict firm bankruptcy based on financial measures and other indicators. A threshold probability can predict a company’s bankruptcy. If the likelihood of bankruptcy exceeds 0.5, the firm will likely fail. The threshold can be changed to balance false positives and negatives.
3.3. Random Forest Model
Random forests are highly regarded for their versatility and ability to handle large datasets with high dimensionality effectively. One of their notable strengths is their robustness in managing missing values, ensuring that accurate predictions can still be made despite significant data gaps. However, these advantages come with inevitable trade-offs. The complex structure of the random forest model can result in slower evaluation speeds, which may be a consideration in time-sensitive applications. Additionally, while random forests are generally adaptable, there is a risk of overfitting when dealing with particularly noisy datasets. It is essential to carefully consider these factors when utilizing random forests in practical applications.
Random forest (RF) is a machine learning approach that may be utilized for classification and regression problems. It is a type of strategy known as an ensemble that builds several different decision trees and then adds up all their predictions to produce a single result.
Given below is a representation of the statistical equation for the RF model:
for each split node
j.
3.4. Naive Bayes Model
The naive Bayes classifier is lauded for its computational efficiency and straightforwardness, enabling effective parameter estimations even with limited training data and demonstrating aptitude in multi-class prediction scenarios. However, its foundational presumption of feature independence often misaligns with real-world complexities, potentially compromising its predictive accuracy. Furthermore, the model’s propensity to assign a zero probability to previously unobserved categories during testing presents a noteworthy limitation in dynamic contexts.
The naive Bayes (NB) classifier is a probabilistic algorithm that employs Bayes’ theorem to forecast the probability of a specific event based on prior knowledge of the conditions connected to that event. This probability prediction is accomplished using Bayes’ theorem to analyze the conditions associated with the event. In the context of bankruptcy prediction, NB can compute the probability that a firm will declare bankruptcy based on its financial ratios. This can be done by comparing the company in question to its peers.
The following statistical equations are utilized when applying the NB method:
where
Y represents the class variable (“bankrupt” or “non-bankrupt”),
X represents the feature vector (“financial ratios”),
P(
Y|
X) represents the probability of
Y given
X,
P(
X|
Y) denotes the likelihood of
X given
Y,
P(
Y) embodies the prior probability of
Y, and
P(
X) characterizes the prior probability of
X.
3.5. Decision Tree Model
Decision trees are esteemed for their transparent structure, enabling lucid visualization and interpretation of the data-driven decision-making process. Their inherent versatility allows for nominal data preprocessing, adeptly managing a mix of numerical and categorical variables. Nonetheless, these models display a proclivity for overfitting in the absence of judicious tuning, mainly when training on constrained datasets. Their sensitivity to minuscule data perturbations can manifest in pronounced structural divergences, and empirically, their predictive prowess can be eclipsed by more sophisticated algorithms.
The decision tree (DT) model is a well-known approach in the field of machine learning that may be applied to problems involving classification and regression. The decision tree approach can be used in the context of bankruptcy prediction to classify enterprises as either bankrupt or not bankrupt, depending on the values of some predictor criteria. The decision tree determines this classification. The decision tree algorithm is based on recursively splitting the data based on the predictor variables to generate a decision tree-like structure that predicts the outcome variable. The core principle behind the algorithm is described in the next paragraph.
The equation that is used to train the decision tree model in the manner described below is as follows:
where
h(
x) is the model’s prediction for data point
x,
T represents the decision tree structure, and
θ encompasses the parameters, including the thresholds at each node and the chosen feature for each split. Each node might represent a specific financial indicator for bankruptcy prediction, such as the liquidity ratio, debt ratio, or profit margin. The thresholds at each node are optimized to discern potential bankruptcies. For instance, a node might inquire if the liquidity ratio is below a specific critical value, directing firms with lower liquidity to a branch as more indicative of bankruptcy. The leaf nodes represent the final predictions (either ‘bankrupt’ or ‘solvent’).
3.6. Adaptive Boosting Model
The AdaBoost algorithm is distinguished by its adeptness at delineating complex decision boundaries, stemming from its capacity to amalgamate multiple weak predictors into a potent predictive ensemble, inherently resisting overfitting. Nevertheless, its susceptibility to noisy data and anomalies presents potential pitfalls in accuracy. Furthermore, achieving optimal performance necessitates rigorous hyper-parameter tuning, potentially elongating the model’s training duration.
Adaptive boosting (AdaBoost) is a boosting algorithm that combines numerous weak learners into one powerful learner. In AdaBoost, weak learners are often decision trees that only have one possible branch, and these trees are referred to as decision stumps. This approach functions by repeatedly training weak learners on the dataset, primarily focusing on the examples of misclassification made by earlier iterations of weak learners. The result is a weighted total of the weak learners, each given a weight based on their performance in the previous tests. The AdaBoost method is a robust one that has been demonstrated to be successful in a wide variety of different situations.
Training the AdaBoost model can be accomplished using the following equation:
For bankruptcy prediction, the sign will determine whether a firm is predicted to go bankrupt (negative) or not (positive).
3.7. Gradient Boosting Model
Gradient boosting machines (GBMs) are heralded in the machine learning domain for their exemplary precision across diverse applications. Exhibiting profound adaptability, they seamlessly accommodate an assortment of predictor variables and facilitate customization concerning various loss functions. Nonetheless, GBMs are full of challenges. A pertinent concern is their predisposition towards overfitting, particularly in the absence of judicious hyper-parameter optimization. Furthermore, the training phase, characterized by its sequential nature, can be computationally onerous. Additionally, data noise can compromise the model’s efficacy in some scenarios. It is imperative to recognize that these general observations on GBMs’ strengths and potential pitfalls should be contextualized within any given application’s specifics and associated dataset.
The gradient boosting (GB) algorithm is an example of an ensemble learning algorithm. It takes several weak learners and combines them into a single powerful learner. It constructs the model in stages, each consisting of the following steps: first, a weak learner is trained to minimize the loss function using the gradient descent method; next, the model is updated by adding this weak learner; and finally, the model is evaluated. The procedure is repeated iteratively, with each consecutive learner concentrating on fixing the mistakes committed by the prior learner.
The gradient boosting model should be trained using the equation below:
Here, hj(x) denotes the weak learner, and γj represents the associated weight. This equation underscores the cumulative nature of GB, where each component learner contributes to the overarching predictive model. Given the volatility and dynamics of Pakistan’s corporate sector, utilizing GB’s strengths could offer more precise insights into impending bankruptcies, aiding stakeholders in preemptive decision-making.
5. Discussion
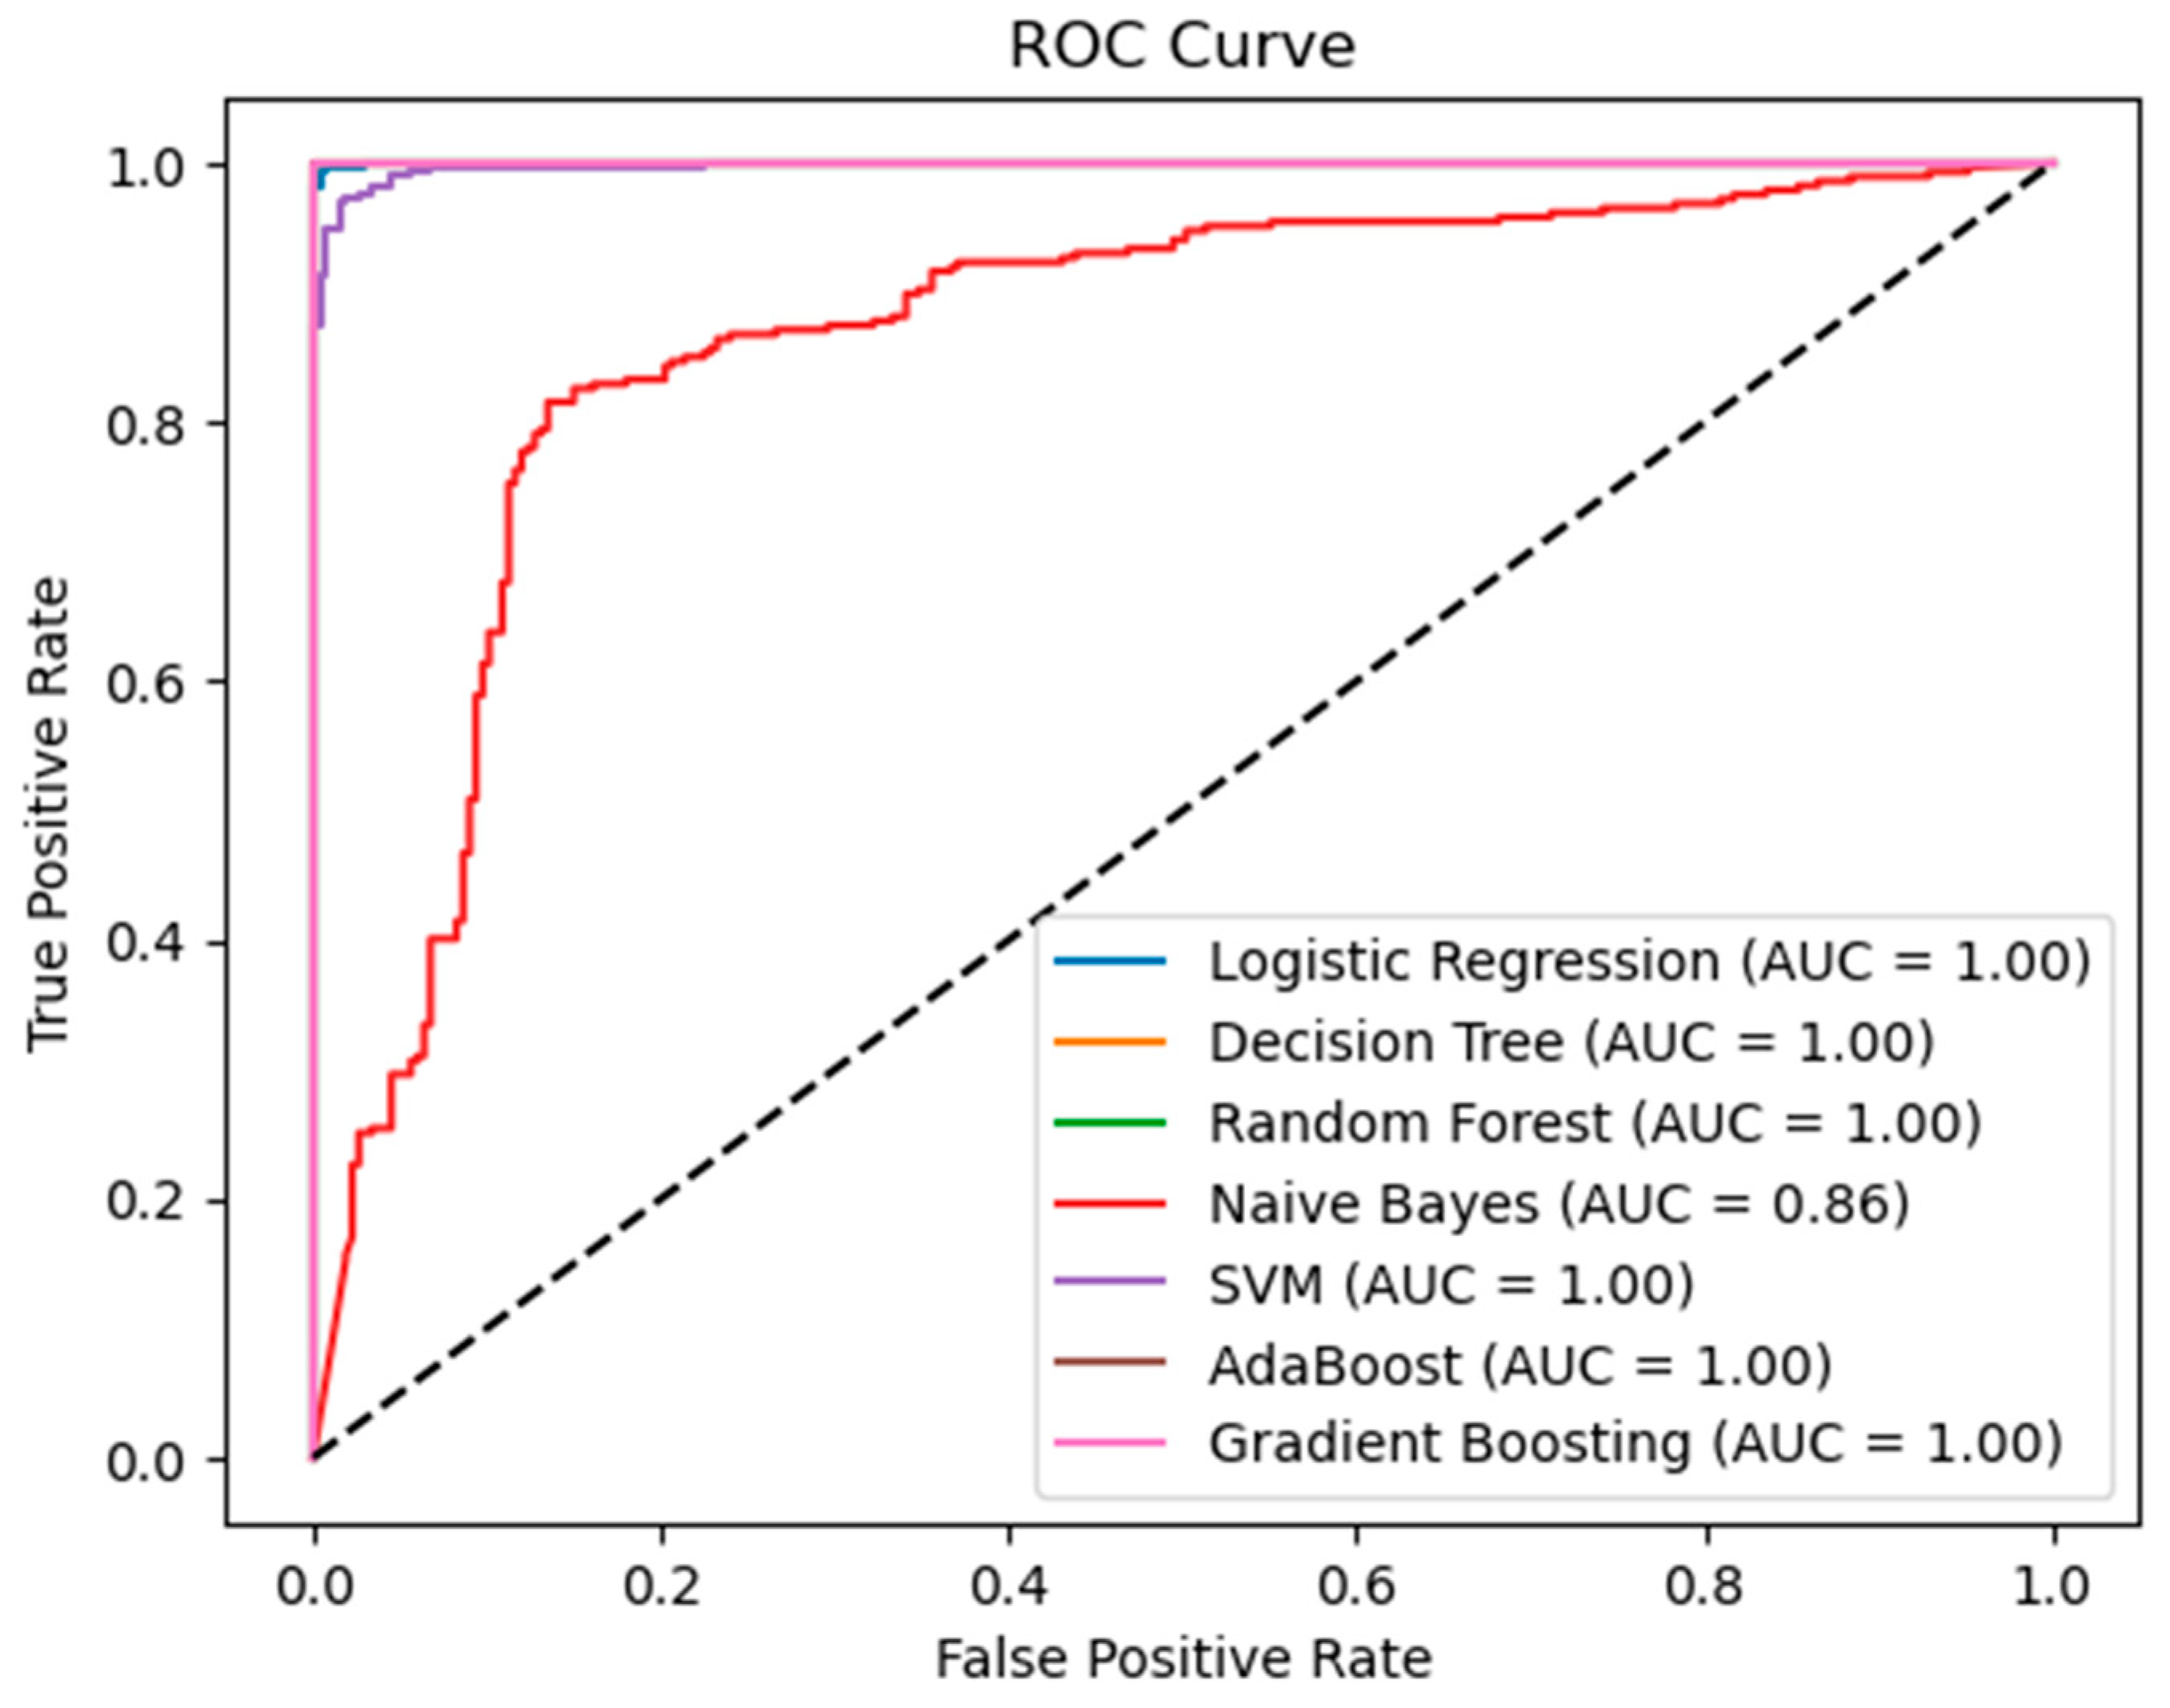
This study offers a comprehensive evaluation of several machine learning models for bankruptcy prediction, and the outcomes garnered pave the way for profound insights. The results of this study involved consistently high levels of accuracy across models, elucidating their potential for effective bankruptcy prediction. Distinctly, the decision tree, AdaBoost, and gradient boosting classifiers reached an impressive pinnacle, with an accuracy of 100%. Such a feat emphasizes their robustness and sets a benchmark for future studies in similar domains.
While these models achieved perfect accuracy, the SVM and logistic regression models also garnered commendable results. Their accuracy fluctuated between 89% and 99%, depending on the feature count employed. It is noteworthy that as the number of features increased, the accuracy of these models tended to edge closer to perfection. This trend underscores the pivotal role of feature selection, corroborating earlier findings by
Shetty et al. (
2022) that advocate for the judicious choice of features to optimize model performance.
In stark contrast, though consistent across different feature counts, the naive Bayes model’s performance remained suboptimal compared to its counterparts. Its accuracy, ranging from 58% to 70%, raises questions regarding its suitability for such datasets, emphasizing the need for further exploration. However, it is imperative to note that the high recall scores for the naive Bayes model suggest its strength in identifying bankrupt enterprises, even if its overall accuracy is less.
Comparatively, traditional models like Altman’s Z-Score and Taffler’s models have been widely recognized in the financial realm (
Altman 1968). For instance, Altman’s model demonstrated an 82–94% accuracy rate. However, our study reveals that specific machine learning models can surpass even these commendable benchmarks. One primary distinction between the two approaches is their adaptability. Due to their inherent design, machine learning models are inherently adaptable to changing financial landscapes. In contrast, while transparent and interpretable, traditional models like the Z-Score model possess fixed characters and require periodic modifications, as evidenced by Altman’s subsequent revisions.
Our study bridges the gap between theory and practice, drawing from empirical results to provide stakeholders with actionable insights. The high accuracy rates, especially among models like decision trees, AdaBoost, and gradient boosting, signify not only the potential of these tools for reliable bankruptcy prediction but also emphasize the importance of machine learning in contemporary financial forecasting. Furthermore, juxtaposed against traditional models, our findings underscore the evolving nature of bankruptcy prediction tools and the need for continuous innovation in this domain.
Conclusively, while the tested models demonstrated a promising avenue for bankruptcy prediction, it is vital to approach their deployment with a nuanced understanding of their strengths and limitations. Further research, building upon our findings, can aid in honing these tools for even more precise predictions in the dynamic landscape of Pakistani enterprises.
6. Conclusions
This study aimed to evaluate Pakistani enterprises using machine learning techniques to predict their financial difficulties and likelihood of bankruptcy. The results of this study indicate that several financial ratios, such as return on assets, operating return on assets, debt coverage ratio, asset turnover, earnings per share, debt-to-assets ratio, Cash return on assets, and quick ratio, can be used to predict whether or not a company will file for bankruptcy.
Overall, this study on bankruptcy prediction using machine learning techniques and financial ratios has the potential to contribute to the field of financial risk management by improving risk assessment, serving as an early warning system, enhancing risk management practices, informing regulatory considerations, and inspiring future research and innovation.
According to the empirical evidence supporting the study, financial ratios can be used to predict insolvency in Pakistani enterprises. The machine learning models’ results show the best options for predicting financial distress and insolvency in Pakistani enterprises. This study also underlines the need to use financial indicators to predict bankruptcy, which can help financial analysts, investors, and regulators make more informed decisions.
The results of these models are essential to financial analysts, investors, and stakeholders who want accurate bankruptcy predictions. The decision tree, AdaBoost, and gradient boosting models performed well, obtaining a 100% accuracy. The SVM and logistic regression models showed exceptional flexibility in feature selection settings, with 89 to 99% accuracy rates depending on the selected characteristics. The Naive Bayes model performed poorly, with 58% to 70% accuracy. However, its utility for specific feature sets must be considered. These models’ high precision, recall, and F1-measure scores show their ability to distinguish bankrupt from non-bankrupt enterprises, making them useful for industry experts who need accurate and fast bankruptcy identification.
The results of this study may have significant effects on Pakistan’s non-financial sector. Policymakers and regulatory authorities may find the study’s insights helpful in creating and working to achieve effective frameworks and laws to reduce systemic risks in the financial sector. By identifying the financial ratios that contribute to bankruptcy prediction, regulators can establish thresholds or guidelines for monitoring the financial health of companies and enforcing appropriate measures when necessary. Financial institutions can utilize bankruptcy prediction models to proactively manage their exposure to potentially risky borrowers, leading to a more resilient banking system. Additionally, businesses can use these findings to monitor their financial health and make the required modifications to prevent financial bankruptcy. This study also emphasizes the value of applying machine learning techniques to bankruptcy forecasting, which can help to increase prediction accuracy and lower the risks associated with financial investments.
Future studies may need to be revised to select and implement machine learning algorithms used in the comparative analysis. The choice of algorithms may influence the performance and outcomes of the bankruptcy prediction models. The models’ efficacies and capacities to forecast bankruptcy in Pakistani enterprises may be constrained by biases in the data utilized for training and evaluation. The findings and conclusions of this study may be specific to the context of Pakistani companies, limiting their generalizability to other regions or industries.


