Article

ECLIPSE: Holistic AI System for Preparing Insurer Policy Data

Guy Carpenter, 1166 6th Ave, New York, NY 10036, USA
*
Authors to whom correspondence should be addressed.
These authors contributed equally to this work.
Submission received: 22 September 2022 / Revised: 3 December 2022 / Accepted: 5 December 2022 / Published: 21 December 2022
(This article belongs to the Special Issue Data Science in Insurance)

Abstract

:
Reinsurers possess high volumes of policy listings data from insurers, which they use to provide insurers with analytical insights and modeling that guide reinsurance treaties. These insurers often act on the same data for their own internal modeling and analytics needs. The problem is this data is messy and needs significant preparation in order to extract meaningful insights. Traditionally, this has required intensive manual labor from actuaries. However, a host of modern AI techniques and ML system architectures introduced in the past decade can be applied to the problem of insurance data preparation. In this paper, we explore a novel application of AI/ML on policy listings data that poses its own unique challenges, by outlining the holistic AI-based platform we developed, ECLIPSE (Elegant Cleaning and Labeling of Insurance Policies while Standardizing Entities). With ECLIPSE, actuaries not only save time on data preparation but can build more effective loss models and provide crisper insights.

1. Introduction

The main objective of this paper is to outline a new standard for data preparation on insurance policy listings, namely ECLIPSE. The main problem ECLIPSE addresses is that actuaries within insurance and reinsurance companies spend a lot of time cleaning dirty data, often spending more time on this data preparation and cleaning than on modeling and insight generation. To address this problem, we explore and answer several research questions: What are the key components of data preparation for policy listings? What are the most important data properties of policy listings across insurance lines? How can we leverage both the specialized domain of the datasets and modern AI algorithms/tools to improve existing processes for each data preparation component? What are important KPIs to measure improvements in the data preparation process, and can we quantify how much we advance the state-of-the-art? Finally, we explore how ECLIPSE can be generalized to datasets beyond policy listings, and other future directions of improvement.
Machine learning AI is often applied in data preparation systems. First, Sawarkar and Kodati (2021) of IBM explore using data science techniques of word embeddings and entity resolution for schema standardization. This paper expands on schema standardization data science by exploring the application of ensembles of ML-driven algorithms and the related human-in-the-loop workflows/systems. Second, the paper expands on entity resolution, used not only for schema standardization but generally to identify/standardize entities represented in various formats. A survey on entity resolution is presented by Papadakis et al. (2020), where the authors identify common blocking techniques and similarity functions. The research on entity resolution started in the 1950s and disparate methods have been proposed, summarized by Vidhya and Geetha (2019). Though some latest methods combine modern machine learning techniques such as semi-supervised learning and the Expectation-Maximization algorithm, it is hard to find a state-of-the-art (henceforth SOTA) model that outperforms in most areas due to the nature of the underlying entity. In addition, many entity resolution models, despite their technical soundness, are computationally infeasible for all practical purposes, especially for a system that continuously receives new data and must provide entity resolution results in a timely manner. This paper, by applying specifically to the insured companies within insurance policies, establishes novel and practical techniques that build upon the established fundamentals. Next, labeling is a critical step in data preparation, where ML is often used: Stanford researchers present the Snorkel system in Ratner et al. (2017), which is an ML system widely used to auto-label records. Finally, applying AI systems to data preparation means venturing into MLOps (Machine Learning Operations), a novel discipline bringing systematic rigor to ML systems. Symeonidis et al. (2022) provide an excellent overview of MLOps and their challenges, which we address in our application system.
Next, application papers in insurance seem more focused on modeling. A few papers that prepare insurance data focus on imputation (such as Euller et al. (1997)), which is only one aspect of data cleaning. This paper approaches data preparation in insurance policies more holistically.
Insurance policy data poses unique data quality challenges, depending on the data preparation task at hand. We will start with entity resolution. While ECLIPSE focuses on policy data where insured entities are mostly companies, even company data is inconsistently formatted across clients and business lines. In order to build better loss models, actuaries often need to aggregate policies on the same insured company. For example, computing the aggregate premium on Directors and Officers (D&O) policies underwritten by Walmart or by Google can be an important data point in exposure-based loss projections. That means entity resolving insured companies, in order to know a policy on Alphabet and Google, for instance, refer to the same company. Sometimes, the insured companies within policy data have only names, other times they include partial or full address identifiers (such as country, city, state, zip, and street), and other times they may include other attributes such as revenue or North American Industry Classification System (NAICS) codes. When resolving company data, there are often complete disagreements in one or many of these fields, thus requiring not only a methodology to match, but a methodology to choose the source of truth. Matching is also challenging because corporation entities may have branches, and may have large variations in fields such as name and address. These variations include (1) having just the names of people and city names for professional service firms such as law LLPs, (2) out-of-date aliases, (3) companies encoded with multiple possible names and addresses, (4) spelling errors, (5) uncommon abbreviations, and more. Finally, addressing these challenges has to be conducted in a computationally efficient manner, which is yet another challenge in itself.
To address these challenges and aggregate insured entities for policies, we developed a rule-based, pairwise corporation entity resolution framework PIERCE: Performant, Intelligent Entity Resolution for Corporation Entities. We licensed corporation listing data across the globe from vendors such as Dun and Bradstreet, which contain entity name, address, revenue, industry code, and corporation structure, which serves as our source of truth. After receiving insured corporation entity information from clients, we will conduct entity resolution to fuzzy match these entities to the standard entities in the corporation listing. Once a match is identified, we can impute the information from the corporation listing to augment corporation information and resolve duplicated entities with nuances.
Second, policy data comes in different formats from different insurers. While some industry standards exist for subsets of insurance data, different insurers still store and transmit data in inconsistent schemas. For policy listings, also known as exposures, Open Data Standards (2020) focuses mostly on insured properties. This means insurers are still lacking a standard industry data schema, which enhances the problem of inconsistent schemas. This problem can also be solved by entity resolving the column names of the schema but poses unique challenges. We must rely on fewer training data points, and more idiosyncratic and egregious variations and aliases. To address this, we have designed a separate schema resolution algorithm.
Third, policy data is a constantly incoming stream, with policies always being underwritten by insurers. The new policy data may feature novel data patterns, even from the same insurer. This requires a robust set of validations and a system to confirm and edit incoming data streams. Fourth, while automated systems can clean and prepare schemas and standardize insured entities/addresses, they may not be 100% accurate themselves. There are tradeoffs to evaluate here, and a need for a human-in-the-loop. To address this, we have designed a labeling framework and MLOps user interface.
These challenges and lack of definitive work on holistic AI systems for data preparation in insurance, and specifically policy listings data, as well as the significant impact on the workstreams of actuaries, present an opportunity to improve and advance the industry. ECLIPSE advances state-of-the-art by addressing these challenges and leveraging modern AI and MLOps systems techniques. To summarize, it consists of:
  • PIERCE: Performant, Intelligent Entity Resolution for Corporation Entities;
  • Schema Standardization;
  • Interactive Validation Resolution;
  • Intuitive User Interface for Human Labeling and Interactions with the MLOps System.
Future work can extend on these AI systems to further automate data preparation in new insurance lines, data standards, and entities. For example, the company resolution framework can be generalized into broader entity resolution, to de-duplicate and augment other insured entities or objects. Similarly, more ML models can be created to facilitate correcting other validation issues.

2. Results

PIERCE outperforms other popular entity resolution frameworks run on corporation entities when it comes to match rate, precision, and resolve time. As a rule-based entity resolution framework, PIERCE is flexible with adjustable thresholds and methods, and especially when compared with black box entity resolution models, can be easily modified to include or exclude certain types of matches identified in production. This provides us with a human comprehensible process and lays a good foundation for future improvements.
After comparing to traditional schema standardization methods such as the edit distance method (based on Levenshtein (1966)) and existing labeling frameworks such as Snorkel, our schema standardization model has significant advantages in performance, especially in the accuracy of low-frequency classes. Currently, many tools provide MLOps deployment solutions such as Seldon Core, BentoML, Tensorflow Serving, and more, as evidenced in the MLOps survey presented by Kreuzberger et al. (2022). In production, we choose MLFlow, as it is an open-source tool that can be more easily adopted and is more flexible for the customizations outlined. By designing the whole pipeline of schema standardization, interactive validation resolution, and intuitive user interfaces within our MLOps system, we provide a complete solution to insurance data ingestion and preparation with strong self-improvement capabilities.

3. Materials and Methods

3.1. Data Properties and Cleaning Rules

This section summarizes the properties of insurer policy data, that lead to the data quality variations we touched on. The section also outlines any initial cleaning rules or algorithms to address these issues straight away.

3.1.1. Schema Properties and Initial Cleaning

Policy listings data coming from different insurance companies and systems will have different column names, and the variations are summarized in the following examples in Table 1:
  • Redundant words: some variations may contain redundant words compared to the standard column names.
  • Omitted words: some variations may omit some words in standard column names, and only keep important keywords.
  • Abbreviation: some variations consist of acronyms and abbreviations.
  • Misspelling: because the data collection always involves manual work, misspellings could happen.
  • Little text similarity: some variants are hard to distinguish if evaluated by text similarity.
If matching the columns manually, it could be time-consuming and labor-intensive; if using rule-based models, the rule-making process could be cumbersome and the result may not be flexible enough. In this situation, ML models provide a practical solution to string enumeration standardization as a multi-class classification problem.
All the special characters should be removed except some characters with actual semantic meanings such as “$” and “#”. The words should be split based on characters such as dash, underscore, space, or camel case, and transferred to lowercases as an initial cleaning process.

3.1.2. Insured Company-Related Properties and Initial Cleaning

Name, country, state, city, postal code, and street address are properties captured for the company entity from clients. A series of cleaning steps are implemented to standardize these properties to improve the data quality and performance of the entity resolution model.
The company name is a mandatory input for PIERCE. Popular text similarity distance functions such as Levenshtein distance evaluate the similarity on character level, which are sensitive to letter case and the presence of special characters. The following steps are conducted sequentially for text standardization.
  • Convert company name to lowercase;
  • Remove null value placeholder such as “nan”, “none”, “null”;
  • Remove characters in brackets;
  • Remove special characters, but some special characters such as “;” will be kept;
  • Replace multiple whitespaces with single whitespace;
  • Replace company type with its standard abbreviation. For example
    • “comp”, “company” to “co”;
    • “société anonyme” to “sa”.
In some cases as shown in Table 2, multiple company names are composite in one string with delimiters such as “;”, “doing business as” or “formerly known as”. Composite company names are split by these delimiters and then exploded into multiple rows of split expressions (including the original composite format). The entity is matched if one expression is matched. The example can be found in Table 3.
The country is the only mandatory address property for PIERCE, while state, city, postal code, and street address are optional. A series of text standardizations are implemented to standardize company addresses. Table 4 shows an example for address cleaning.
  • Country may be presented in a full or abbreviated format and may be misspelled. A Python package “pycountry” is utilized to fuzzy match country to ISO 3166-1 alpha-2 format;
  • State is lowercased and mapped to its standard abbreviation;
  • City is lowercased;
  • Postal code is truncated if extension digits are provided, and padded to standard digit length if leading 0 s are missing;
  • Street address
    • Convert street address to lowercase;
    • Remove special characters;
    • Replace multiple whitespaces with single whitespace;
    • Map street type to abbreviations, for example
      -
      “aven”, “avenu”, “avenue” to “ave”;
      -
      “boul”, “boulevard”, “boulv” to “blvd”.
Company address properties may come in composite format, where only the street address is provided and the other address properties are null. A Python package “usaddress” is used to parse composite US addresses. For international addresses and addresses with missing properties, we run a geocoder to acquire coordinates, impute missing properties, and further standardize international addresses.

3.2. PIERCE Algorithm Outline

Company properties such as revenue and industry are of critical importance in risk analysis. However, data quality issues such as missing and wrong properties remain a formidable challenge. Many insurance models require company information such as industry code and revenue as mandatory input, which is usually not provided directly by clients. Company entities may also have branches and variations in name and address, which constitute big problems in recognizing the same entity and risk aggregation.
This becomes an excessive challenge as we receive insurance data from clients with varied data quality. To solve this, we license corporation listing data across the globe from vendors, which contain entity names, address properties, revenue, industry code, and company structure. After receiving insured company entity information from clients, we will run entity resolution to fuzzy match these entities to the standard entities in the corporation listing. Once a match is identified, we can impute the information from the corporation listing to augment client data and resolve duplicated entities with nuances.
We want to integrate an accurate, efficient, and robust entity resolution model in the system; hence, we developed a rule-based, pairwise company entity resolution framework PIERCE.
PIERCE takes query data, reference data, and configuration as the input, and utilizes company name and address properties to find the most similar match in reference data. Query data and reference data contain corporation information from clients and corporation listings, and the configuration includes parameters and thresholds that control the process of PIERCE.
PIERCE consists of three major steps. The cleaning step standardizes the company name and address for better comparability. The blocking step selects a plausible subset from the reference data for each entity in query data. The matching step evaluates the pairwise similarity and decides the best match.
Entity resolution is a computation and memory intensive task, and the corporation listing data contains hundreds of millions of rows. PIERCE is developed with a distributed computation framework PySpark Chen et al. (2018), and deployed on the cloud to leverage extendable computation resources Chen et al. (2018).

3.2.1. Blocking Rules

PIERCE is a pairwise entity resolution model, which requires a blocking data frame of candidate entity pairs to evaluate. A naive method is to conduct a pairwise comparison between each entity in query and reference data, and the time complexity is O(m·n), where m and n represent the number of entities in query and reference data. Though it helps to reduce the loss of potential matches overlooked in the blocking step, it is unnecessary since the majority of matches evaluated are irrelevant, and it will generate a large blocking data frame that crashes the computer memory and the computation will never be finished. To increase the efficiency while keeping the most plausible matches under evaluation, PIERCE applies a series of rule-based blocking methods based on the similarity of company name and address.
Two versions of further cleaned company names are used in blocking and matching to exclude uninformative characters. Company name core removes company abbreviations and high-frequency words. Company name filtered removes company abbreviation and single characters. An example can be found in Table 5.
The sorted initial blocking method blocks entities with the same sorted initials of the company name core. The sorted initials are the initials of the company name core sorted in alphabetic order. For example, the sorted initials are “jr” for “joe richard”. This method performs well against edge cases where the company name is misspelled but the first character of each word is correct, or the words are presented in a different order. However, this method has to be combined with address blocking, because it may result in a very large blocking data frame that contains every pair of entities with the same sorted initials when used alone. Table 6 shows an example of sorted initial blocking method.
The bag-of-words blocking method blocks entities with at least one mutual word in the company name core. The company name core is first split into an array of words, and an intersect operation is conducted to decide if a pair of company names have any mutual word. This method works well when one company name has additional or different words, especially when the company name in reference data is a company, while the name of the policyholder is the business owner; an example can be found in Table 7. This method also has to be paired with address blocking to avoid large blocking data frames.
The identical company name blocking method blocks entity pairs with identical company names filtered in the same country.
TF-IDF blocking method first decides a list of unique words in the company name above given the TF-IDF threshold in each country and then blocks entities with the same unique words in the same country. This method performs well when the company name contains a unique word (usually a brand name) but their company names and addresses differ a lot.
PIERCE uses country, state, city, and postal code for address blocking.
The hierarchical address blocking method blocks entity pairs based on most granular address properties provided except the street address. This method is used together with the Sorted Initials or Bag-of-words method to decide the blocking. The steps are:
  • If postal code is provided, block entity pairs with same first three digits of postal code;
  • Otherwise, if city is provided, block entity pairs with same city;
  • Otherwise, if state is provided, block entity pairs with same state.
The identical address blocking method blocks entity pairs if they have an identical country, state, city, postal code, and street address. This method is robust in the case where the company name significantly differs while the company address is identical.

3.2.2. Similarity Algorithm

The match is decided by evaluating the similarity of each pair of entities in the blocking data frame. Several distance functions are implemented to categorize the similarity of the company name and address as a good, similar, or bad match, respectively, based on thresholds. The final matches are selected from the nine categories specified in the PIERCE configuration, which reflects the user’s preference on the trade-off between match rate and precision. This method allows the algorithm to evaluate the similarity with different methods independently and mimics human logic in deciding matches. Tge default match configuration is shown in Table 8.
Company name Levenshtein distance measures the distance between two company name cores by counting the minimum number of single-character edits, including insertions, deletions, or substitutions, to convert one to the other. Because company names have various numbers of characters, and thus, it is hard to find a single threshold, the distance is further normalized by being divided by the longer character length of company names. The distance performs well when the company name is misspelled or contains additional short characters. The company name is a good match if the normalized Levenshtein distance is lower than 0.15, a similar match if the normalized distance is lower than 0.3, bad match otherwise.
N o r m a l i z e d L e v e n s h t e i n D i s t a n c e = l e v ( a , b ) M a x ( | a | , | b | ) ,
where a and b denote the two strings, and |a| denotes the length of string a.
For example in Table 9, for two company name cores with whitespace removed “joewrichard” and “joerichad”, the normalized Levenshtein distance is calculated with the following steps.
The company name Jaccard distance measures the similarity between two company names by counting the number of mutual words and then normalizes the similarity by dividing it by the larger number of words in each name. This method is robust against company names with various orders and is sensitive to misspellings. The company name is a good match if the normalized Jaccard distance is lower than 0.2, a similar match if the normalized distance is lower than 0.9, bad match otherwise.
N o r m a l i z e d J a c c a r d D i s t a n c e = 1 | A B | | A B | ,
where A and B denote the words in string a and b, and |A| denotes the number of words in string a.For example in Table 10, for two company names filtered “joe richard” and “richard”, the normalized Jaccard distance is calculated with the following steps.
Company address may still vary after cleaning. Heuristic rule distance measures the similarity between company addresses based on a series of steps.
  • Good match if addresses are identical;
  • Similar match if one of the conditions is satisfied
    • House numbers are same and normalized Levenshtein distance of other part of street address is smaller than 0.6;
    • Distance of house numbers is smaller than 30 and Levenshtein distance of other part of street address is smaller than 4;
    • Bag-of-words distance of street address is 0.
  • Bad match otherwise.
Coordinate distance measures the distance between two company addresses by calculating the distance of coordinates resolved by the geocoder. This method only applies to entities with complete addresses provided.

3.2.3. Evaluation Methodology

A desirable entity resolution model in our system would quickly make as many matches as possible with sufficient confidence. Therefore, we use three metrics—match rate, precision, and resolve time— to measure the model performance. The model performance is subject to query data, reference data, and configuration. Usually, the model performs better on US entities and all address properties provided. Users can customize the matching criterion by adjusting the thresholds in the configuration. The metrics are reported from experiments with our client data and corporation listing data.
The match rate measures the model’s capability of finding matches, which is calculated by the number of entities resolved over the number of entities queried. This metric can be easily calculated when the entity resolution is finished. The match rate is impacted by the quality of query data, completeness of reference data, and thresholds in configuration. The emperical match rates by different types of entity are shown in Table 11.
M a t c h R a t e = N R e s o l v e d N Q u e r i e d ,
Precision measures the probability of an entity being correctly resolved, which is calculated by the number of entities correctly resolved over the number of entities resolved. To obtain this metric, a sample of resolved entities needs to be manually inspected. There is a trade-off between match rate and precision. When the model uses a rigorous threshold to decide the match, the match rate tends to be lower and precision higher, and vice versa. The emperical match rates by different types of entity are shown in Table 12.
P r e c i s i o n = N C o r r e c t l y R e s o l v e d N R e s o l v e d ,
Resolve time measures the model’s efficiency to finish an entity resolution job. Resolve time is dependent on the number of entities in the query and reference data, completeness of address, computation resource, and blocking and evaluation methods enabled. The metrics are reported on resolving client data with corporation listing data, containing 552 million entities, on a cluster with 32 CPU cores and 256 GB memory. With given reference data, the resolve time scale linearly to the size of query data with an intercept, because the algorithm will inevitably scan the full reference data, which consumes constant time regardless of the size of query data. The resolve time by number of entities in query data is shown in Table 13.

3.3. Schema Matching Algorithm Outline

3.3.1. Ensemble Algorithm

Stacking is an ensemble learning technique to combine the predictions of several other learning algorithms. Stacking typically yields performance better than any single one of the component-trained models, as evidenced in Wolpert (1992). The simplest form of stacking means fitting the first-level classifiers to the same training dataset and using the outcome as the training dataset of the second-level classifier. Unfortunately, this may cause overfitting, as evidenced in Raschka (2018). In practice, cross-validation is used to prevent overfitting and yields a significant improvement, especially in the minority classes.
After comparing the performance of different algorithms, stacking with cross-validation works the best as illustrated in Figure 1.
The stacking structure can combine the advantage of different first-level classifiers, including both rule-based models and machine learning models.
  • Model 1 is the rule-based model, which creates rules for standard columns and combines them as one model.
  • Model 2 is FastText (introduced by Joulin et al. (2016)), which is a library for learning word embeddings and text classification created by Facebook’s AI Research lab.
  • Model 3 is XGBoost (introduced by Chen and Guestrin (2016)), which takes edit distance (Levenshtein and Jaro), and BERT embeddings (as described in Devlin et al. (2018)) cosine distance as features.
Each first-level model is trained on the same set of data and generates class probabilities. The meta-classifier (second-level classifier) will be trained on the combination of class probabilities from the first-level classifiers and generate its own class probabilities as the final prediction. For the ECLIPSE schema matching algorithm, we take the class with the highest probability as the matching result. After comparing the performance between logistic regression, XGBoost, and a fully connected neural network, the neural network works the best among the three meta-models and also performs better than each model individually.

3.3.2. Evaluation Methodology

Key Metrics

There are three key metrics that need to be considered to evaluate different algorithms.
  • Micro and macro-averaging scoring metrics
    With binary classification, the model is always evaluated in terms of scoring metrics such as precision, recall, and F1 score. For a multi-class classification problem, the micro-average scores are calculated from the individual classes’ true positives (TP), true negatives (TN), false positives (FP), and false negatives (FN) of the model, and the macro-average scores are calculated as the arithmetic mean of individual classes’ precision and recall scores.
    Micro-averaging scores weight each instance or prediction equally, which means they are more influenced by the majority classes, which have more samples.
    Micro Averaging Precision = ( T P 1 + T P 2 + + T P n ) T P 1 + T P 2 + + T P n + F P 1 + F P 2 + + F P n
    Macro-averaging scores weight all classes equally to evaluate the overall performance of the classifier, and they are more influenced by the minority classes because the scores ignore label frequencies.
    Macro Averaging Precision = ( P r e c 1 + P r e c 2 + + P r e c n ) n
    Schema Standardization, as an imbalanced multi-class classification problem, needs to take both micro and macro-averaging scores into account.
  • Categorical Cross-Entropy
    Categorical cross-entropy quantifies the difference between two probability distributions. It can be used as the loss function in multi-class classification tasks, and here can be used as the measurement of probabilities of different models on the same dataset.
    Categorical Cross Entropy = 1 N i = 1 N y i l o g ( p ( y i ) ) + ( 1 y i ) l o g ( 1 p ( y i ) )
  • Inference speed
    While we do not need to be concerned about the model training time as the training process is separated from the model deployment, the inference time is an important metric. This is because schema standardization requires real-time inference and it directly influences the user experience.

Inference Speed Trade-Off

The two main factors that affect the inference speed are the choice of model and feature selection: the choice of the model determines the model inference time; feature selection determines the time spent in scanning files and getting features. After comparing three different model structures, there is no significant difference, evidenced by Table 14.
The features of this model not only include the original strings and their word embeddings but also the distinct values/value ranges/data types of each column. However, extracting these additional features means more time spent on scanning all data in a file, especially when the file is large. All in all, this implies there is a trade-off between accuracy and inference time. Here is a comparison of the speed and accuracy in three scenarios:
  • Using only text string to train;
  • Adding a feature—LOB (line of business) categories of the file
    • LOB categories including common columns for all LOB: Financial Lines, M&A, Excess Casualty, Auto, Cyber, Workers Comp, Medical Malpractice
    • Assume that each file belongs to only one LOB category, which could be the main LOB calculated from the “Line of Business” column in the file;
  • Adding two features: LOB categories and if the data in this column is numeric
    • Scan the first 25 rows to infer the data type of each column.
Even though the accuracy increases as shown in Table 15, especially Macro F1, which means the LOB categories improve the performance of minority classes, the execution time spent on scanning files and extracting features increased a lot. Usually, our assumption of LOB categories is not aligned with real-life situations, as a file could contain special columns for multiple LOBs and the LOB category could be wrong. So generally speaking, in practical real-life scenarios, the accuracy score may not improve while the inference time increases.

Performance

After comparing different stacking methods, first-level classifiers, and second-level classifiers, we found that the best structure is a fully connected neural network as the meta-classifier combining three first-level classifiers: rule-based, FastText, and XGBoost. These conclusions are readily apparent from the experiment results shown in Table 16, Table 17 and Table 18.

3.4. Interactive Validation Resolution

3.4.1. Validations Covered

After the schema standardization, the ingested data will go through a set of validations depending on requirements to ensure the data quality. These validation rules, carefully tailored to policy listings data, can be divided into the following categories:
  • Expect column names to be in set: The uploaded files should at least contain some mandatory fields such as “Insured Name”, “Policy Number”, etc.
  • Expect column values to be between: Some numerical columns, such as premium, should be within a certain range.
  • Expect column value length to be between: The length of some columns, such as insured name, should be within a certain range.
  • Expect column values to be of castable type: Some columns should be a certain data type, such as insured name should be a column of string type.
  • Expect column values to be not null: Some columns are required not to contain null values.
  • Expect column values to be in set: Some columns are required to contain a certain set of values, such as the value of “New or Renewal Indicator” should only be “New” or “Renewal”.
  • Expect column values to be unique: Some columns are required to be unique.
  • Expect column values to match regex: The value of some columns should match a certain pattern such as the “Website” column should be a valid URL pattern.

3.4.2. User Interface for Validation Editing

By designing an interactive user interface within ECLIPSE, we allow users to review the failed and passing validations clearly in table format. We present the name of the validation, its description when relevant, whether it succeeded, whether it is an error (hard) or warning (soft), the number of rows that fail, and the number of rows that pass the validation. Overall summary statistics show how many rows and columns are failing any validation. An example of this table is shown in Table 19.
Users can download the file of rows failing validations, edit it, and re-upload it. Alternatively, ECLIPSE provides an editing interface that allows users to resolve the validation error right within the app. Providing an in-app interface is a smoother UX that can better encourage stakeholders to edit based on their domain expertise.

3.4.3. Assistance Algorithms

The line of business standardization is supported by a machine learning model that is very similar to the model for schema standardization. They use the same stacking structure that contains a neural network as the meta-classifier combining rule-based, FastText, and XGBoost as the three first-level classifiers. The only difference is that they have different training data: the schema standardization is using the origin column names and their standard column name labels; the LOB standardization is using the origin LOB values and their standard LOB categories.

3.5. Labeling UX and MLOps

3.5.1. Labeling Framework for Pierce, Schema Matching, and Assistance Algos

Within the web application, in order to intuitively present the suggestions provided by the schema-matching model, we designed a specialized user interface. Users can review and correct the schema suggestions via a drop-down menu. Not only does this ensure the correctness of ingested data, but also by saving and adding the user-confirmed labels to the training dataset and periodically retraining, the model performance improves continuously.
For a better user experience, we color schema suggestions in green and yellow, meaning high and low confidence scores, respectively. The coloring is based on the threshold decided by the ROC curve. Since this is a multi-class classification problem, we treat records with standard column matches as positive records and records that cannot be matched to any standard columns as negative records. Based on this, we can calculate the true positive rate and false positive rate and draw the ROC curve in Figure 2. The optimal cut-point is the point closest to (0,1), which represents the threshold of 0.9089 and is shown as a red point on the curve.

3.5.2. Real-Time MLOps System

In general, the MLOps (Machine Learning Operations) framework can be divided into three parts as illustrated in Figure 3: development, deployment, and operation. This is not a new taxonomy; in fact, Raj (2021) similarly classifies MLOps in his practical guide to engineering MLOps. After the development of the ECLIPSE schema standardization model, it needs to be deployed to our web application for data ingestion. Our MLOps framework uses GitHub as a hosting service for development and version control and is served on Kubernetes. The model training, registration, and version control are supported by MLFlow on Databricks, which is a popular open-source component of MLOps systems (see Chen et al. (2020)). After deployment, the web application provides a user interface for both labeling and monitoring, allowing human-in-the-loop feedback to be added to the training dataset. For example, users can label missing or false positive matches provided by PIERCE or schema standardization algorithms, and these edge cases will be digested to add new methods or tune thresholds to improve ECLIPSE’s component algorithms.

4. Discussion

We have developed ECLIPSE to standardize, improve, and automate with ML the data preparation of insurance policies. Thus far, we have outlined the details of how ECLIPSE achieves this through:
  • Data cleaning rules for insurance policies;
  • PIERCE Algorithm for Entity Resolution;
  • ML Modeling for Schema Standardization;
  • Validation Rules and ML-Assisted Resolution;
  • Labeling and MLOps framework.
Now, we will summarize our contributions and existing work, as well as explain the implications of our research in practice and for the future.

4.1. Contributions and Existing Work

The main contribution of this research is the ECLIPSE system, which is effectively an insurance policy data preparation standard. ECLIPSE was born out of a desire for actuaries to spend less time cleaning dirty data, and spend more time modeling. At Guy Carpenter, actuaries had designed all sorts of disparate data preparation and cleaning schemes across business lines and a significant portion of their jobs was doing this cleaning manually in Excel: when they adopted ECLIPSE, they experienced an over 50% improvement in processing time for client modeling requests and analyses. The problem that actuaries spend significant time cleaning data is also borne out in the literature. For example, the American Academy of Actuaries acknowledges that 80% of time in any modeling project is spent understanding and cleaning data Beuerlein et al. (2018). The idea that applying AI to insurance data preparation can lead to such drastic savings and re-allocations of actuaries’ time is also evidenced in the literature. For example, in Ullal et al. (2022), the authors survey the different interactions between AI and humans and find that in services sectors requiring high intelligence, AI will partner with humans and help automate many routine tasks.
The reality of data preparation is often missing in research: most actuarial research papers focus on the risk model itself, with clean data as input. For example, in Gao et al. (2022), the authors build a claims frequency model, but the data cleaning is limited to a simple shaping operation. As mentioned in the introduction, data preparation literature for insurance is largely missing. In that sense, the novelty of ECLIPSE as a holistic insurance data preparation standard will help bridge the literature gap.
Due to its novelty, the ECLIPSE system is not comparable to existing work as a whole, but in the Results section, we compared results for its entity resolution algorithm PIERCE, its schema standardization model, and its MLOps components with other solutions, by running those other solutions on insurance policy data.
With regards to entity resolution, we compared ECLIPSE’s PIERCE to Zingg (2022), another implementation of SOTA entity resolution as outlined in Papadakis et al. (2020), as well as Dun and Bradstreet’s entity resolution service. By including specialized cleaning rules, blocking rules, and validations, ECLIPSE has seen between 3–8% improvements in match rate and 4–7% improvements in precision, on insurance policy data (see Table 20). This follows from the fact that comparable solutions are not specialized to insurance datasets, while ECLIPSE is meant to be a data preparation standard for insurance policies. By leveraging Spark distributed computing and focusing on performance, ECLIPSE has cut execution time by more than half, which is more generally applicable outside insurance.
With regards to schema standardization, we have demonstrated how ECLIPSE performs relative to two comparable methods in the literature: Snorkel (see Ratner et al. (2017)), and a standard edit distance baseline (see Levenshtein (1966)). The comparable solutions are not specialized to insurance but are also significantly simpler algorithmically than the ML ensemble model we have outlined in Section 3.3 and in 
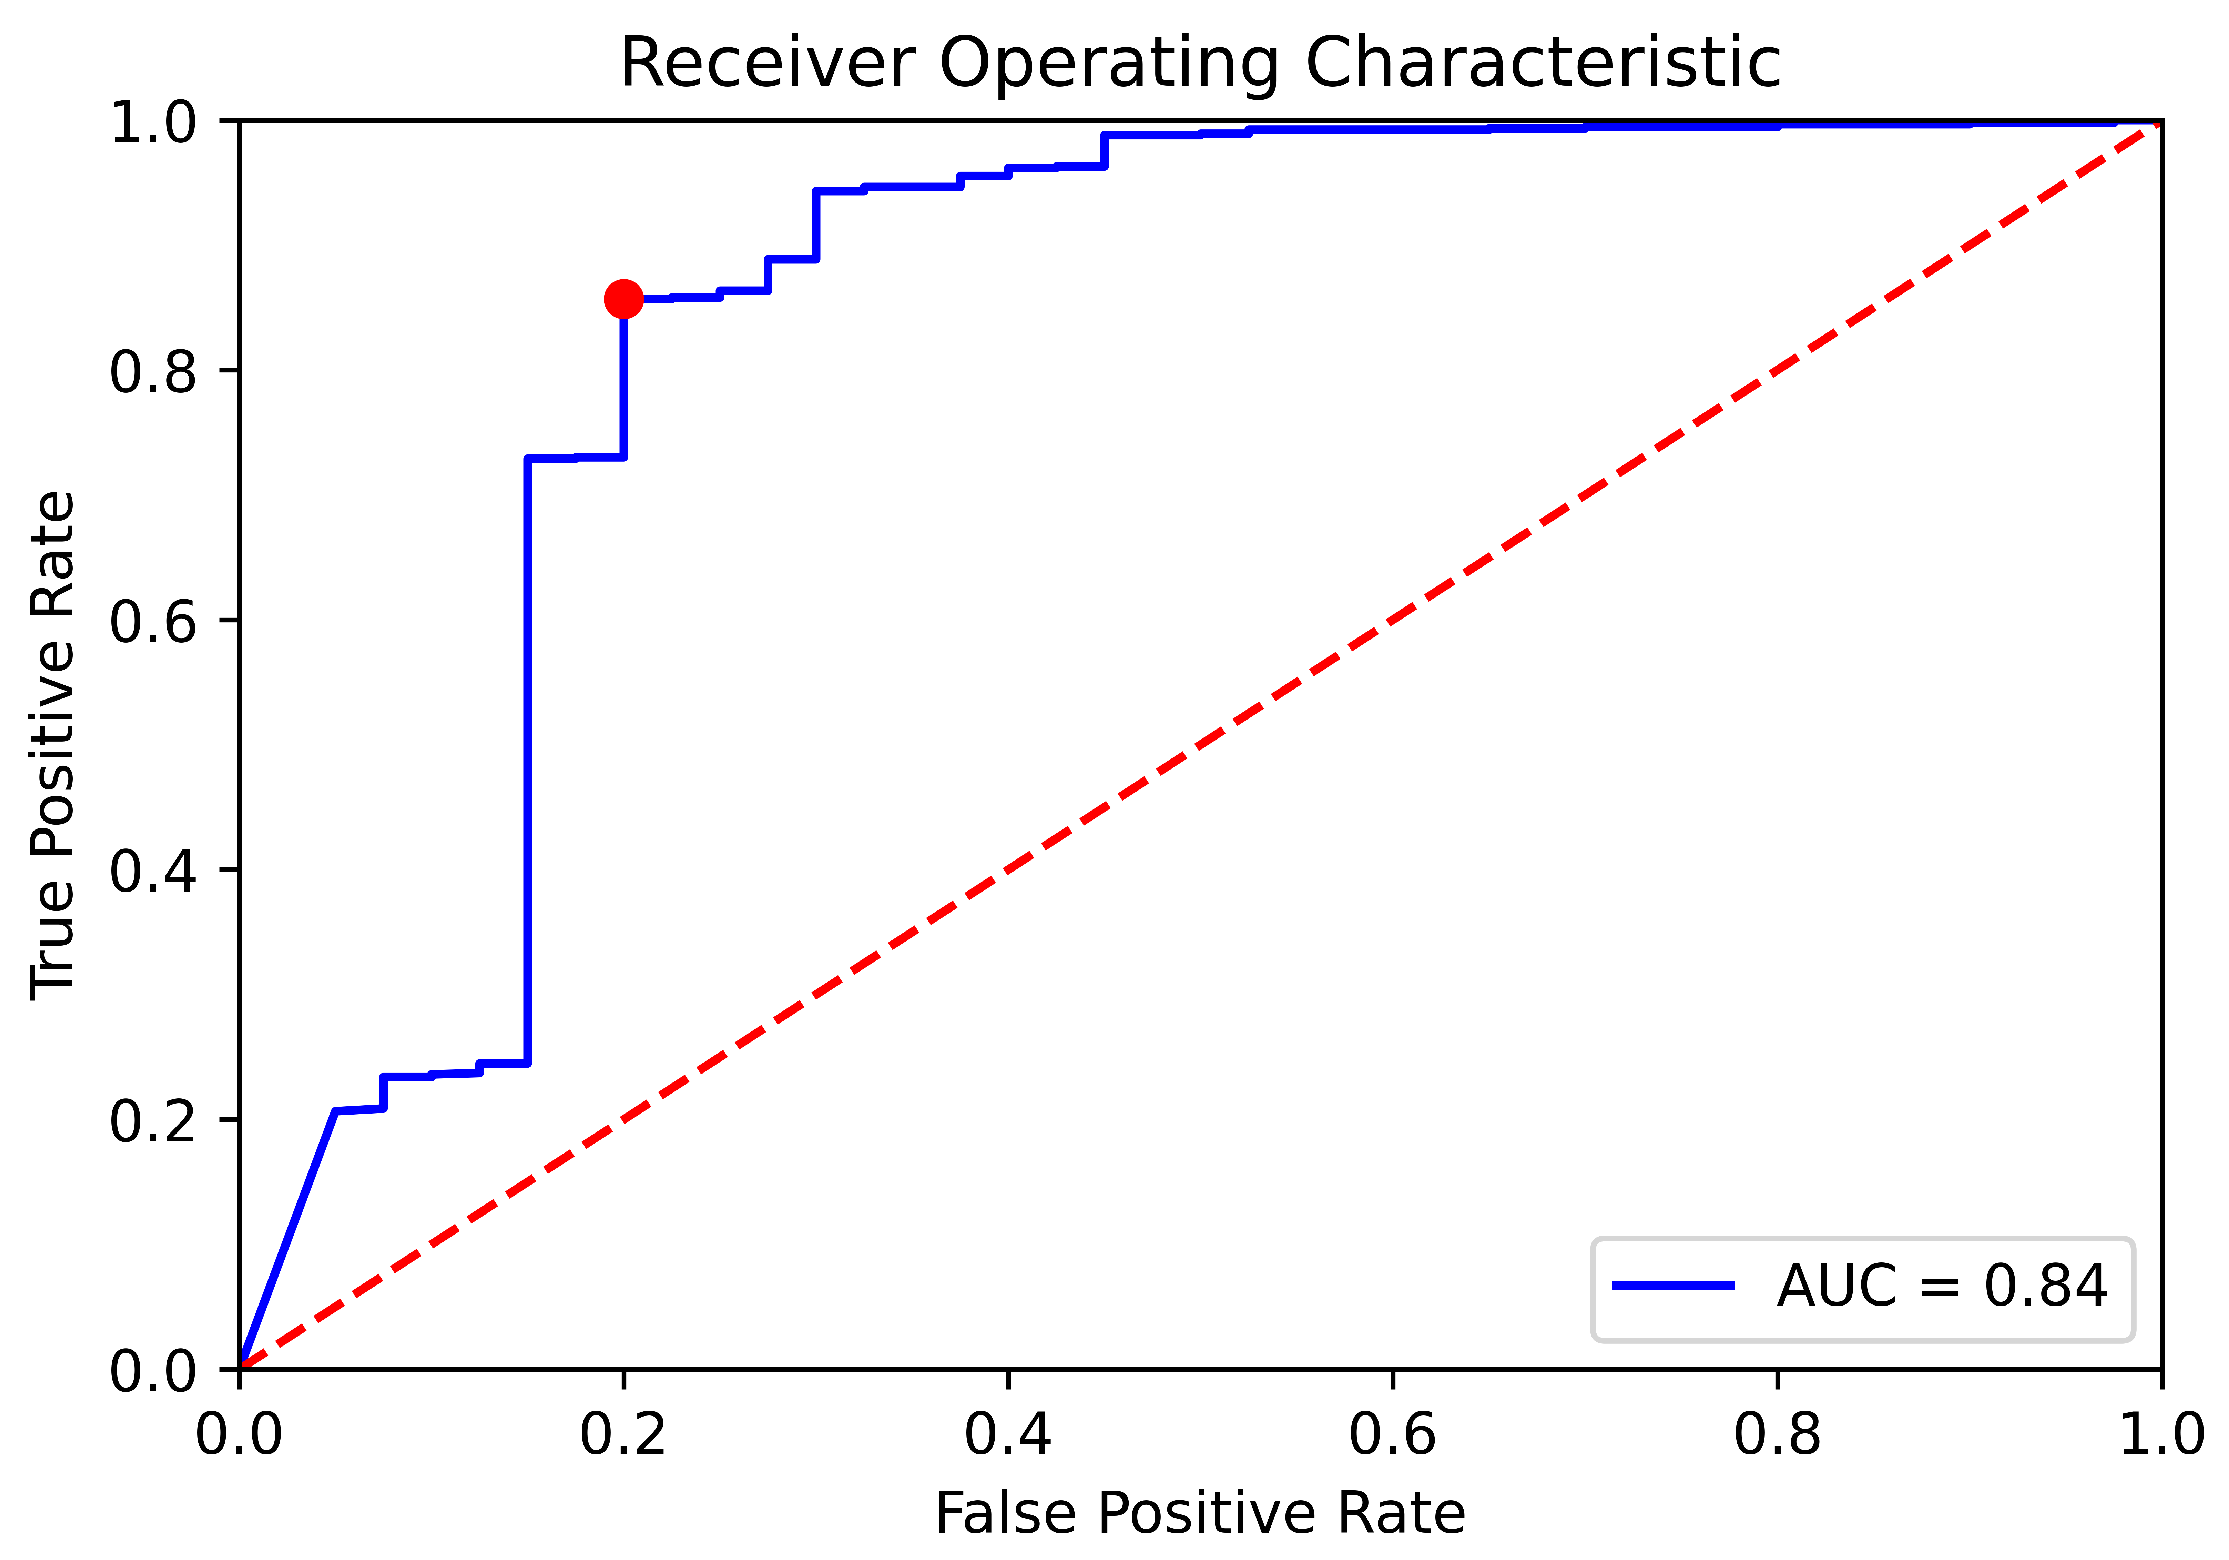
Figure 1. ECLIPSE’s added algorithmic complexity in schema standardization, along with features/cleaning rules specific to the insurance domain has led to significant improvements in micro/macro f1 scores (over 30% in the case of macro f1), as shown in Table 21.
With regards to the MLOps components, Kreuzberger et al. (
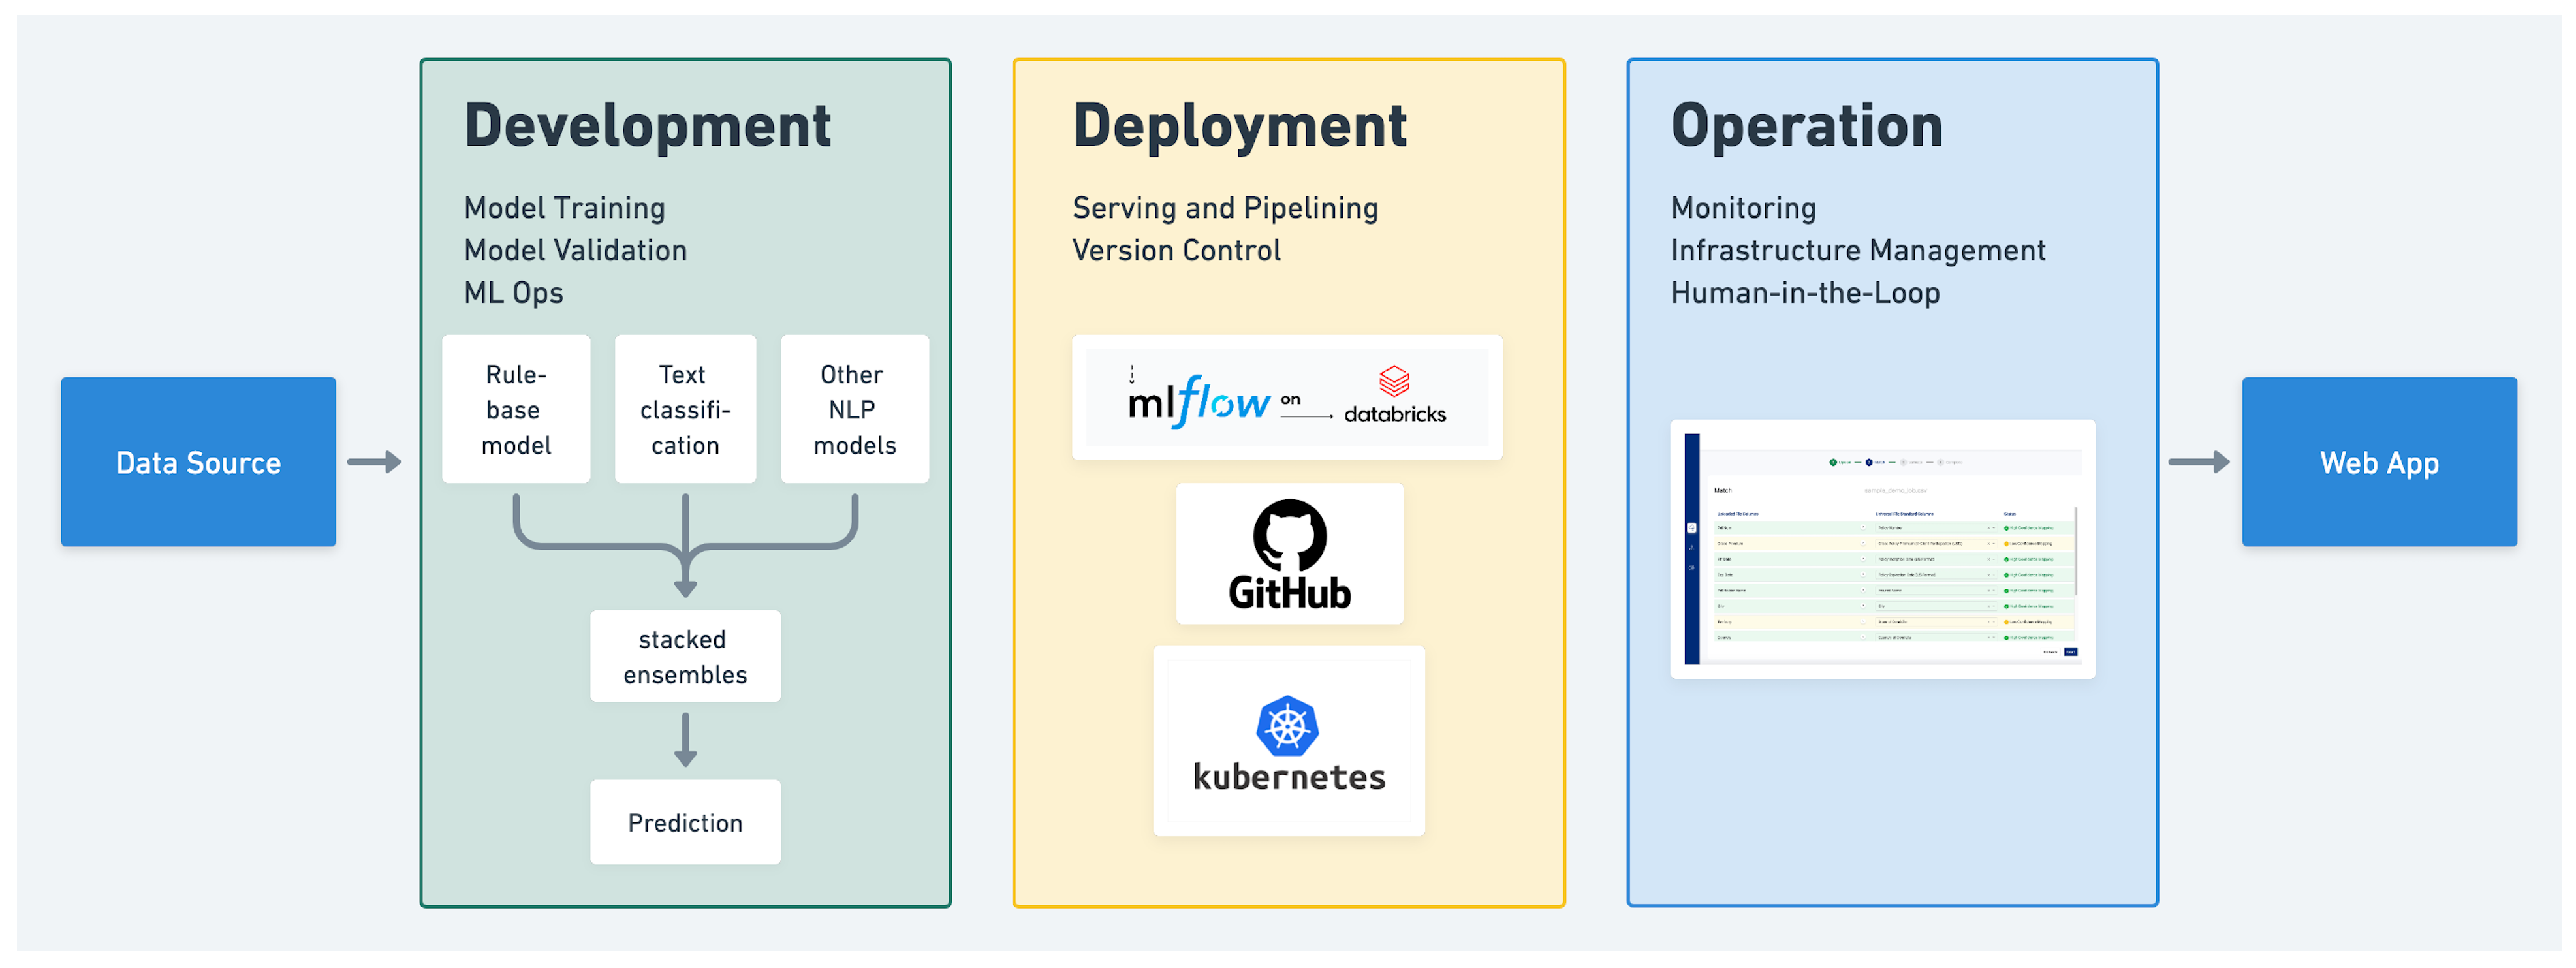
2022) compares several MLOps solutions, including BentoML, Tensorflow Serving, and more. However, based on the specialized domain and desire for widespread adoption, ECLIPSE is designed as a more customized MLOps solution built with open-source technologies such as AngularJS (for custom UX), Spark, Kubernetes, and mlflow. It handles the human-in-the-loop labeling of insured entities and monitoring of specific validations on insurance policies.

4.2. Practical and Future Implications

Based on the improvements we have outlined in terms of classification KPIs, execution time, and productivity of actuaries, we recommend actuaries and data practitioners within the insurance industry adopt ECLIPSE as a methodology for standardizing their policy listing datasets.
One key limitation of ECLIPSE as presented is that it is tailored to policy listings. However, the process and ML-assisted data preparation components that we have outlined can also be applied to other datasets within insurance, such as loss listings or claims listings. This would require some customization of the cleaning rules, validation rules, and features, and is an important future direction for this work. Within Guy Carpenter, we plan to expand ECLIPSE to support other datasets and continue to establish ML-automated and standardized data preparation on novel insurance datasets.
Another practical future implication is the need to apply more standard data schemas and data collection standards across the insurance industry: this will reduce the amount of human effort that is still needed via the human-in-the-loop labeling and monitoring sections of ECLIPSE. While some progress has been made, such as in establishing more consistent schemas in property lines by the OASIS catastrophe modeling platform (see OpenDataStandards (2020)), there is much more work to do to further minimize human-in-the-loop interventions across all policy lines.
Future directions on algorithmic research include (1) applying more complex ML models beyond linear weighting or similarity matrices in order to determine match scores during entity resolution, and (2) tailoring ECLIPSE’s ML models to standardize other string enumerations in insurance datasets, beyond just schema column names and policy lines. This effort will likely improve on the classification KPIs and further boost the productivity of actuaries.

5. Conclusions

By applying ML/AI and data science techniques to insurance policies, ECLIPSE empowers actuaries with clean policy data. At Guy Carpenter, we have seen an over 50% reduction in time spent per client analysis, as the data preparation and cleaning is now largely automated with some human-in-the-loop, maximizing the time actuaries spend on core analysis and insight generation. We have shown how ECLIPSE’s components such as entity resolution and schema standardization algorithms also have drastic improvements over comparable solutions.
First, we saw how PIERCE standardizes insured entities, enabling policy aggregations. We advance some of the SOTA techniques outlined in Papadakis et al. (2020) by incorporating normalized similarity functions, more intricate blocking rules specific to insurance policy data, and a similarity matrix with tunable heuristic thresholds. In the future, we believe further improvements can be made leveraging nonlinear ML algorithms in conjunction with the similarity matrix, such as tree-based algos or neural networks. We find that we are able to maintain higher than 95% precision with a 70% match rate when we have addresses for insured entities, and an approximately 90% precision with a 60% match rate when we do not have addresses. As demonstrated, these results drastically improve the capacity for aggregation, and significantly outperform the SOTA of industrial entity resolution vendors.
Second, we applied the stacking technique to ensemble ML algorithms and standardize schemas and other string enumeration columns, such as the line of business. In the process, we used SOTA NLP techniques and developed an end-to-end, human-in-the-loop MLOps system. We showed how we can tune this system to tradeoff between performance and accuracy, and tune thresholds for encouraging human-in-the-loop action. As a result, we presented a more comprehensive overview of applying AI in insurance data preparation, than research papers have in the past. We encourage the adoption of the ECLIPSE standard and hope this system outline not only helps set industry standards but also aids future researchers and data practitioners as they prepare insurance data, such as policies, losses, or claims listings.

Author Contributions

Conceptualization, V.S.; methodology, Z.F. and N.L.; software, V.S., Z.F. and N.L.; validation, V.S., Z.F. and N.L.; formal analysis, V.S., Z.F. and N.L.; data curation, Z.F. and N.L.; writing—original draft preparation, V.S., Z.F. and N.L.; writing—review and editing, V.S., Z.F. and N.L.; visualization, Z.F. and N.L.; supervision, V.S. All authors have read and agreed to the published version of the manuscript.

Funding

This research received no external funding beyond Guy Carpenter, where the authors were employed.

Data Availability Statement

Please note that the data and computer code is sensitive and proprietary to Guy Carpenter and its clients. However, a small randomized/anonymized data sample is provided: the data properties are clearly outlined, and the process and methodology outlined are widely applicable across the industry, helping progress state-of-the-art for insurance data preparation.

Acknowledgments

Grateful for the support of Alan Anders, Yassmine Chebarro, and Clay Hambrick, also employees of Guy Carpenter, for approving the effort to publish our research and for reading our paper.

Conflicts of Interest

Varun Sriram, Zijie Fan, and Ni Liu worked together at Guy Carpenter, a reinsurance broker while conducting this research.

Abbreviations

The following abbreviations are used in this manuscript:
NAICSNorth American Industry Classification System
LOBline of business
EREntity Resolution
SOTAstate of the art
MLOpsMachine Learning Operations
NLPNatural Language Processing

References

  1. Beuerlein, Bob, Dorothy Andrews, Mary Bahna-Nolan, Elena Black, Elizabeth Brill, Patrick Causgrove, Robert Curry, Ian Duncan, Seong-Min Eom, Andy Ferris, and et al. 2018. Big Data and the Role of the Actuary. Washington, DC: American Academy of Actuaries. [Google Scholar]
  2. Chen, Andrew, Andy Chow, Aaron Davidson, Arjun DCunha, Ali Ghodsi, Sue Ann Hong, Andy Konwinski, Clemens Mewald, Siddharth Murching, Tomas Nykodym, and et al. 2020. Developments in mlflow: A system to accelerate the machine learning lifecycle. Paper presented at the Fourth International Workshop on Data Management for End-to-End Machine Learning, Portland, OR, USA, June 14; pp. 1–4. [Google Scholar]
  3. Chen, Tianqi, and Carlos Guestrin. 2016. XGBoost: A Scalable Tree Boosting System. arXiv arXiv:1603.02754. [Google Scholar]
  4. Chen, Xiao, Roman Zoun, Eike Schallehn, Sravani Mantha, Kirity Rapuru, and Gunter Saake. 2018. Exploring Spark-SQL-based entity resolution using the persistence capability. Paper presented at the 24th IFIP World Computer Congress on Beyond Databases, Architectures and Structures, Poznan, Poland, September 18–20; pp. 3–17. [Google Scholar]
  5. Chen, Xiao, Kirity Rapuru, Gabriel Campero Durand, Eike Schallehn, and Gunter Saake. 2018. Performance Comparison of Three Spark-Based Implementations of Parallel Entity Resolution. In International Conference: Database and Expert Systems Applications). Cham: Springer, pp. 76–87. [Google Scholar]
  6. Devlin, Jacob, Ming-Wei Chang, Kenton Lee, and Kristina Toutanova. 2018. BERT: Pre-training of Deep Bidirectional Transformers for Language Understanding. arXiv arXiv:1810.04805. [Google Scholar]
  7. Euller, Roald, Stephen H. Long, and M. Susan Marquis. 1997. Data Cleaning Procedures for the 1993 Robert Wood Johnson Foundation Employer Health Insurance Survey. Santa Monica: Rand Corp. [Google Scholar]
  8. Gao, Guangyuan, He Wang, and Mario V. Wüthrich. 2022. Boosting Poisson regression models with telematics car driving data. Machine Learning 111: 243–72. [Google Scholar] [CrossRef]
  9. Joulin, Armand, Edouard Grave, Piotr Bojanowski, and Tomas Mikolov. 2016. Bag of Tricks for Efficient Text Classification. arXiv arXiv:1607.01759. [Google Scholar]
  10. Kreuzberger, Dominik, Niklas Kühl, and Sebastian Hirschl. 2022. Machine Learning Operations (MLOps): Overview, Definition, and Architecture. arXiv arXiv:2205.02302. [Google Scholar]
  11. Levenshtein, Vladimir I. 1966. Binary codes capable of correcting deletions, insertions, and reversals. Soviet Physics Doklady 10: 707–10. [Google Scholar]
  12. ODS (Open Data Standards) from OasisLMF. 2020. 24th IFIP World Computer Congress, WCC 2018, Poznan, Poland. Available online: https://github.com/OasisLMF/OpenDataStandards (accessed on 22 August 2022).
  13. Papadakis, George, Dimitrios Skoutas, Emmanouil Thanos, and Themis Palpanas. 2020. Blocking and filtering techniques for entity resolution: A survey. ACM Computing Surveys (CSUR) 53: 1–42. [Google Scholar] [CrossRef] [Green Version]
  14. Raj, Emmanuel. 2021. Engineering MLOps. Birmingham: Packt Publishing, Ch.1-Sec.6. ISBN 978-18-0056-288-2. [Google Scholar]
  15. Raschka, Sebastian. 2018. MLxtend: Providing machine learning and data science utilities and extensions to Python’s scientific computing stack. Journal of Open Source Software 3: 638. [Google Scholar] [CrossRef]
  16. Ratner, Alexander, Stephen H. Bach, Henry Ehrenberg, Jason Fries, Sen Wu, and Christopher Ré. 2017. Snorkel: Rapid training data creation with weak supervision. Paper presented at the VLDB Endowment, International Conference on Very Large Data Bases, Rio de Janeiro, Brazil, August 27–31; Volume 11, p. 269. [Google Scholar]
  17. Sawarkar, Kunal, and Meenakshi Kodati. 2021. Automated Metadata Harmonization Using Entity Resolution and Contextual Embedding. In Intelligent Computing. Cham: Springer, pp. 129–38. [Google Scholar]
  18. Symeonidis, Georgios, Evangelos Nerantzis, Apostolos Kazakis, and George A. Papakostas. 2022. MLOps-Definitions, Tools and Challenges. Paper presented at the 2022 IEEE 12th Annual Computing and Communication Workshop and Conference (CCWC), Las Vegas, NV, USA, January 26–29; pp. 453–60. [Google Scholar]
  19. Ullal, Mithun S., Pushparaj M. Nayak, Ren Trevor Dais, Cristi Spulbar, and Ramona Birau. 2022. Investigating the nexus between Artificial Intelligence and machine learning technologies in the case of Indian services industry. Business: Theory and Practice 23: 323–33. [Google Scholar] [CrossRef]
  20. Vidhya, K. A., and T. V. Geetha. 2019. Entity Resolution and Blocking: A Review. Paper presented at the 2019 IEEE 9th International Conference on Advanced Computing (IACC), Tiruchirappalli, India, December 13–14; pp. 133–40. [Google Scholar]
  21. Wolpert, David H. 1992. Stacked generalization. Neural Networks 5: 241–59. [Google Scholar] [CrossRef]
  22. Zingg. 2022. Zingg Documentation. Available online: https://docs.zingg.ai/zingg/ (accessed on 22 August 2022).
Figure 1. The structure of stacking model.
Risks 11 00004 g001
Figure 2. ROC curve for schema standardization. The dotted red line represents a random guess, while the blue line represents the classifier.
Risks 11 00004 g002
Figure 3. MLOps framework for data ingestion.
Risks 11 00004 g003
Table 1. Column name variations.
Original Column NameStandard Column Name
insured_name_to_be_castable_to_strInsured Name
Heavy - CountVehicle Count by Weight Class: Heavy
POL_EFF_DTPolicy Inception Date (US Format)
PolcyNumberPolicy Number
Predominant Insured TerritoryState of Domicile
Note: This table and the table and figures that follow were created by the authors during their work at Guy Carpenter. The sample data came from anonymized and randomized Guy Carpenter data.
Table 2. Company name with text standardization.
Company NameCompany Name Cleaned
GUY CARPENTER COMPANY (NEW YORK)guy carpenter co
HP Incorporated, DBA Hewlett-Packardhp inc dba hewlettpackard
Table 3. Company name with split of composite company name.
Company NameCompany Name Cleaned
guy carpenter coguy carpenter co
hp inc dba hewlettpackardhp inc dba hewlettpackard
hp inc dba hewlettpackardhp inc
hp inc dba hewlettpackardhewlettpackard
Table 4. Address properties with text standardization.
Address Property TypeAddress PropertyAddress Property Cleaned
CountryUnited StatesUS
StateNew YorkNY
City
Postal Code10036-272810036
Street Address1166 AV OF AMERICAS1166 ave of americas
Table 5. Company name core and company name filtered.
Company NameCompany Name CoreCompany Name Filtered
joe w richard farm llcjoe richardjoe richard farm
Table 6. Examples of sorted initial blocking method.
Company Name in Query DataCompany Name in Reference DataSorted Initials
joe w richard farm llcW Joe Richard Limitedjr
Table 7. Examples of bag-of-words blocking method.
Company Name in Query DataCompany Name in Reference DataMutual Words
Joe W RichardRichard Family LLC[“richard”]
Table 8. Default match configuration.
Company Name SimilarityCompany Address SimilaritySupported in Default Match Configuration
GoodGoodYes
GoodSimilarYes
GoodBadYes
SimilarGoodYes
SimilarSimilarYes
SimilarBadNo
BadGoodNo
BadSimilarNo
BadBadNo
Table 9. Normalized Levenshtein distance.
Levenshtein DistanceLonger Character LengthNormalized Levenshtein Distance
2Max(11, 9) = 112/11
Table 10. Normalized Jaccard distance.
Word IntersectionWord UnionNormalized Jaccard Distance
“richard”“joe”, “richard”1/2
Table 11. Match rate by types of entity.
Address CompletenessUS EntityInternational Entity
Complete Address0.76320.6471
Partial Address0.67170.5209
Table 12. Precision by types of entity.
Address CompletenessUS EntityInternational Entity
Complete Address0.990.95
Partial Address0.920.91
Table 13. PIERCE resolve time by number of entities in query data.
Number of Entities in Query DataResolve Time in Minute
10013.1
100013.3
10,00013.7
100,00018.3
1,000,00074
Table 14. Inference time of different model structures.
MethodInference Time (On 850 Records and Model Loading Time Included)
Logistic regression stacking model21.84 s
XGBoost stacking model21.13 s
Neural network stacking model21.70 s
Table 15. Performance comparison on different feature selection.
Use Text StringAdd LOB CategoriesAdd LOB Categories and If It Is Numeric
Time on scan files and getting features  100 ms  4 s  10 s
Time on model inference  13 s  13 s  13 s
Micro F1 score0.8439020.8487800.850153
Macro F1 score0.8384780.8493530.848612
Table 16. Performance comparison on stacking method.
MethodMicro F1 ScoreMacro F1 Score
Snorkel0.8000610.524684
Stacking Classifier0.8412880.544087
Stacking with cross-validation0.8743900.849452
Table 17. Performance comparison on first-level classifiers.
MethodMicro F1 ScoreMacro F1 ScoreCategorical Cross-Entropy
Rule-based model0.7329270.4296247.202598
FaseText model0.8585370.8581492.682244
XGBoost model0.7402440.5447150.888559
Table 18. Performance comparison on second-level classifiers.
MethodMicro F1 ScoreMacro F1 ScoreCategorical Cross-Entropy
Logistic regression meta-model0.8378050.6713340.776860
XGBoost meta-model0.8329270.7265240.802349
Neural network meta-model0.8743900.8494520.794606
Table 19. Example Validations Table within ECLIPSE.
Rule NameDetailed DescriptionSuccessValidation TypeFailure CountSuccess Count
policy listings mandatory columnsThe following columns are not in the data: New or Renewal Indicator, Original CurrencyFalsehard47
line of business to be in set Falsehard1831
policy inception date is not null truehard049
policy expiration date is not null truehard049
insured name is not null truehard049
policy number is not null truehard049
country of domicile is not null truehard049
gross policy premium at client participation must be smaller than 1,000,000,000 truehard049
insured name length must be between 1 and 255 truehard049
policy expiration date must be after 1980 truehard049
state of domicile is valid truehard049
Table 20. PIERCE performance comparison.
ModelMatch RatePrecisionResolve Time in Minute
PIERCE0.79490.991.8
Zingg0.77470.954.4
Vendor Model0.71490.929.7
The experiment was conducted between two company datasets, in which companies are US-based and have address information. The datasets contain 4101 and 29,857 entities, respectively.
Table 21. Schema standardization performance comparison.
MethodMicro F1 ScoreMacro F1 Score
Edit Distance0.5947640.477850
Snorkel0.8000610.524684
Schema standardization model0.8743900.849452
Disclaimer/Publisher’s Note: The statements, opinions and data contained in all publications are solely those of the individual author(s) and contributor(s) and not of MDPI and/or the editor(s). MDPI and/or the editor(s) disclaim responsibility for any injury to people or property resulting from any ideas, methods, instructions or products referred to in the content.

