Article

A Bibliometric Analysis of Research on Stochastic Mortality Modelling and Forecasting

by
Norkhairunnisa Redzwan
1,2 and
Rozita Ramli
2,*
1
Faculty of Computer and Mathematical Sciences, Universiti Teknologi MARA, Shah Alam 40450, Malaysia
2
Department of Mathematical Sciences, Faculty of Science and Technology, Universiti Kebangsaan Malaysia, Bangi 43600, Malaysia
*
Author to whom correspondence should be addressed.
Risks 2022, 10(10), 191; https://doi.org/10.3390/risks10100191
Submission received: 16 August 2022 / Revised: 18 September 2022 / Accepted: 29 September 2022 / Published: 9 October 2022

Abstract

:
Mortality improvements and life expectancies have been increasing in recent decades, leading to growing interest in understanding mortality risk and longevity risk. Studies of mortality forecasting are of interest among actuaries and demographers because mortality forecasting can quantify mortality and longevity risks. There is an abundance of literature on the topic of modelling and forecasting mortality, which often leads to confusion in determining a particular model to be adopted as a reliable tool. In this study, we conducted a bibliometric analysis with a focus on citation and co-citation analyses and co-occurrences of keywords to determine the most widely used stochastic mortality model. We found that the Lee–Carter model has remained one of the most relevant mortality models since its development in the 1990s. Furthermore, we also aimed to identify emerging topics and trends relating to mortality modelling and forecasting based on an analysis of authors’ keywords. This study contributes to the literature by providing a comprehensive overview and evolution of publications in stochastic mortality modelling and forecasting. Researchers can benefit from the present work in determining and exploring emerging trends and topics for future studies.

1. Introduction

Mortality improvements and life expectancies have increased in recent decades, mostly due to the advancement of technology and healthcare practices. From 2019 to 2050, the proportion of people aged 80 years or older is expected to further increase (United Nations 2019). Mortality improvements are expected to grow, which leads to uncertainty regarding mortality improvements and life expectancies in the future (Cairns et al. 2008; Vaupel and Kistowski 2005). This scenario leads to a growing interest in mortality risk and longevity risk. According to Deng et al. (2012), mortality risk is described as the risk that a person will live shorter than expected, while longevity risk is defined as the risk that a person will live longer than expected.
As the ageing population is growing rapidly, there is a need to accurately forecast these risks to measure the anticipation of the future ageing population by modelling and forecasting mortality. These risks are also particularly important in ensuring sufficient pricing and reserving for life insurance and annuity products. Furthermore, quantifying mortality and longevity risks is a major aspect in the risk management process of life insurers and in pension plans (Niu and Melenberg 2014) and it also assists the government in planning for healthcare and other services for societies.
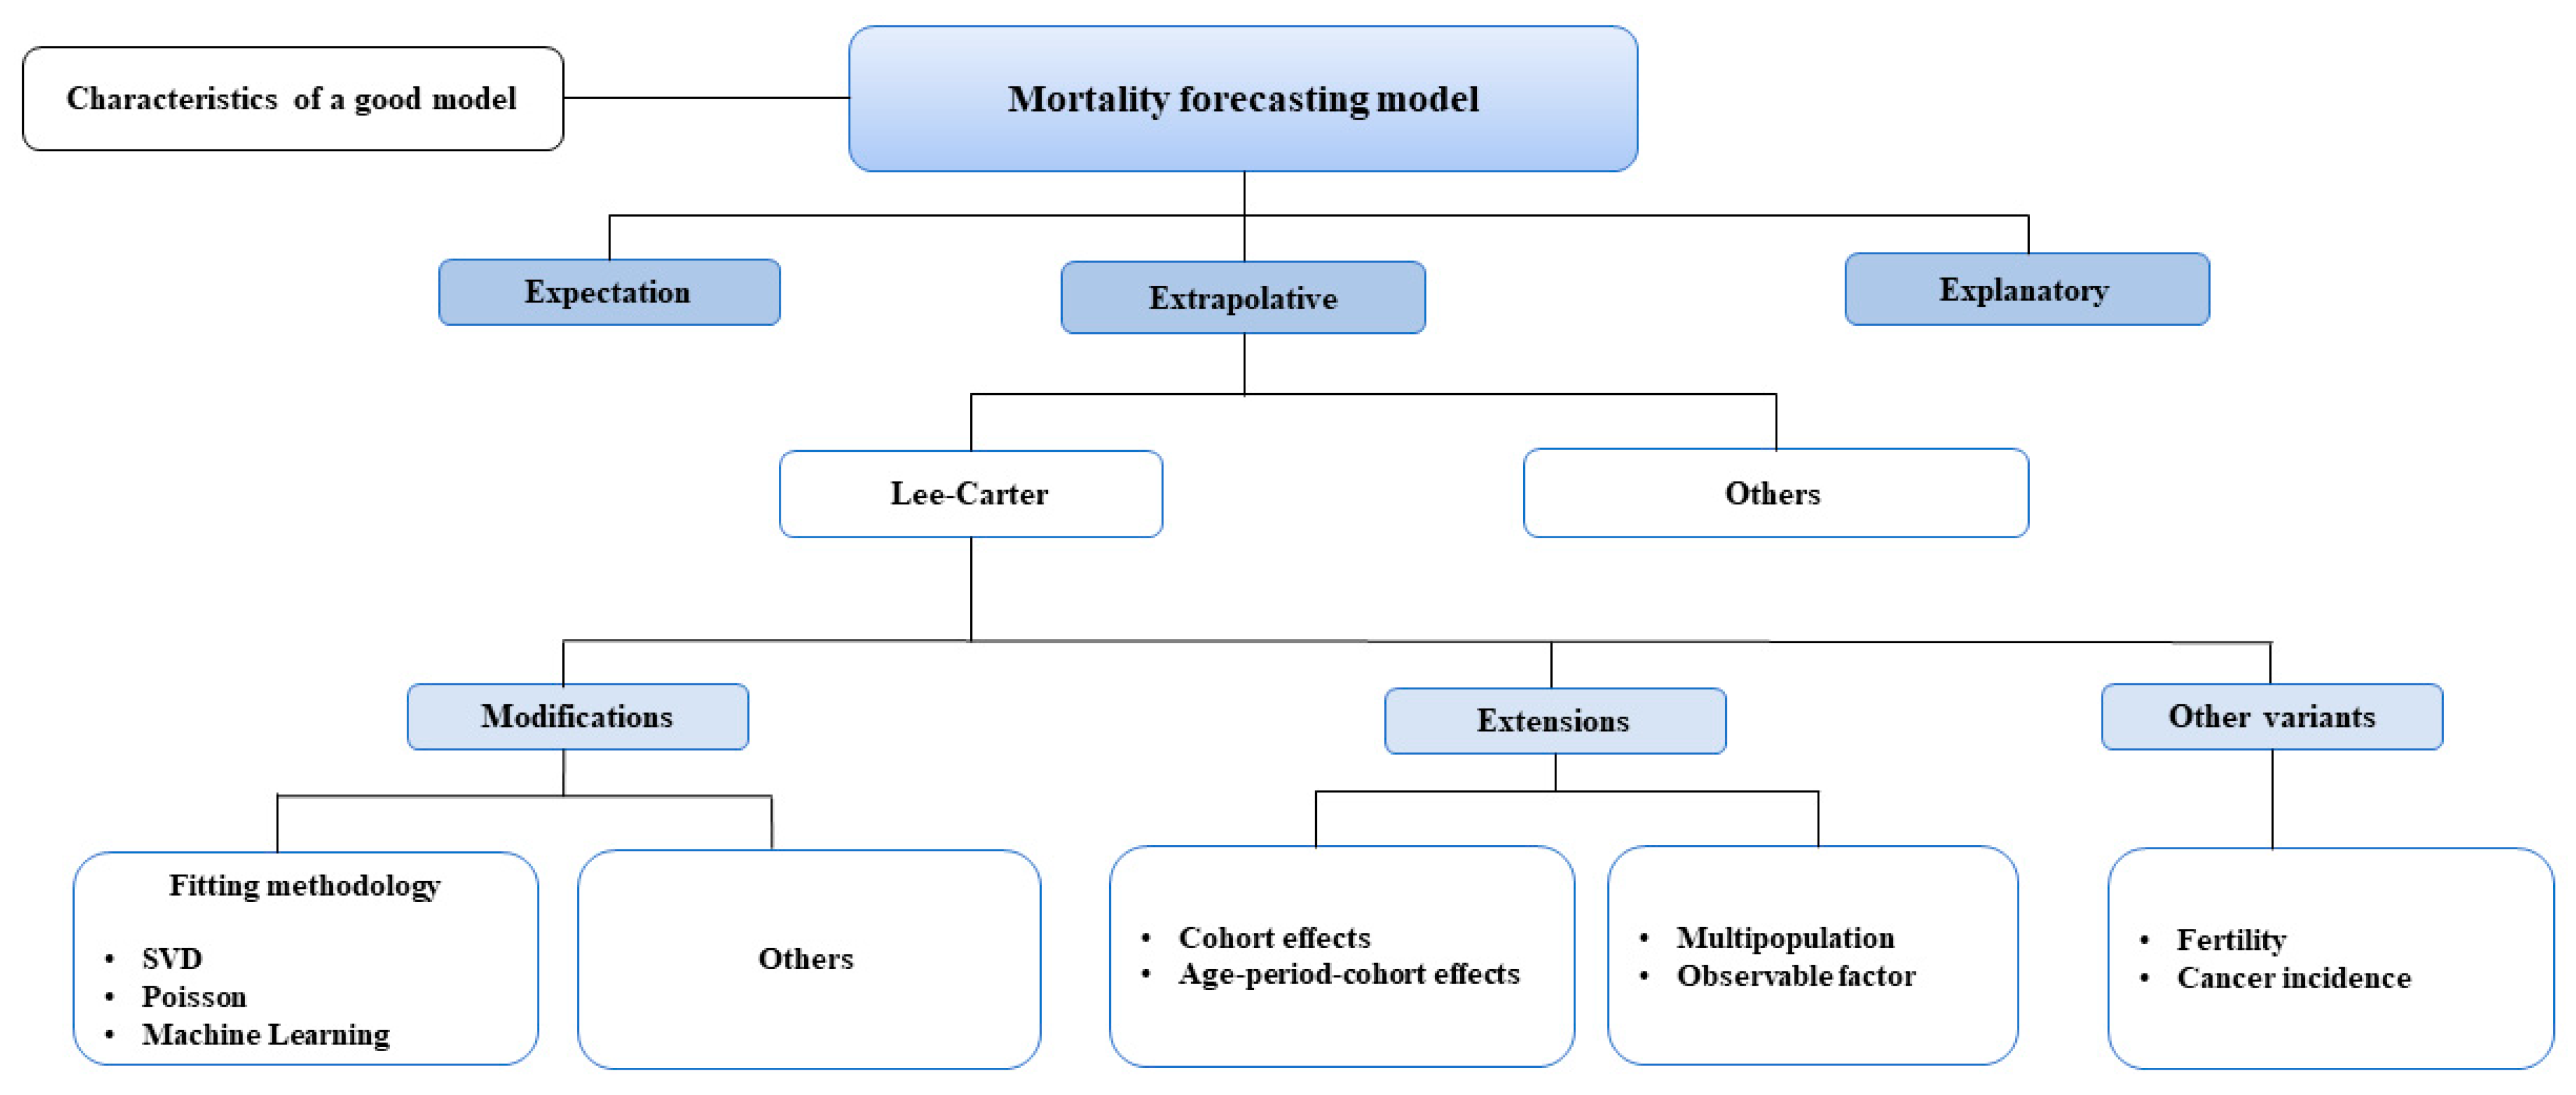
According to Booth and Tickle (2008), mortality forecasting can be classified into expectation, explanatory and extrapolative methods. The expectation method is based on expert opinion, the explanatory method is based on some certain causes of death with several risk factors and the extrapolative method is based on past mortality trends. Although the explanatory method is sometimes used with the expectation method, it is usually used to forecast mortality based on explanatory factors. For example, Ayerbe et al. (2014) and Wicke et al. (2022) studied the association between all-cause mortality and depression. Ayerbe et al. (2014) focused on all-cause mortality of stroke patients, while Wicke et al. (2022) focused on effects of depression on mortality by gender. Meanwhile, the extrapolative method of forecasting mortality is usually used by actuaries, demographers and statistical offices. This method is more objective and suitable for long-term forecasting. For example, Heligman and Pollard (1980) developed a mortality model for Australian males and females that captured the three main components of mortality. These components are decreased mortality in early childhood years, mortality due to increased senescence in adults and an accident hump between ages 10 and 40. Another example of a mortality forecasting model was developed by Lee and Carter (1992). It has become one of the most prominent mortality models and has since became a basis for other mortality forecasting models through modifications and extensions (Boonen and Li 2017; Cairns et al. 2008; Li and Lee 2005; Plat 2009).
The Lee–Carter model is a bilinear factor stochastic mortality model that was first performed on U.S. mortality data (Lee and Carter 1992). The advantages of the model are its simplicity and easily interpretable parameters. In recent decades, the stochastic mortality model has been extended to include an additional factor, cohort effects, as in models proposed by Renshaw and Haberman (2006) and Currie (2006). Cohort effects are used to describe that mortality improvement of individuals varies by their year of birth. Furthermore, Plat (2009) developed a new age–period–cohort model that incorporates the preferred features of several stochastic mortality models such as Lee and Carter (1992), Renshaw and Haberman (2006) and Currie (2006). The model fits well to U.S. male mortality data. The interpretations of these models, however, are usually not straightforward, as they are only described by latent factors. To overcome this issue, studies by Hanewald (2011), Niu and Melenberg (2014) and Seklecka et al. (2017) included observable factors in the Lee–Carter model, which provided more interpretable forecasts. Other innovations of the stochastic mortality model include the application of machine learning. For example, Levantesi and Pizzorusso (2019) applied machine learning techniques to calibrate a parameter which was then fitted to the standard stochastic mortality model. Future research may extend and modify these stochastic mortality models in terms of inclusion of other observable factors or application of machine learning techniques.
The field of mortality forecasting is developing and progressing rapidly, as various models for mortality modelling and forecasting were developed in recent decades (Janssen 2018). Although there is an abundance of literature on the topic of modelling and forecasting mortality, many studies are focused on the development and technical aspects of the models. However, the findings and interpretations of these models are not straightforward. This often leads to confusion in determining a particular model to be adopted as a reliable tool. While Booth and Tickle (2008) and Cairns et al. (2008) conducted a comprehensive review of different types of stochastic mortality models, ewe aimed to present a complementary analysis approach by providing a bibliometric analysis of this topic. Bibliometric analysis can illustrate the progression of a specified research area over a certain period and is systematic and easily interpretable (Khairi et al. 2021; Liao et al. 2018).
Therefore, in this paper, we provide a comprehensive overview on the evolution of research in modelling and forecasting mortality in recent decades to determine the most widely used stochastic mortality model and to determine emerging topics and trends relating to mortality forecasting and modelling. A narrative review of the emerging topics and trends was performed based on the most cited publications between 2016 and 2021. The findings reveal that one of the most prominent mortality models, the Lee–Carter model, among others, has remained a relevant model since its development in the 1990s.
This study is significant for fellow researchers, especially young researchers and students, to understand and discover the emerging topics related to modelling and forecasting mortality. It also contributes to determining gaps and associations between past studies. This paper is organised as follows. Section 2 describes the data and bibliometric methods used in the study. Section 3 discusses the results of the bibliometric analysis on the topic of mortality forecasting and modelling. The results consist of the evolution of publications; a performance analysis of authors, sources and countries; science mapping of keywords and co-citation analysis; and a narrative review of emerging trends and topics. Finally, Section 4 provides the conclusion of the study.

2. Methodology

2.1. Bibliometric Analysis

We conducted a bibliometric analysis on the topics of modelling and forecasting mortality, as bibliometric analysis can illustrate the progression of a specified research area over a certain time period because it is systematic and easily interpretable (Khairi et al. 2021; Liao et al. 2018). Bibliometric analysis is suitable for mapping the progression of global scientific publications quantitatively by performing a thorough analysis of an extensive set of data (Sholihin et al. 2021). The analysis consists of two main components, namely performance analysis and science mapping. Performance analysis provides a descriptive analysis and describes the performance of research factors such as authors, sources and countries. Science mapping illustrates the relationships between each research factor (Donthu et al. 2021). Another advantage of bibliometric analysis is that it can provide new comprehensive insights on the most active authors, sources, countries and keywords of certain research fields and help authors effectively plan their contributions to the field by determining knowledge gaps and new ideas (Donthu et al. 2021). Bibliometric analysis has been applied to many fields of study, such as information science (Bucher 2018; Noorhidawati et al. 2017), economics (Arana-Barbier 2020; Sholihin et al. 2021) and environmental science (Kasavan et al. 2021).
The database used in this study was Scopus. Scopus is a database of peer-reviewed scientific publications and is currently among one of the largest citation databases. Any publication that is to be included in the database will need to undergo a rigorous selection process to maintain its scientific quality and rigor. Publications in the Scopus database mainly consist of publications in the categories of health sciences, physical sciences, social sciences and life sciences (Baas et al. 2020). Several authors have conducted bibliometric analyses based on the Scopus database, such as Khairi et al. (2021) and Shamsuddin et al. (2022).
Data analysis and visualisation were conducted using the Bibliometrix R package (Aria and Cuccurullo 2017) and VOSviewer (van Eck and Waltman 2010). The web interface app of the Bibliometrix package, called Biblioshiny, allows researchers to analyse bibliometric data without coding. Visualisation of networks and citation analysis were conducted using VOSviewer. For example, Shamsuddin et al. (2022) shared insights on bibliometric analysis of life insurance lapsation using both Biblioshiny and VOSviewer. The authors developed author keyword network mapping that can assist future research in the topic of life insurance lapsation. In this study, Biblioshiny was used for performance analysis, such as total publications and total citations, while VOSviewer was used for science mapping, such as co-citation and co-word analysis.

2.2. Data Collection

A flowchart of our research process is as shown in Figure 1. Based on Figure 1, the process of this study can be categorised into three steps. First, we used the Scopus database to search for publications on the topic of mortality forecasting and modelling. The publication period was chosen between 2000 and 2021 because the field of mortality modelling and forecasting experienced rapid growth during this period (Hanewald 2011; Booth and Tickle 2008; Janssen 2018; Tóth 2021). The increase in research on mortality modelling and forecasting in this period was due to the increase in its relevance in society. For example, it acts as one of the strategies to respond to issues of an ageing population, the sustainability of social security and pension schemes, and insurance premiums. Hence, it is important to provide accurate mortality forecasts to deal with these challenges. Therefore, we aimed to analyse the progression of the literature on mortality modelling and forecasting from 2000 to 2021. Publications with “mortality”, “life expectancy”, “forecast”, “predict”, “project”, “modelling”, “actuarial” and “stochastic” in their titles, abstracts or keywords were considered in this study. These terms were linked using the Boolean operators AND, OR and * in the search string, as shown in Figure 1. The Scopus database was accessed on 16 June 2022, and the initial search result yielded 531 documents.
These documents underwent exclusion and inclusion processes in the second stage. Inclusion criteria were as follows: (i) only documents in the English language were included in this study, (ii) the publication period was between 2000 and 2021 and (iii) documents in the subject areas of “mathematics”, “medicine”, “economics, econometric and finance”, “decision sciences”, “computer science”, “engineering”, “multidisciplinary”, “business, management and accounting” and “social sciences” were included in this study. Based on the exclusion and inclusion criteria, a total of 220 out of 531 documents were selected for further selection processes. After a comprehensive screening of abstracts, 138 documents were included for further analysis.

2.3. Data Analysis

A bibliometric analysis can be conducted using two approaches, namely performance analysis and science mapping (Donthu et al. 2021). We adopted both approaches to provide a comprehensive review on the topic of modelling and forecasting mortality. Performance analysis is a descriptive analysis that focuses on the contributions of research areas in the study. Performance analysis include determining publications growth, classifying the most active authors and countries and determining the most influential sources in the topic of mortality forecasting and modelling. The second approach, science mapping, focuses on the relationship between the research areas to discover the connections between them. In this study, science mapping was conducted on the co-citations of authors, co-authorship of countries and co-occurrence of keywords.
Finally, this study also covers a narrative review to identify emerging research topics and future directions of research related to mortality modelling and forecasting. The summary is based on the top 10 most cited publications between 2016 and 2021 with a minimum of 8 citations.

3. Results and Discussion

3.1. Performance Analysis: Publication Growth

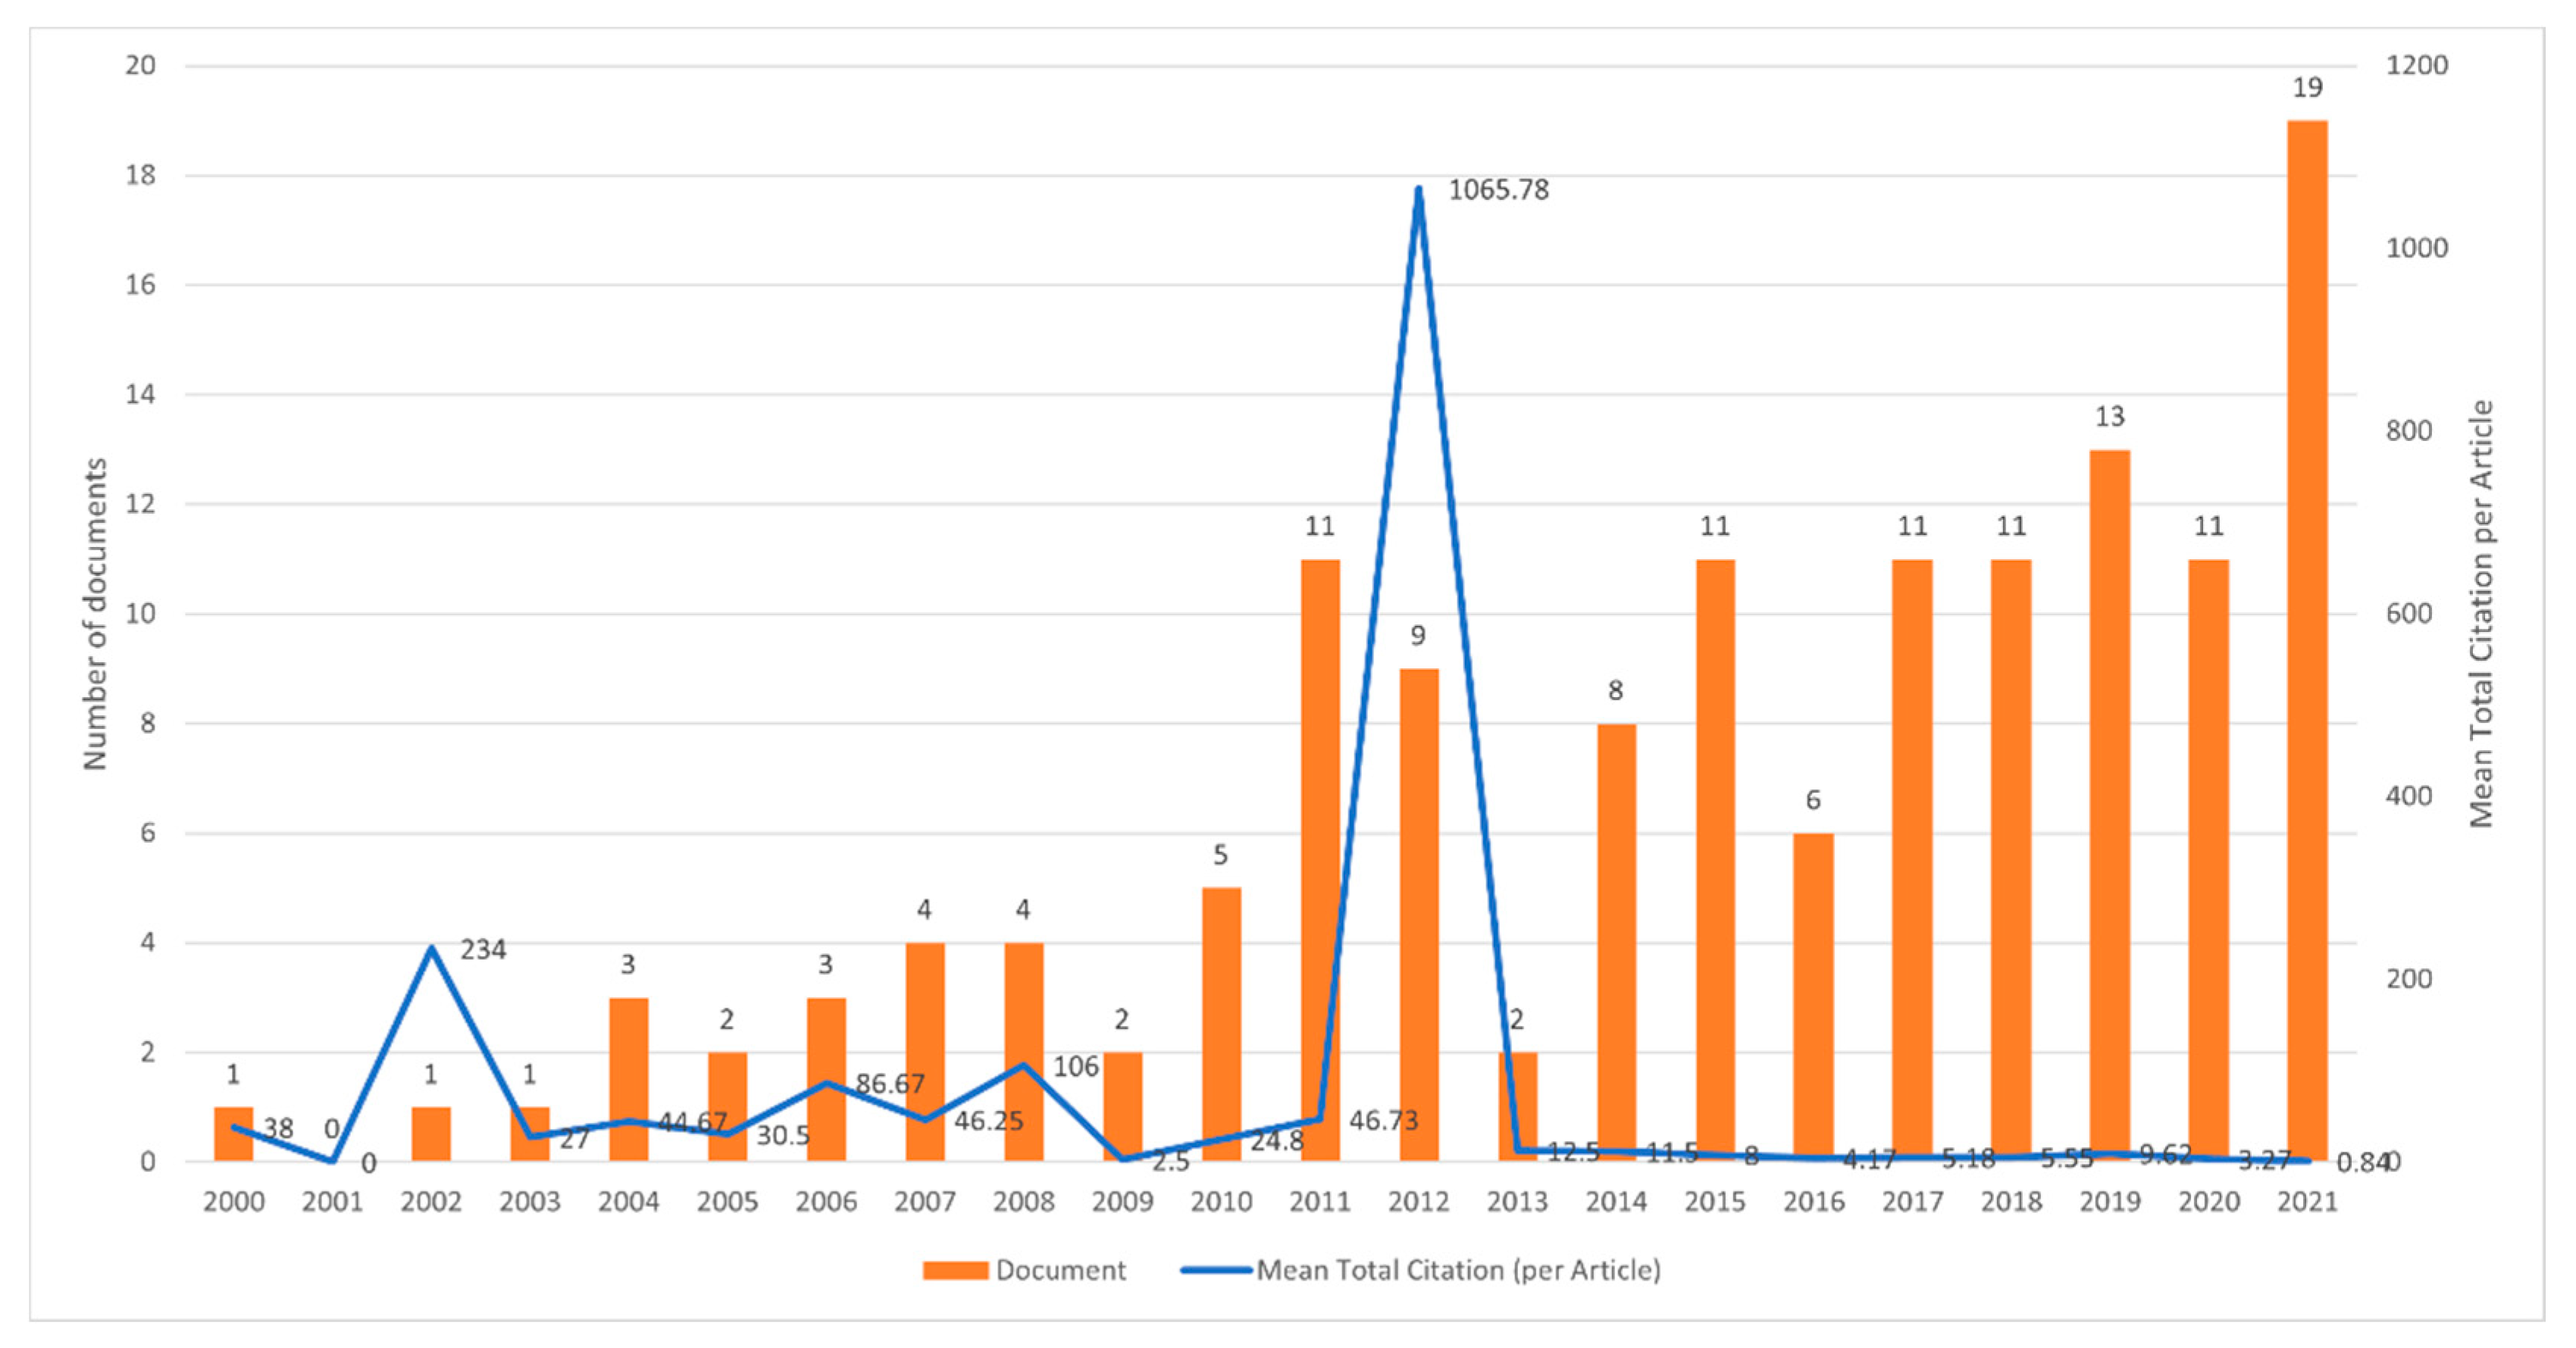
In this study, a total of 138 documents from 2000 to 2021, including articles, conference papers, book chapters and reviews, were analysed. Table 1 shows that 83.3% of the documents were articles, followed by conference papers (14.5%), book chapters (1.5%) and reviews (0.1%). Besides journal articles, this study also includes non-journal publications to acknowledge significant non-journal publications such as Bravo (2020). Bravo (2020) is one of the top 10 most cited publications between 2016 and 2021 and is further discussed in Section 3.4. Figure 2 shows the evolution of publications in mortality forecasting and modelling in terms of the number of documents and average total citations per article. There is a steady increase in publications throughout the study period, and the highest number of publications was recorded in 2021. Likewise, there is a steady growth in average citations per article, with the highest average number of citations in 2012. It is interesting to note that over 50% of the total documents were published between 2016 and 2021.
The results from VOSviewer show that the most cited documents in 2012 were Lozano et al. (2012) and Badhwar et al. (2012), with 9303 and 111 total citations, respectively. Lozano et al. (2012) estimated 235 cause-specific deaths for the world and its 21 regions from 1980 to 2010. Their findings concluded that cause-specific deaths varied according to region and that regular assessments of causes of death are crucial. Other publications that received more than 30 total citations include Deng et al. (2012) and O’Hare and Li (2012). O’Hare and Li (2012) developed a new mortality model that is suitable to model mortality on a wider age range, while Deng et al. (2012) proposed a stochastic diffusion model to capture the rate of jumps in mortality trends. Both studies applied the Lee–Carter model as a basis of mortality in the development of their models.

3.2. Analysis on Most Active Authors, Sources and Countries

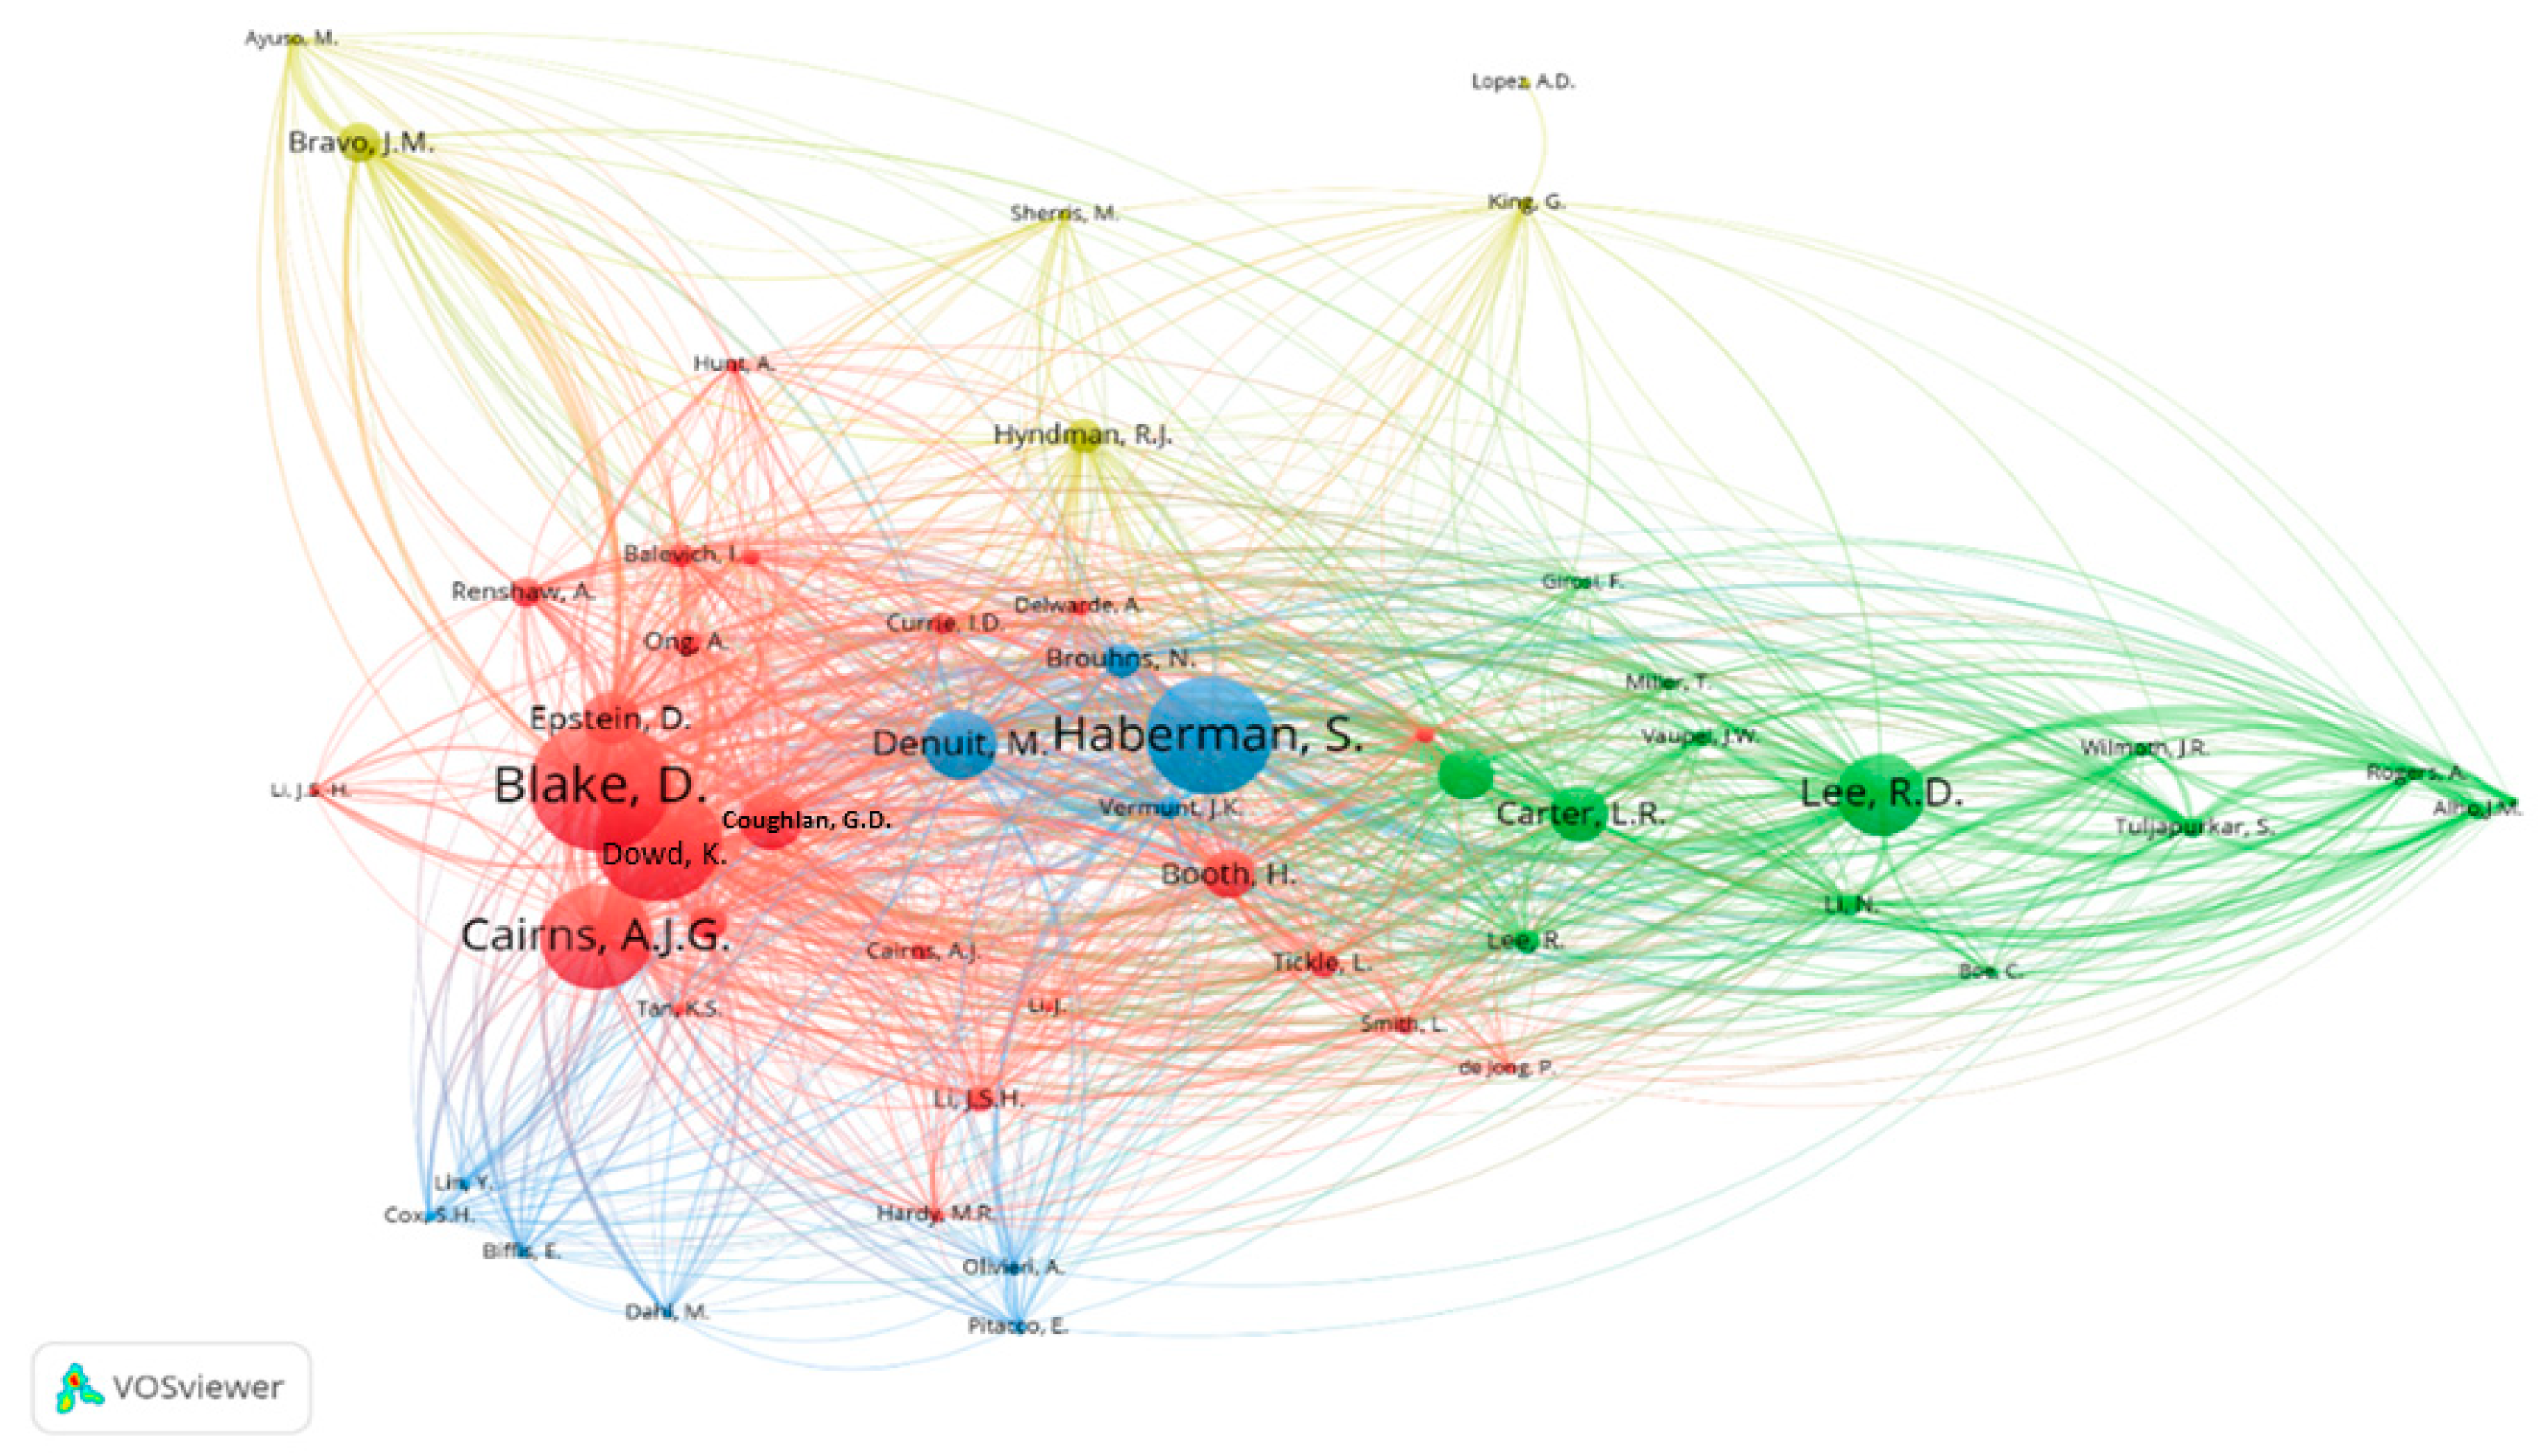
Table 2 presents the top 10 most active and most cited authors. The most active authors were classified based on the number of publications. For the most cited authors, a minimum threshold of 20 citations per author was applied to reduce small clusters (Moustakas 2022). Documents with a large number of authors were ignored. Li J.S.H. has the highest number of publications, with nine documents, and author Blake D. has the highest number of citations, with 256 citations. It is worth noting that Cairns A.J.G. appears in both categories. The authors’ co-citation network was generated based on the thresholds mentioned above and is shown in Figure 3.
The authors’ co-citation network illustrates four clusters of authors, as identified by VOSviewer. Clusters were generated using the association strength method and clusters were determined by solving the optimisation problem (van Eck and Waltman 2014). The nodes indicate the author, and the size of the nodes indicates the number of documents relating each author. Authors who are located closer to each other cite similar publications (van Eck and Waltman 2014). Each node is attached with a link that represents the co-citation relationship among authors and denoted by a link strength (Moustakas 2022; Shamsuddin et al. 2022). Among the top ten most cited authors in Table 2, six authors belong in the red cluster, two in the green cluster and two in the blue cluster. The authors in these clusters developed several stochastic mortality models that are widely used in research on mortality forecasting and modelling. For example, a model by Lee and Carter (1992) is one of the most prominent models in stochastic mortality modelling. The model incorporates age and period factors in modelling mortality rates and was first applied to the mortality experience of the United States population. Since its inception, many researchers have developed various extensions and variations of the Lee–Carter model. Renshaw and Haberman (2006) extended the Lee–Carter model to include additional cohort effects on the mortality experience the United Kingdom’s population, and Cairns et al. (2006) developed a mortality model with two period factors. Cairns et al. (2009) further extended Cairns et al. (2006) with the inclusion of cohort effects. Their findings show that the model performs well in describing mortality improvements of older-aged males in England, Wales and the United States.
Table 3 shows the top 10 most active sources based on the number of publications, total citations and the 2021 quartile. Insurance: Mathematics and Economics has the highest number of publications, with 21 documents. In terms of total citations, Insurance: Mathematics and Economics and International Journal of Forecasting were the most impactful in mortality forecasting and modelling, with total citations of 544 and 198, respectively. Both sources were also in the first quartile category. The top 10 sources were influential sources in mortality forecasting and modelling and were ranked in the first and second quartiles.
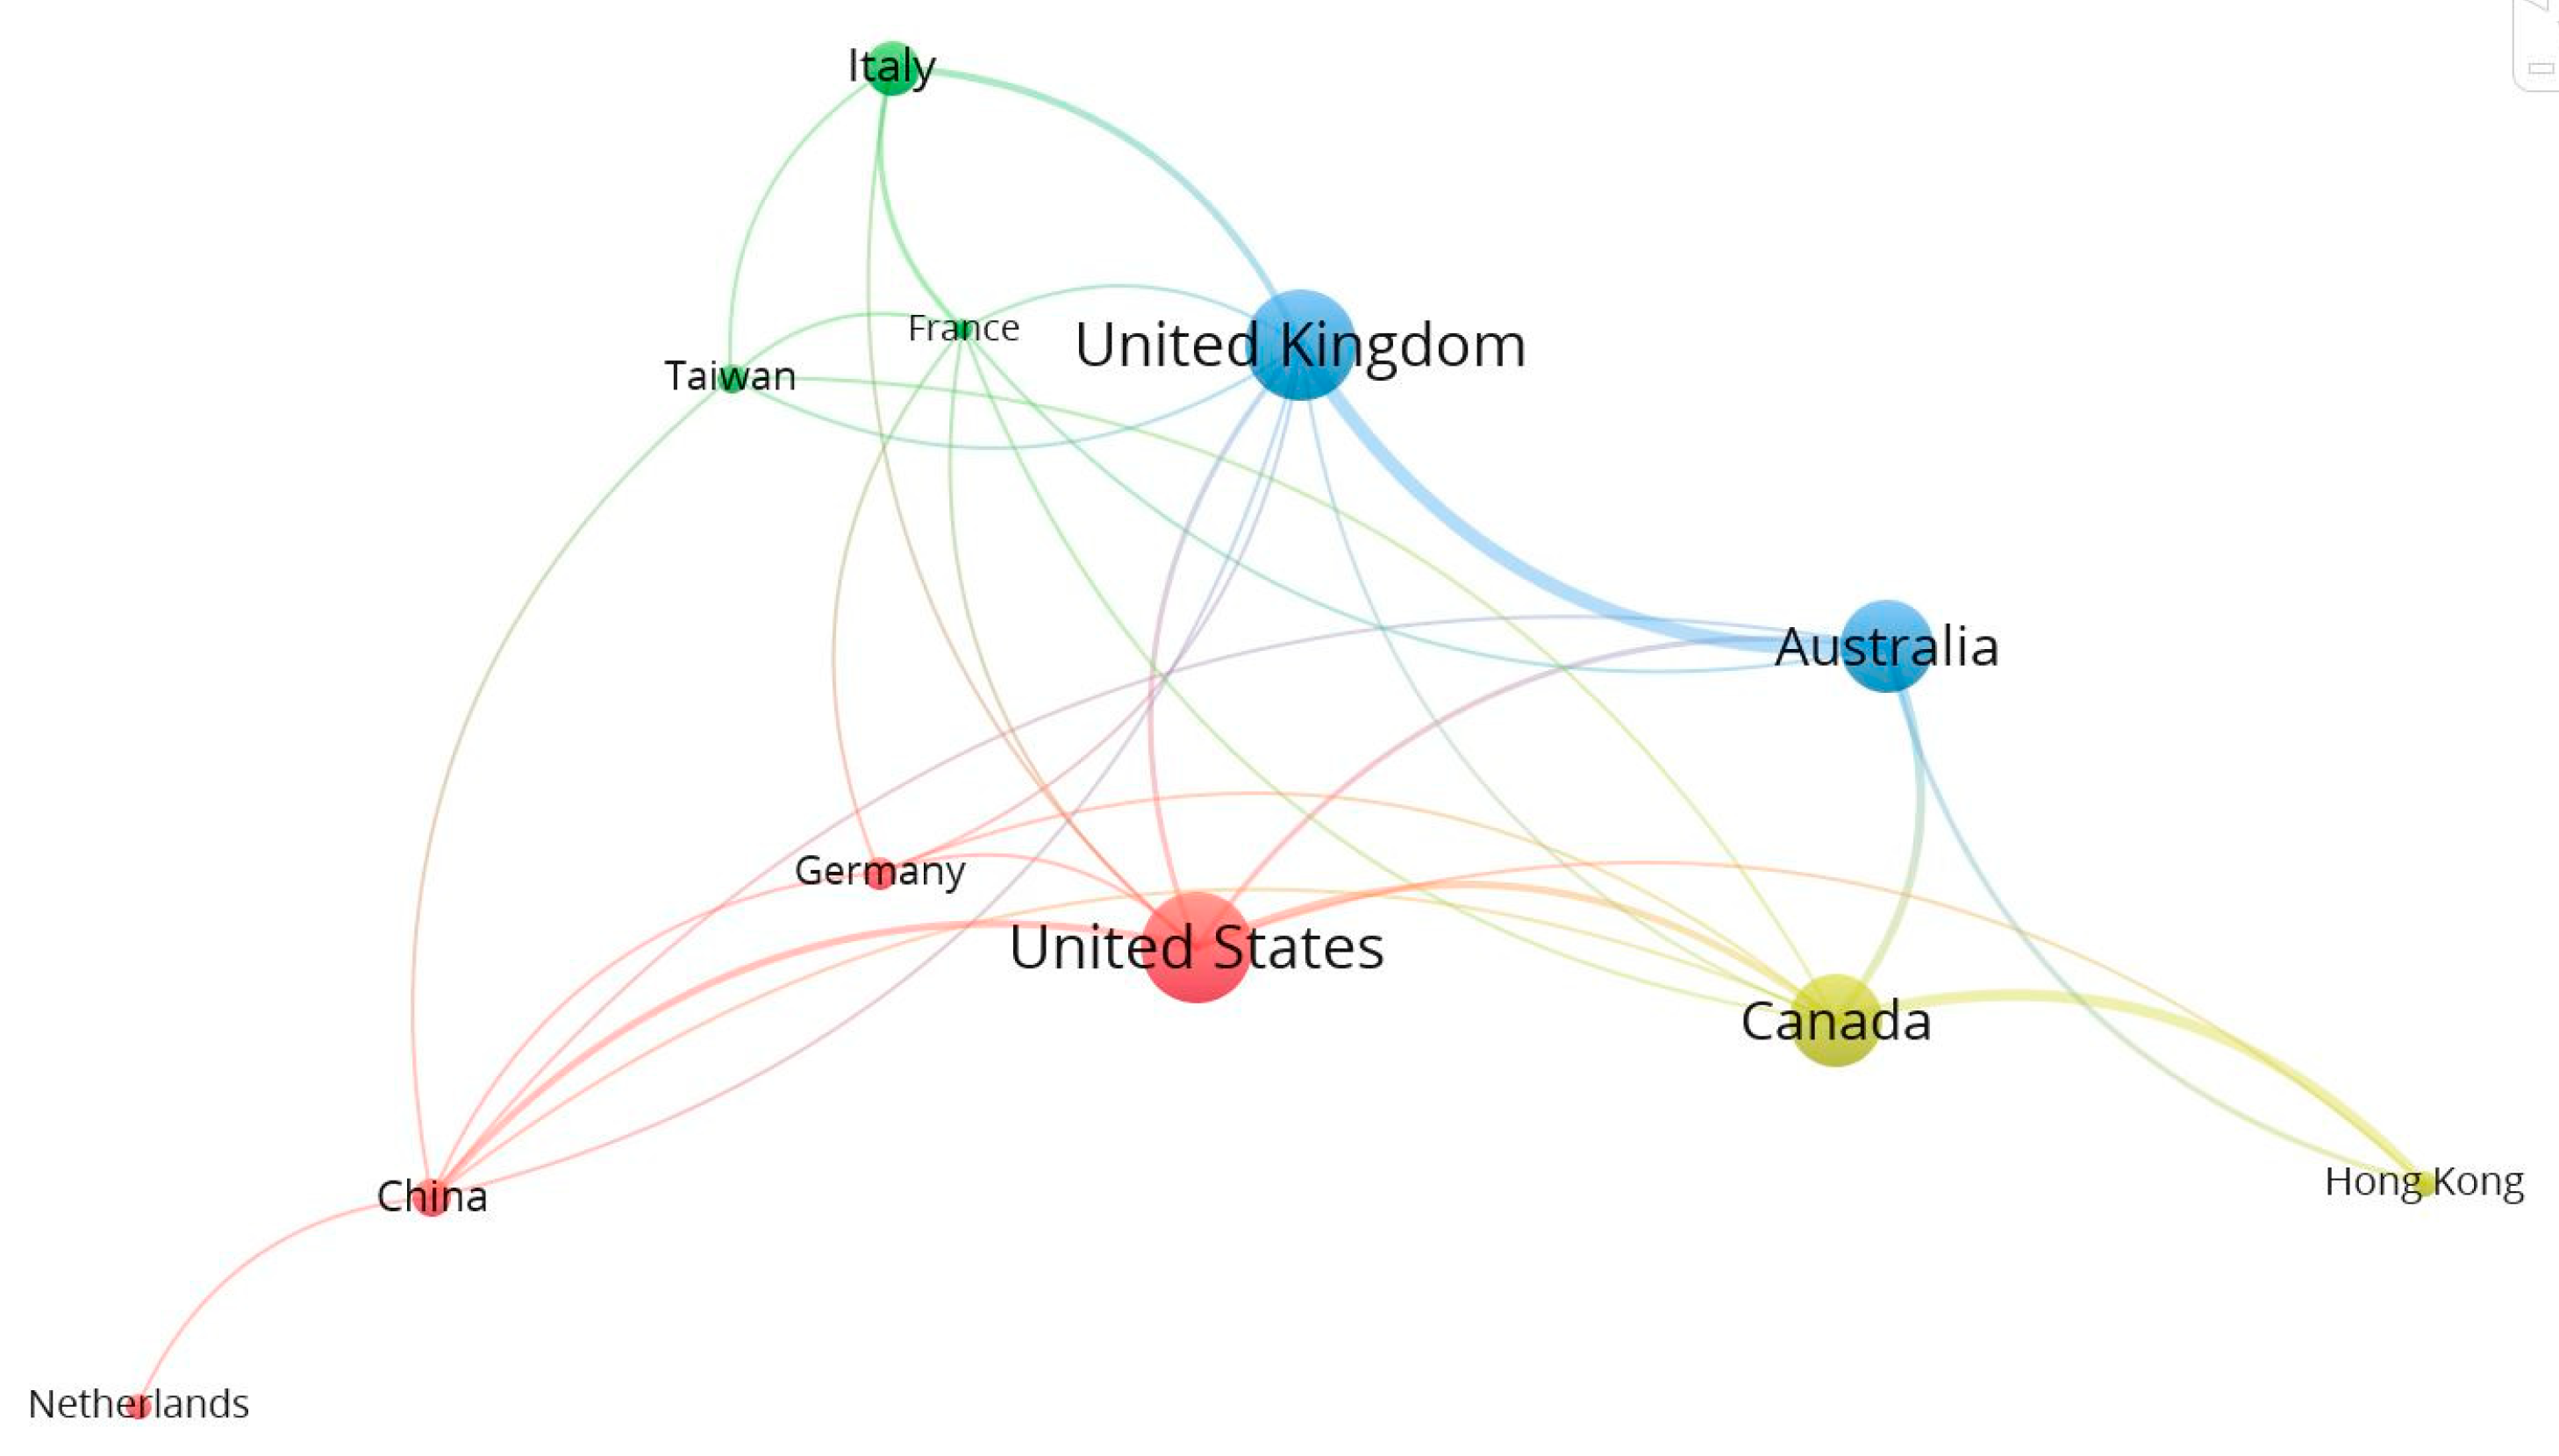
The top 10 most active countries based on co-authorship are shown in Table 4. Using VOSviewer, a co-authorship network of countries was generated. Only countries with at least five documents were included, which resulted in 11 countries in four clusters. These clusters provide information on countries that are closely related, with the relationship denoted by link strength. The visualisation of the co-authorship network and its clusters is shown in Figure 4. The United Kingdom has the highest number of publications, 26, and a total link strength of 19. In terms of citations, the United States has the highest number of citations, 1153. Most of the countries in Table 4 were from high-income and upper-middle-income countries (World Bank 2021).
Figure 4 presents the co-authorship network of the top 10 most active countries based on co-authorship in the topic of mortality forecasting models. The four clusters indicate that research on the topic of mortality forecasting and modelling extends beyond regional borders. For instance, green and red clusters show collaborations between researchers from regions of Europe and Asia. Clusters were generated using the association strength method and clusters were determined by solving the optimisation problem (van Eck and Waltman 2014). The nodes indicate country, the size of the nodes indicates the number of documents relating each country, and the lines indicate co-occurrence between countries. Occurrence of co-authorship between countries is represented by the thickness of the lines, where thicker lines represent more frequent occurrence of co-authorship between countries (Donthu et al. 2021).

3.3. Science Mapping: Co-Occurrences of Keywords

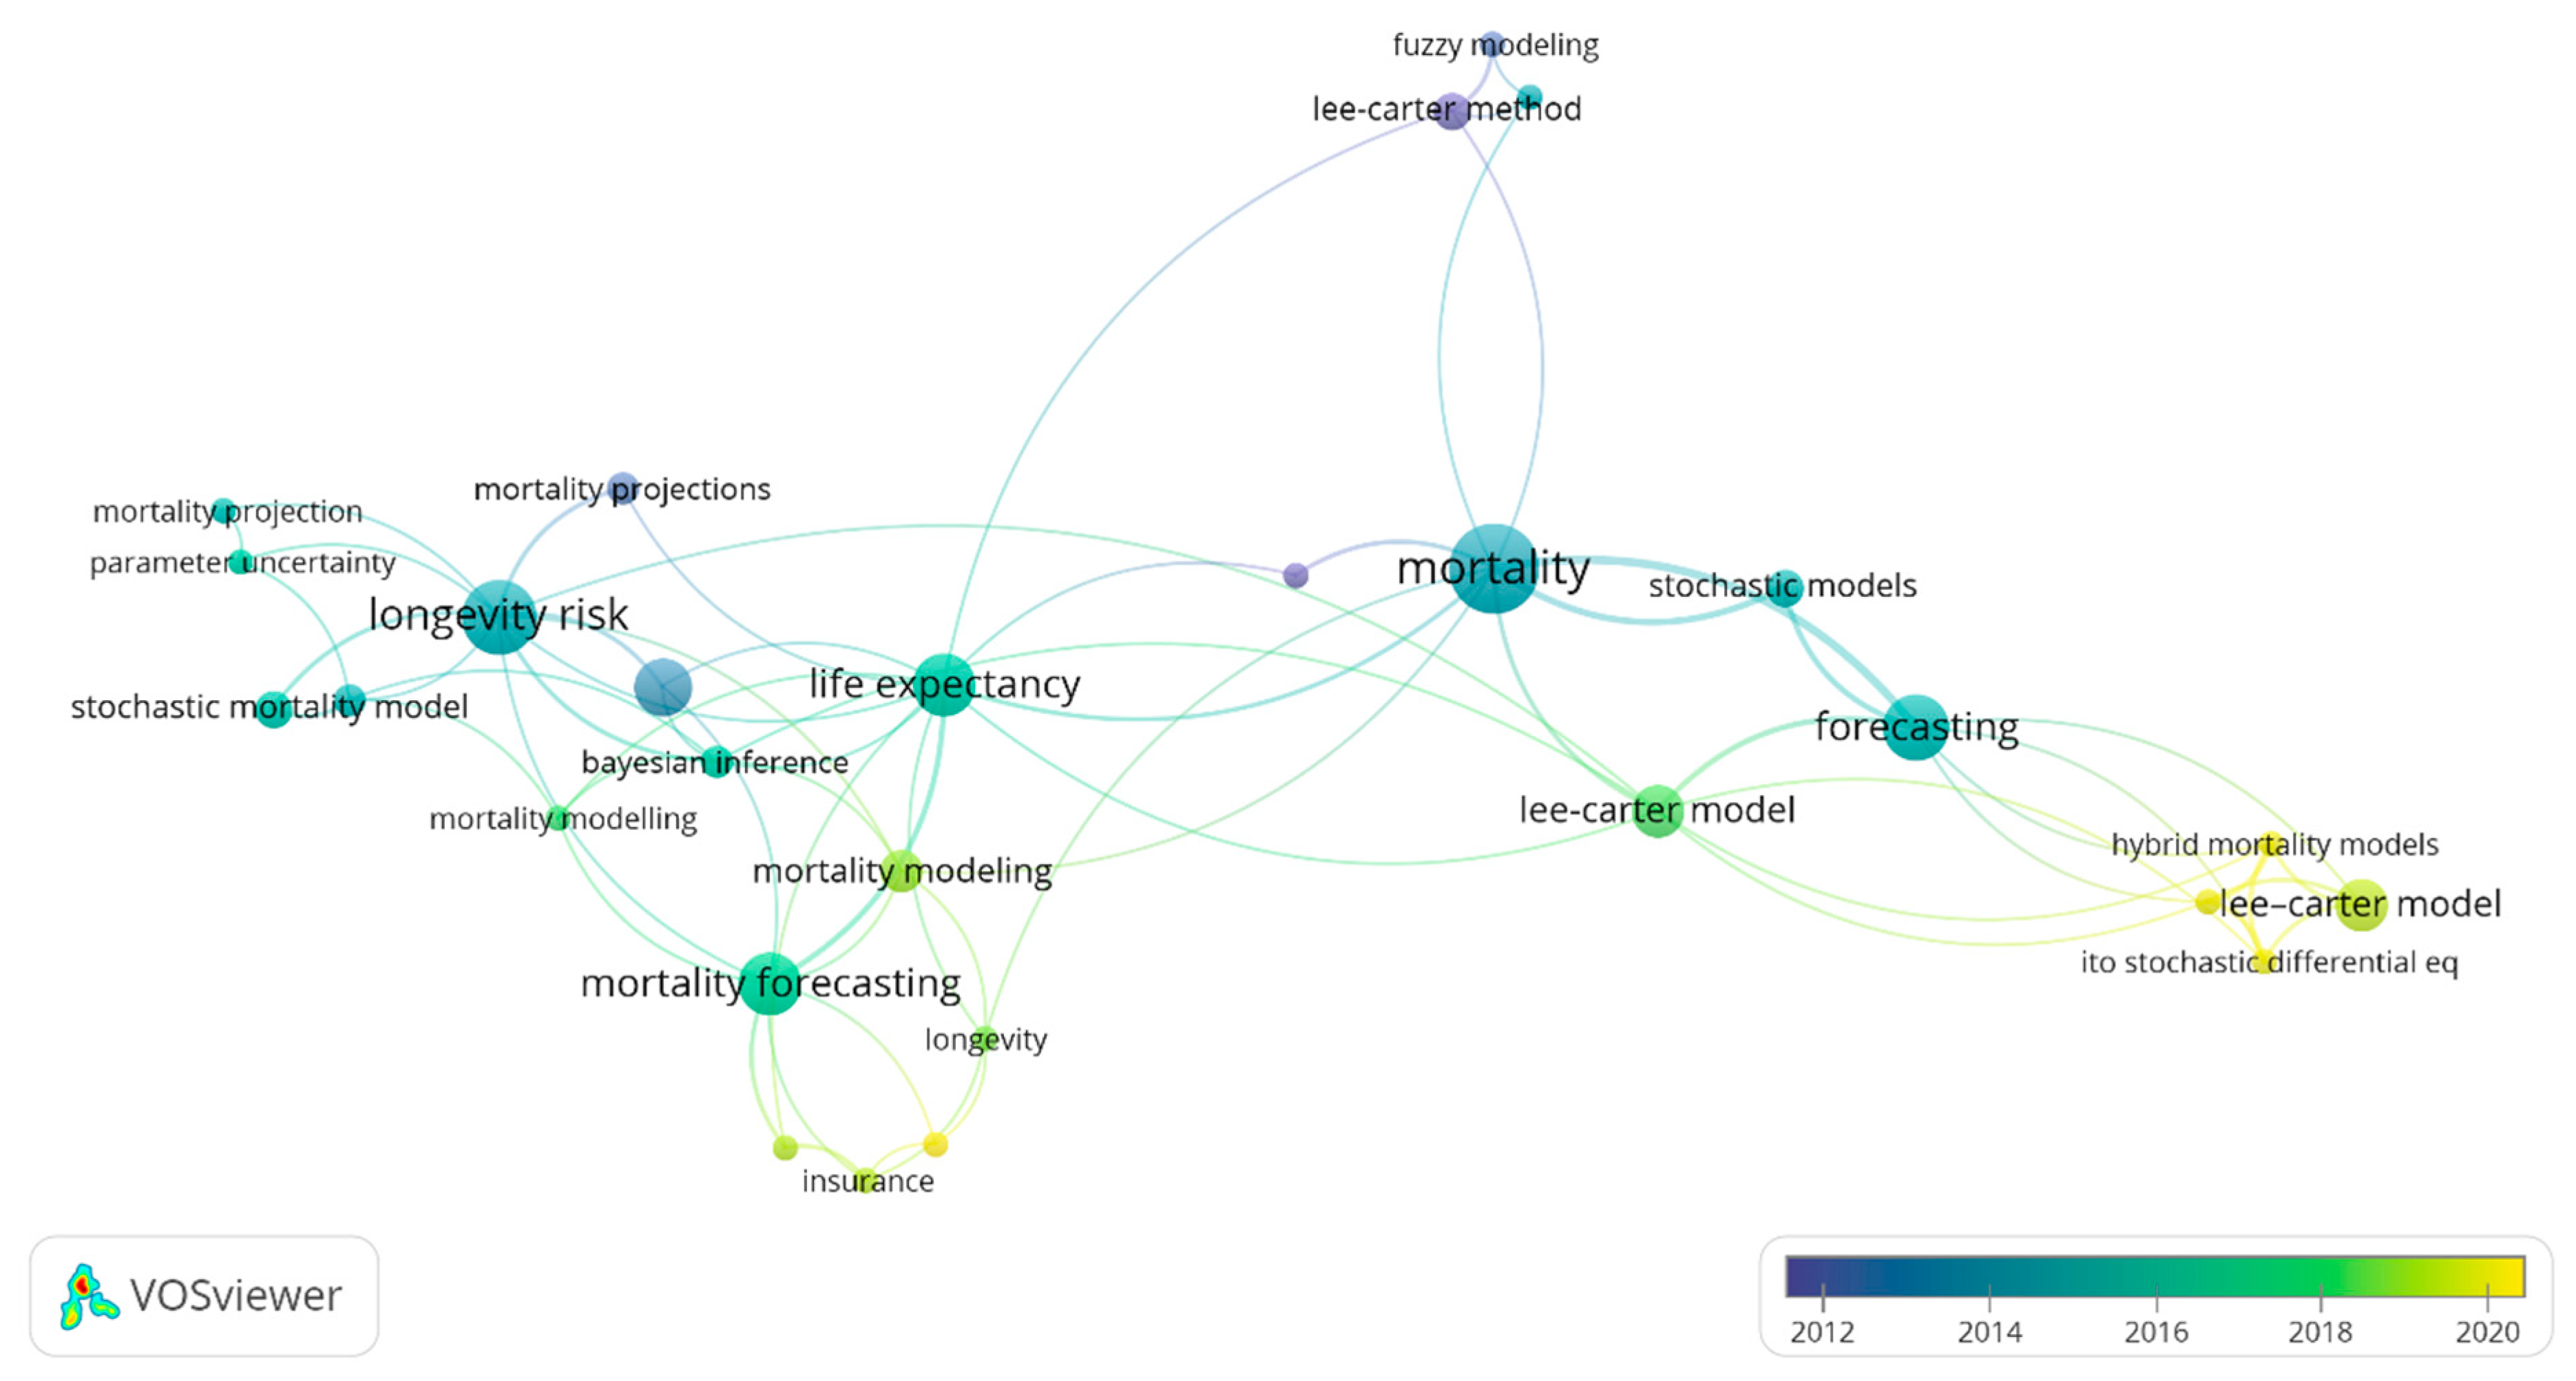
Figure 5 shows the keyword co-occurrence network with a minimum threshold of three occurrences. The colour represents the average publication year. Clusters were generated using the association strength method and clusters were determined by solving the optimisation problem (van Eck and Waltman 2014). The nodes indicate keywords, the size of the nodes indicates the number of documents relating each keyword, and the lines indicate co-occurrence between keywords. Larger nodes represent a higher number of documents with the corresponding keyword in the title and abstract, while closer nodes indicate that the keywords frequently occur together (van Eck and Waltman 2014). Of 387 keywords, only 30 meet the minimum threshold. The co-word analysis illustrates a mix of keywords which ranges from modelling (e.g., hybrid mortality model, Lee–Carter model), financial instruments (e.g., insurance, pension), mathematical and statistical methods (e.g., Bayesian inference, Ito stochastic differential equation, fuzzy modelling) and risks (e.g., parameter uncertainty, longevity risk). It is interesting to note that the Lee–Carter model remained a relevant research topic throughout the study period. Lee and Carter (1992) developed a model to forecast mortality rates of the United States population, and the model remains one of the most widely used mortality models. Several other models were developed as extensions and modifications to the Lee–Carter model. For example, Renshaw and Haberman (2006) included a cohort factor in their model, while Brouhns et al. (2002) modified the Lee–Carter model under a Poisson regression setting.
Based on Figure 5, we further summarised and reviewed the top 10 most cited publications between 2016 and 2021. We identified several emerging topics and future directions of research in mortality forecasting and modelling. Further details are given in the next section.

3.4. Emerging Research Topic and Future Research

We compiled the top 10 most cited publications between 2016 and 2021 to analyse emerging research topics. To narrow the results, a minimum of eight citations per document was set as the threshold, resulting in a total of 11 publications. However, in this analysis, only 10 publications were chosen, as shown in Table 5. The key topics discussed by these publications include (i) machine learning, (ii) the development of new models and approaches, (iii) generalised age–period–cohort (GAPC) models and (iv) the Lee–Carter mortality model.

3.4.1. Machine Learning

In general, machine learning can be applied to many areas of study (Bravo 2020; Karhade et al. 2019; Levantesi and Pizzorusso 2019; Ludkovski et al. 2018; Villegas et al. 2018). Of the ten publications, five applied machine learning techniques. For example, Karhade et al. (2019) overcame the problem of forecasting intermediate and long-term mortality in spinal metastatic disease by adopting several machine learning techniques. They concluded that machine learning is the best method to predict mortality due to its flexibility of modelling techniques. However, they also argued that for effective communication, the machine learning model should be easily interpreted by its users.
Karhade et al. (2019) developed five prediction models based on these algorithms, which are random forest, stochastic gradient boosting, neural network, support vector machine and penalised logistic regression. They found that stochastic gradient boosting performed better in predicting mortality. Furthermore, Levantesi and Pizzorusso (2019) applied machine learning techniques such as random forest, decision tree and gradient boosting to calibrate a parameter which was then fitted to the standard stochastic mortality model. The results show that random forest outperformed other algorithms and that the standard stochastic mortality model can be improved by applying machine learning techniques. It is worth noting that both studies were divided into training and testing datasets, and the cross-validation method was used to assess the predictive performance (Karhade et al. 2019; Levantesi and Pizzorusso 2019).
From a stochastic mortality model point of view, Bravo (2020), Levantesi and Pizzorusso (2019) and Villegas et al. (2018) applied machine learning together with several generalised age–period–cohort (GAPC) models. Levantesi and Pizzorusso (2019) applied machine learning algorithms to estimate parameters in stochastic mortality models. Their results showed an improved model fitting and the ability to identify patterns that standard mortality models failed to capture. Bravo (2020) assigned weightages probabilistically to GAPC models in their final forecasting model. They also argued that the method can capture model risk, as compared to individual stochastic mortality models. To overcome the issue of model risk, Villegas et al. (2018) developed the R package “StMoMo” that is now widely used in scientific literature on mortality modelling and forecasting. They highlighted that this package could facilitate the understanding of mortality models due to its easy application and the comparison of several other models in it.

3.4.2. Development of New Model and Approach

Of the 10 publications, five developed new approaches to model mortality rates. For instance, Boonen and Li (2017) combined observable and latent factors in a single model by incorporating GDP into the mortality model. They argued that usually, mortality models with latent factors are not easily interpretable, and mortality forecasts tend to diverge in the long run. To overcome these issues, they modelled mortality and economic growth in a multipopulation setting. Another method to ensure the coherence of forecasting is by forecast reconciliation (Li et al. 2019). For example, Li et al. (2019) concluded that the forecast reconciliation approach provides better accuracy than the base forecasts. The study can be extended to include probabilistic forecast reconciliation for mortality rates. Similarly, Bravo (2020) also adopted probabilistic weightages in the final forecasting model. It is interesting to note that the probabilistic mortality projection model seems to be an emerging research topic in the scientific literature.
Besides the standard stochastic mortality model, Tsai and Lin (2017) applied the Bülhmann credibility approach to forecast mortality rates. They found that forecasts using the Bülhmann credibility approach can capture the decreasing trend in projected mortality rates, and it performs better than standard stochastic mortality models. On the other hand, Ludkovski et al. (2018) proposed a new methodology to handle issues that involve lower credibility. They applied Gaussian process regression in the process to graduate mortality rates that can quantify uncertainty as compared to other traditional actuarial graduating techniques.

3.4.3. Generalised Age–Period–Cohort (GAPC) Models

According to Villegas et al. (2018), a GAPC stochastic model can be classified based on four components, which are random component, systematic component, link function and a set of parameter constraints. Several studies compared various GAPC models with different datasets and age groups (Bozikas and Pitselis 2018; Bravo 2020; Levantesi and Pizzorusso 2019; Villegas et al. 2018). For example, Villegas et al. (2018) and Levantesi and Pizzorusso (2019) focused on ages 0–100, while Bravo (2020) and Bozikas and Pitselis (2018) exclusively focused on older age groups (50–95 years old and 60–89 years old, respectively). The focus of past studies was on developed countries. It is interesting to note that there is an opportunity for future research to compare the performance of these models on younger age groups and other developing countries.
Meanwhile, of the ten publications, the Lee–Carter model was studied in six (Bozikas and Pitselis 2018; Bravo 2020; Levantesi and Pizzorusso 2019; Li et al. 2019; Tsai and Lin 2017; Villegas et al. 2018). This shows that the Lee–Carter model remains a relevant base model and a pioneer in forecasting mortality. Since its development, the Lee–Carter model has been adopted in many mortality-related studies. The model has become a prominent stochastic mortality model because of its simplicity and easily interpretable parameters. Since its development, many modifications and extensions have been made to the model. Parameter estimation in the Lee–Carter model has developed from singular value decomposition (SVD) (Bozikas and Pitselis 2018; Tsai and Lin 2017) to a Poisson setting (Bravo 2020; Levantesi and Pizzorusso 2019; Villegas et al. 2018). Furthermore, several studies extended the Lee–Carter model to include an additional cohort factor (Renshaw and Haberman 2006) and a quadratic age effect (Cairns et al. 2009). The following section further discusses the Lee–Carter model.

3.4.4. Lee–Carter Mortality Model

According to Booth and Tickle (2008), the mortality forecasting model can be categorised into three models, which are expectation, explanatory and extrapolative models. The expectation model is based on expert opinion, the explanatory model is based on some certain causes of death with several risk factors and the extrapolative model is based on past mortality trends. The extrapolative model can reduce the problem of subjective judgments in the expectation model. It is also suitable for long-term forecasting as compared to the explanatory model, which is usually limited to short-term forecasting. Extrapolative mortality forecasting models are often used in the fields of actuarial and demography to quantify mortality and longevity risks. Some of the earlier literature on these models include Heligman and Pollard (1980), McNown and Rogers (1989) and Lee and Carter (1992). Lee and Carter (1992) proposed a bilinear factor mortality model which performs well on U.S. mortality data. Since its development, the Lee–Carter model has remained a relevant and prominent mortality forecasting model for its simplicity and easily interpretable parameters (Booth and Tickle 2008).
Following its development, many researchers developed many variants of the Lee–Carter model. These variants include modifications of its statistical foundation and the development of new models (Cairns et al. 2011). Lee and Miller (2001) adjusted for jump-off rates in the forecasts of mortality rates. The results showed that forecasts are better after adjustments of jump-off rates. Moreover, in terms of modifications of age effects, Delwarde et al. (2007) applied the p-splines technique to overcome the problem of a lack of smoothness in the estimated b x ′s. In terms of period effects, Booth et al. (2002) and De Jong and Tickle (2006) proposed an improved model of k t to Australian mortality data. Modifications of the model’s fitting methodology have developed from singular value decomposition (SVD) (Lee and Carter 1992; Tsai and Lin 2017; Bozikas and Pitselis 2018; Nor et al. 2018) to Poisson (Brouhns et al. 2002; Villegas et al. 2018; Levantesi and Pizzorusso 2019) and machine learning techniques (Levantesi and Pizzorusso 2019). Brouhns et al. (2002) modelled the number of deaths under a Poisson setting for Belgian mortality data. They suggested that the new method allows for application in life insurance. Meanwhile, Demirel and Basak (2017), Andrés-Sánchez and Puchades (2019) and Koissi and Shapiro (2006) applied fuzzy modelling to the Lee–Carter model. Other variants of this model were obtained by either extending or developing new models. Some of these extensions are the inclusion of cohort effects, age–period–cohort effects, multipopulation models and observable factors.
One of the issues of the Lee–Carter model is that it exhibits a poor fit for countries with cohort effects (Plat 2009). For instance, mortality rates for some countries such as England and Wales experienced cohort effects in addition to the age and period effects (Cairns et al. 2008). Hence, Renshaw and Haberman (2006) developed a model that includes cohort effects, which are the year-of-birth effects. Often denoted by γ t x , the year-of-birth effect is used to explain that the mortality improvement of individuals varies by their year of birth. To overcome the issue of robustness, Currie (2006) simplified the method proposed by Renshaw and Haberman (2006). Cairns et al. (2008) also included cohort effects in a multifactor age–period model on male mortality of higher age groups in England and Wales. Plat (2009) developed a new age–period–cohort model that incorporates the favourable features of Lee and Carter (1992), Renshaw and Haberman (2006), Currie (2006), Cairns et al. (2006) and Cairns et al. (2009). The model fits well to U.S. male mortality data.
The Lee–Carter model is suitable to be used on a single population and it often leads to diverged forecasts when used to forecast for multiple populations. To overcome this, Li and Lee (2005) developed an extension of the Lee–Carter model that provides coherent mortality forecasts of groups with similar socioeconomic conditions. Other types of multipopulation models include the joint- k model (Carter and Lee 1992) and the co-integrated model (Li and Hardy 2011). For further reading on multipopulation mortality models, see Villegas et al. (2017).
Most of the stochastic mortality models, including the Lee–Carter model, do not incorporate other assumptions, as they are only described by latent factors. The interpretation of these models is usually not straightforward. Several studies have extended the Lee–Carter model to include observable factors such as economic growth (Niu and Melenberg 2014; Hanewald 2011) and temperature changes (Seklecka et al. 2017). These models perform better with the inclusion of observable factors, and they provide more interpretable forecasts. Moreover, several authors have applied the Lee–Carter model to forecast fertility (Lee 1993; Hyndman and Ullah 2007; Härdle and Myšičková 2009) and cancer incidence (Yue et al. 2018).
Figure 6 provides a graphical representation summarizing the Lee–Carter model with its modifications and extensions as described in this section.

3.5. Co-Occurrences of Keywords: COVID-19 Mortality Modelling and Forecasting

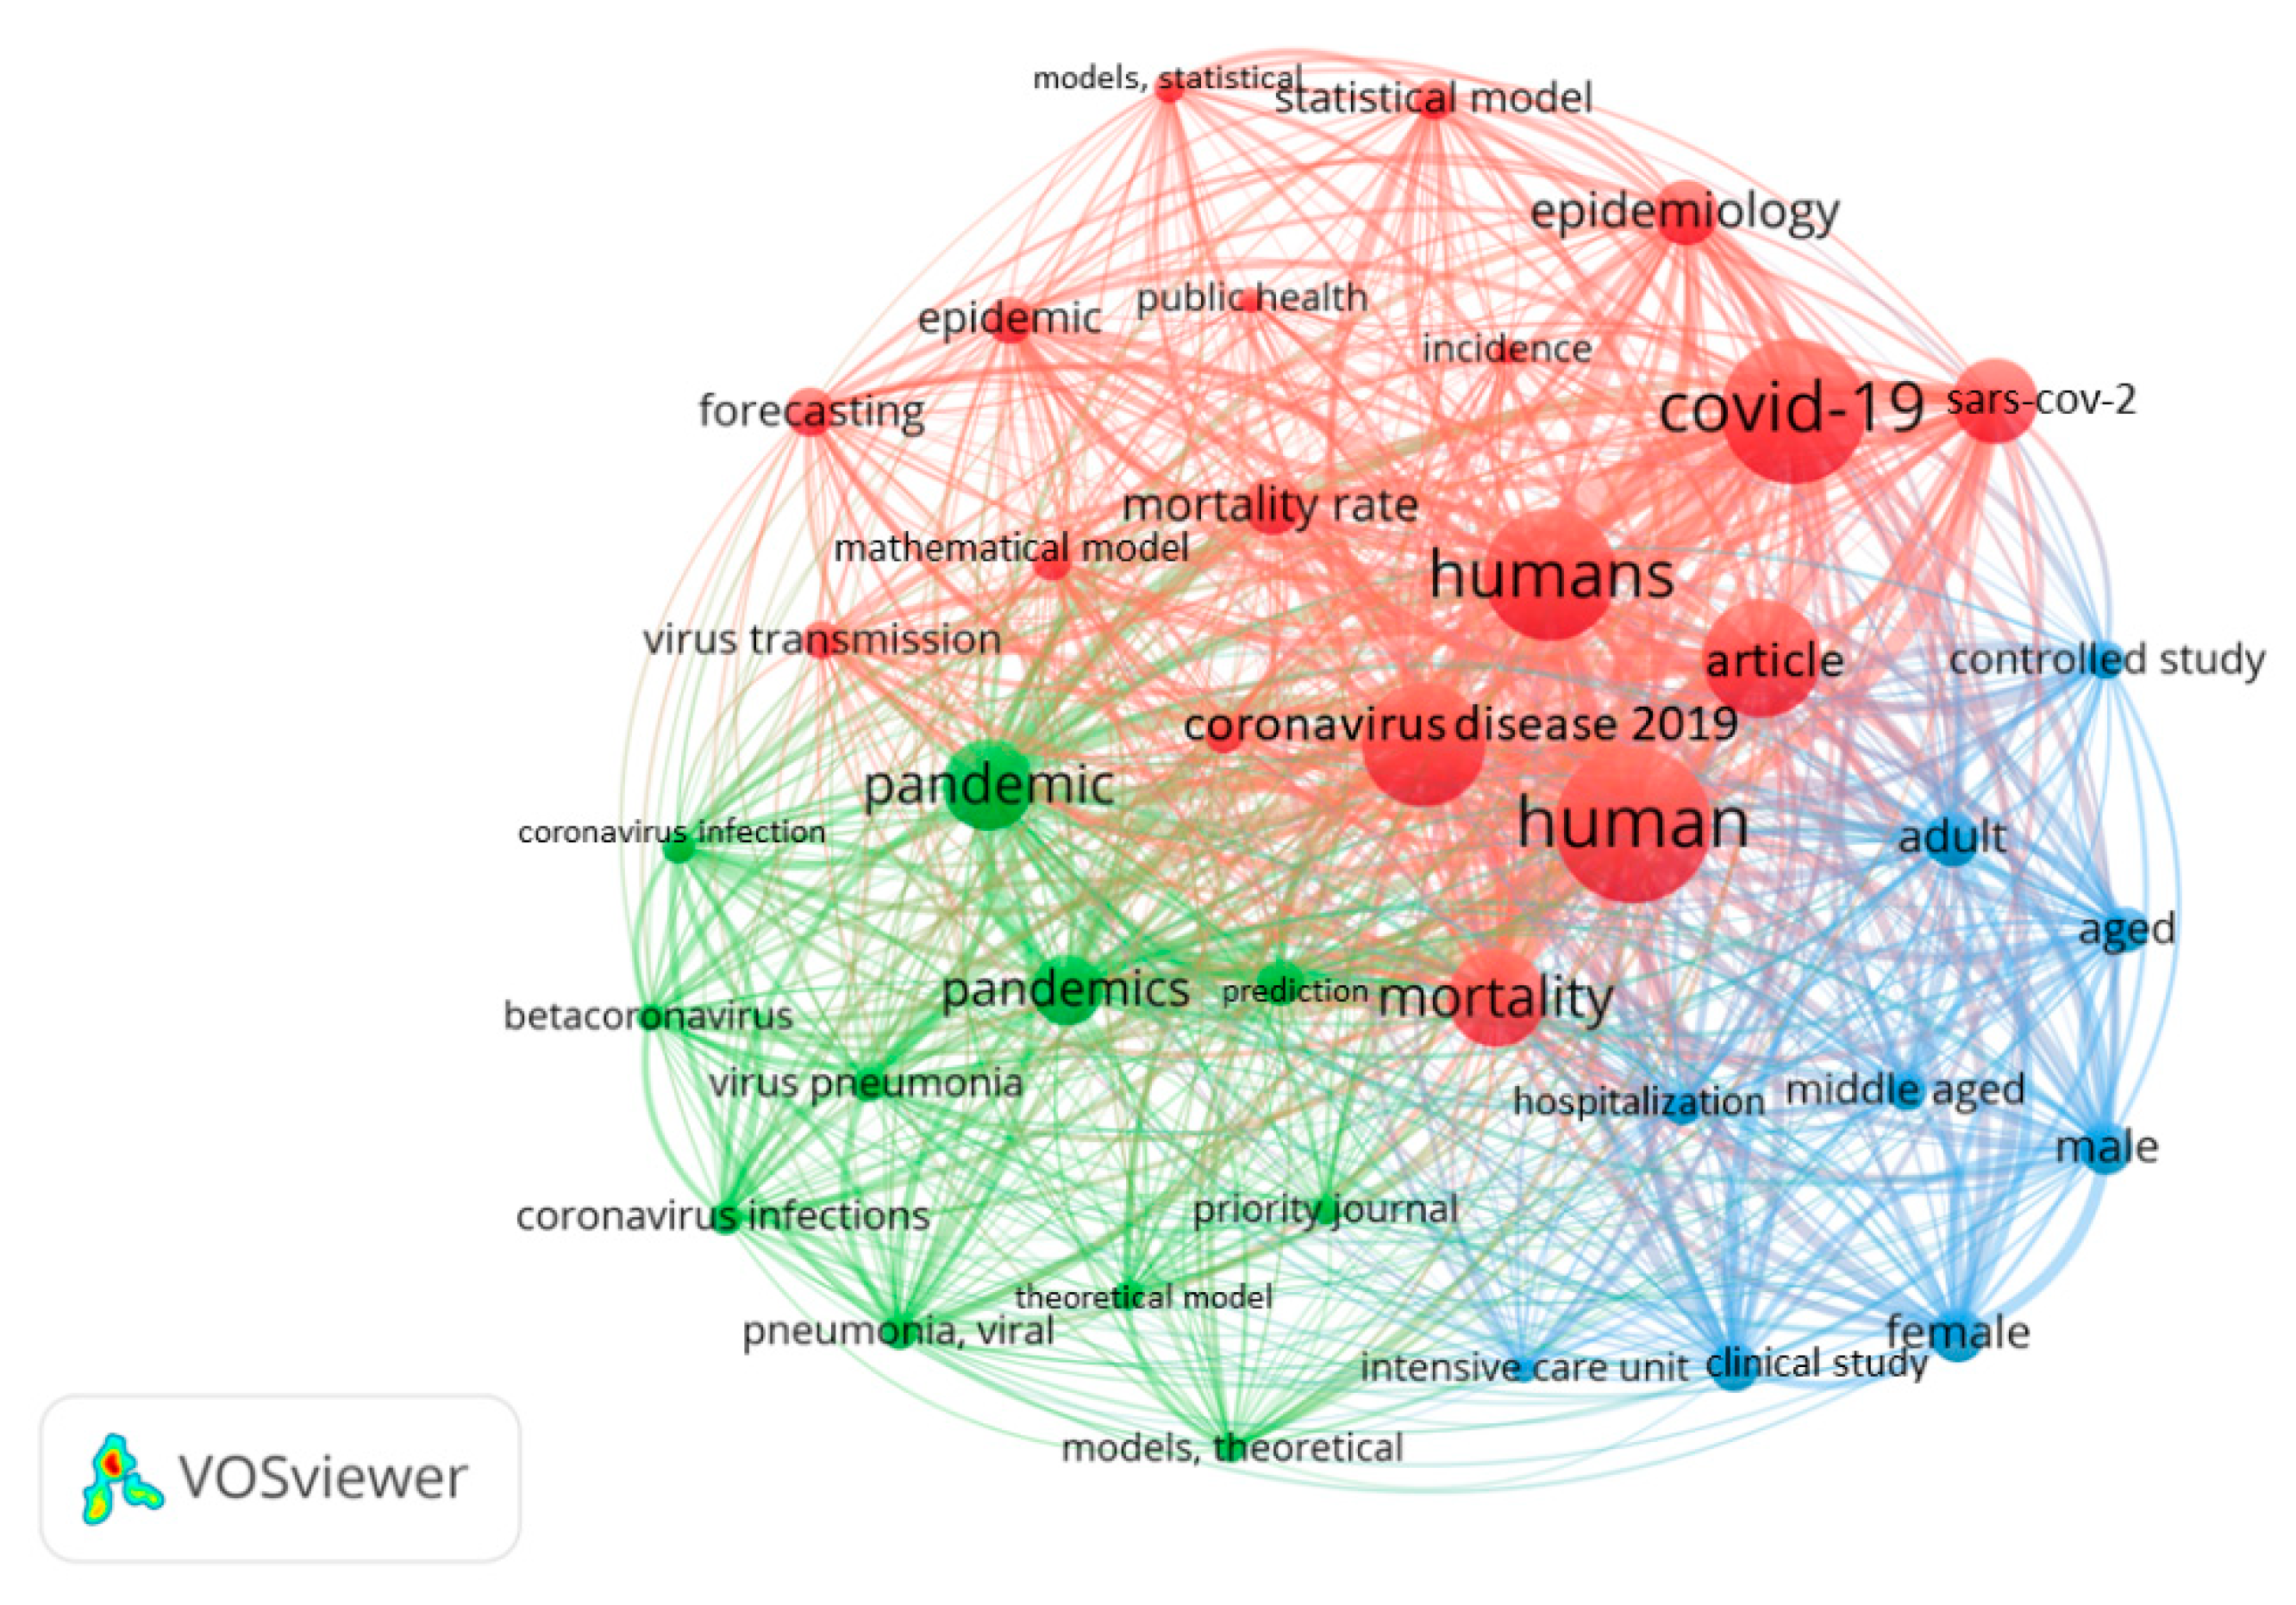
We further analysed the co-occurrence of keywords during the coronavirus disease (COVID-19) outbreak. Similar searching strategies as in Section 2.2 were conducted, with the addition of “COVID-19” and “coronavirus” keywords in the search string. The publications were limited to the years 2020 and 2021 to capture publications during the pandemic period. The keyword co-occurrence network is shown in Figure 7.
Figure 7 shows that the keywords are categorised into three clusters. Clusters were generated using the association strength method. The nodes indicate keywords, the size of the nodes indicates the number of documents relating each keyword, and the lines indicate co-occurrence between keywords. Larger nodes represent a higher number of documents with the corresponding keyword in the title and abstract, while closer nodes indicate that the keywords frequently occur together (van Eck and Waltman 2014).
Cluster 1 (red) generally explores the application of mathematical and statistical models in modelling and forecasting virus transmission (Post et al. 2020; Yang and Wang 2021), mortality due to COVID-19 (Iuliano et al. 2021) and COVID-19 vaccination (Albani et al. 2021). For example, Yang and Wang (2021) and Post et al. (2020) studied the transmission of COVID-19 disease. They concluded that the transmission and spread of the disease are mainly influenced by the environment, population size and other factors (Post et al. 2020; Yang and Wang 2021). Cluster 2 (green) broadly describes the pandemic in terms of viral infections and pneumonia. Few studies explored the modelling of mortality risks relating to pneumonia in a community. For example, Halasz et al. (2021) adopted a machine learning-based score to predict 30-day mortality for patients with COVID-19 pneumonia. They concluded that the mortality of these patients can be predicted effectively. Finally, publications in cluster 3 (blue) generally applied modelling analysis in the context of clinical and controlled studies. For instance, Nair et al. (2021) and Wang et al. (2021) analysed different characteristics and factors affecting patients with COVID-19. Their findings can assist clinical professionals in classifying the disease severity and outcome in patients with COVID-19.
Therefore, analysing the co-occurrence of keywords shows that modelling can facilitate modelling and forecasting of pandemics or diseases in terms of transmission rates, mortality rates and vaccination rates. It can also assist future researchers to determine and explore topics related to COVID-19 mortality modelling and forecasting.

4. Conclusions

This study contributes to the field by providing a bibliometric analysis of publications on mortality forecasting models between 2000 and 2021. Publications on this topic showed an increasing trend throughout the study period, and 83.3% of publications were articles. Over 50% of the total documents were published between 2016 and 2021, which shows that there has been increasing interest in the field of mortality modelling and forecasting in recent years. Moreover, the most active author is Li J.S.H., with a total of nine documents, while the most cited author is Blake D., with total of 256 citations. The top three most active sources were Insurance: Mathematics and Economics, North American Actuarial Journal and Risks, with a total of 21, 14 and 9 documents, respectively. Moreover, the United Kingdom and the United States are among the most active countries in the research of mortality forecasting models.
In terms of keyword occurrence analysis, the results show a mix of keywords that describe modelling, financial instruments, mathematical and statistical methods, and risks, among others. It is interesting to note that the Lee–Carter mortality model has remained a relevant model since its development in 1992. The analysis also shows that there has been a recent interest in “hybrid mortality model”, “insurance” and “pension”. Further analysing the top 10 most cited publications, another trending topic among researchers is machine learning. For example, in future research, researchers may want to incorporate machine learning techniques to existing mortality forecasting models, or focus on the application of mortality models in insurance and pension plans. This study can be a guide for future research exploring emerging topics related to stochastic mortality modelling and forecasting. Such topics include machine learning, the development of new models and approaches, generalised age–period–cohort (GAPC) models and the Lee–Carter mortality model.
A limitation of this study should be addressed. This study only focuses on data obtained from the Scopus database. Scopus was chosen as it has a rigorous selection process and it is one of the largest citation databases (Baas et al. 2020). Future research may incorporate data from other databases such as Web of Science or PubMed. Finally, the findings of this study may benefit researchers in determining and exploring emerging trends and topics related to modelling and forecasting mortality.

Author Contributions

Conceptualisation, N.R. and R.R.; methodology, N.R.; software, N.R.; resources, N.R.; writing—original draft preparation, N.R.; writing—review and editing, R.R.; visualisation, N.R.; supervision, R.R. All authors have read and agreed to the published version of the manuscript.

Funding

No additional external funding was received for this study.

Data Availability Statement

The data presented in this study are available upon request from the corresponding author.

Acknowledgments

Norkhairunnisa Redzwan would like to acknowledge the Ministry of Higher Education (MOHE) of Malaysia and Universiti Teknologi MARA (UiTM) for sponsoring her PhD studies at Universiti Kebangsaan Malaysia (UKM), under Skim Latihan Akademik Bumiputera (SLAB).

Conflicts of Interest

The authors declare no conflict of interest.

References

  1. Albani, Vinicius, Jennifer Loria, Eduardo Massad, and Jorge Zubelli. 2021. The impact of COVID-19 vaccination delay: A data-driven modeling analysis for Chicago and New York City. Vaccine 39: 6088–94. [Google Scholar] [CrossRef]
  2. Andrés-Sánchez, Jorge de, and Laura González-Vila Puchades. 2019. A fuzzy-random extension of the Lee-Carter mortality prediction model. International Journal of Computational Intelligence Systems 12: 775–94. [Google Scholar] [CrossRef] [Green Version]
  3. Arana-Barbier, Pablo José. 2020. The quantitative and qualitative scientific production: A bibliometric study of the five main Asian economies in R&D. Malaysian Journal of Library & Information Science 25: 95–109. [Google Scholar]
  4. Aria, Massimo, and Corrado Cuccurullo. 2017. bibliometrix: An R-tool for comprehensive science mapping analysis. Journal of Informetrics 11: 959–75. [Google Scholar] [CrossRef]
  5. Ayerbe, Luis, Salma Ayis, Siobhan Crichton, Anthony Rudd, and Charles Wolfe. 2014. Explanatory factors for the increased mortality of stroke patients with depression. Neurology 83: 2007–12. [Google Scholar] [CrossRef] [PubMed] [Green Version]
  6. Baas, Jeroen, Michiel Schotten, Andrew Plume, Grégoire Côté, and Reza Karimi. 2020. Scopus as a curated, high-quality bibliometric data source for academic research in quantitative science studies. Quantitative Science Studies 1: 377–86. [Google Scholar] [CrossRef]
  7. Badhwar, Vinay, Eric Peterson, Jeffrey Jacobs, Xia He, Matthew Brennan, Sean O’Brien, Rachel Dokholyan, Kristopher George, Steven Bolling, David Shahian, and et al. 2012. Longitudinal outcome of isolated mitral repair in older patients: Results from 14,604 procedures performed from 1991 to 2007. Annals of Thoracic Surgery 94: 1870–79. [Google Scholar] [CrossRef]
  8. Boonen, Tim, and Hong Li. 2017. Modeling and forecasting mortality with economic growth: A multipopulation approach. Demography 54: 1921–46. [Google Scholar] [CrossRef]
  9. Booth, Heather, and Leonie Tickle. 2008. Mortality modelling and forecasting: A review of methods. Annals of Actuarial Science 3: 3–43. [Google Scholar] [CrossRef]
  10. Booth, Heather, John Maindonald, and Len Smith. 2002. Applying Lee-Carter under conditions of variable mortality decline. Population Studies 56: 325–36. [Google Scholar] [CrossRef]
  11. Bozikas, Apostolos, and Georgios Pitselis. 2018. An empirical study on stochastic mortality modelling under the age-period-cohort framework: The case of Greece with applications to insurance pricing. Risks 6: 44. [Google Scholar] [CrossRef]
  12. Bravo, Jorge. 2020. Longevity-linked life annuities: A Bayesian model ensemble pricing approach. Paper presented at 20th Conference of the Portuguese Association of Information Systems, Portugal, October 16–17. [Google Scholar]
  13. Brouhns, Natacha, Michel Denuit, and Jeroen Vermunt. 2002. A Poisson log-bilinear regression approach to the construction of projected lifetables. Insurance: Mathematics and Economics 31: 373–93. [Google Scholar] [CrossRef] [Green Version]
  14. Bucher, Slavomír. 2018. Bibliometric analysis of Central European journals in the Web of Science and JCR Social Science Edition. Malaysian Journal of Library & Information Science 23: 95–110. [Google Scholar]
  15. Cairns, Andrew, David Blake, and Kevin Dowd. 2006. A two-factor model for stochastic mortality with parameter uncertainty: Theory and calibration. Journal of Risk and Insurance 73: 687–718. [Google Scholar] [CrossRef]
  16. Cairns, Andrew, David Blake, and Kevin Dowd. 2008. Modelling and management of mortality risk: A review. Scandinavian Actuarial Journal 2008: 79–113. [Google Scholar] [CrossRef]
  17. Cairns, Andrew, David Blake, Kevin Dowd, Guy Coughlan, David Epstein, Alen Ong, and Igor Balevich. 2009. A quantitative comparison of stochastic mortality models using data from England and Wales and the United States. North American Actuarial Journal 13: 1–35. [Google Scholar] [CrossRef]
  18. Cairns, Andrew, David Blake, Kevin Dowd, Guy D. Coughlan, David Epstein, and Marwa Khalaf-Allah. 2011. Mortality density forecasts: An analysis of six stochastic mortality models. Insurance: Mathematics and Economics 48: 355–67. [Google Scholar] [CrossRef] [Green Version]
  19. Carter, Lawrence, and Ronald Lee. 1992. Modeling and forecasting US sex differentials in mortality. International Journal of Forecasting 8: 292–411. [Google Scholar] [CrossRef]
  20. Currie, Iain. 2006. Smoothing and Forecasting Mortality Rates with p-Splines, Conference Presentation, Institute and Faculty of Actuaries. Available online: http://www.actuaries.org.uk/documents/smoothing-and-forecasting-mortality-rates-p-splines-slides (accessed on 26 July 2022).
  21. De Jong, Piet, and Leonie Tickle. 2006. Extending Lee-Carter mortality forecasting. Mathematical Population Studies 13: 1–18. [Google Scholar] [CrossRef]
  22. Delwarde, Antoine, Michel Denuit, and Paul Eilers. 2007. Smoothing the Lee-Carter and Poisson log-bilinear models for mortality forecasting: A penalized log-likelihood approach. Statistical Modelling 7: 29–48. [Google Scholar] [CrossRef]
  23. Demirel, Duygun Fatih, and Melek Basak. 2017. Human mortality modeling with a fuzzy approach based on singular value decomposition technique. Studies in Computational Intelligence 669: 197–215. [Google Scholar]
  24. Deng, Yinglu, Patrick Brockett, and Richard MacMinn. 2012. Longevity/mortality risk modeling and securities pricing. Journal of Risk and Insurance 79: 697–721. [Google Scholar] [CrossRef]
  25. Donthu, Naveen, Satish Kumar, Debmalya Mukherjee, Nitesh Pandey, and Weng Marc Lim. 2021. How to conduct a bibliometric analysis: An overview and guidelines. Journal of Business Research 133: 285–96. [Google Scholar] [CrossRef]
  26. Fuller, Gordon Ward, Jeanine Ransom, Jay Mandrekar, and Allen Brown. 2016. Long-term survival following traumatic brain injury: A population-based parametric survival analysis. Neuroepidemiology 47: 1–10. [Google Scholar] [CrossRef] [PubMed] [Green Version]
  27. Halasz, Geza, Michela Sperti, Matteo Villani, Umberto Michelucci, Piergiuseppe Agostoni, Andrea Biagi, Luca Rossi, Andrea Botti, Chiara Mari, Marco Maccarini, and et al. 2021. A machine learning approach for mortality prediction in COVID-19 pneumonia: Development and evaluation of the Piacenza score. Journal of Medical Internet Research 23: e29058. [Google Scholar] [CrossRef]
  28. Hanewald, Katja. 2011. Explaining mortality dynamics: The role of macroeconomic fluctuations and cause of death trends. North American Actuarial Journal 15: 290–314. [Google Scholar] [CrossRef]
  29. Härdle, Wolfgang Karl, and Alena Myšičková. 2009. Stochastic Population Forecast for Germany and Its Consequence for the German Pension System. SFB 649 Discussion Paper No. 2009-009. Berlin: Humboldt University of Berlin, Collaborative Research Center—Economic Risk. [Google Scholar]
  30. Heligman, Larry, and John Pollard. 1980. The age pattern of mortality. Journal of the Institute of Actuaries 107: 49–80. [Google Scholar] [CrossRef]
  31. Hyndman, Rob, and Md Shahid Ullah. 2007. Robust forecasting of mortality and fertility rates: A functional data approach. Computational Statistics & Data Analysis 51: 4942–56. [Google Scholar]
  32. Iuliano, Danielle, Howard Chang, Neha Patel, Ryan Threlkel, Krista Kniss, Jeremy Reich, Molly Steele, Aron Hall, Alicia Fry, and Carrie Reed. 2021. Estimating under-recognized COVID-19 deaths, United States, March 2020-May 2021 using an excess mortality modelling approach. The Lancet Regional Health-Americas 1: 100019. [Google Scholar] [CrossRef]
  33. Janssen, Fanny. 2018. Advances in mortality forecasting: Introduction. Genus 74: 21. [Google Scholar] [CrossRef] [Green Version]
  34. Karhade, Aditya, Quirina Thio, Paul Ogink, Christopher Bono, Marco Ferrone, Kevin Oh, Philip Saylor, Andrew Schoenfeld, John Shin, Mitchel Harris, and et al. 2019. Predicting 90-day and 1-year mortality in spinal metastatic disease: Development and internal validation. Neurosurgery 85: E671–E681. [Google Scholar] [CrossRef] [PubMed]
  35. Kasavan, Saraswathy, Sumiani Yusoff, Mohd Fadhli Rahmat Fakri, and Rusinah Siron. 2021. Plastic pollution in water ecosystem: A bibliometric analysis from 2000 to 2020. Journal of Cleaner Production 313: 127946. [Google Scholar] [CrossRef]
  36. Khairi, Siti Shaliza, Mohd Aftar Abu Bakar, Mohd Almie Alias, Sakhinah Abu Bakar, Choong-Yuen Liong, Nurwahyuna Rosli, and Mohsen Farid. 2021. Deep learning on histopathology images for breast cancer classification: A bibliometric analysis. Healthcare 10: 10. [Google Scholar] [CrossRef] [PubMed]
  37. Koissi, Marie-Claire, and Arnold Shapiro. 2006. Fuzzy formulation of the Lee-Carter model for mortality forecasting. Insurance: Mathematics and Economics 39: 287–309. [Google Scholar] [CrossRef]
  38. Lee, Ronald. 1993. Modeling and forecasting the time series of US fertility: Age distribution, range, and ultimate level. International Journal of Forecasting 9: 187–202. [Google Scholar] [CrossRef]
  39. Lee, Ronald, and Lawrence Carter. 1992. Modeling and forecasting U.S. mortality. Journal of the American Statistical Association 87: 659–71. [Google Scholar] [CrossRef]
  40. Lee, Ronald, and Timothy Miller. 2001. Evaluating the performance of the Lee-Carter method for forecasting mortality. Demography 38: 537–49. [Google Scholar] [CrossRef]
  41. Levantesi, Susanna, and Virginia Pizzorusso. 2019. Application of machine learning to mortality modeling and forecasting. Risks 7: 26. [Google Scholar] [CrossRef] [Green Version]
  42. Li, Johnny Siu-Hang, and Mary Hardy. 2011. Measuring basis risk in longevity hedges. North American Actuarial Journal 15: 177–200. [Google Scholar] [CrossRef]
  43. Li, Nan, and Ronald Lee. 2005. Coherent mortality forecasts for a group of populations: An extension of the Lee-Carter method. Demography 42: 575–94. [Google Scholar] [CrossRef] [Green Version]
  44. Li, Han, Hong Li, Yang Lu, and Anastasios Panagiotelis. 2019. A forecast reconciliation approach to cause-of-death mortality modeling. Insurance: Mathematics and Economics 86: 122–33. [Google Scholar] [CrossRef]
  45. Liao, Huchang, Ming Tang, Li Luo, Chunyang Li, Francisco Chiclana, and Xiao-Jun Zeng. 2018. A bibliometric analysis and visualization of medical big data research. Sustainability 10: 166. [Google Scholar] [CrossRef] [Green Version]
  46. Lozano, Rafael, Mohsen Naghavi, Kyle Foreman, Stephen Lim, Kenji Shibuya, Victor Aboyans, Jerry Abraham, Timothy Adair, Rakesh Aggarwal, Stephanie Ahn, and et al. 2012. Global and regional mortality from 235 causes of death for 20 age groups in 1990 and 2010: A systematic analysis for the Global Burden of Disease Study 2010. The Lancet 380: 2095–128. [Google Scholar] [CrossRef]
  47. Ludkovski, Mike, Jimmy Risk, and Howard Zail. 2018. Gaussian process models for mortality rates and improvement factors. ASTIN Bulletin 48: 1307–47. [Google Scholar] [CrossRef]
  48. McNown, Robert, and Andrei Rogers. 1989. Forecasting mortality: A parameterized time series approach. Demography 26: 645–60. [Google Scholar] [CrossRef]
  49. Moustakas, Louis. 2022. A bibliometric analysis of research on social cohesion from 1994–2020. Publications 10: 5. [Google Scholar] [CrossRef]
  50. Nair, Anirudh Venugopalan, Davendra Kumar, Santosh Kumar Yadav, Pankaj Nepal, Bamil Jacob, and Mahmoud Al-Heidous. 2021. Utility of visual coronary artery calcification on non-cardiac gated thoracic CT in predicting clinical severity and outcome in COVID-19. Clinical Imaging 74: 123–30. [Google Scholar] [CrossRef]
  51. Niu, Geng, and Bertrand Melenberg. 2014. Trends in mortality decrease and economic growth. Demography 51: 1755–73. [Google Scholar] [CrossRef]
  52. Noorhidawati, Abdullah, Yanti Idaya Aspura, Mohd Nor Zahila, and Abdullah Abrizah. 2017. Characteristics of Malaysian highly cited papers. Malaysian Journal of Library & Information Science 22: 85–99. [Google Scholar]
  53. Nor, Siti Rohani Mohd, Fadhilah Yusof, and Arifah Bahar. 2018. Multi-population mortality model: A practical approach. Sains Malaysiana 47: 1337–47. [Google Scholar]
  54. O’Hare, Colin, and Youwei Li. 2012. Explaining young mortality. Insurance: Mathematics and Economics 50: 12–25. [Google Scholar] [CrossRef]
  55. Plat, Richard. 2009. On stochastic mortality modeling. Insurance: Mathematics and Economics 45: 393–404. [Google Scholar]
  56. Post, Lori Ann, Salem Argaw, Cameron Jones, Charles Moss, Danielle Resnick, Lauren Nadya Singh, Robert Leo Murphy, Chad Achenbach, Janine White, Tariq Ziad Issa, and et al. 2020. A SARS-CoV-2 surveillance system in Sub-Saharan Africa: Modeling study for persistence and transmission to inform policy. Journal of Medical Internet Research 22: e24248. [Google Scholar] [CrossRef] [PubMed]
  57. Renshaw, Arthur, and Steven Haberman. 2006. A cohort-based extension to the Lee-Carter model for mortality reduction factors. Insurance: Mathematics and Economics 38: 556–70. [Google Scholar] [CrossRef]
  58. Seklecka, Malgorzata, Athanasios Pantelous, and Colin O’Hare. 2017. Mortality effects of temperature changes in the United Kingdom. Journal of Forecasting 36: 824–41. [Google Scholar] [CrossRef]
  59. Shamsuddin, Siti Nurasyikin, Noriszura Ismail, and Nur Firyal Roslan. 2022. What we know about research on life insurance lapse: A bibliometric analysis. Risks 10: 97. [Google Scholar] [CrossRef]
  60. Sholihin, Muhammad, Ramsah Ali, and Deri Wanto. 2021. Shariah compliance in Islamic economics: A bibliometric analysis. Malaysian Journal of Economic Studies 58: 315–37. [Google Scholar] [CrossRef]
  61. Tóth, Csaba. 2021. Multi-population models to handle mortality crises in forecasting mortality: A case study from Hungary. Society and Economy 43: 128–46. [Google Scholar] [CrossRef]
  62. Tsai, Cary Chi-Liang, and Tzuling Lin. 2017. A Bühlmann credibility approach to modeling mortality rates. North American Actuarial Journal 21: 204–27. [Google Scholar] [CrossRef]
  63. United Nations. 2019. World Population Ageing 2019. New York: United Nations. [Google Scholar]
  64. van Eck, Nees Jan, and Ludo Waltman. 2010. Software survey: VOSviewer, a computer program for bibliometric mapping. Scientometrics 84: 523–38. [Google Scholar] [CrossRef] [Green Version]
  65. van Eck, Nees Jan, and Ludo Waltman. 2014. Visualizing bibliometric networks. In Measuring Scholarly Impact. Cham: Springer, pp. 285–320. [Google Scholar]
  66. Vaupel, James, and Kristín Kistowski. 2005. Broken limits to life expectancy. Ageing Horizons 3: 6–13. [Google Scholar]
  67. Villegas, Andrés, Steven Haberman, Vladimir Kaishev, and Pietro Millossovich. 2017. A comparative study of two population models for the assessment of basis risk in longevity hedges. ASTIN Bulletin 47: 631–79. [Google Scholar] [CrossRef] [Green Version]
  68. Villegas, Andrés, Pietro Millossovich, and Vladimir Kaishev. 2018. StMoMo: Stochastic mortality modeling in R. Journal of Statistical Software 84: 1–38. [Google Scholar] [CrossRef] [Green Version]
  69. Wang, Xiaofeng, Lara Jehi, Xinge Ji, and Peter Mazzone. 2021. Phenotypes and subphenotypes of patients with COVID-19 a latent class modeling analysis. Chest Infection 159: 2191–204. [Google Scholar] [CrossRef] [PubMed]
  70. Wicke, Felix, Mareike Ernst, Daniëlle Otten, Antonia Werner, Michael Dreier, Elmar Brähler, Ana Nanette Tibubos, Iris Reiner, Matthias Michal, Jörg Wiltink, and et al. 2022. The association of depression and all-cause mortality: Explanatory factors and the influence of gender. Journal of Affective Disorders 303: 315–22. [Google Scholar] [CrossRef]
  71. World Bank. 2021. The World Income and Region. Available online: https://datatopics.worldbank.org/world-development-indicators/the-world-by-income-and-region.html (accessed on 5 August 2022).
  72. Yang, Chayu, and Jin Wang. 2021. Modeling the transmission of COVID-19 in the US–A case study. Infectious Disease Modelling 6: 195–211. [Google Scholar] [CrossRef]
  73. Yue, Jack, Hsin-Chung Wang, Yin-Yee Leong, and Wei-Ping Su. 2018. Using Taiwan National Health Insurance Database to model cancer incidence and mortality rates. Insurance: Mathematics and Economics 78: 316–24. [Google Scholar] [CrossRef]
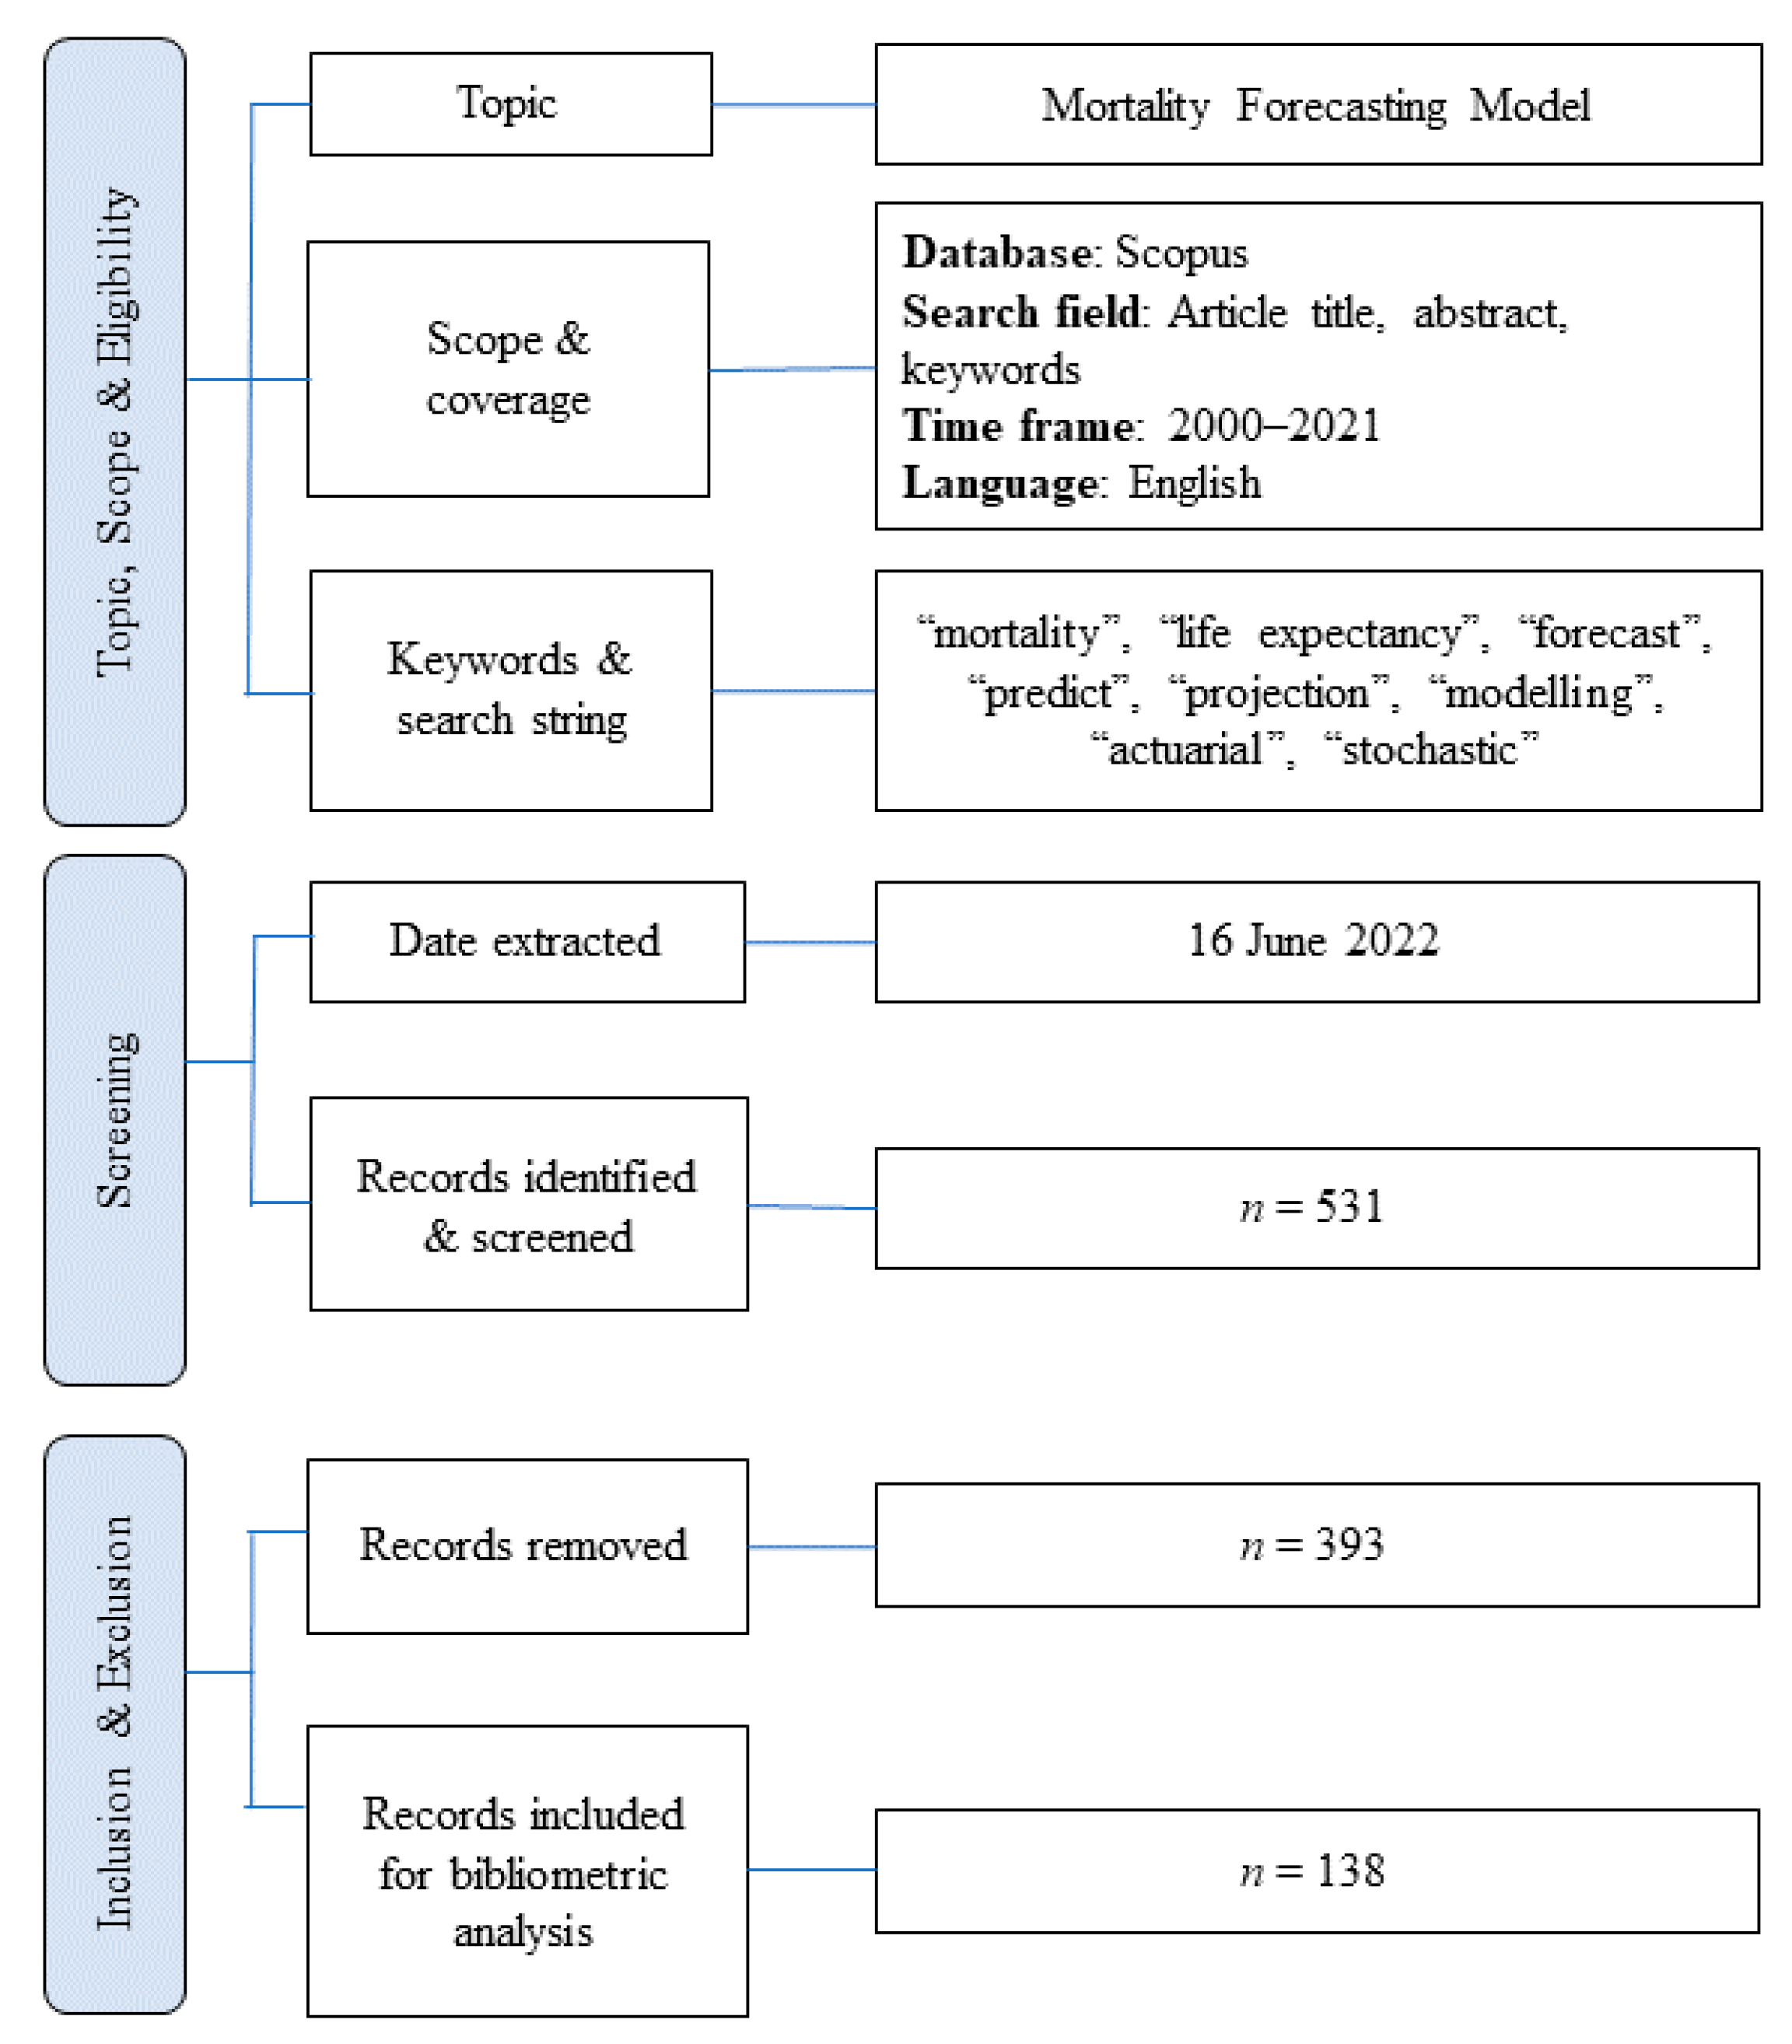
Figure 1. Flowchart of the research process.
Risks 10 00191 g001
Figure 2. Evolution of publications on mortality forecasting and modelling from 2000 to 2021.
Risks 10 00191 g002
Figure 3. Authors’ co-citation network for mortality forecasting and modelling. Red represents cluster 1, green represents cluster 2, blue represents cluster 3 and yellow represents cluster 4.
Risks 10 00191 g003
Figure 4. Co-authorship network of countries. Red represents cluster 1, green represents cluster 2, blue represents cluster 3 and yellow represents cluster 4.
Risks 10 00191 g004
Figure 5. Co-occurrences of keywords.
Risks 10 00191 g005
Figure 7. Co-occurrences of keywords of COVID-19 mortality modelling and forecasting publications. Red represents cluster 1, green represents cluster 2 and blue represents cluster 3.
Risks 10 00191 g007
Table 1. Frequency of document type.
Document TypeFrequencyPercentage (%)
Article11583.3
Conference paper2014.5
Book chapter21.5
Review10.1
Total138100.00
Table 2. Top 10 most active and most cited authors.
Most ActiveMost Cited
AuthorDocumentsAuthorCitationsCluster
Li J.S.H.9Blake D.2561
Chan W.S.6Dowd K.2291
Russolillo M.6Haberman S.2293
Li Y.5Cairns A.J.G.2021
Bravo J.M.4Lee R.D.1602
Cairns A.J.G.4Denuit M.1323
Li H.4Coughlan G.D.1121
O’Hare C.4Carter L.R.1062
Shevchenko P.V.4Epstein D.1051
Tsai C.C.L.4Renshaw A.E.991
Table 3. Top 10 most active sources.
SourceNPTCQuartile (2021)
Insurance: Mathematics and Economics21544Q1
North American Actuarial Journal14131Q2
Risks937Q2
Scandinavian Actuarial Journal5136Q2
Annals of Thoracic Surgery4311Q1
ASTIN Bulletin4173Q1
European Actuarial Journal434Q2
Annals of Actuarial Science36Q2
Geneva Papers on Risk and Insurance: Issues and Practice356Q2
International Journal of Forecasting3198Q1
NP = number of publications, TC = total citations.
Table 4. Top 10 most active countries based on co-authorship.
CountryDocumentsTLSCitationsCluster
United Kingdom26197003
United States261411531
Australia22193103
Canada22183504
Italy1371822
China991151
Germany85721
Taiwan751392
The Netherlands61971
Hong Kong69424
TLS = total link strength.
Table 5. Top 10 most cited documents between 2016 and 2021.
NoReferencesTitleSourceTC
1Karhade et al. (2019)Predicting 90-Day and 1-Year Mortality in Spinal Metastatic Disease: Development and Internal ValidationNeurosurgery70
2Villegas et al. (2018)StMoMo: Stochastic mortality modeling in RJournal of Statistical Software22
3Fuller et al. (2016)Long-Term Survival Following Traumatic Brain Injury: A Population-Based Parametric Survival AnalysisNeuroepidemiology17
4Levantesi and Pizzorusso (2019)Application of machine learning to mortality modeling and forecastingRisks14
5Boonen and Li (2017)Modeling and Forecasting Mortality With Economic Growth: A Multipopulation ApproachDemography13
6Li et al. (2019)A forecast reconciliation approach to cause-of-death mortality modelingInsurance: Mathematics and Economics12
7Tsai and Lin (2017)A Bühlmann Credibility Approach to Modeling Mortality RatesNorth American Actuarial Journal12
8Bravo (2020)Longevity-linked life annuities: A bayesian model ensemble pricing approachProceeding of 20th Conference of the Portuguese Association of Information Systems10
9Bozikas and Pitselis (2018)An empirical study on stochastic mortality modelling under the age-period-cohort framework: The case of Greece with applications to insurance pricingRisks9
10Ludkovski et al. (2018)Gaussian process models for mortality rates and improvement factorsASTIN Bulletin8
TC = total citations.
Publisher’s Note: MDPI stays neutral with regard to jurisdictional claims in published maps and institutional affiliations.