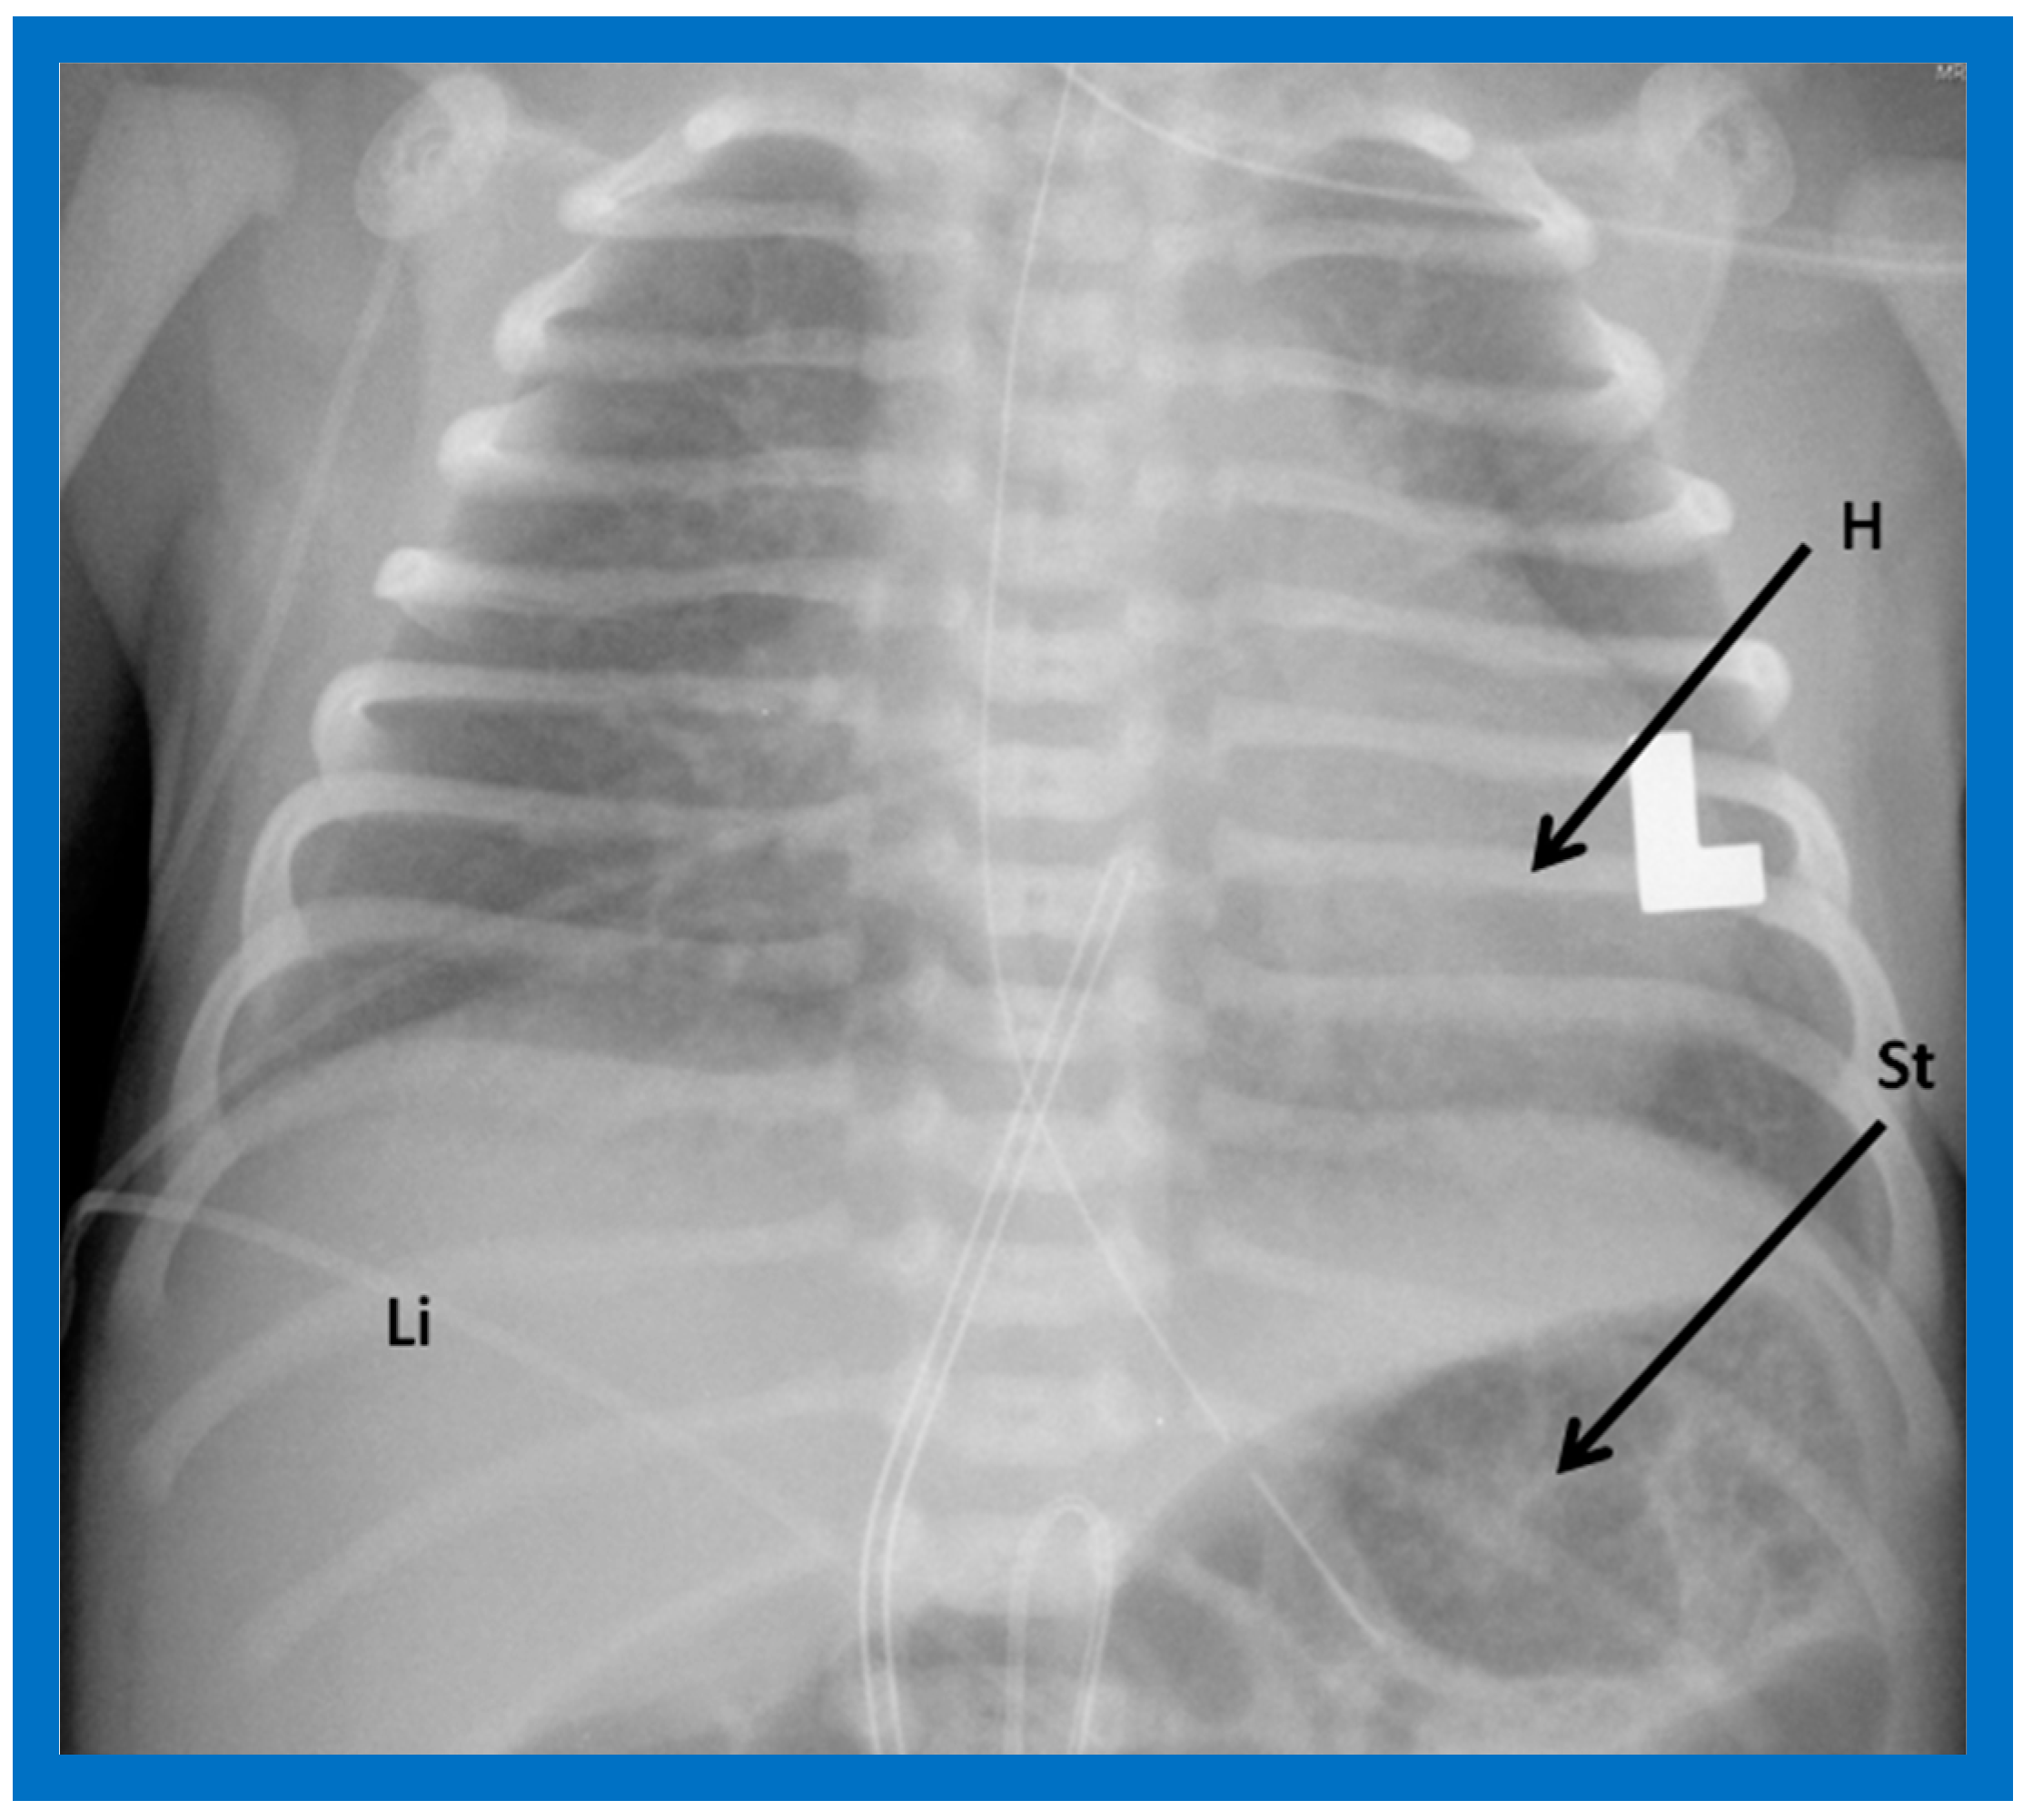
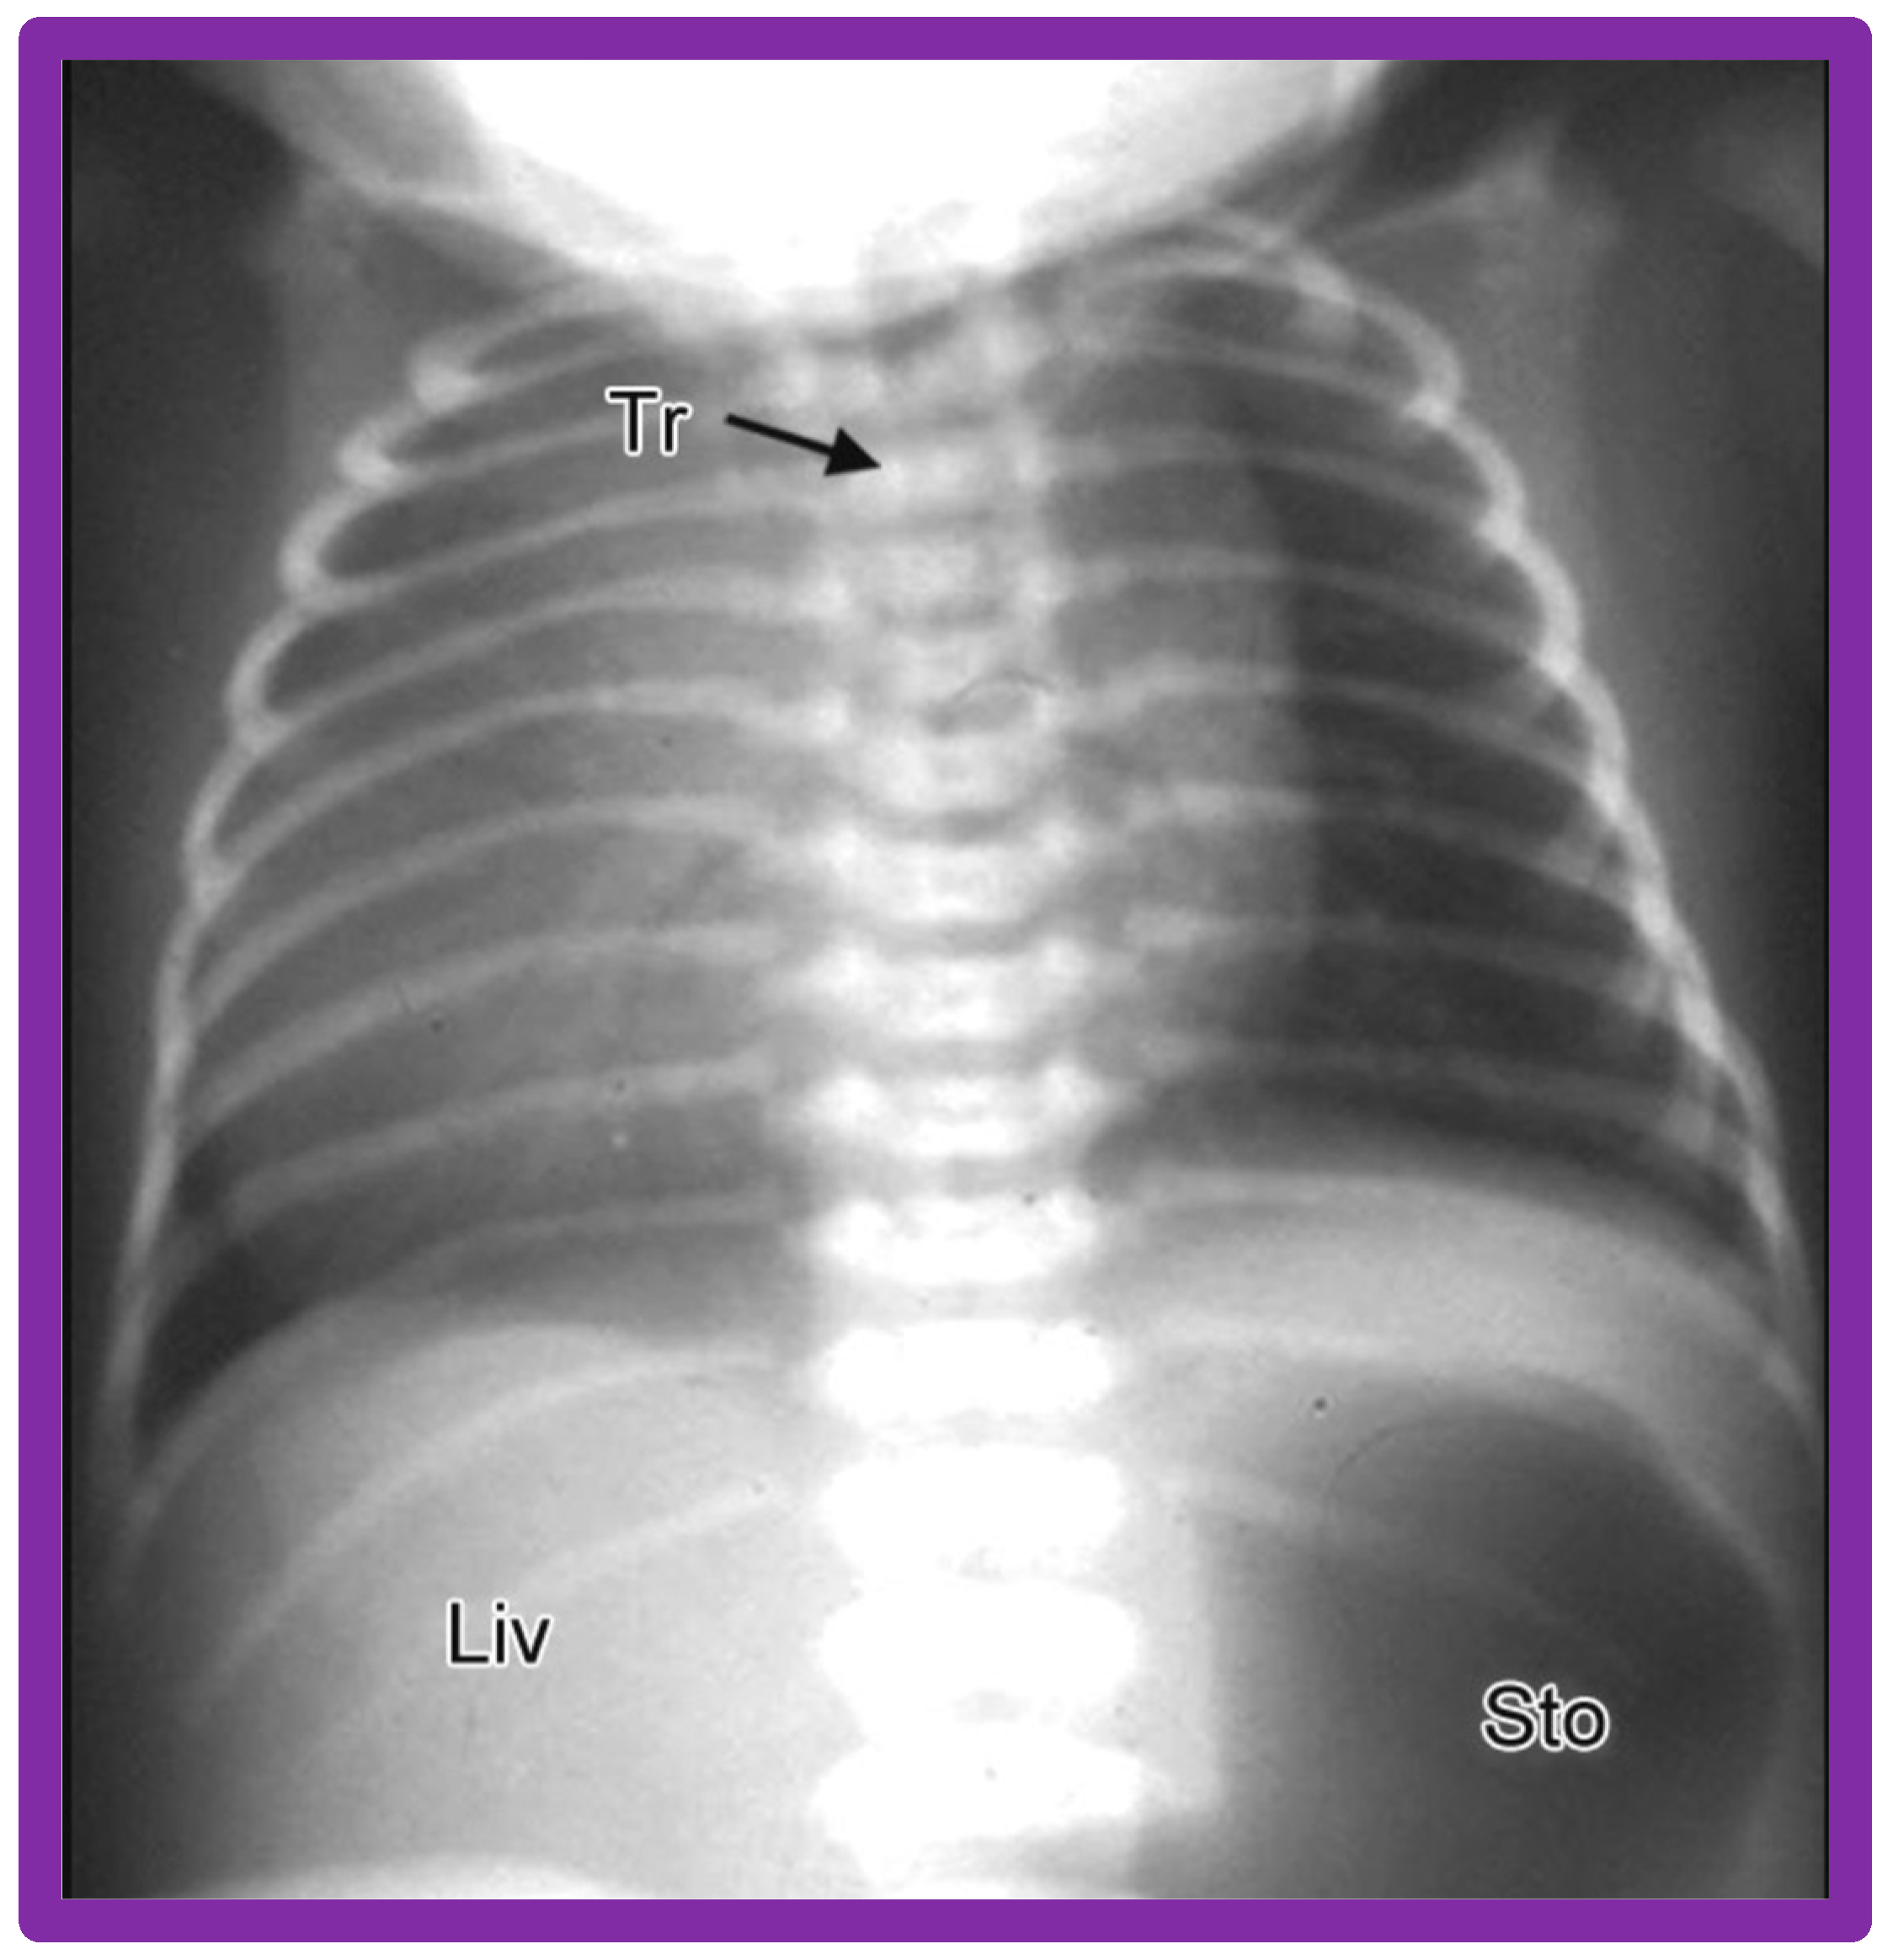
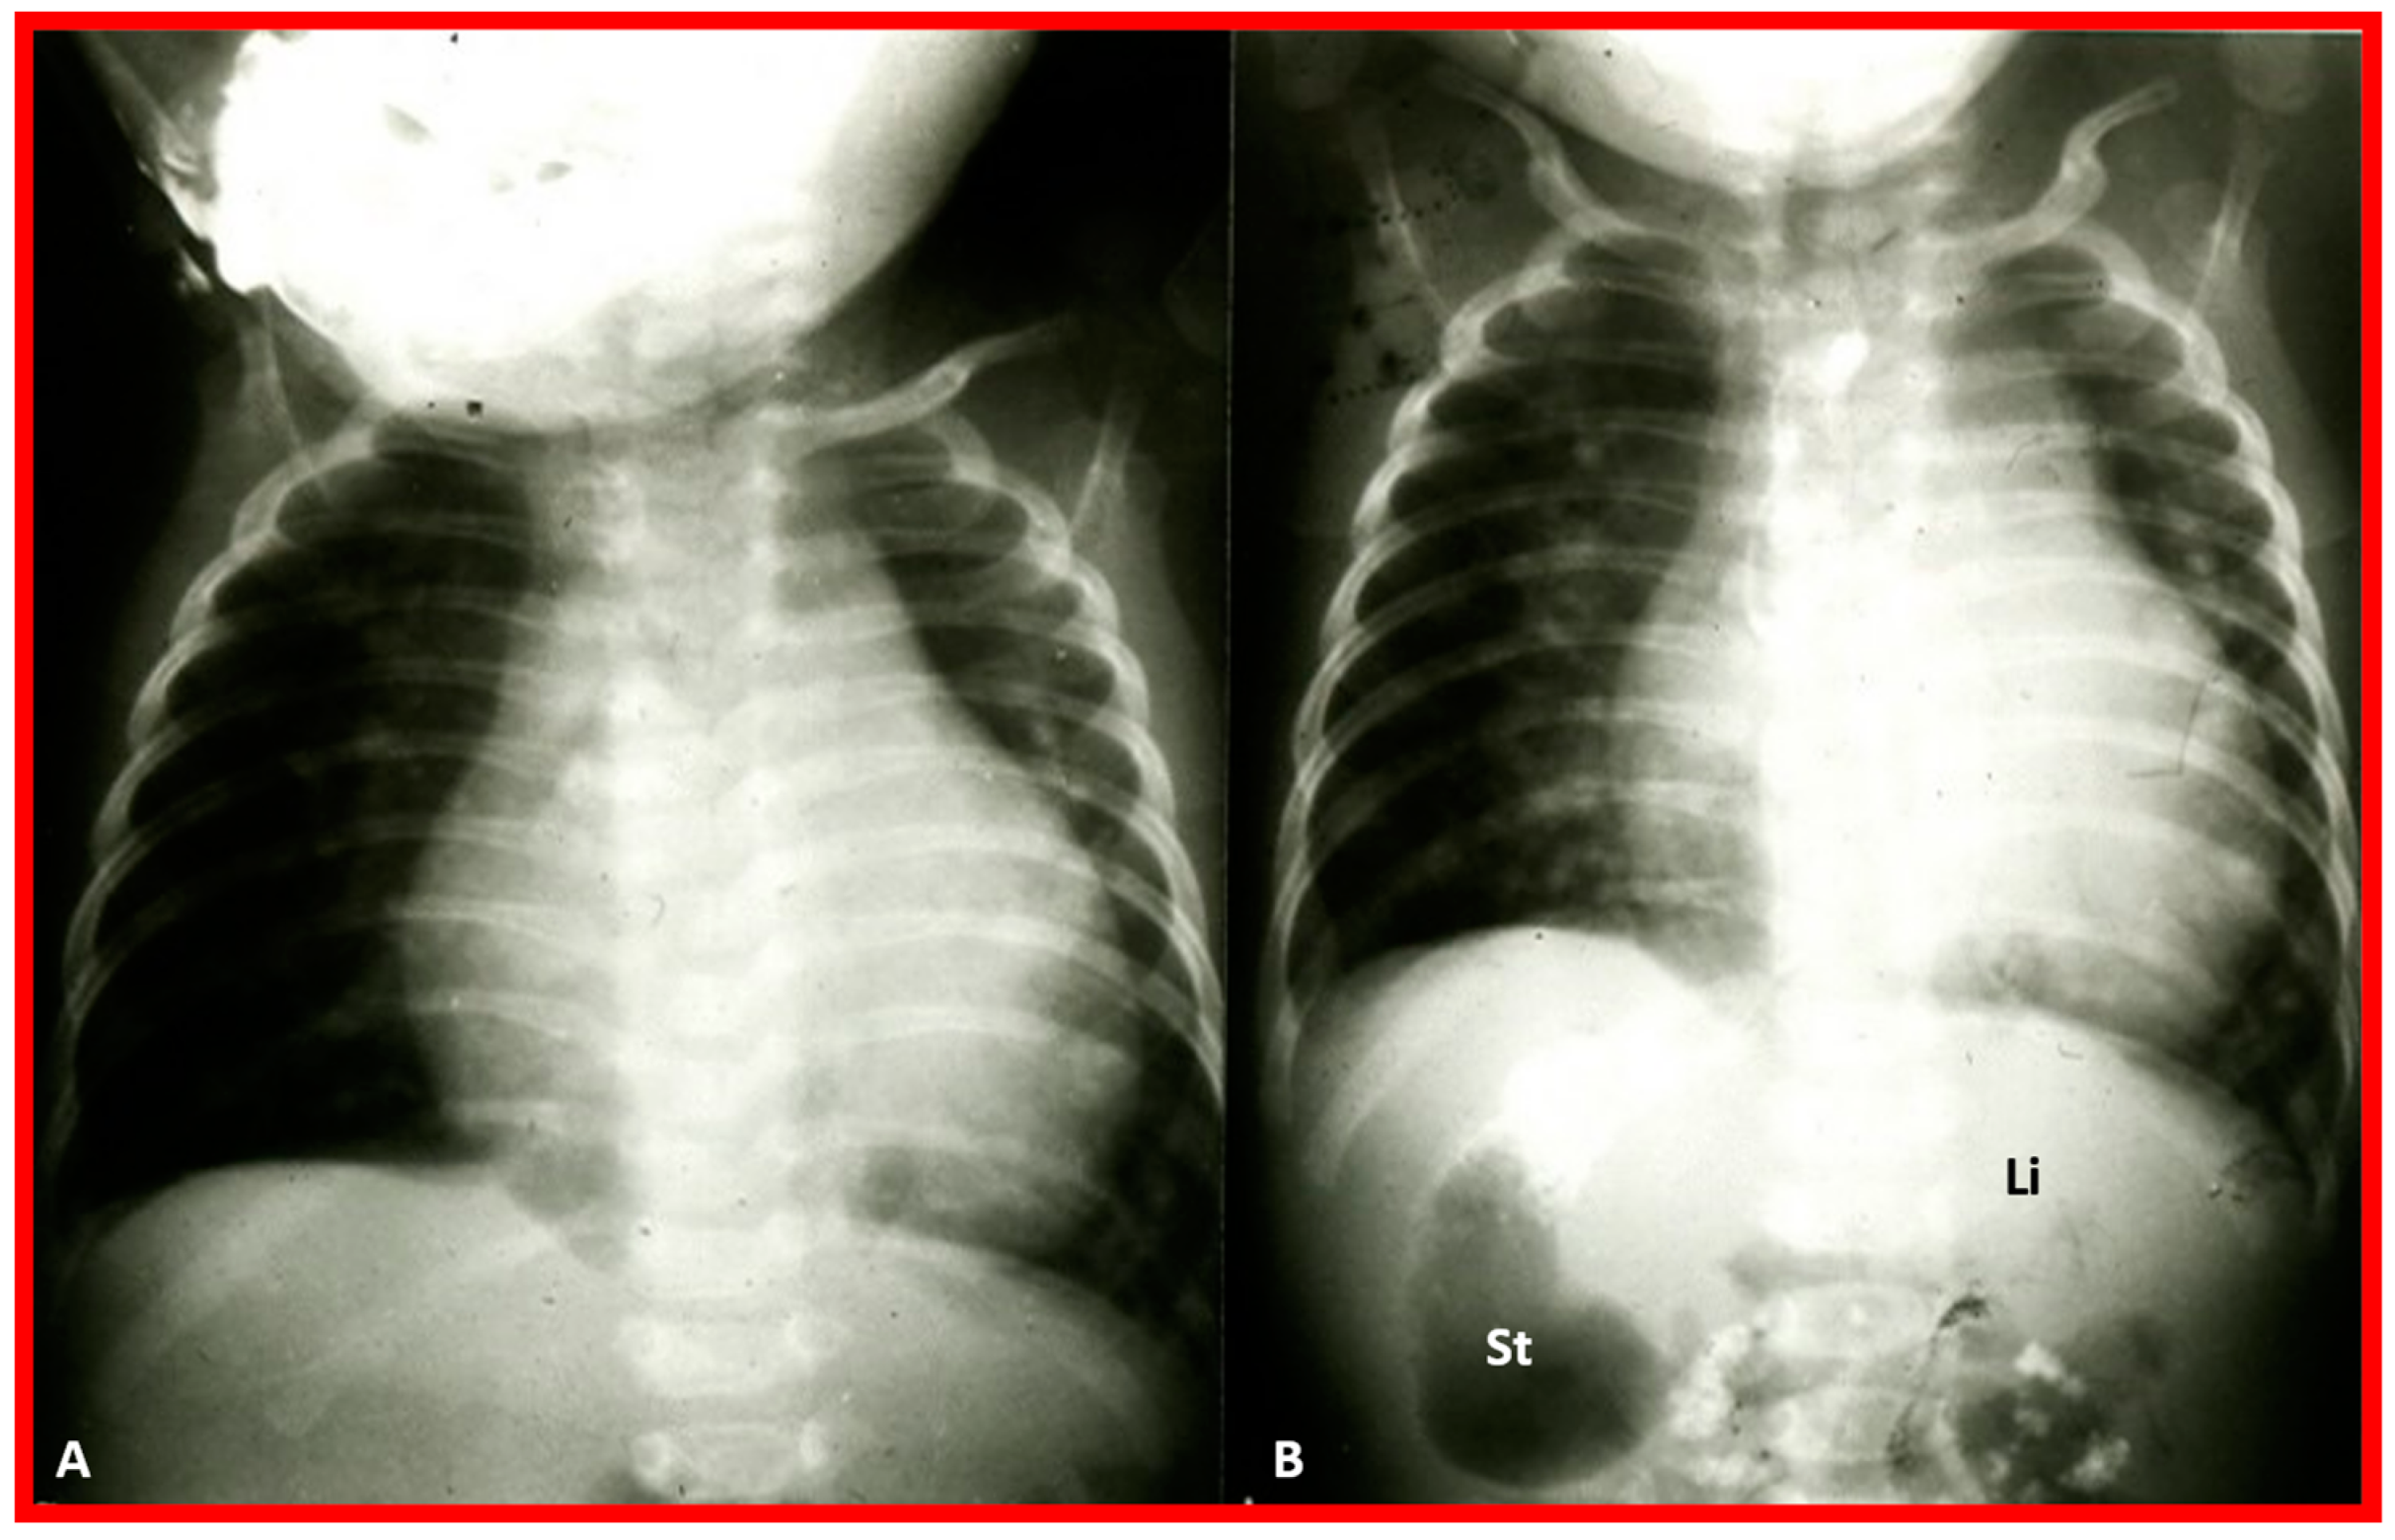
Figure 1.
Chest roentgenogram of a baby demonstrating the heart (H) in the left chest (L), i.e., levocardia. This is the usual position of the heart in most patients. The roentgenogram further demonstrates the liver (Li) on the right side of the abdomen and the gaseous opacity of the stomach (St) on the left side, again normal. This is described as situs solitus of the viscera. L indicates left. Reproduced from reference [
4].
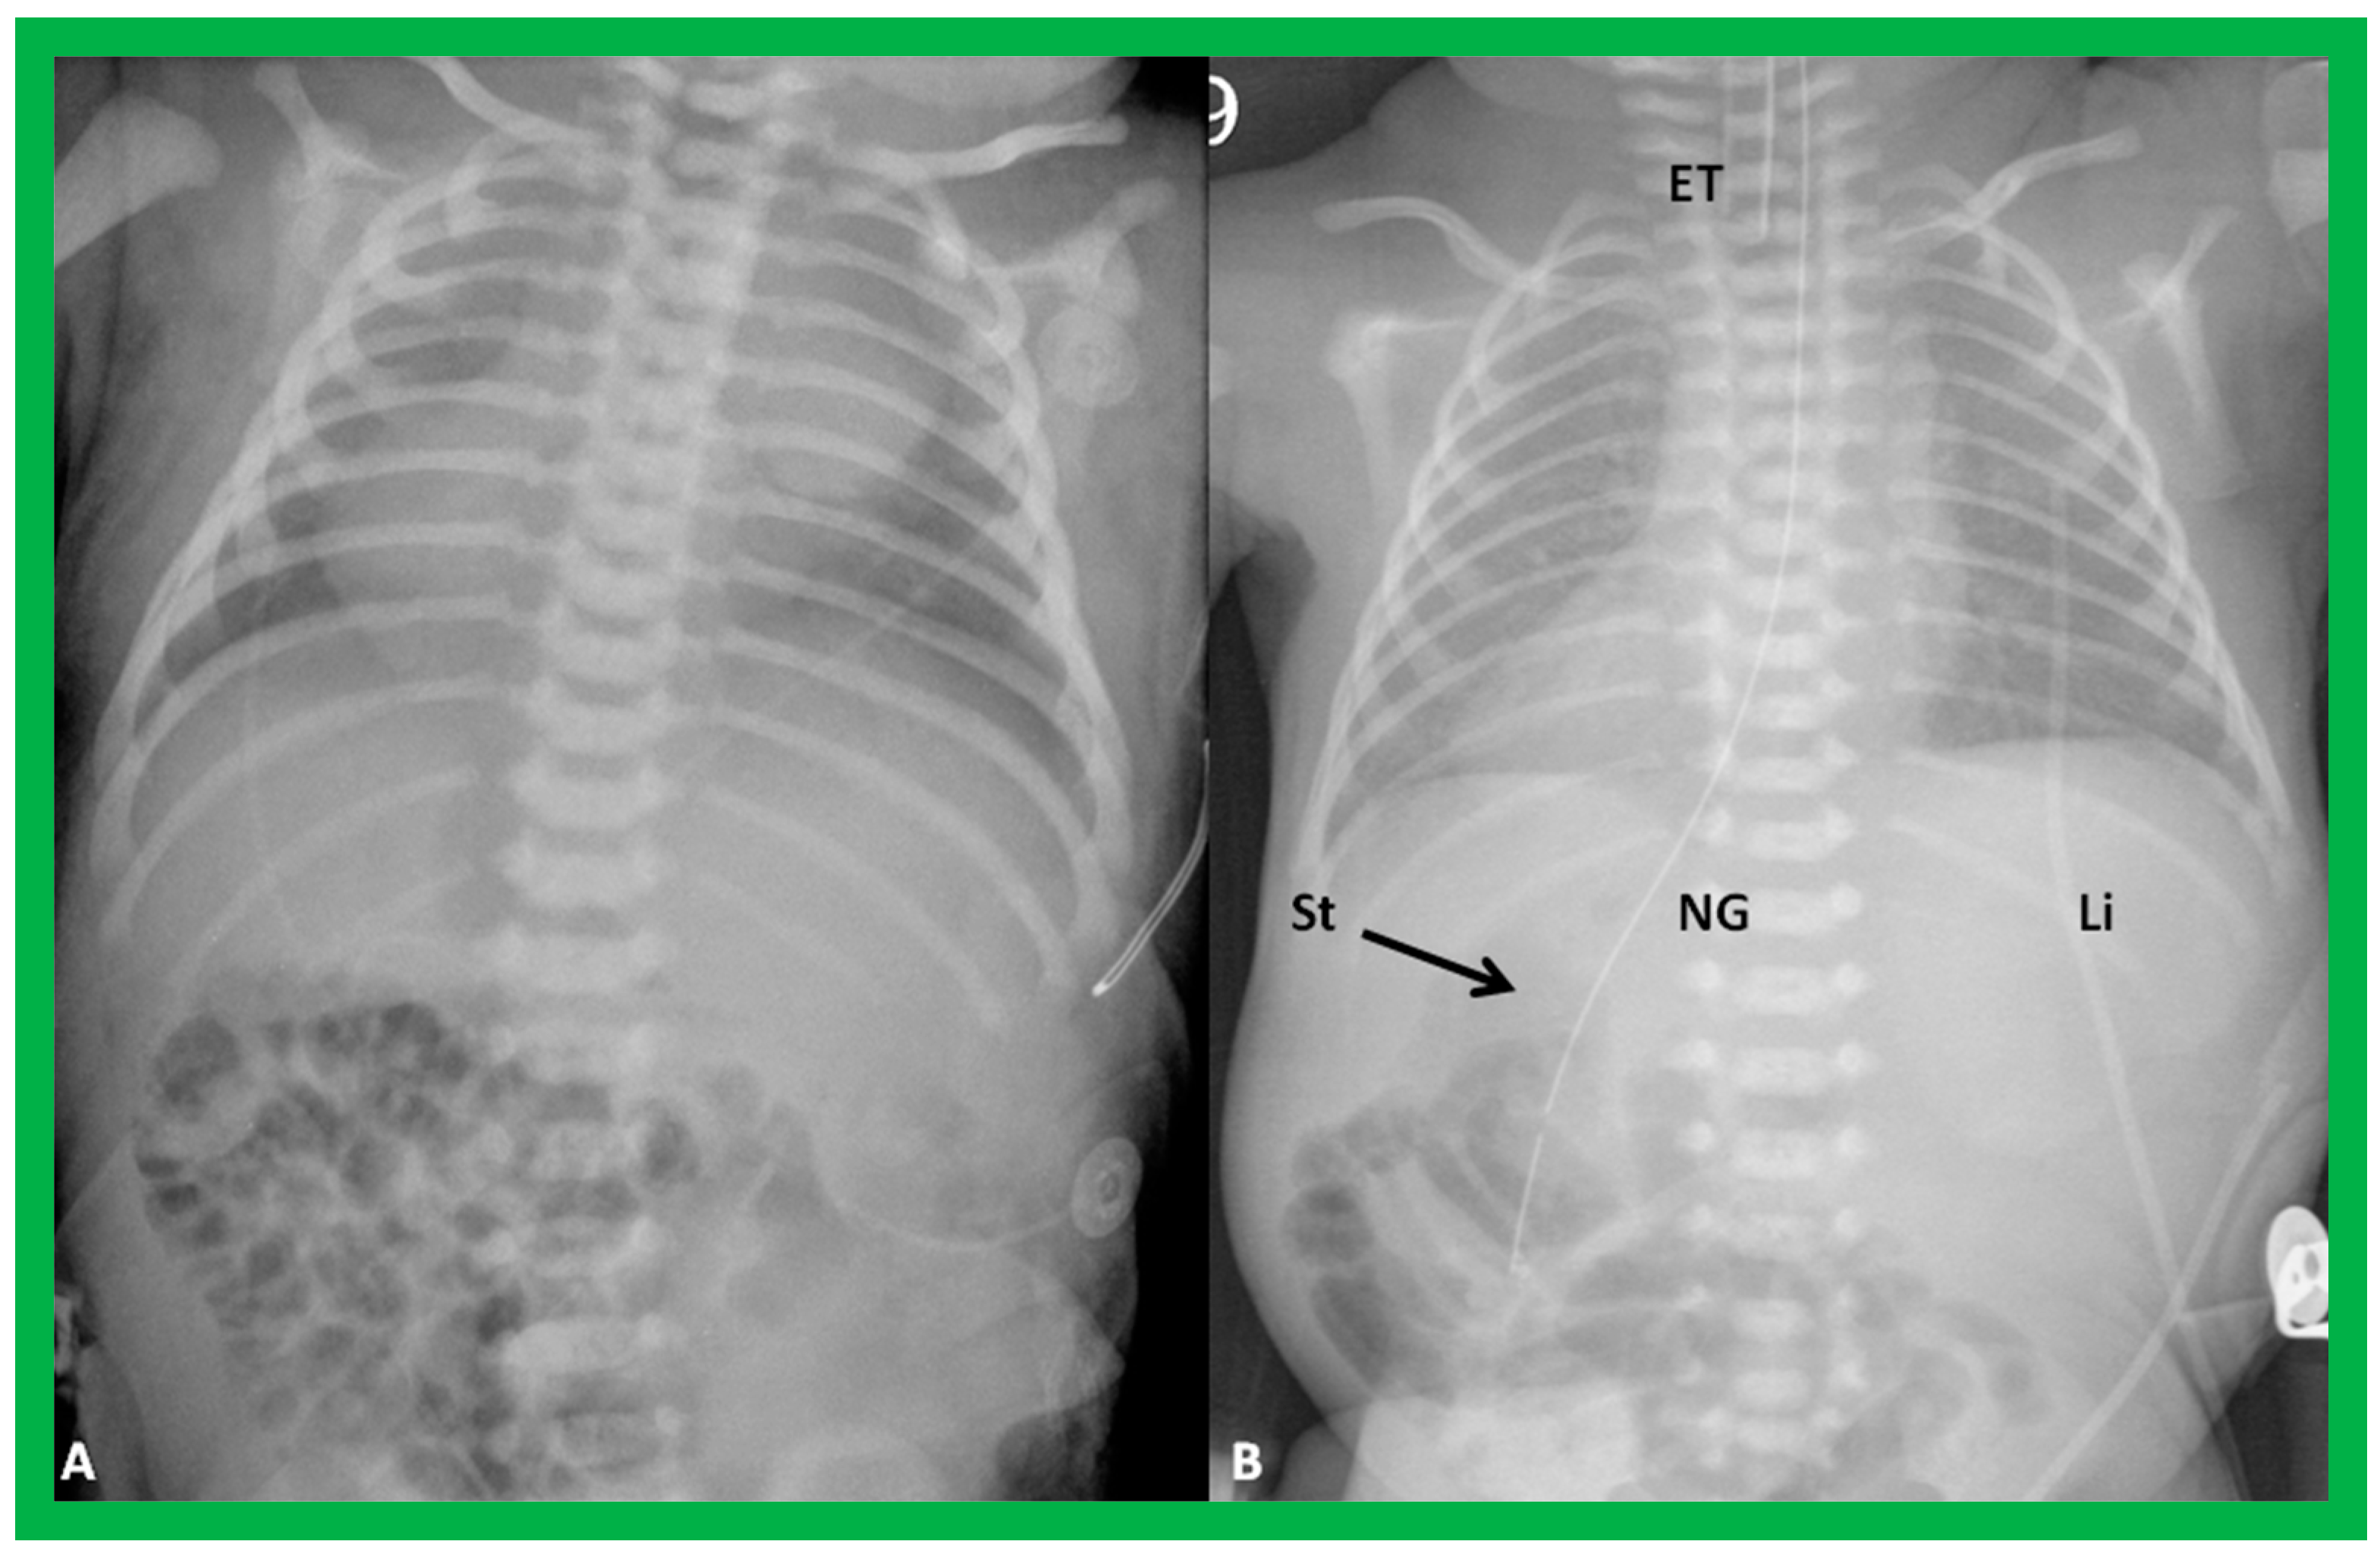
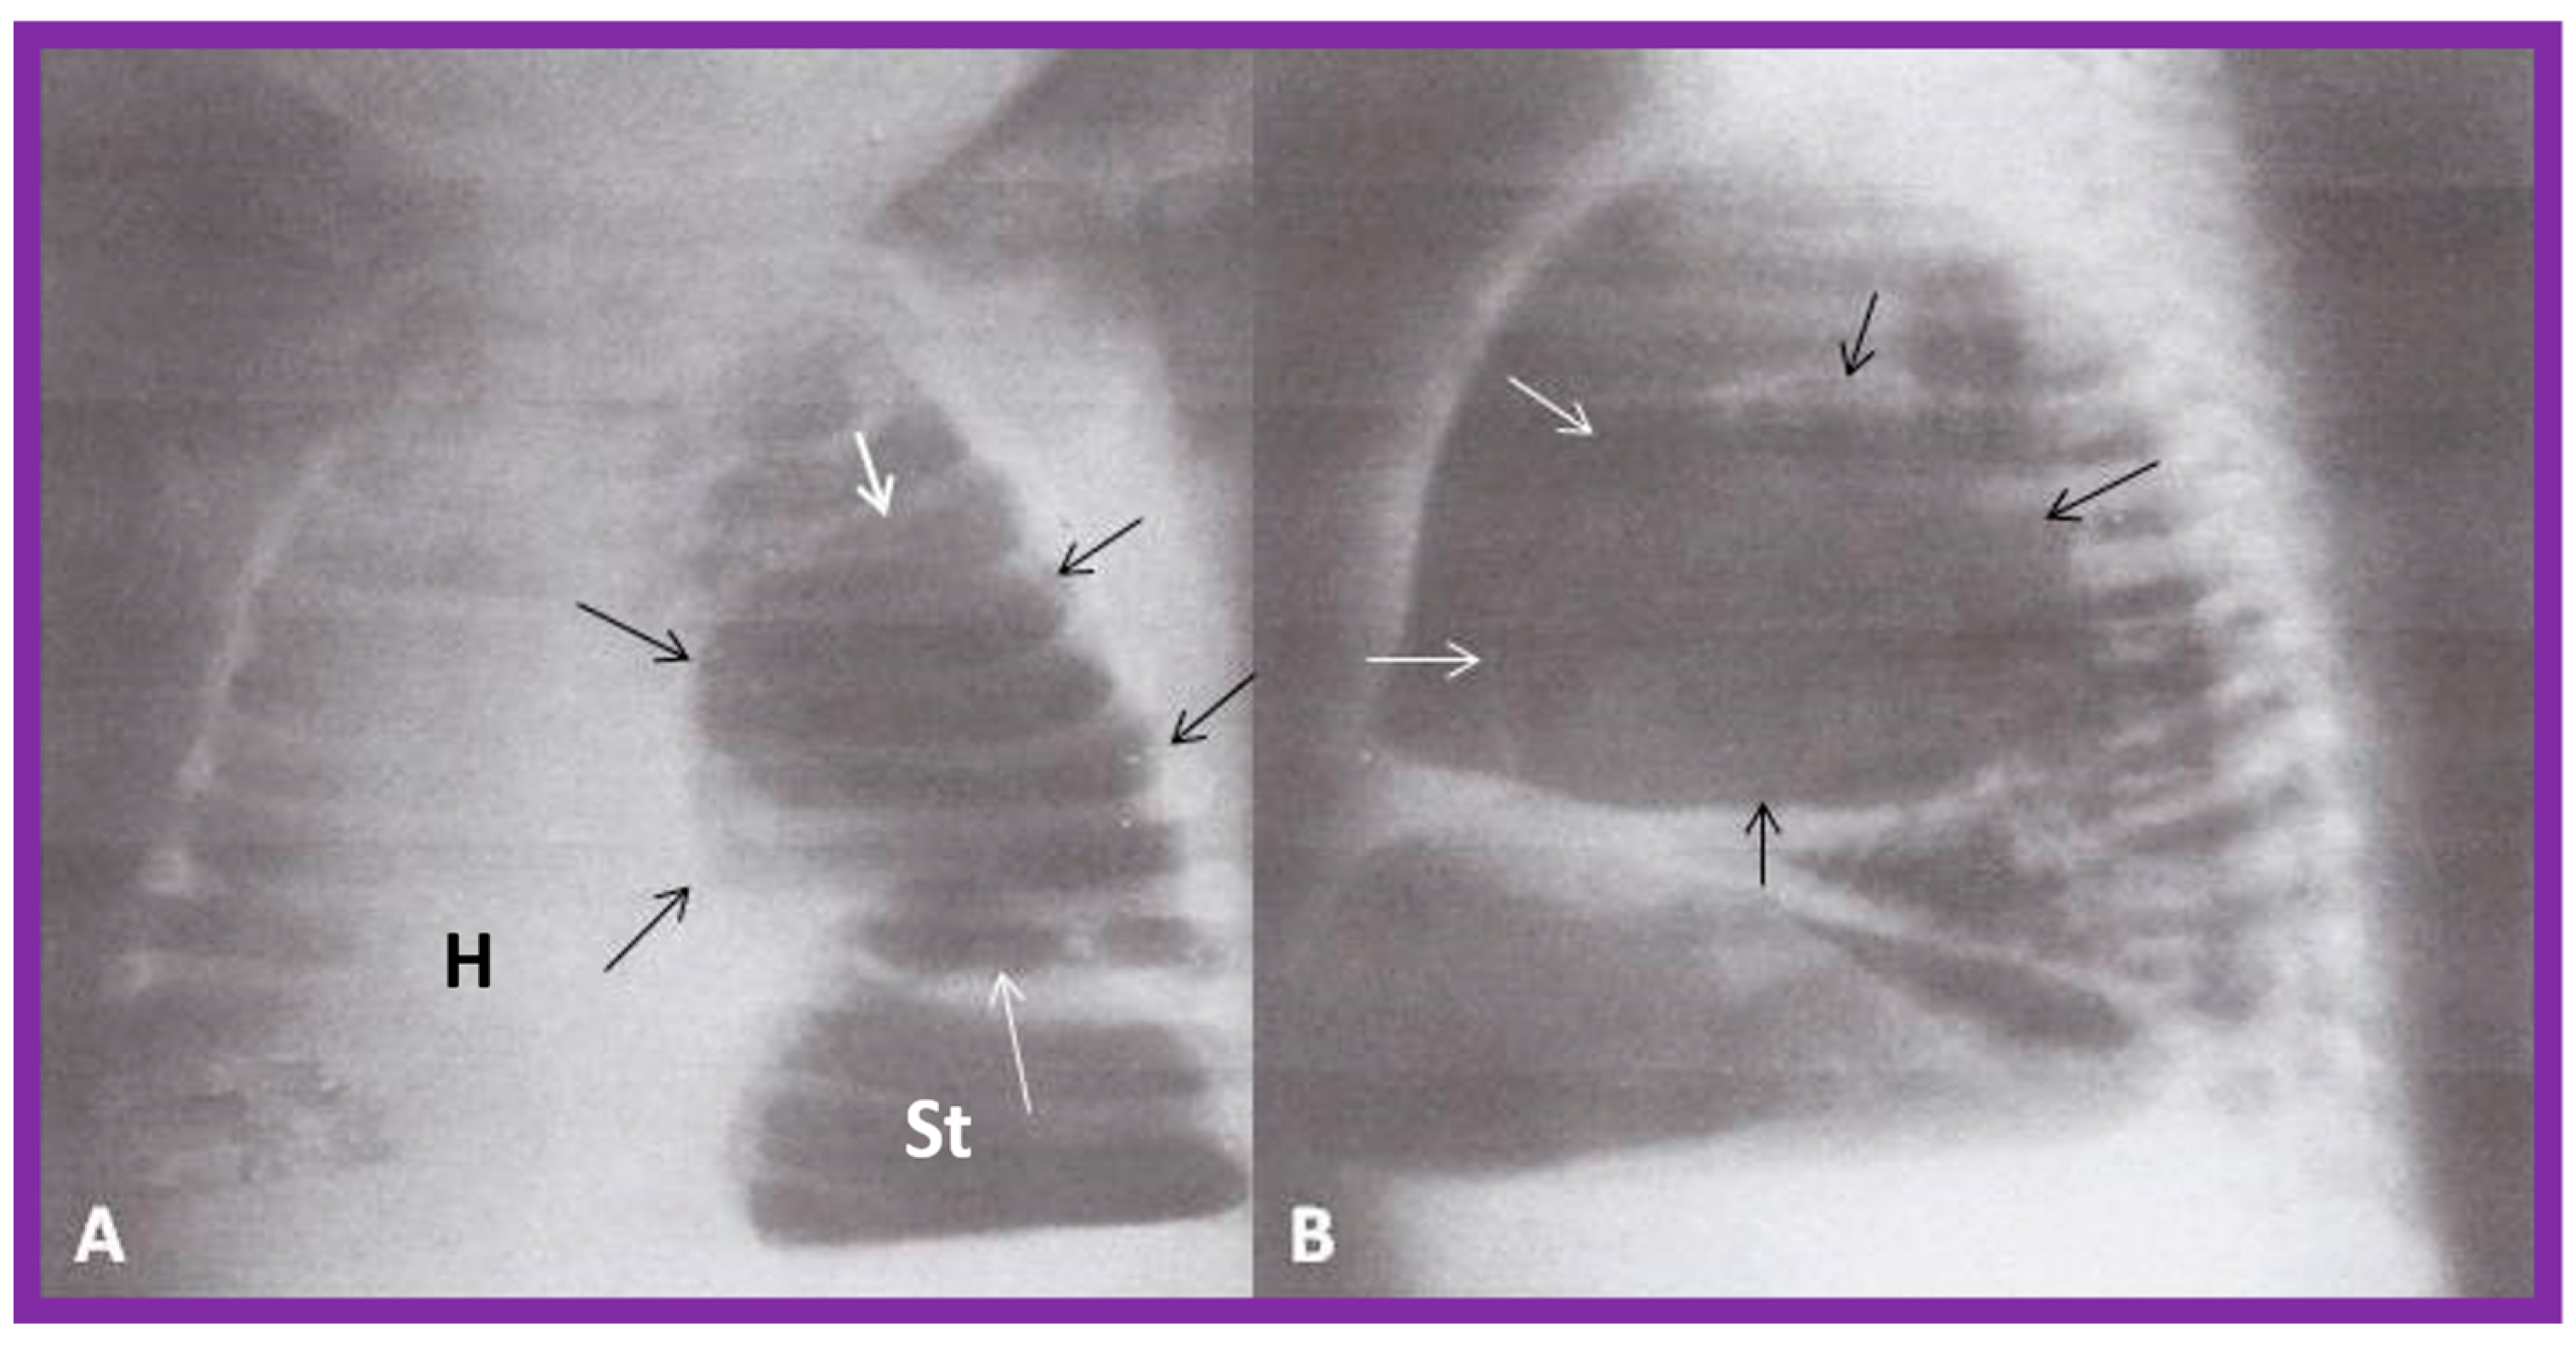
Figure 2.
Chest X-rays of two different newborn babies with hearts situated in the right chest, i.e., dextrocardia. (
A) The liver (Li) is visualized across the abdominal cavity without seeing the stomach air bubble; thus, it is not possible to establish the visceral situs. (
B) On the other hand, the stomach (St) air shadow is faintly seen on the right side of the abdomen while the Li is imaged on the left side. The findings in (
B) indicate inversion of the visceral position, situs inversus. Furthermore, the location of the St on the right is established by the location of the NG (nasogastric) tube. Air in the intestine is seen in the lower portion of the abdomen in both infants. ET, endotracheal tube. Reproduced from reference [
4].
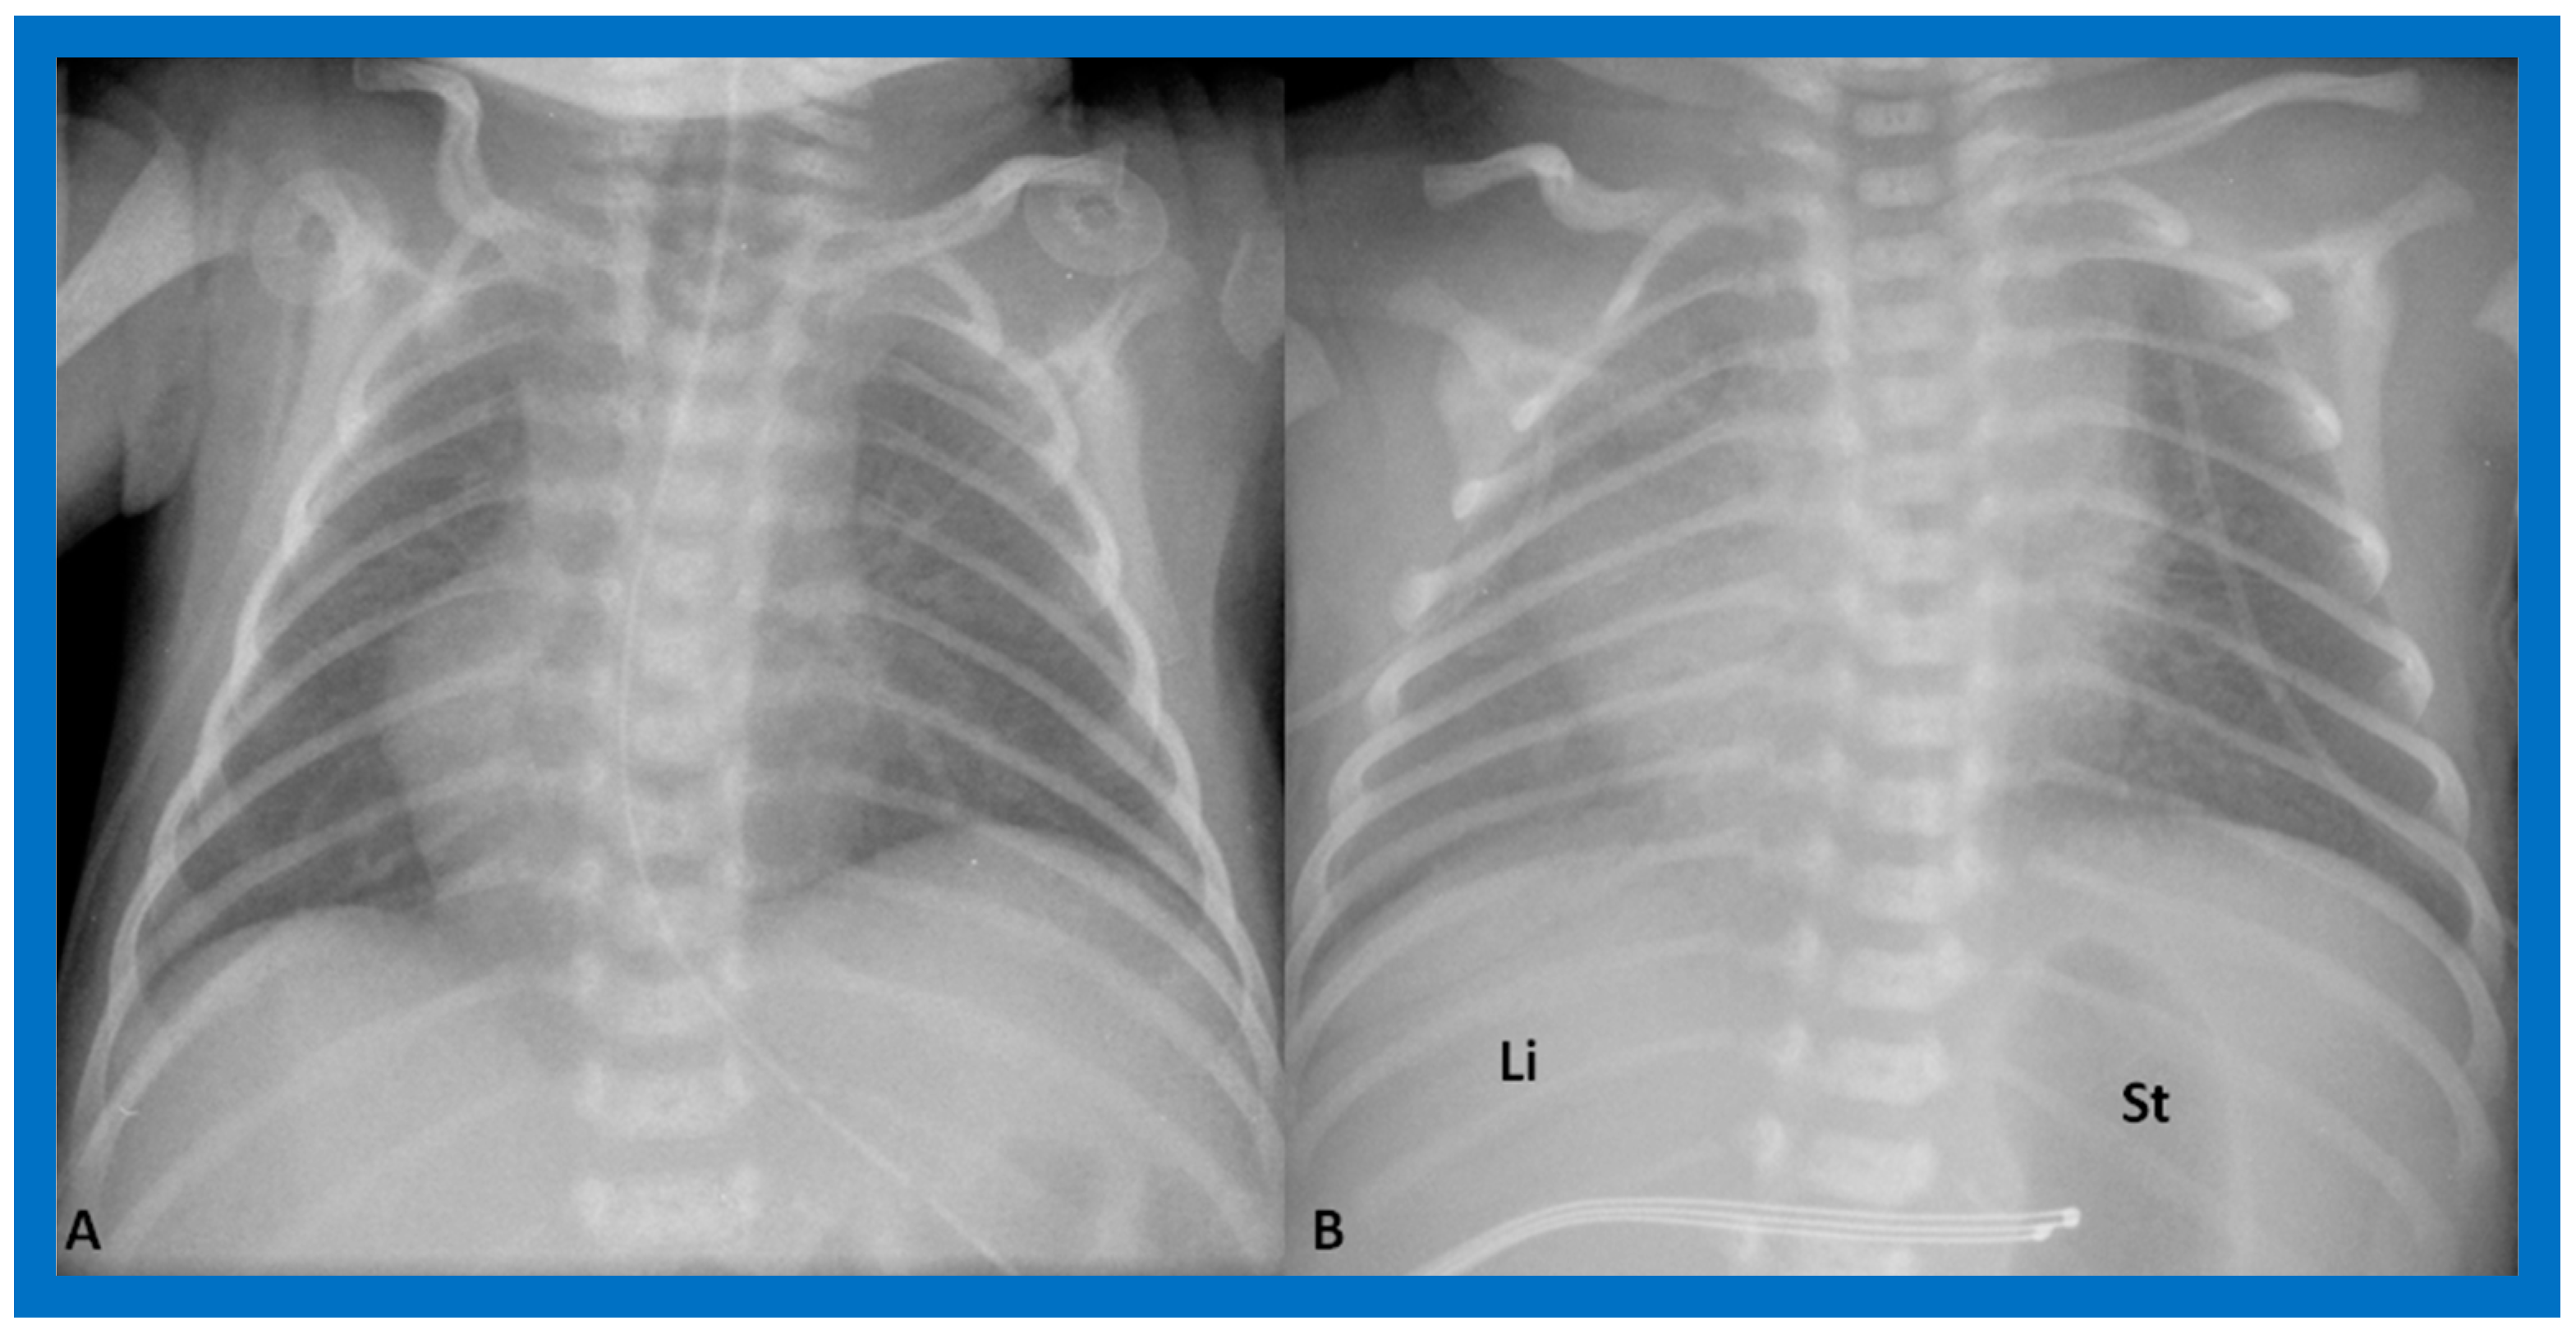
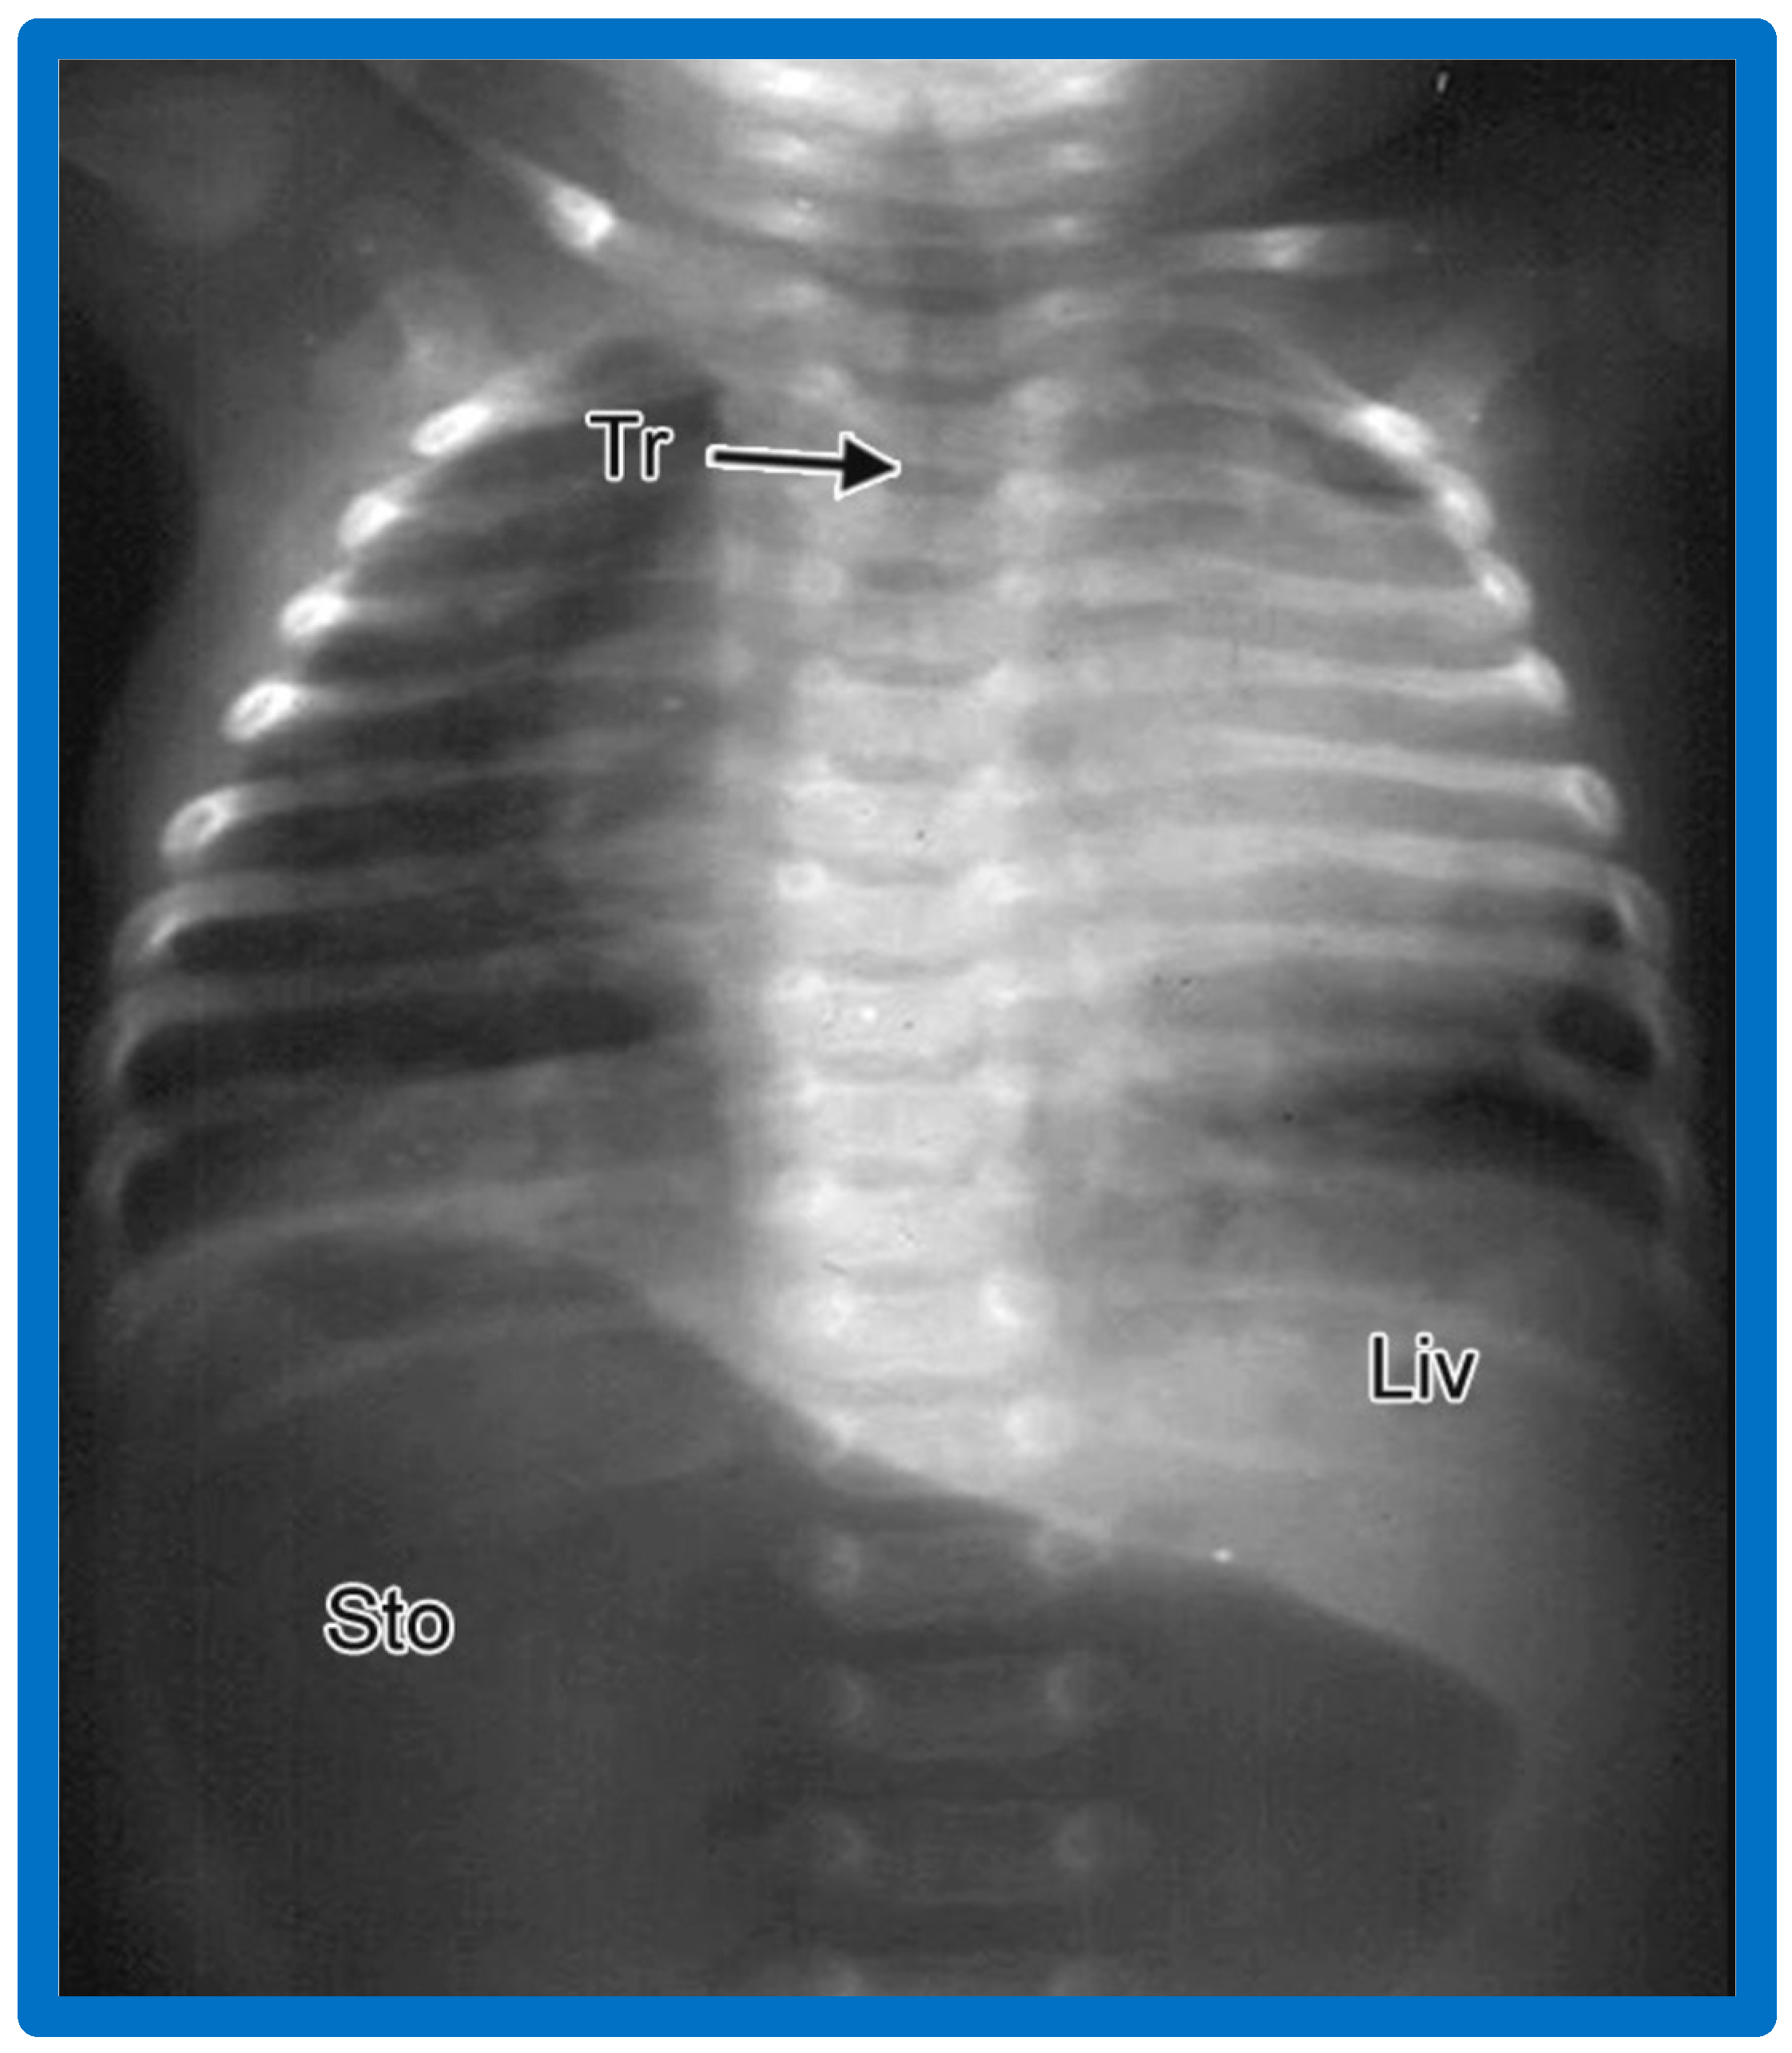
Figure 3.
Chest X-ray of a child demonstrating the heart in the right chest (dextrocardia). The positions of the liver (Liv) on the right side, and stomach (Sto) on the left side are seen, indicative of visceral situs solitus. This is described as isolated dextrocardia. Tr. Trachea; inverted L, indicates left. Sternal and pacemaker wires (not labeled) are seen and are related to prior surgery. Modified from reference [
5].
Figure 4.
Chest X-rays of two neonates with their hearts in the middle of the chest, mesocardia. (
A) The liver is visualized transversely in the abdomen; no gas bubble of the stomach (St) is seen. Therefore, visceroatrial situs cannot be determined with these findings. (
B) The gaseous opacity of the St is visualized on the left side of the abdomen, and the liver (Li) is seen on the right, suggesting situs solitus. Reproduced from reference [
4].
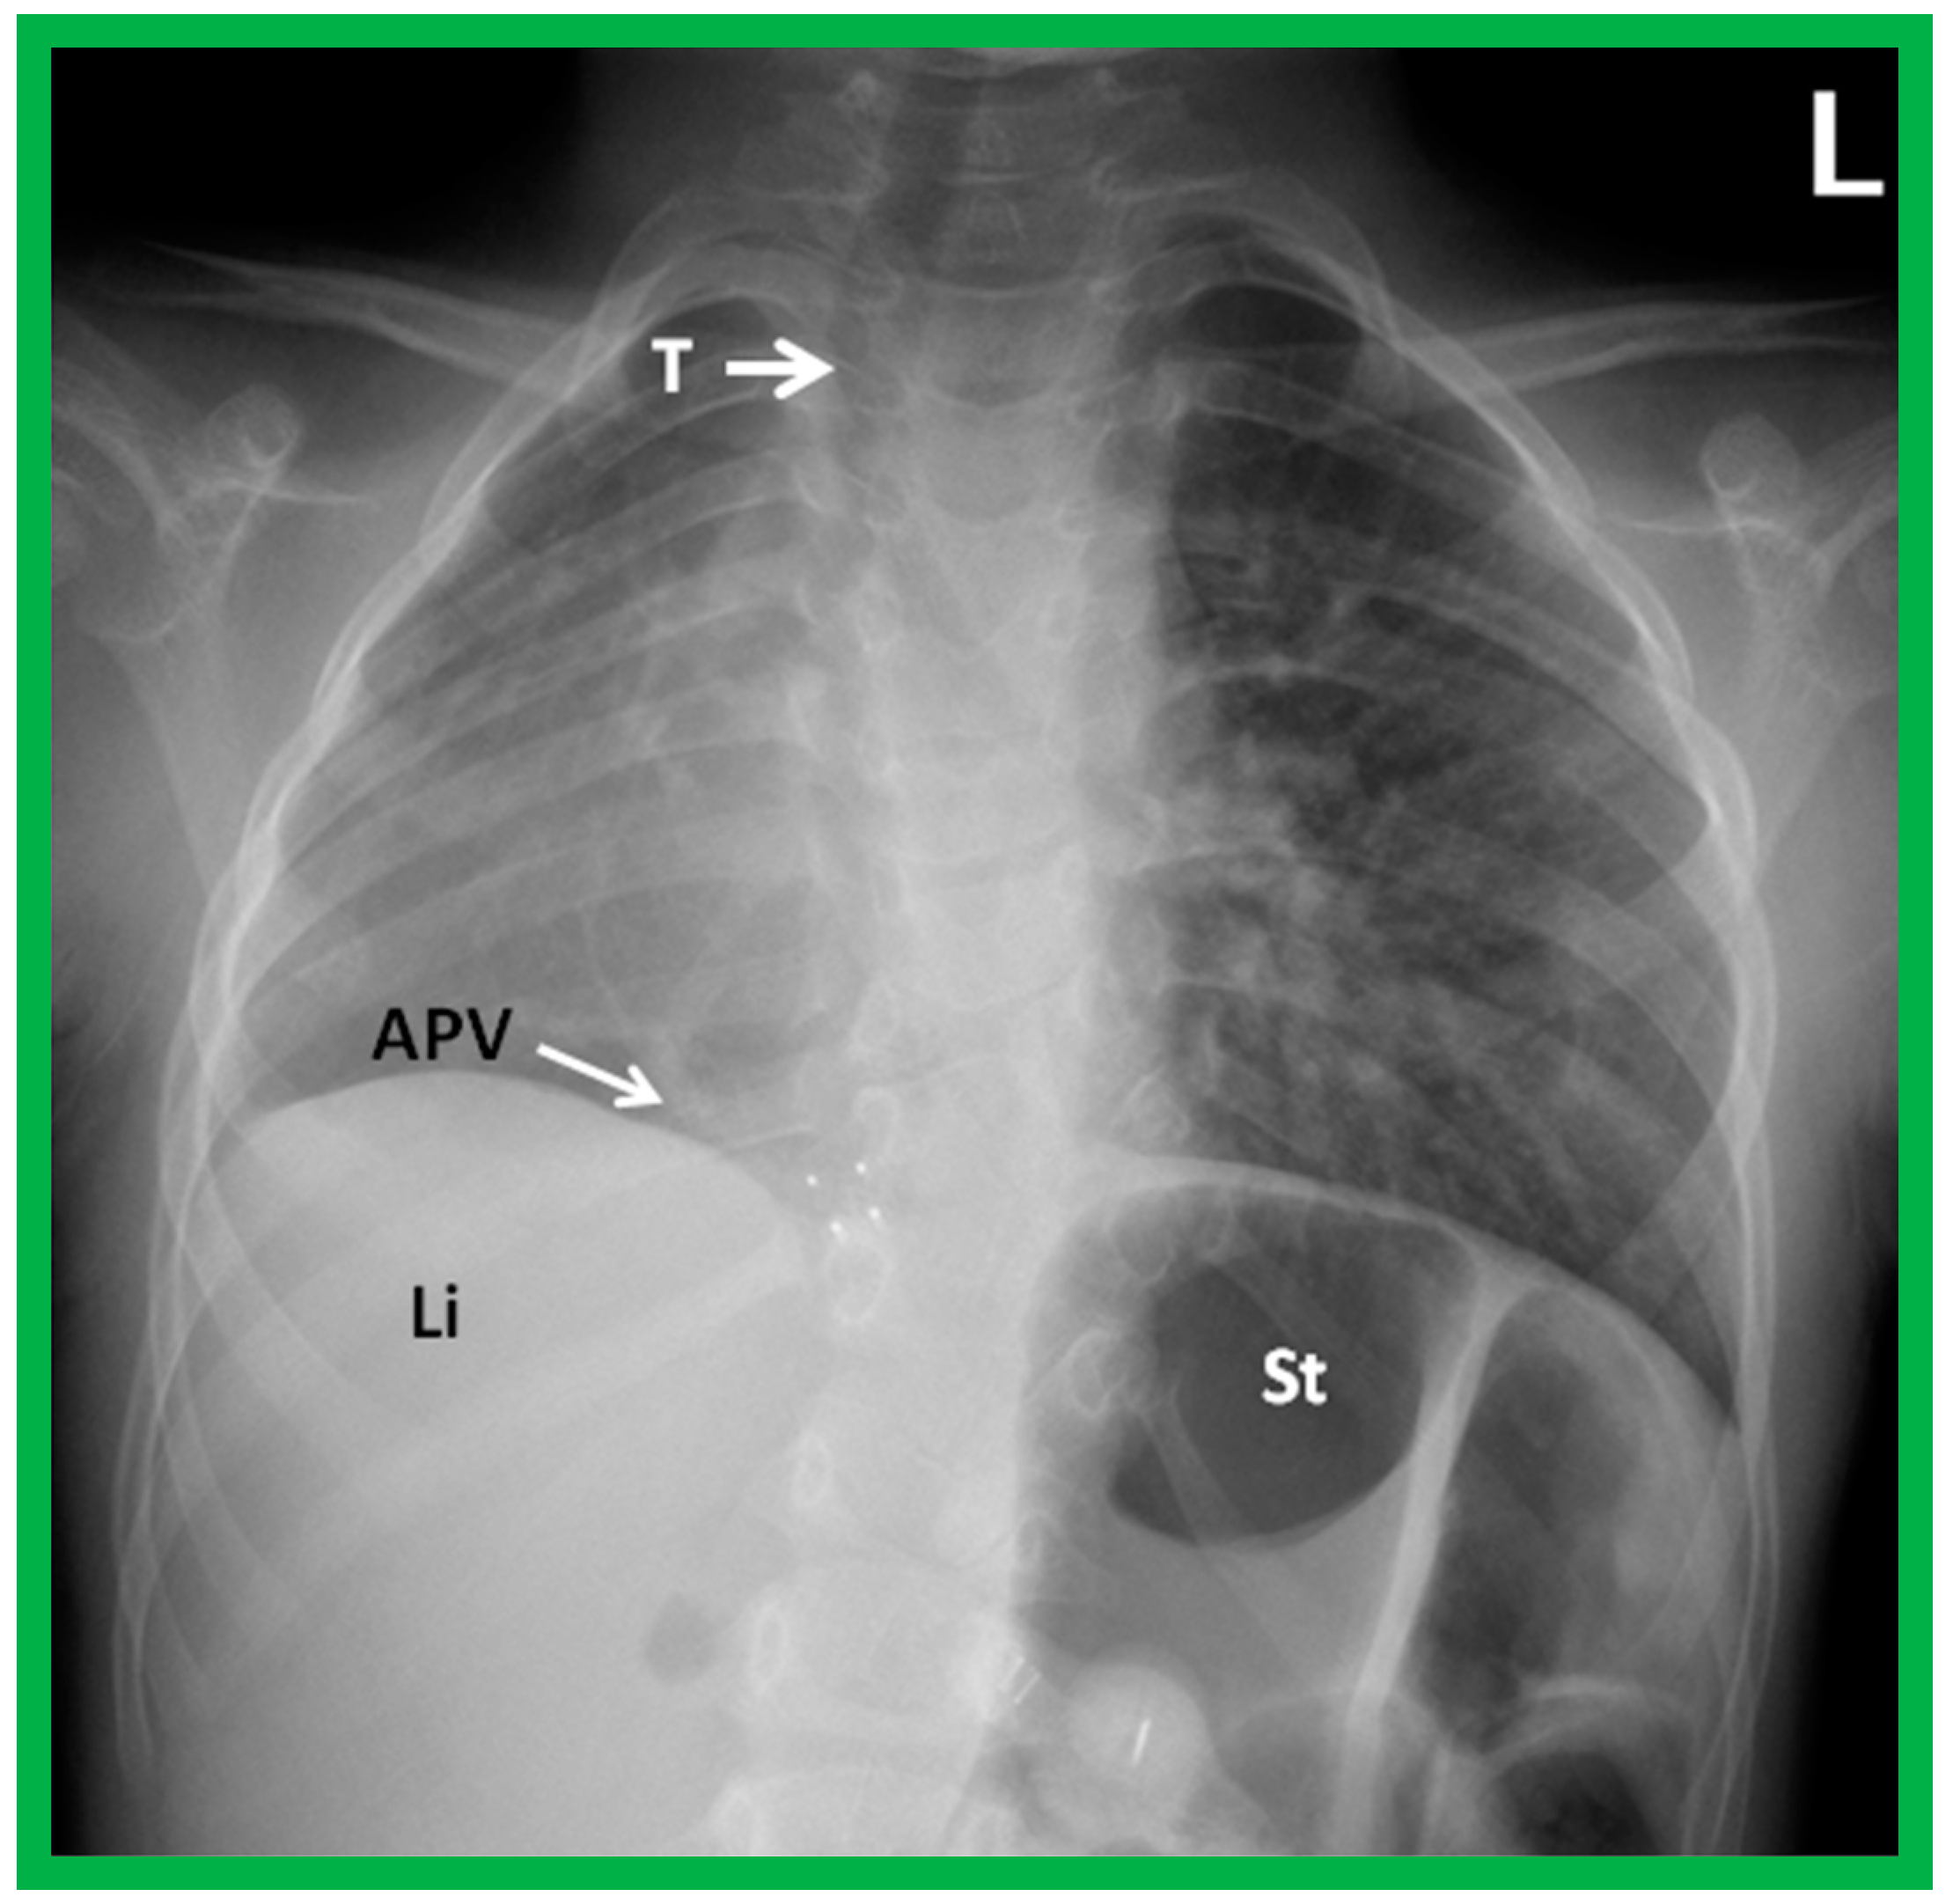
Figure 5.
A chest roentgenogram of a child with dextroposition of the heart related to Scimitar syndrome. Hypoplastic right lung pulls the heart to the right. Note that the trachea (T) is displaced to the right, related hypoplastic right lung. An anomalous pulmonary vein (APV) is pointed out by an arrow; the name, Scimitar syndrome is derived from the sickle shape of the APV. Li, liver; St, stomach. Reproduced from reference [
4].
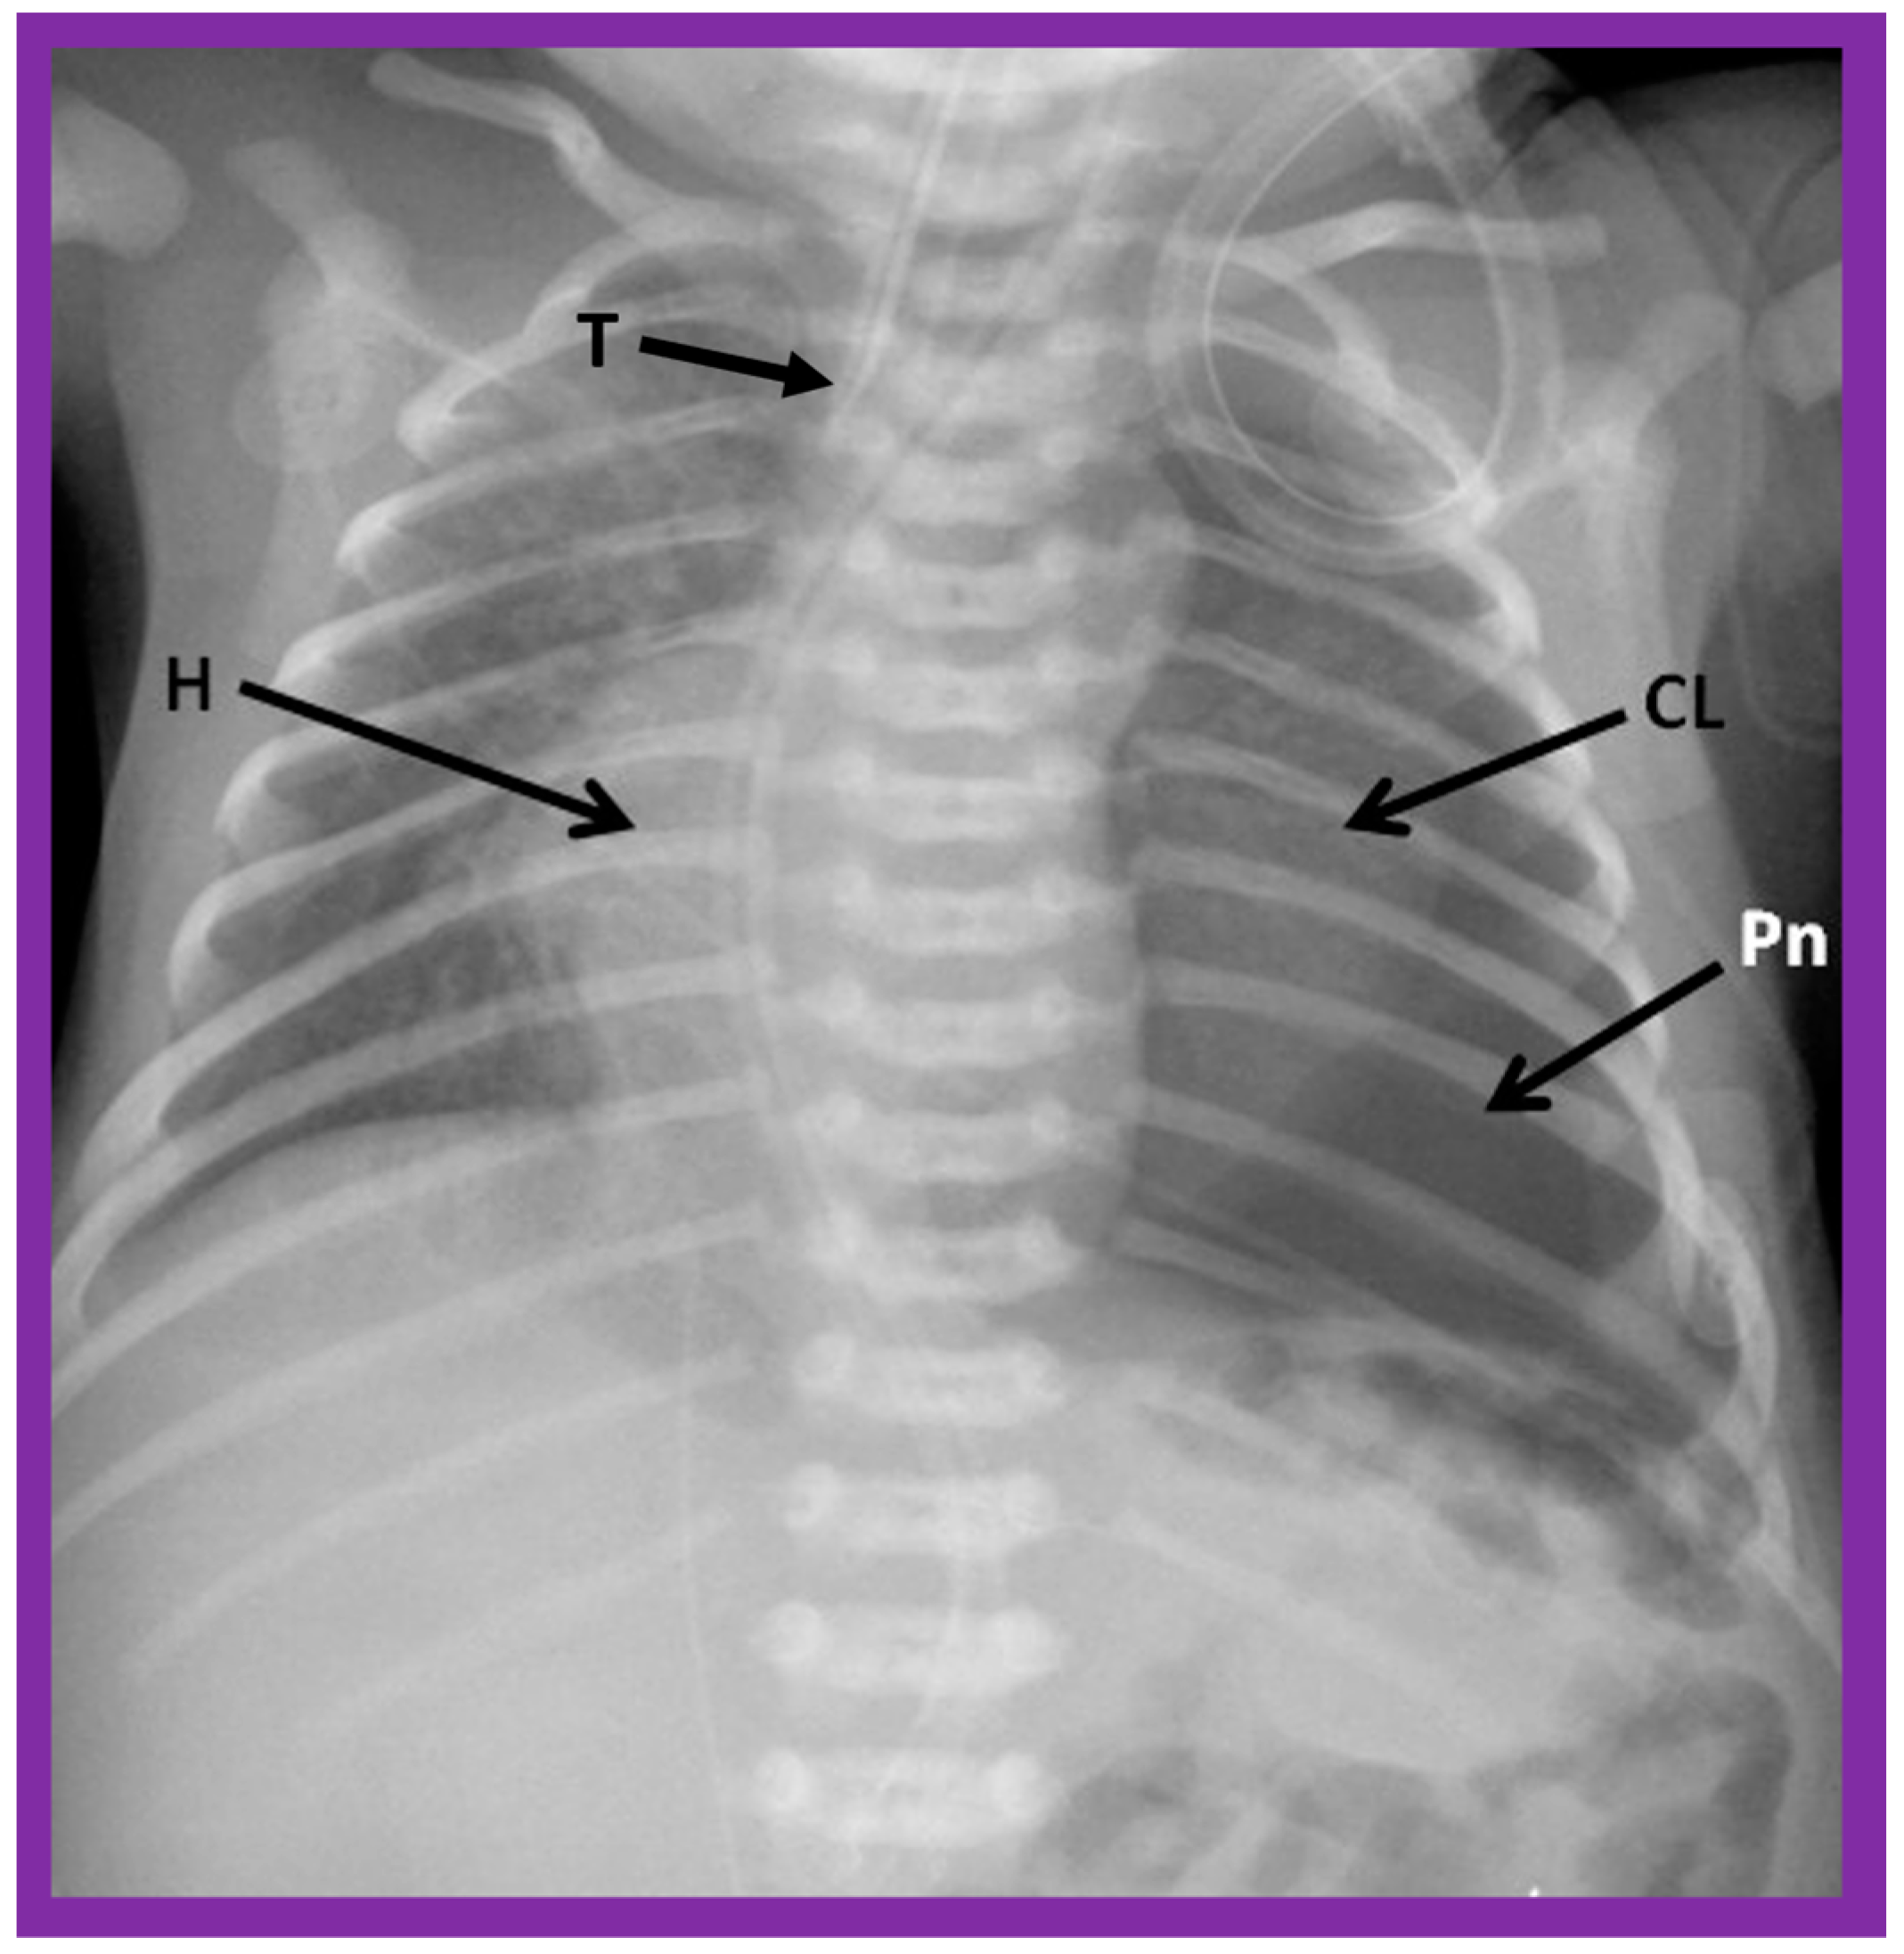
Figure 6.
A chest roentgenogram of a baby illustrating dextroposed heart (H) due to left pneumothorax (Pn) pushing the heart into the right side of the chest. A collapsed left lung (CL) is pointed out. The trachea (T) is seen to deviate to the right. Modified from reference [
4].
Figure 6.
A chest roentgenogram of a baby illustrating dextroposed heart (H) due to left pneumothorax (Pn) pushing the heart into the right side of the chest. A collapsed left lung (CL) is pointed out. The trachea (T) is seen to deviate to the right. Modified from reference [
4].
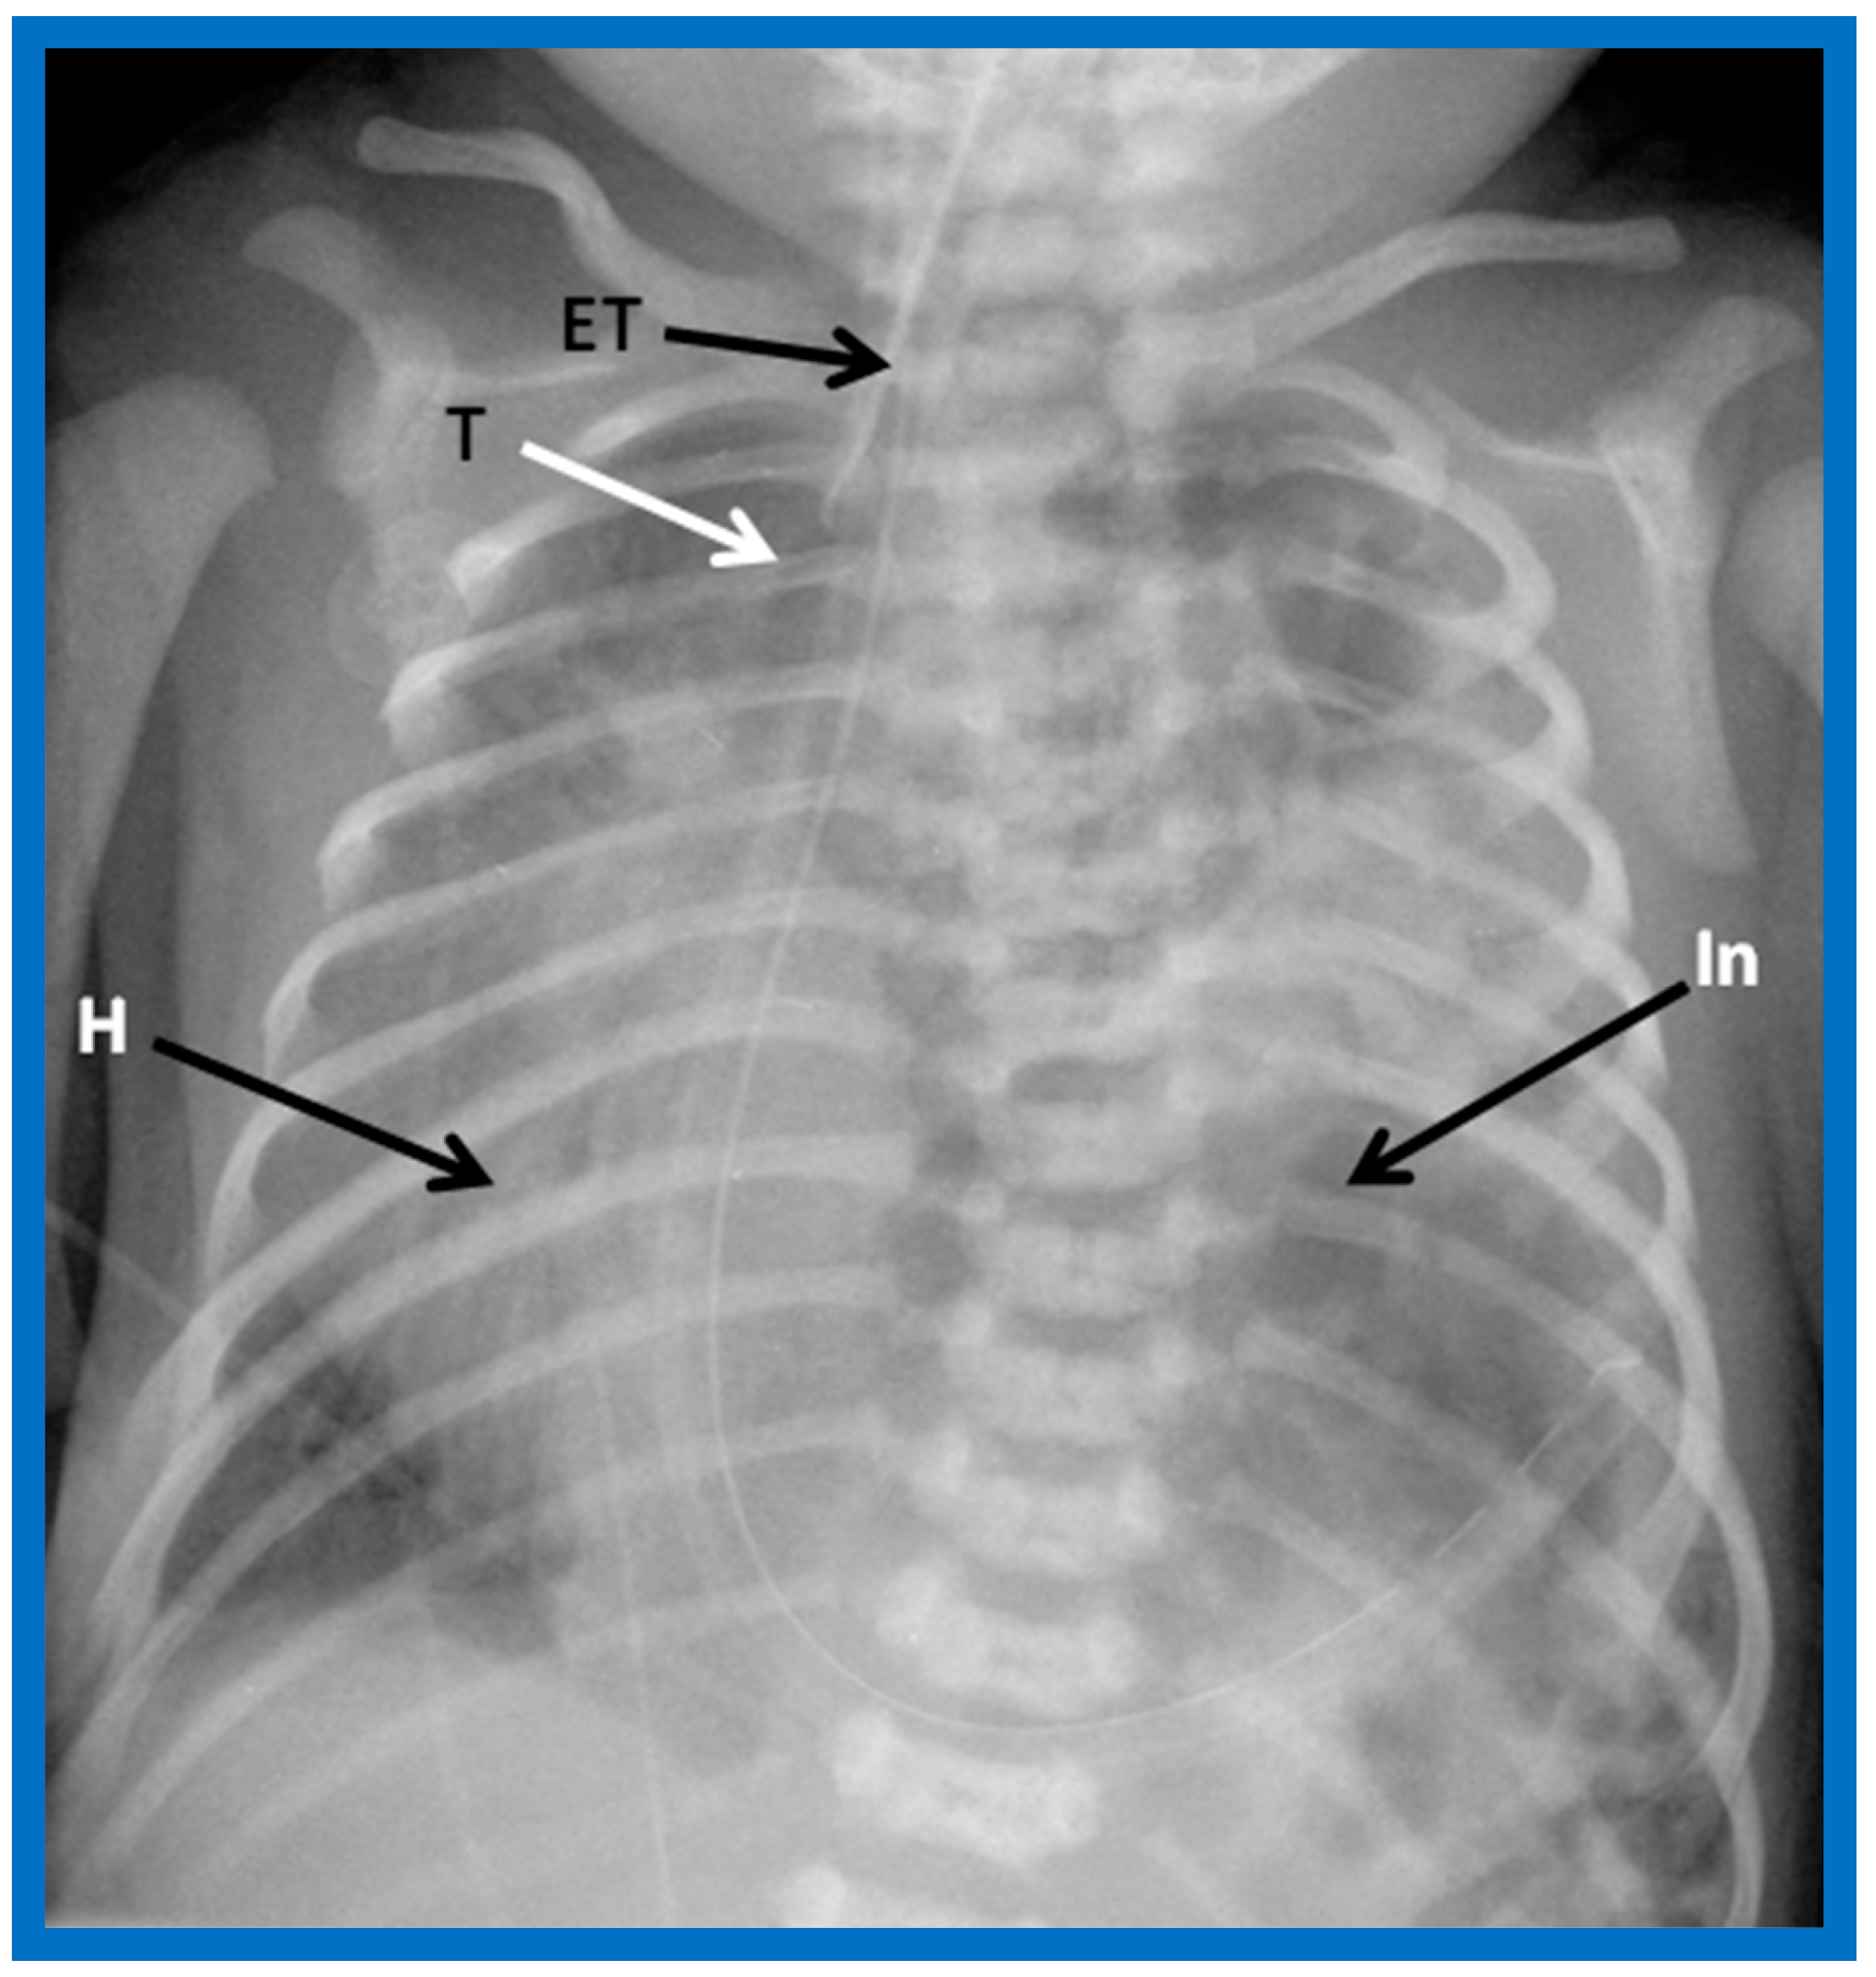
Figure 7.
A chest roentgenogram of an infant demonstrating dextroposed heart (H) secondary to diaphragmatic hernia on the left side. The abdominal contents, including intestines (In) are relocated to the left side of the chest because of the diaphragmatic defect, pushing the heart into the right chest. The trachea (T) is displaced to the right. ET, endotracheal tube. Reproduced from reference [
4].
Figure 8.
A chest roentgenogram of an infant demonstrating that the heart (H) is located in the right chest (dextrocardia), and there is left to right reversal of viscera (situs inversus). In this condition, the liver (Liv) is on the left side of the abdomen while the stomach (Sto) is on the right, i.e., situs inversus totalis. Tr, trachea. Reproduced from reference [
4].
Figure 9.
Chest roentgenograms of two babies with dextrocardia demonstrating liver across the entire abdomen. These babies were later diagnosed with asplenia syndrome. Umbilical venous and arterial catheters (not labeled) are seen in both (A) and (B).
Figure 9.
Chest roentgenograms of two babies with dextrocardia demonstrating liver across the entire abdomen. These babies were later diagnosed with asplenia syndrome. Umbilical venous and arterial catheters (not labeled) are seen in both (A) and (B).
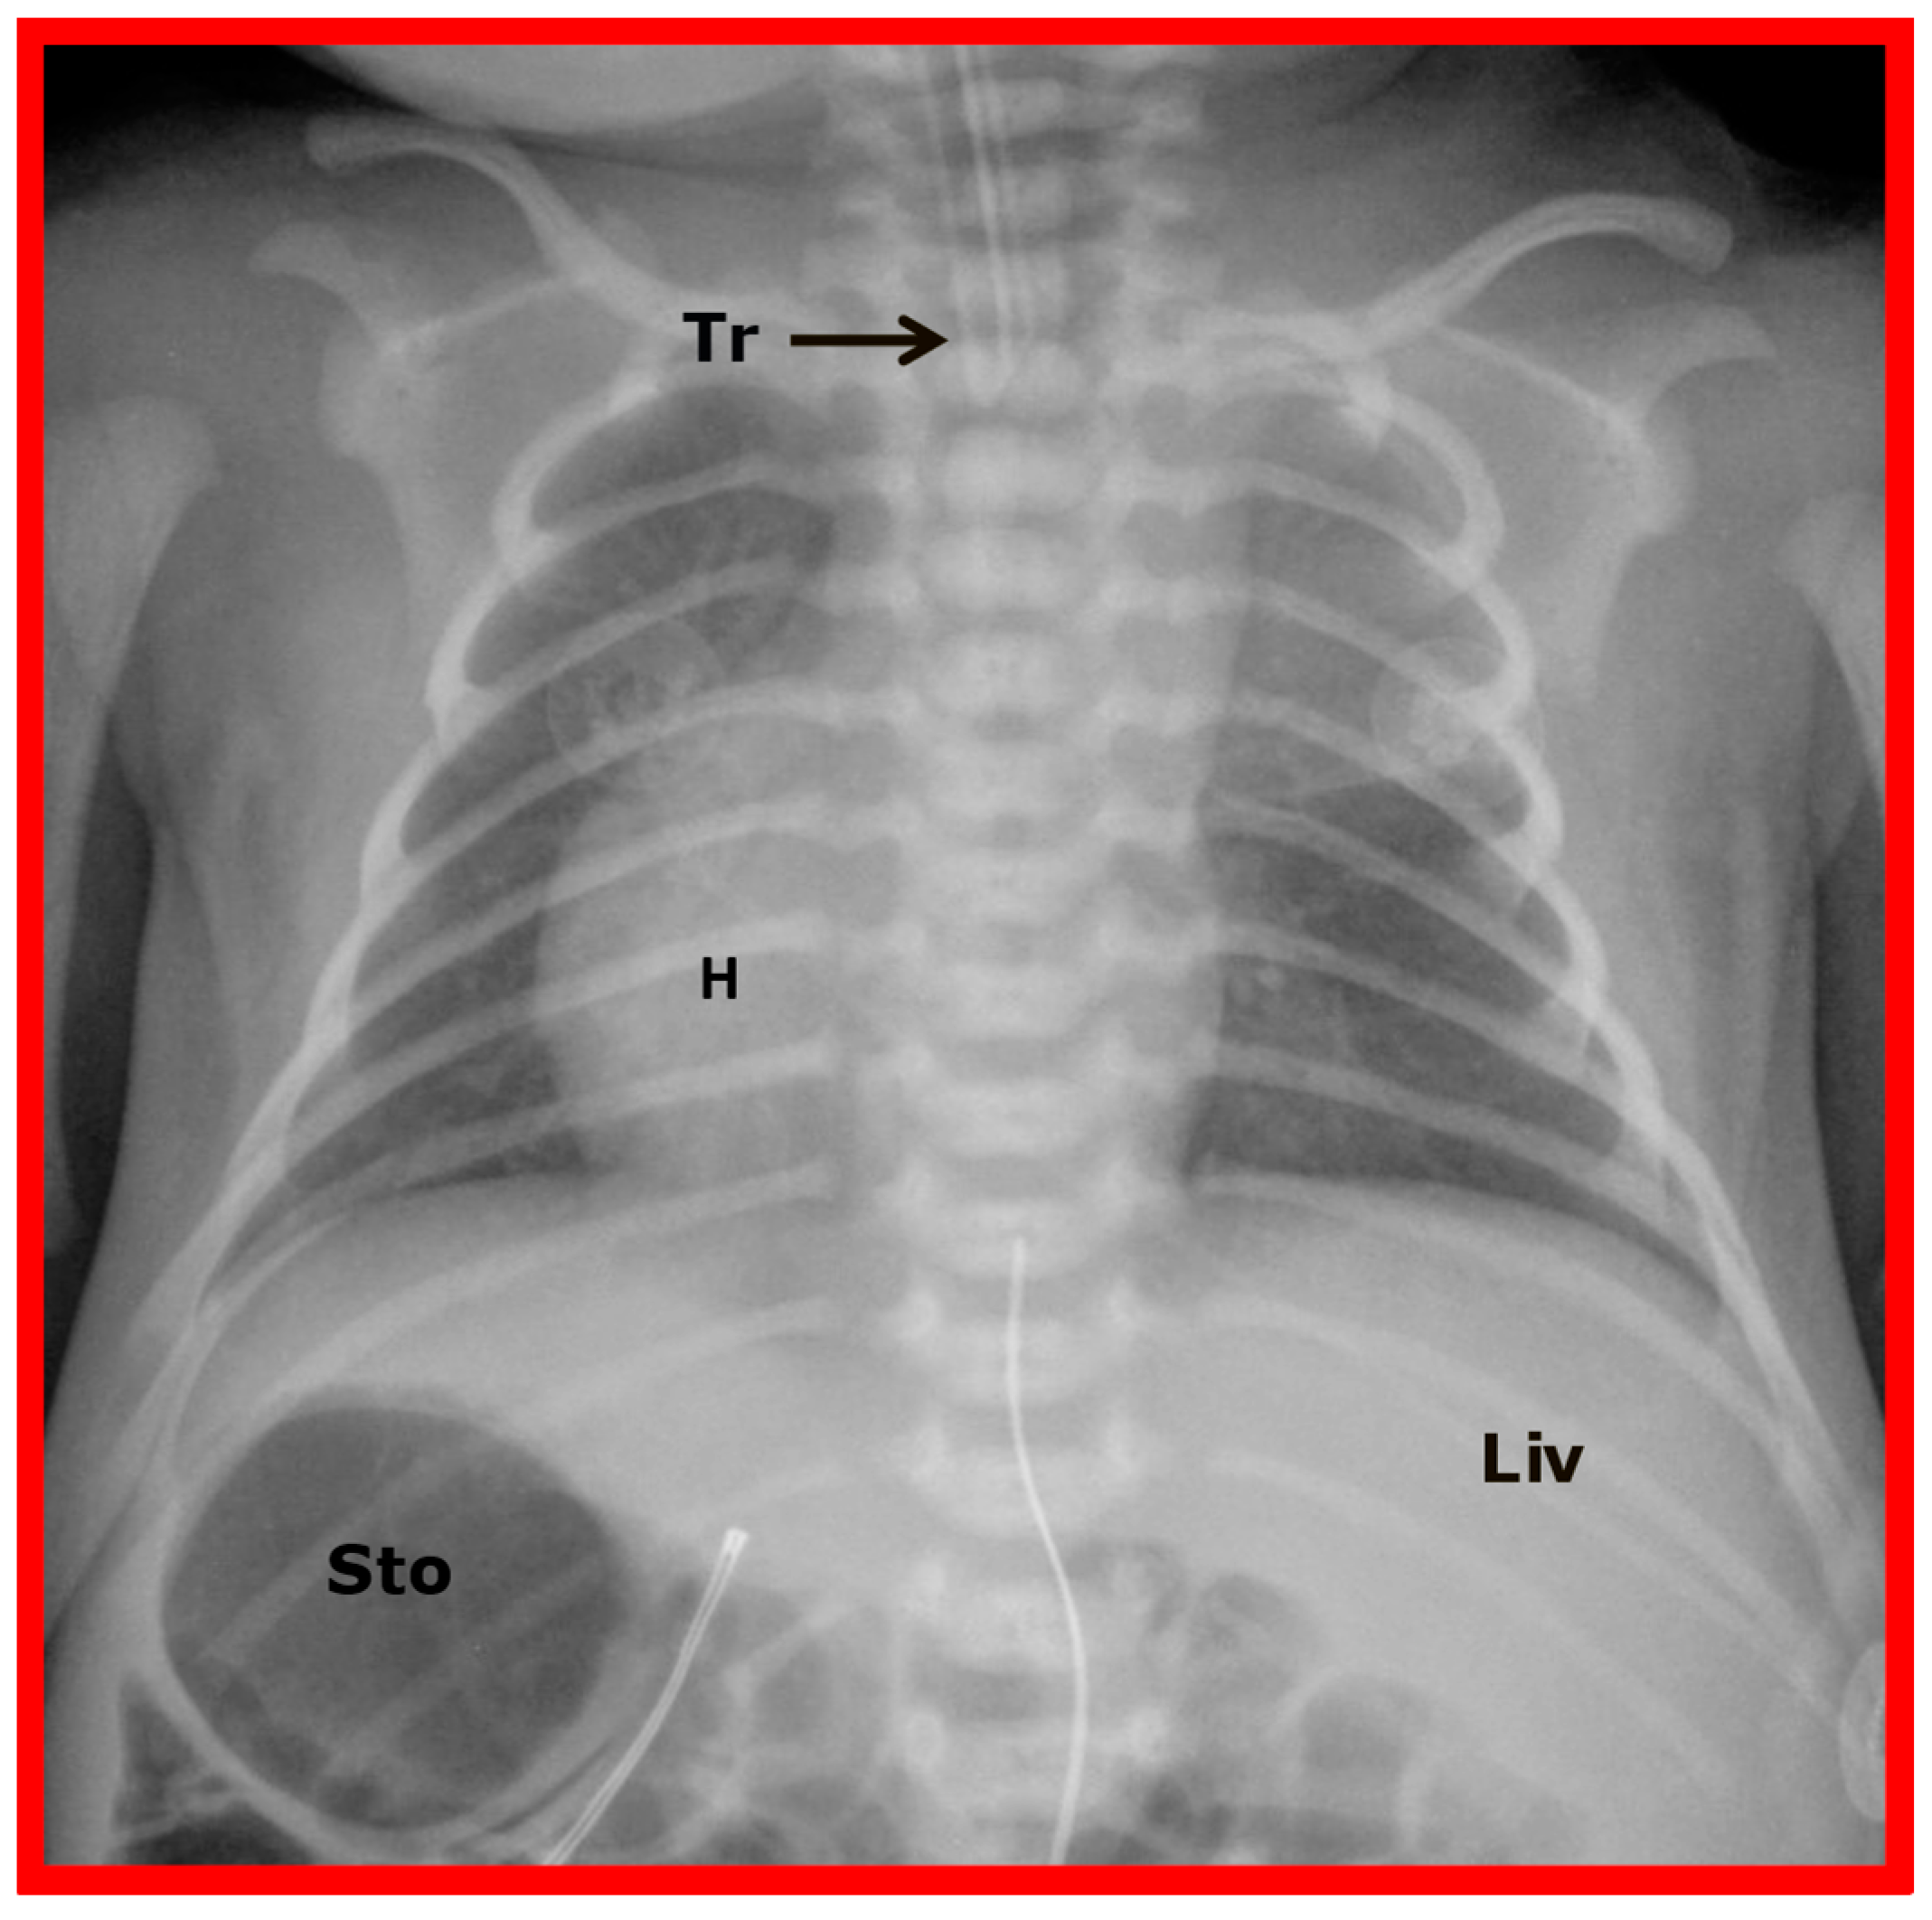
Figure 10.
A chest roentgenogram of a baby illustrating dextrocardia along with normal visceral position (situs solitus) with the liver (Liv) on the right side and the stomach (Sto) on the left side, i.e., isolated dextrocardia. The tracheal (Tr) position in the middle is shown. The Sto is dilated, probably related to intestinal obstruction secondary to malrotation of the gut. Modified from reference [
4].
Figure 11.
A chest roentgenogram of a baby who has isolated levocardia. The heart is on the left side, which is normal (levocardia), while the stomach (Sto) and the liver (Liv) are reversed (situs inversus). The marked dilatation of the Sto is likely due to intestinal obstruction secondary to malrotation of the gut. Modified from reference [
4].
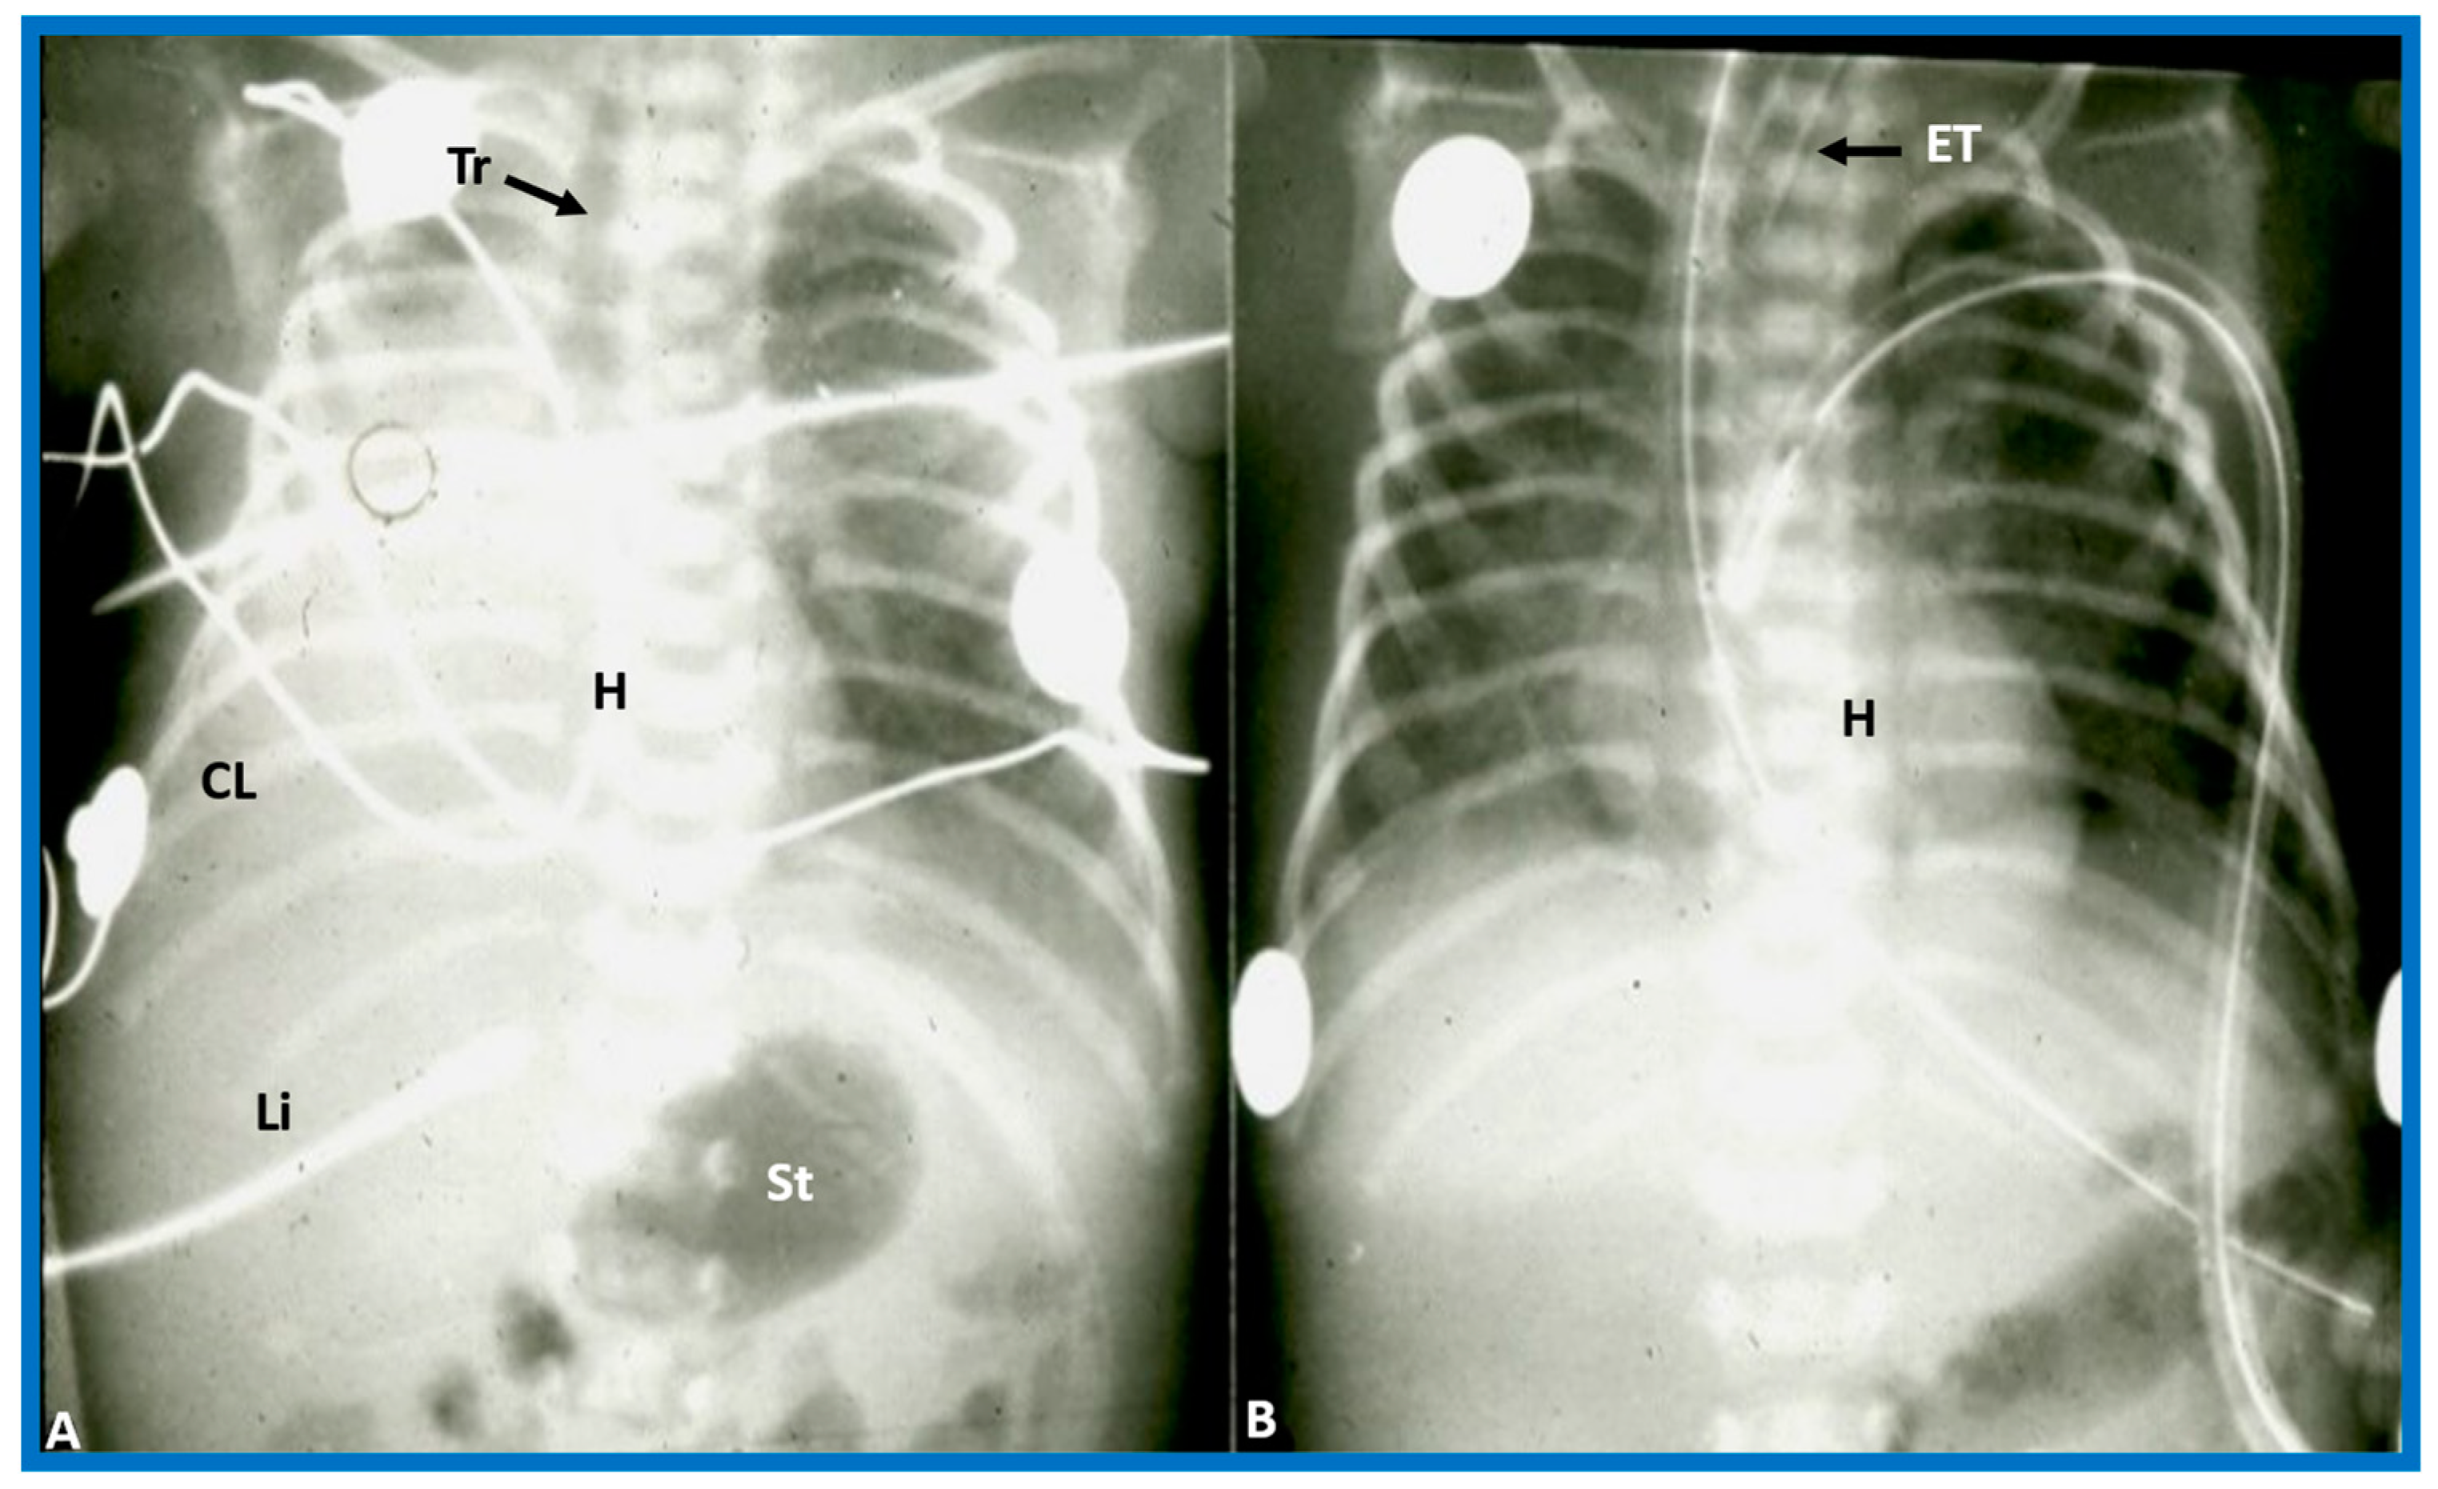
Figure 12.
Chest X-rays of a five-year-old patient who was seen for evaluation since the referring physician noted a right-sided heart. Physical examination was unremarkable. (
A) The heart (H) is displaced to the right, and there was no obvious pulmonary pathology. The gaseous shadow of the stomach (St) is located on the left side (normal). (
B) The sternum (arrow) is showing posterior displacement, presumably causing dextroposition of the heart. Modified from reference [
3].
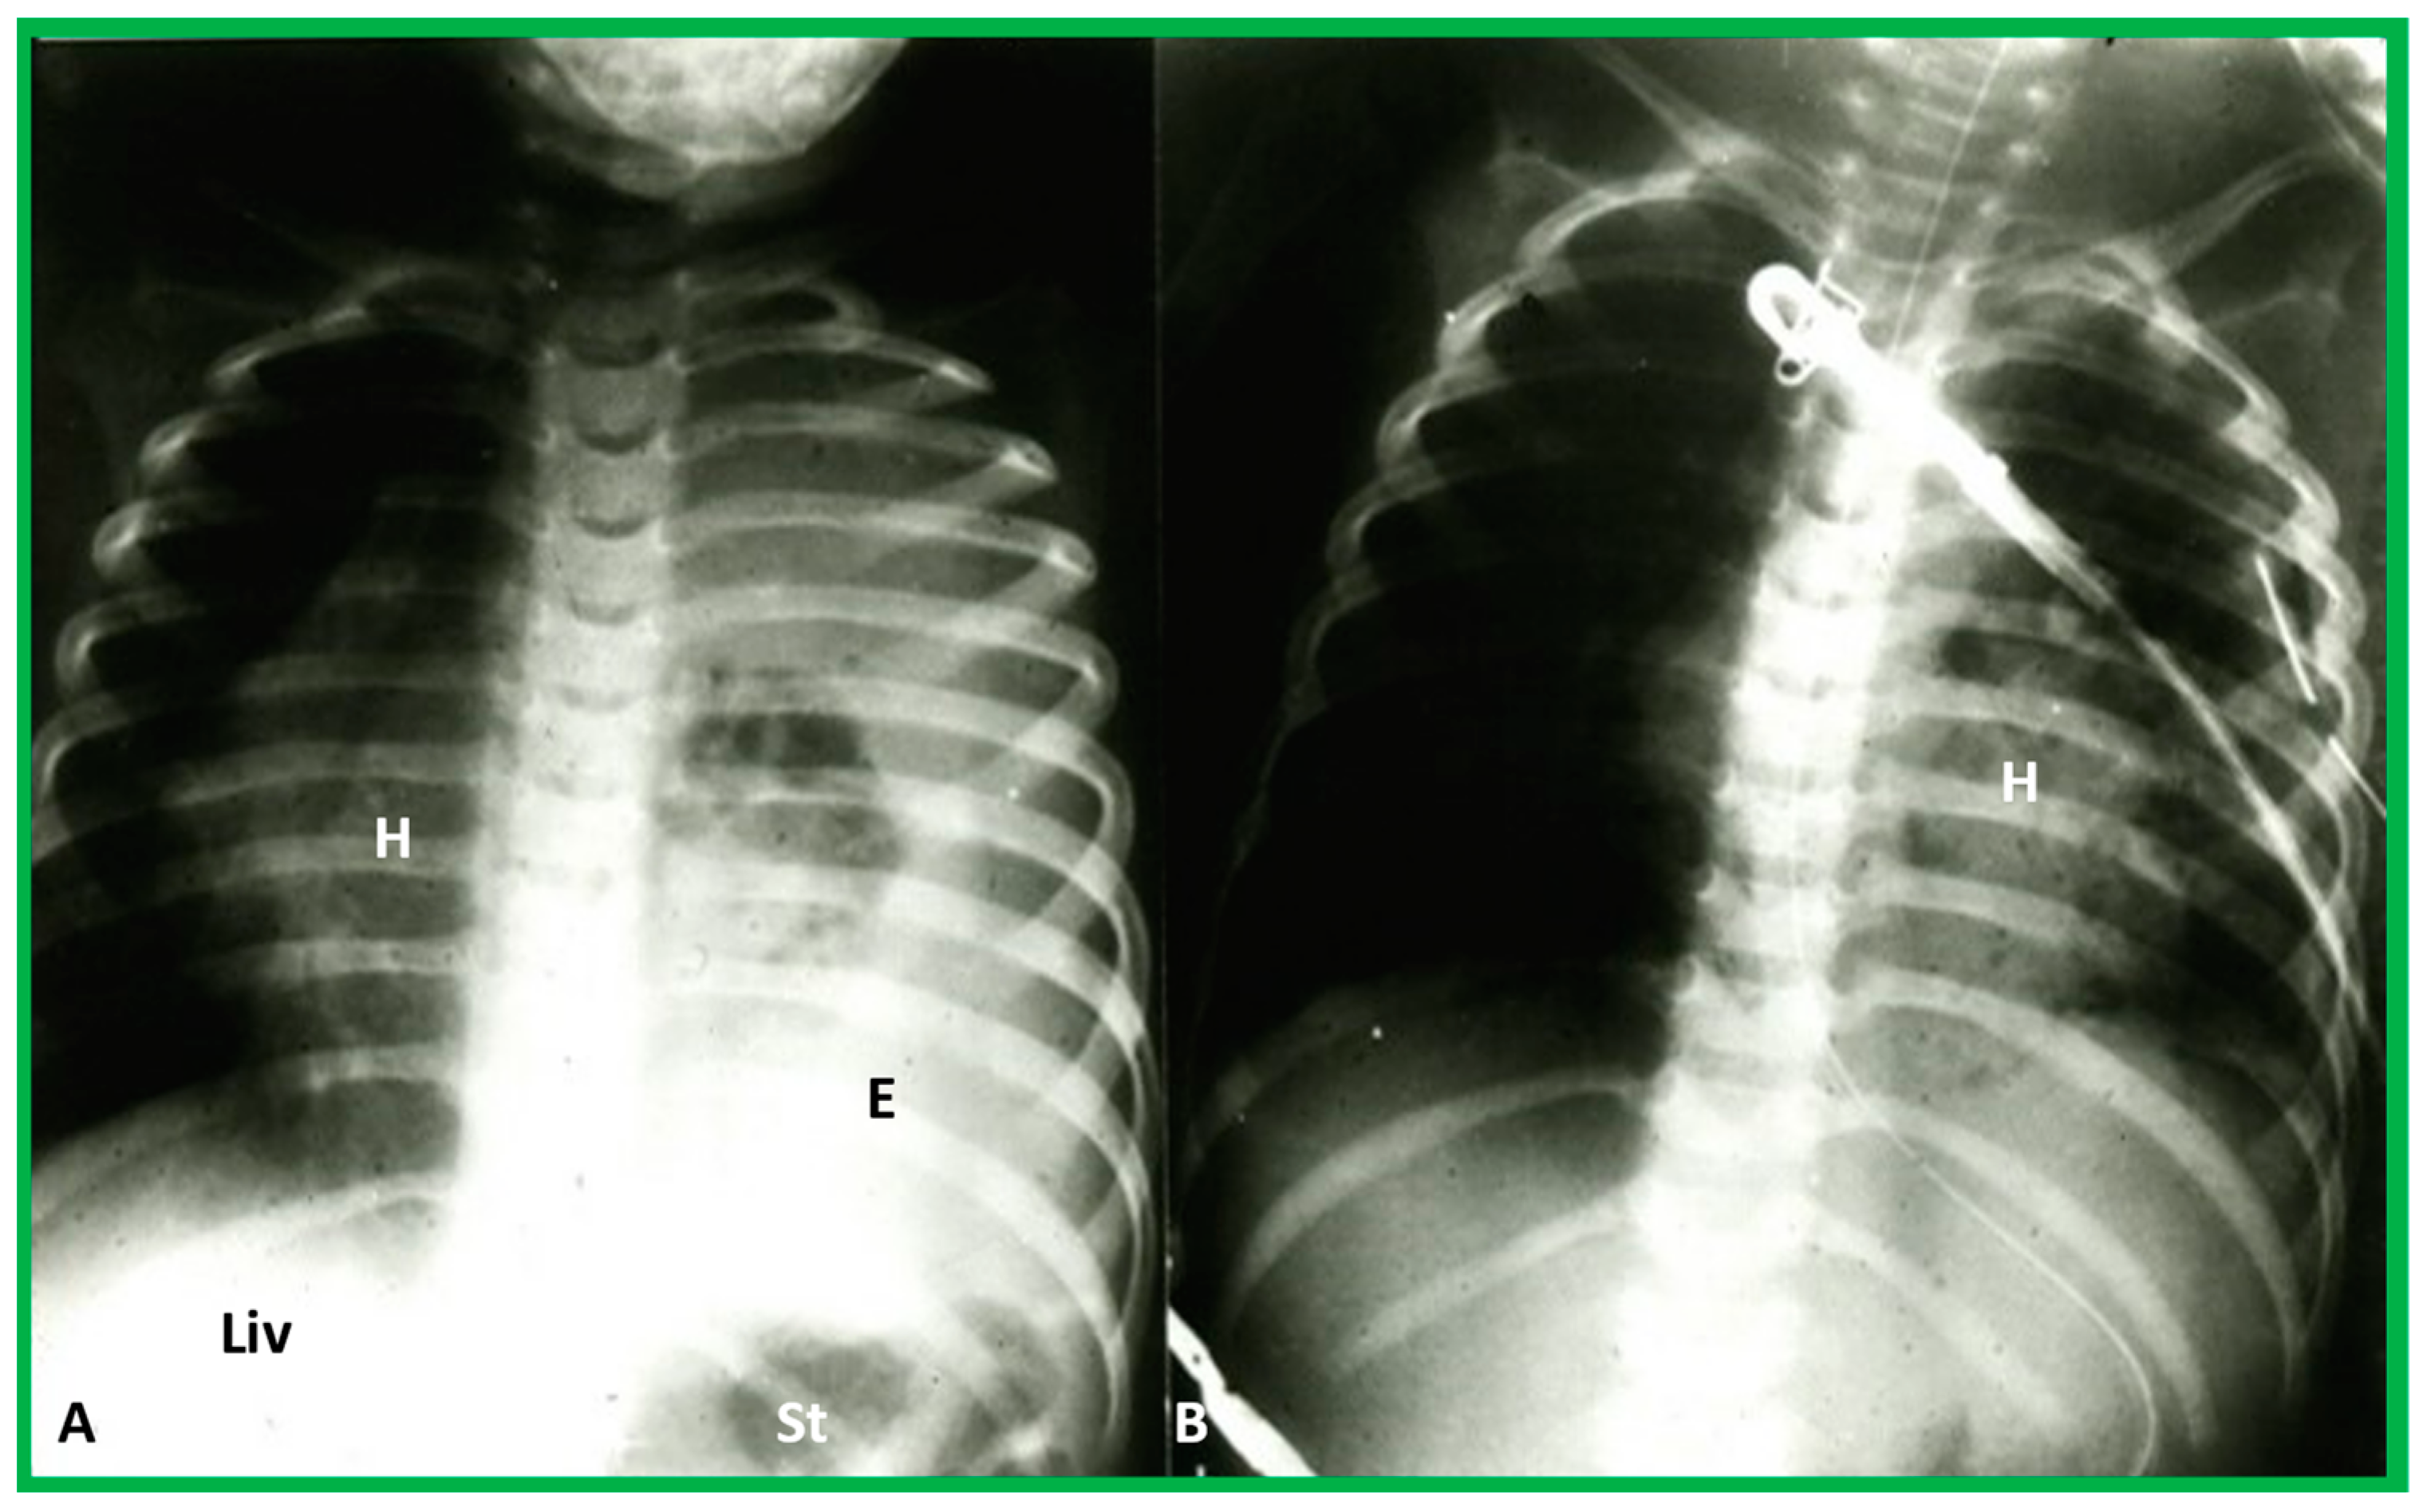
Figure 13.
(
A) Chest X-ray of a child with left-sided empyema (E), displacing the heart (H) to the right side. The liver (Liv) and stomach bubble (St) are in a normal position, indicating no evidence of situs abnormality. (
B) Following drainage of empyema, the H is moved back into the left side of the chest. Modified from reference [
3].
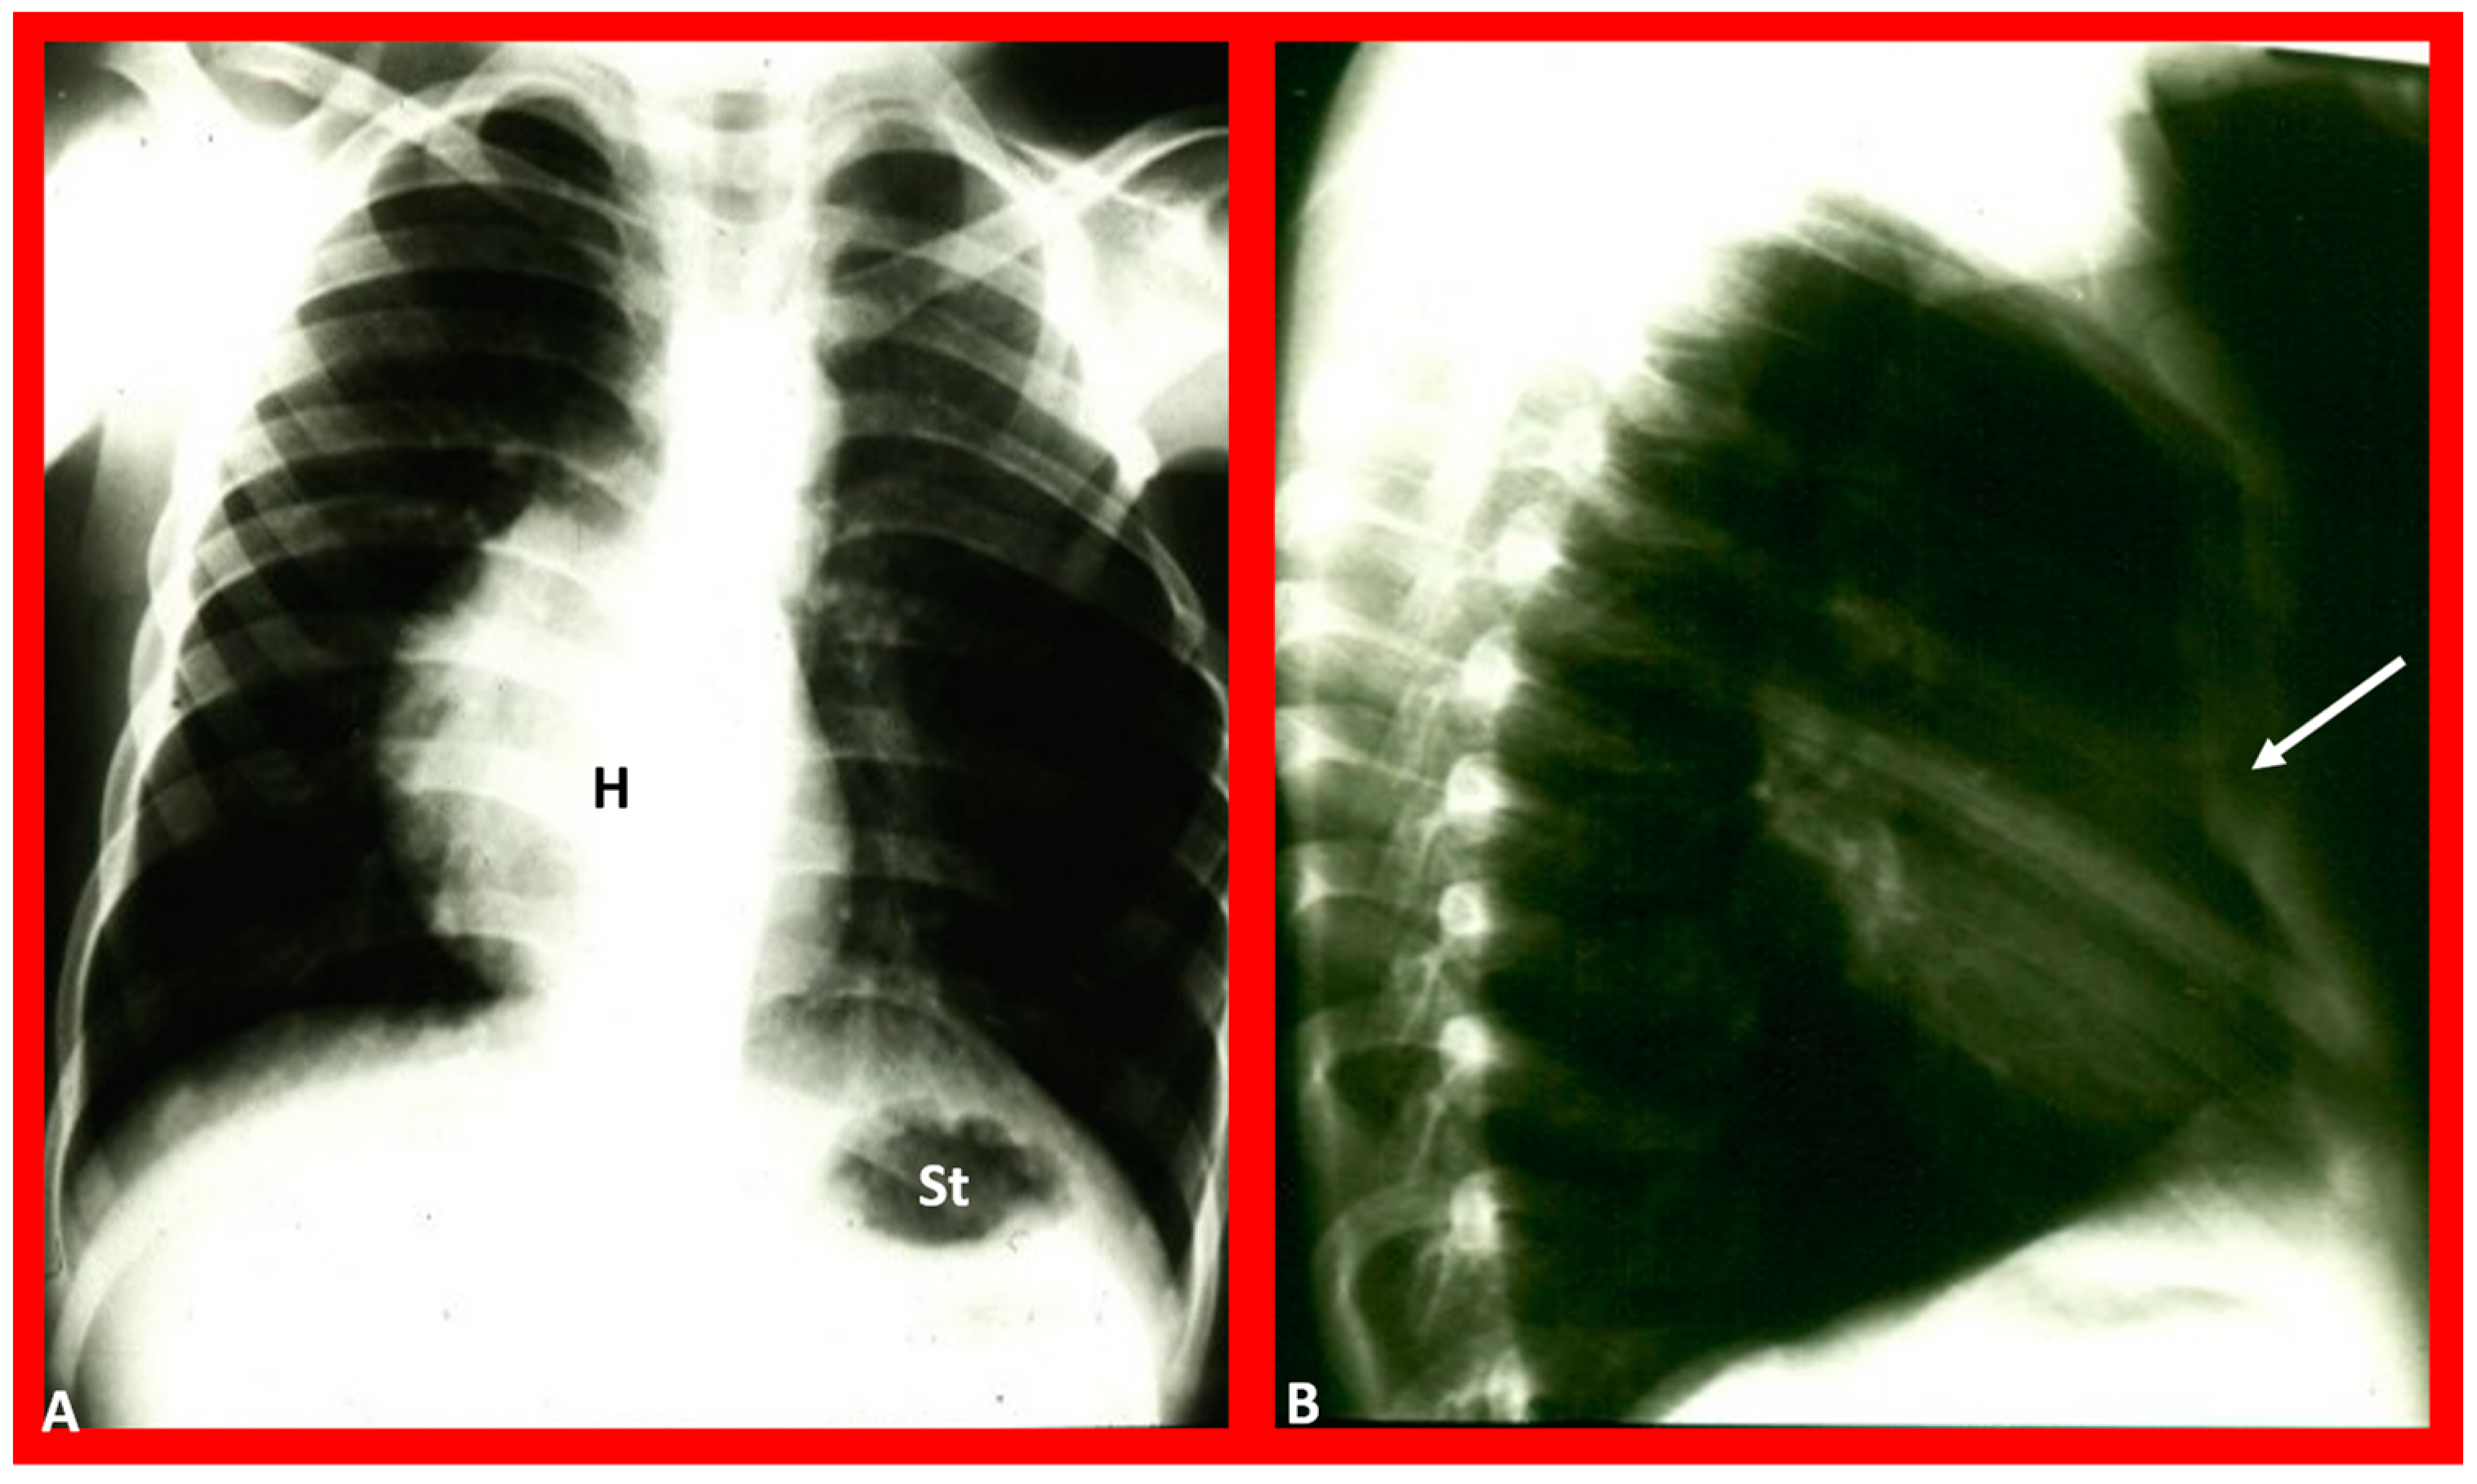
Figure 14.
Chest film in posteroanterior (
A) and lateral (
B) projections demonstrate a large pulmonary cyst, shown with arrows. As one can see, the heart (H) is pushed to the right, i.e., dextroposition of the heart. St, stomach bubble. Reproduced from reference [
22].
Figure 14.
Chest film in posteroanterior (
A) and lateral (
B) projections demonstrate a large pulmonary cyst, shown with arrows. As one can see, the heart (H) is pushed to the right, i.e., dextroposition of the heart. St, stomach bubble. Reproduced from reference [
22].
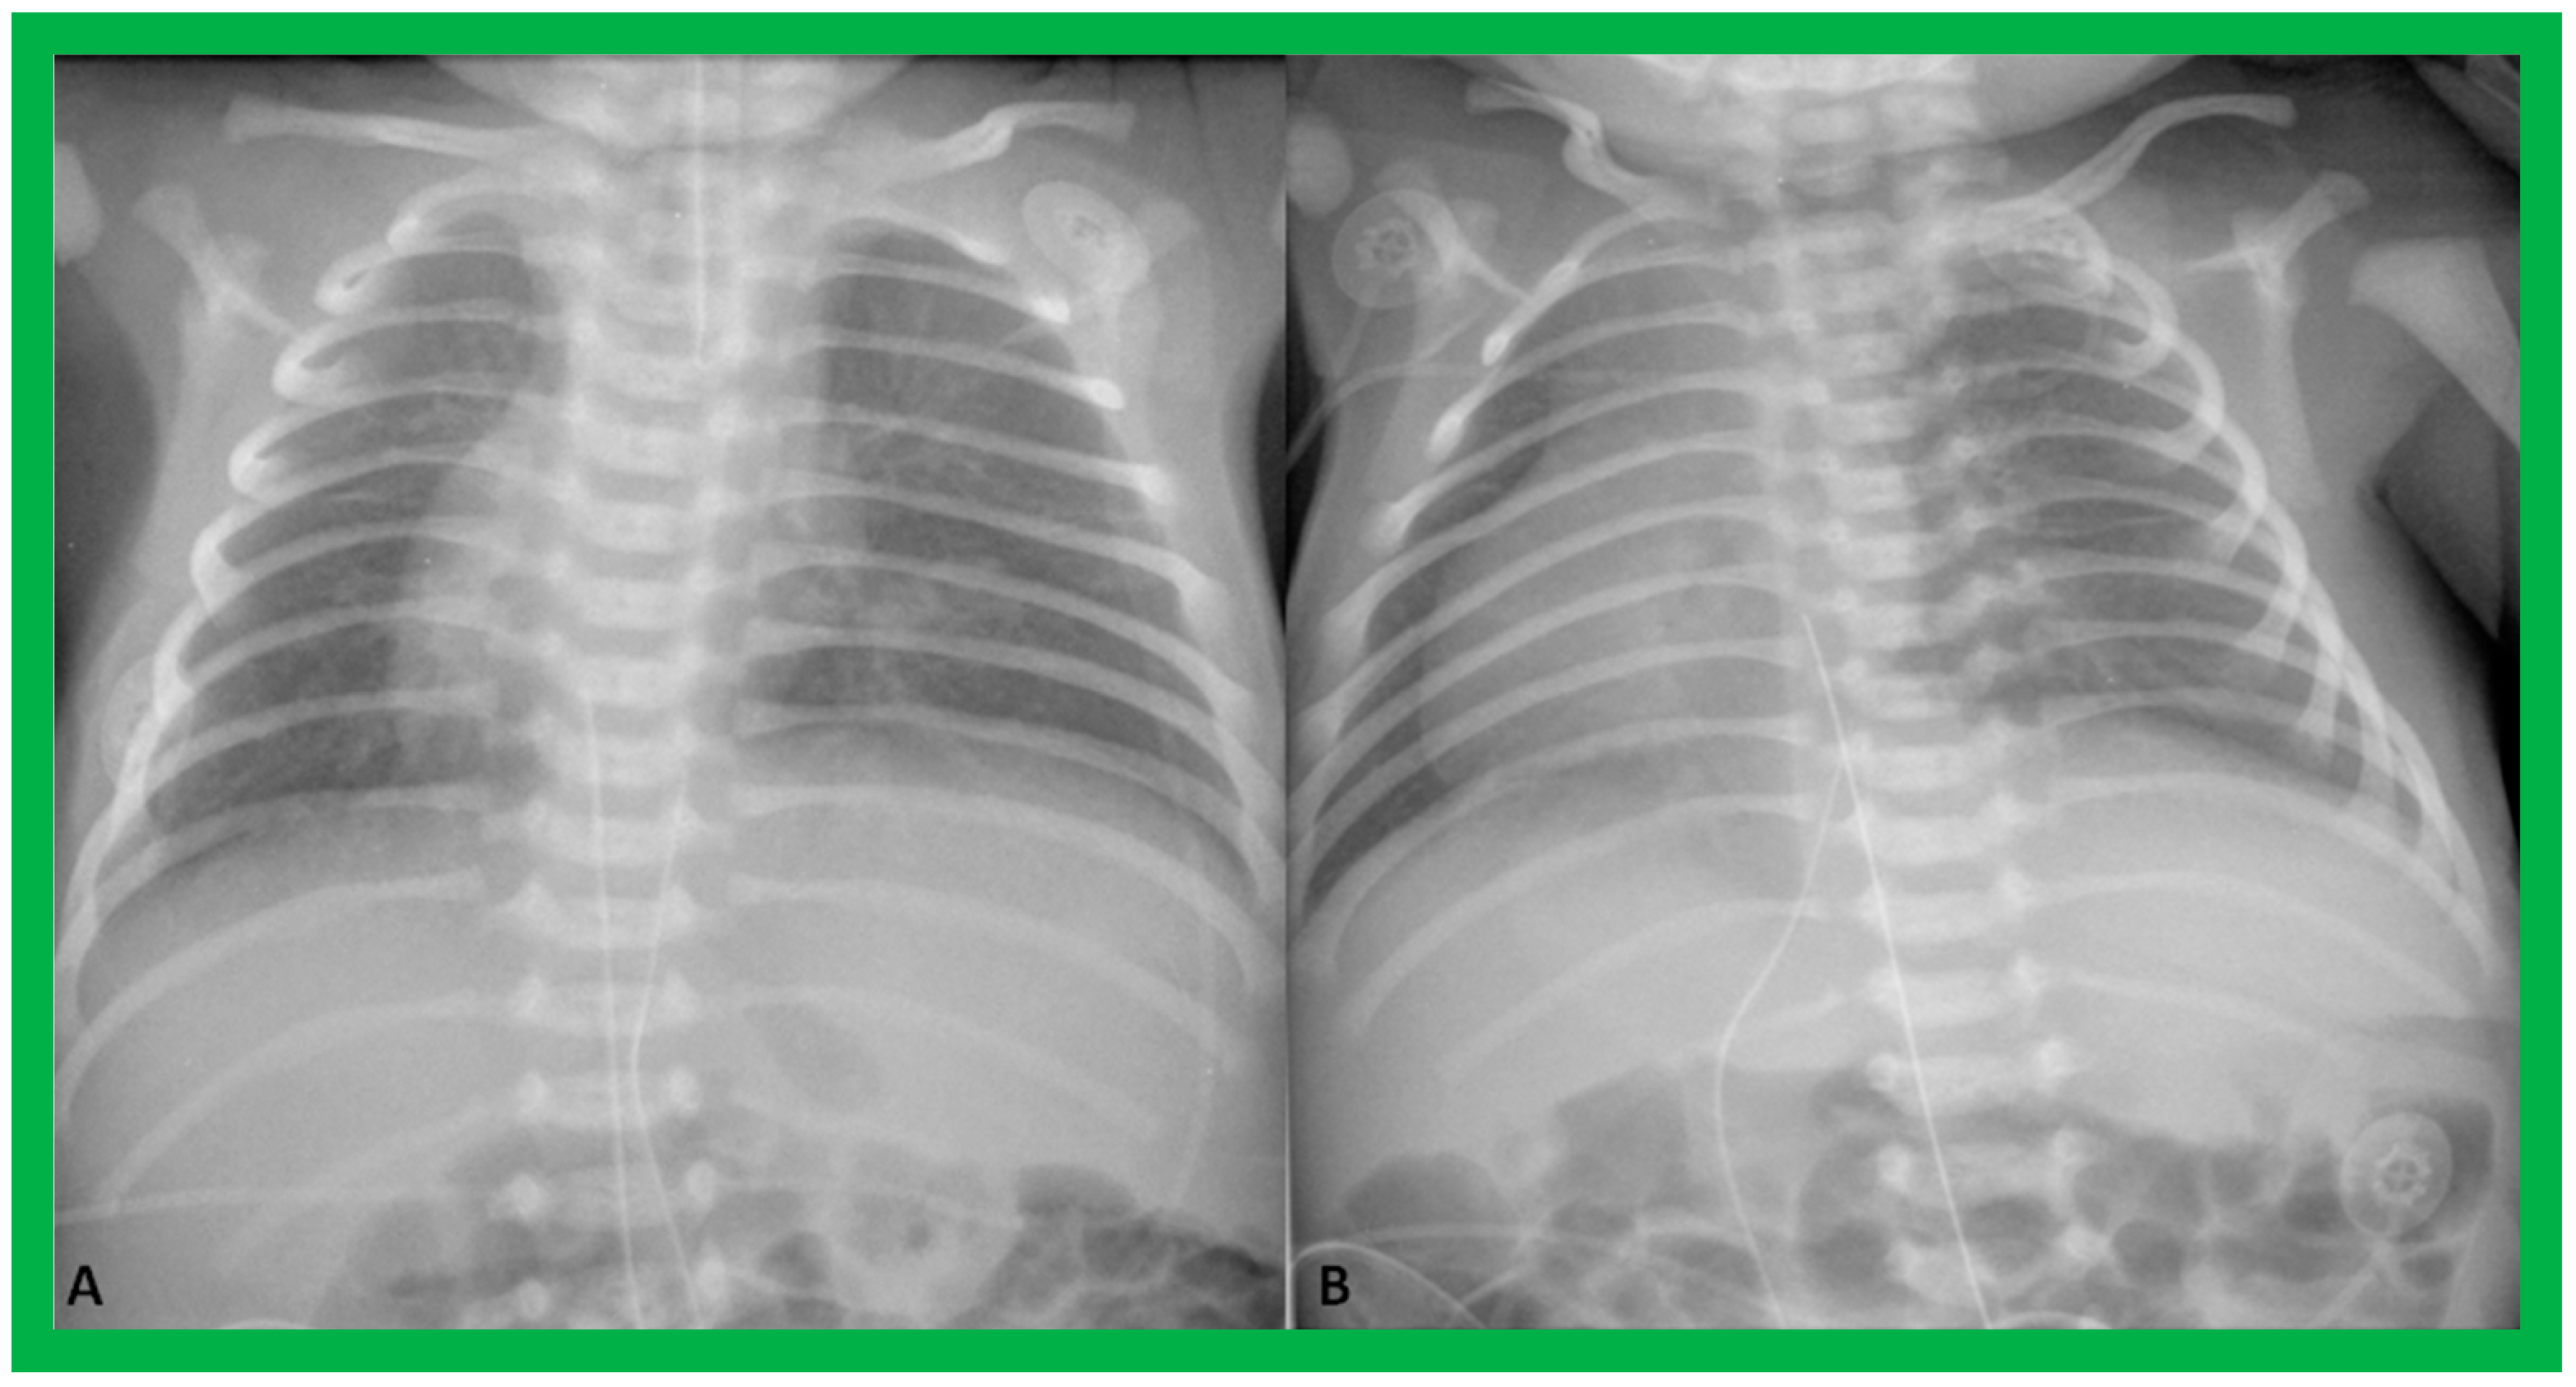
Figure 15.
(
A) Chest X-ray of a baby who had collapsed right lung (CL), pulling the heart (H) to the right, causing dextroposition of the H. The trachea (Tr) is shifted to the right side. The liver (Li) and stomach (St) bubble are in the normal position (situs solitus). (
B) Following endotracheal (ET) intubation and suctioning, the right lung expanded, returning the H to its normal position. Modified from reference [
4].
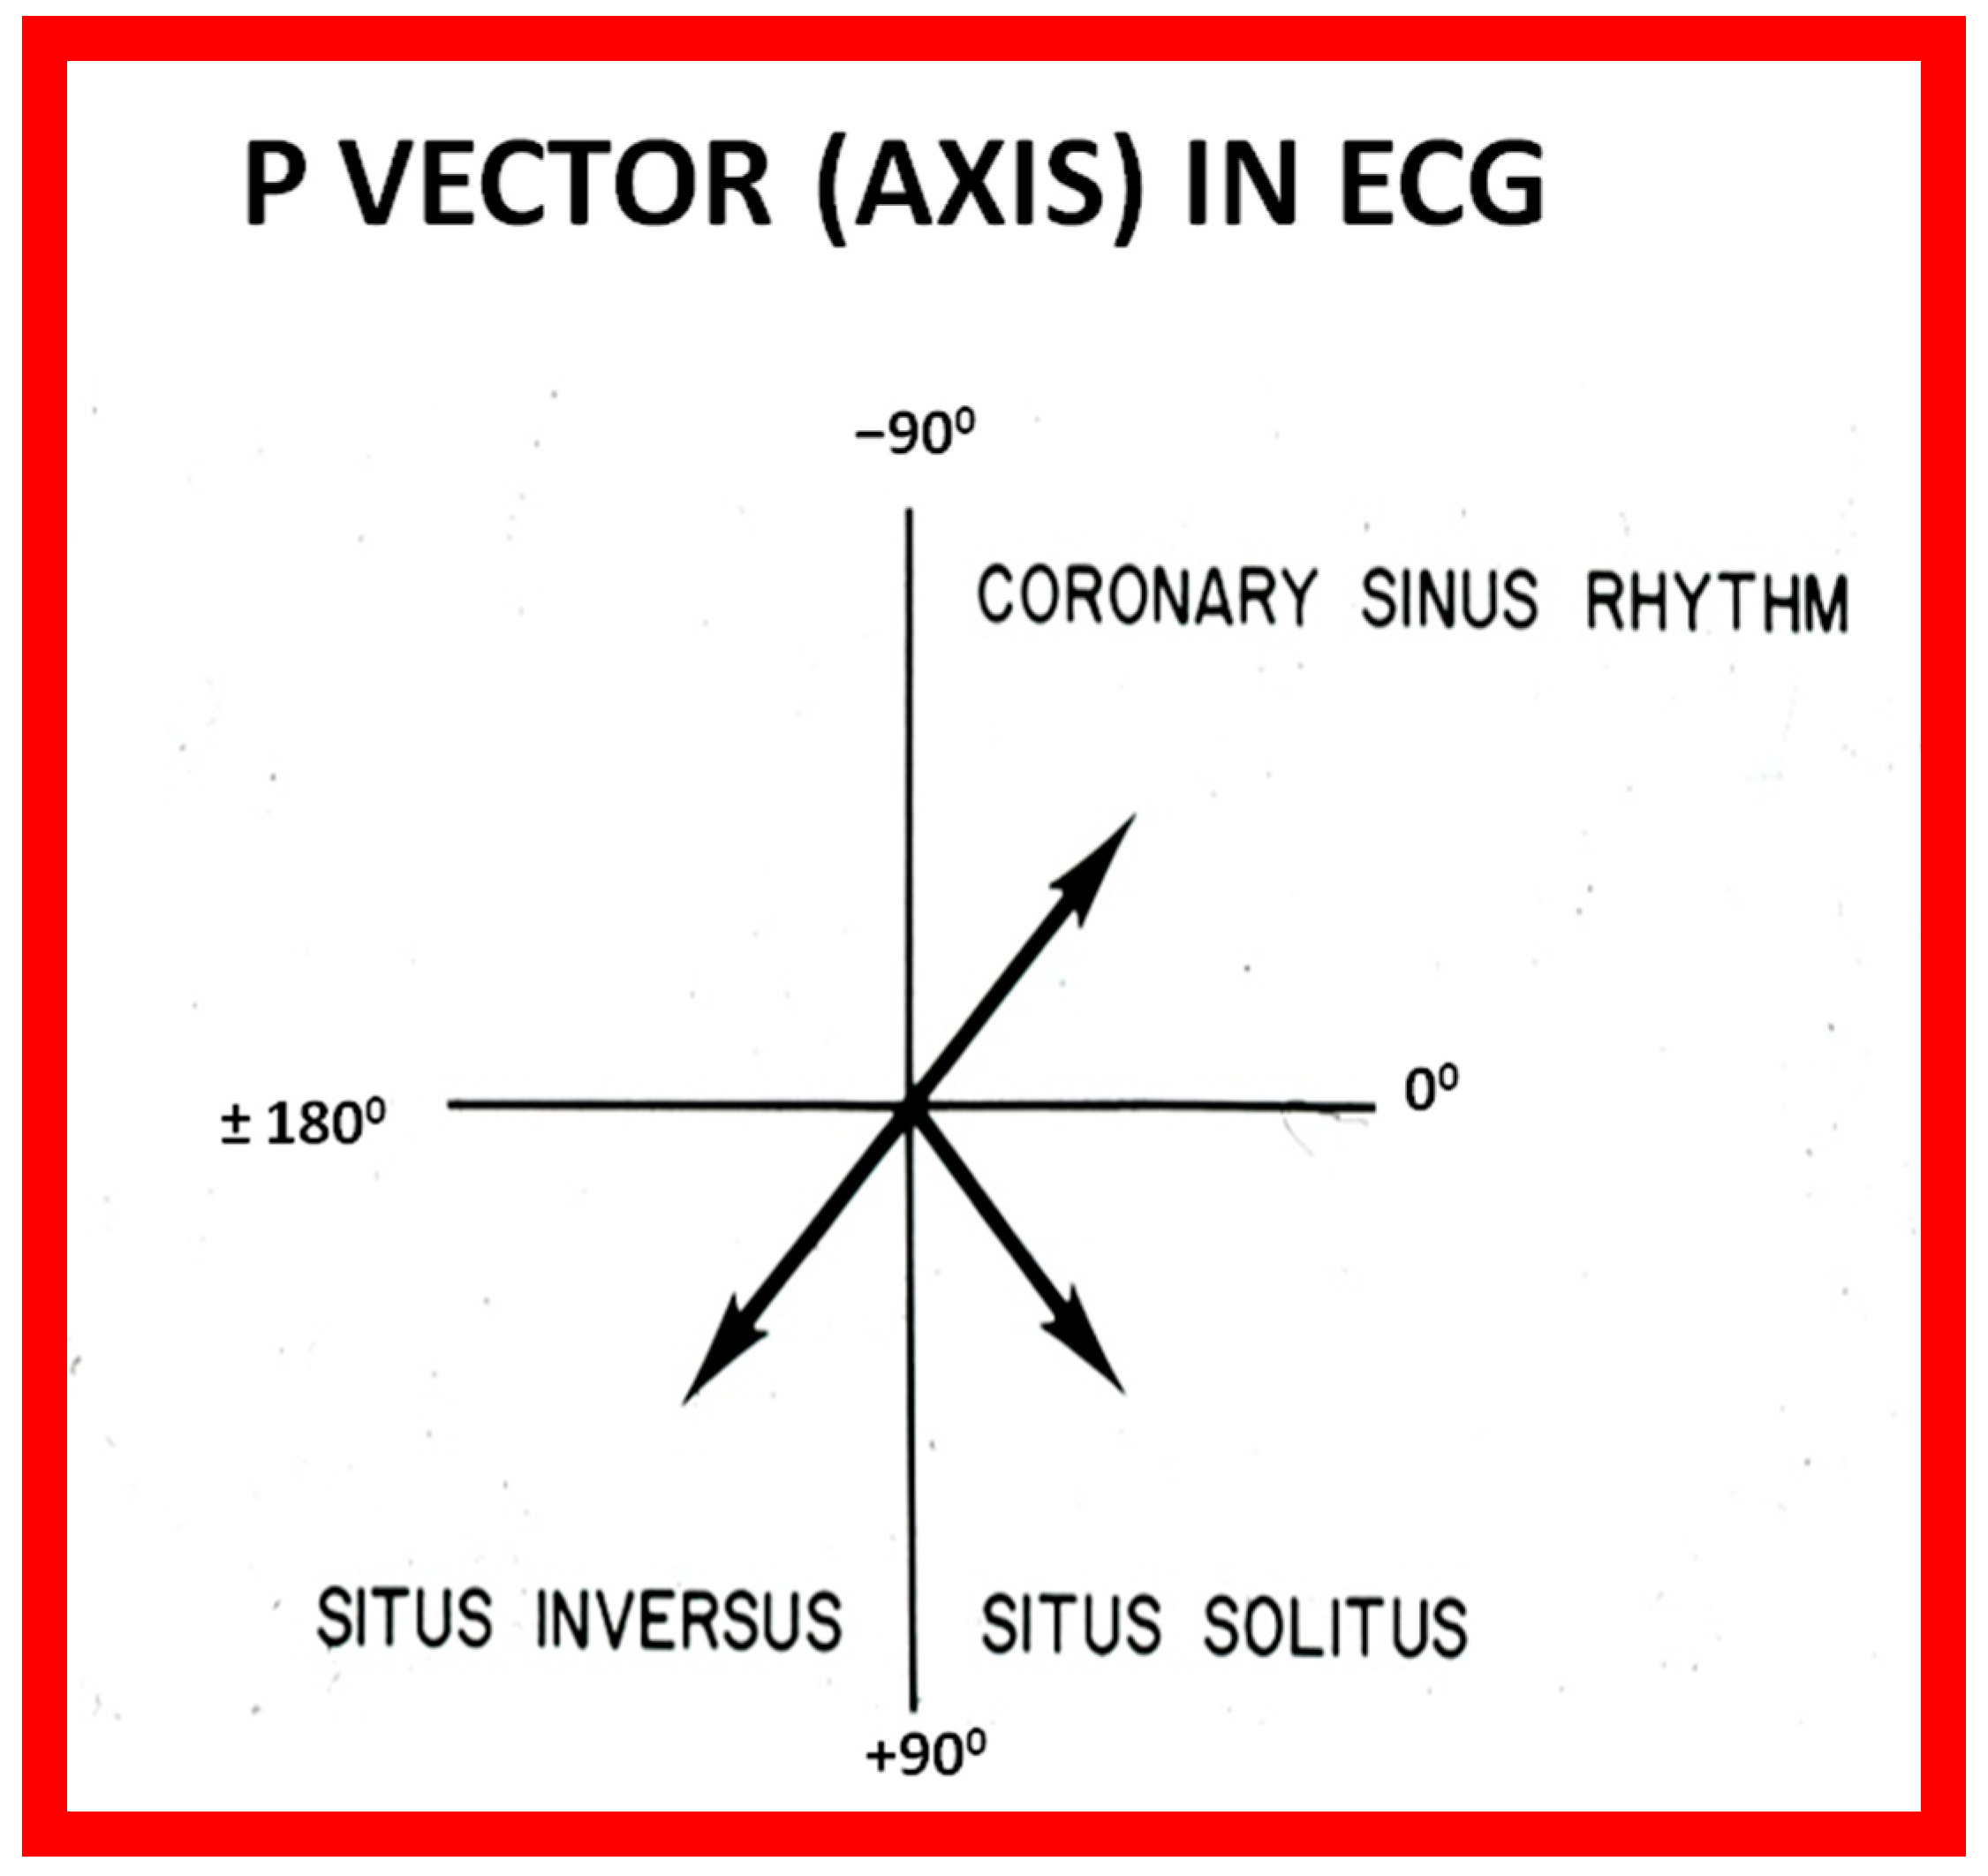
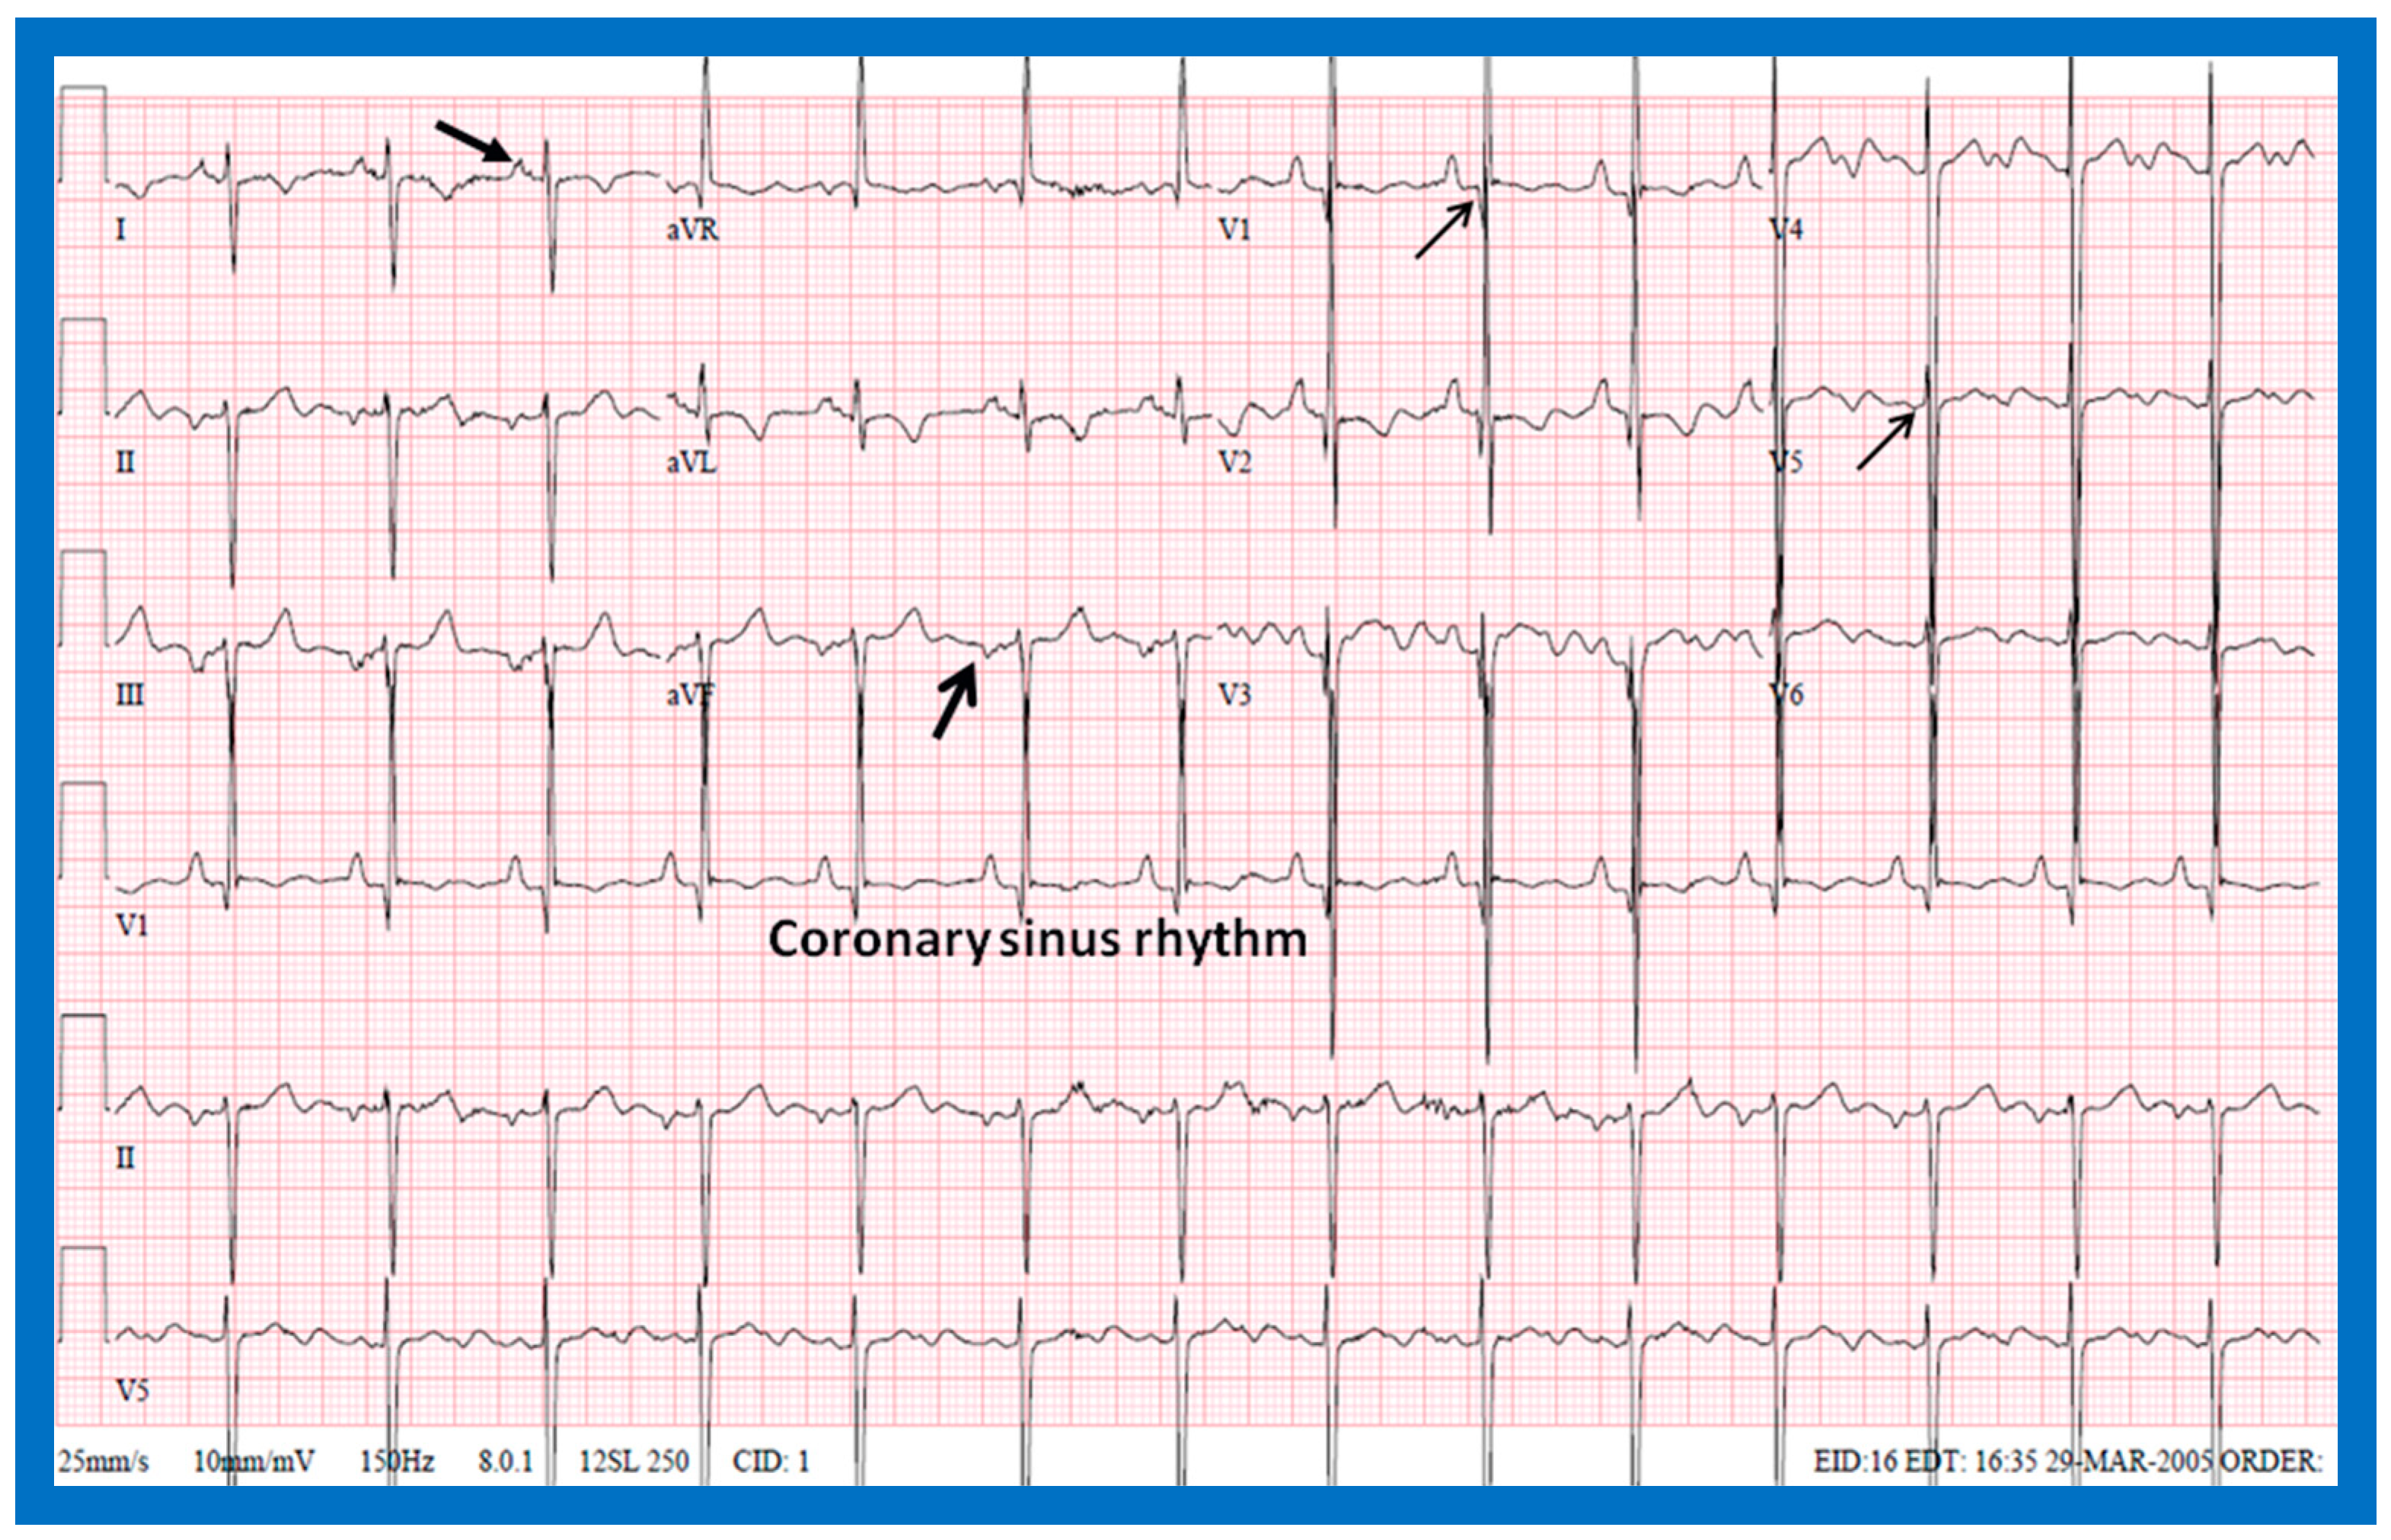
Figure 16.
Diagram illustrating the utility of frontal plane P wave vector (axis). Axis of the P wave in-between 0° and +90° indicates normally positioned atria (situs solitus of the atria). Axis of the P wave in-between +90° and ±180° is suggestive of reversed atrial position (situs inversus of the atria). Axis of the P wave in-between 0 and −90° is termed low atrial or coronary sinus rhythm; such P waves are not useful in assessing the situs of the atria. Reproduced from reference [
2].
Figure 17.
Electrocardiogram (ECG) of a patient illustrating normal P waves, namely, positive P waves in both leads I and AVF (axis of +45 degrees), which suggests normal atrial position; situs solitus. The ECG also shows normal Q waves in both leads V5 and V6 and no Q waves in leads in both V1 and V2; these data suggest a normal relationship of ventricles with the right ventricle on the right side and left ventricle on the left side. Reproduced from reference [
4].
Figure 18.
Electrocardiogram (ECG) of a patient illustrating an abnormal vector of the P wave (+135 degrees). The P waves are negative in lead I, while they are positive in lead AVF (arrows). Such a pattern is indicative of situs inversus with a morphologic left atrium on the right side and a morphologic right atrium on the left side. The ECG also shows no Q waves in the QRS complexes of the chest leads; such a pattern is not helpful in localizing the ventricles. Reproduced from reference [
4].
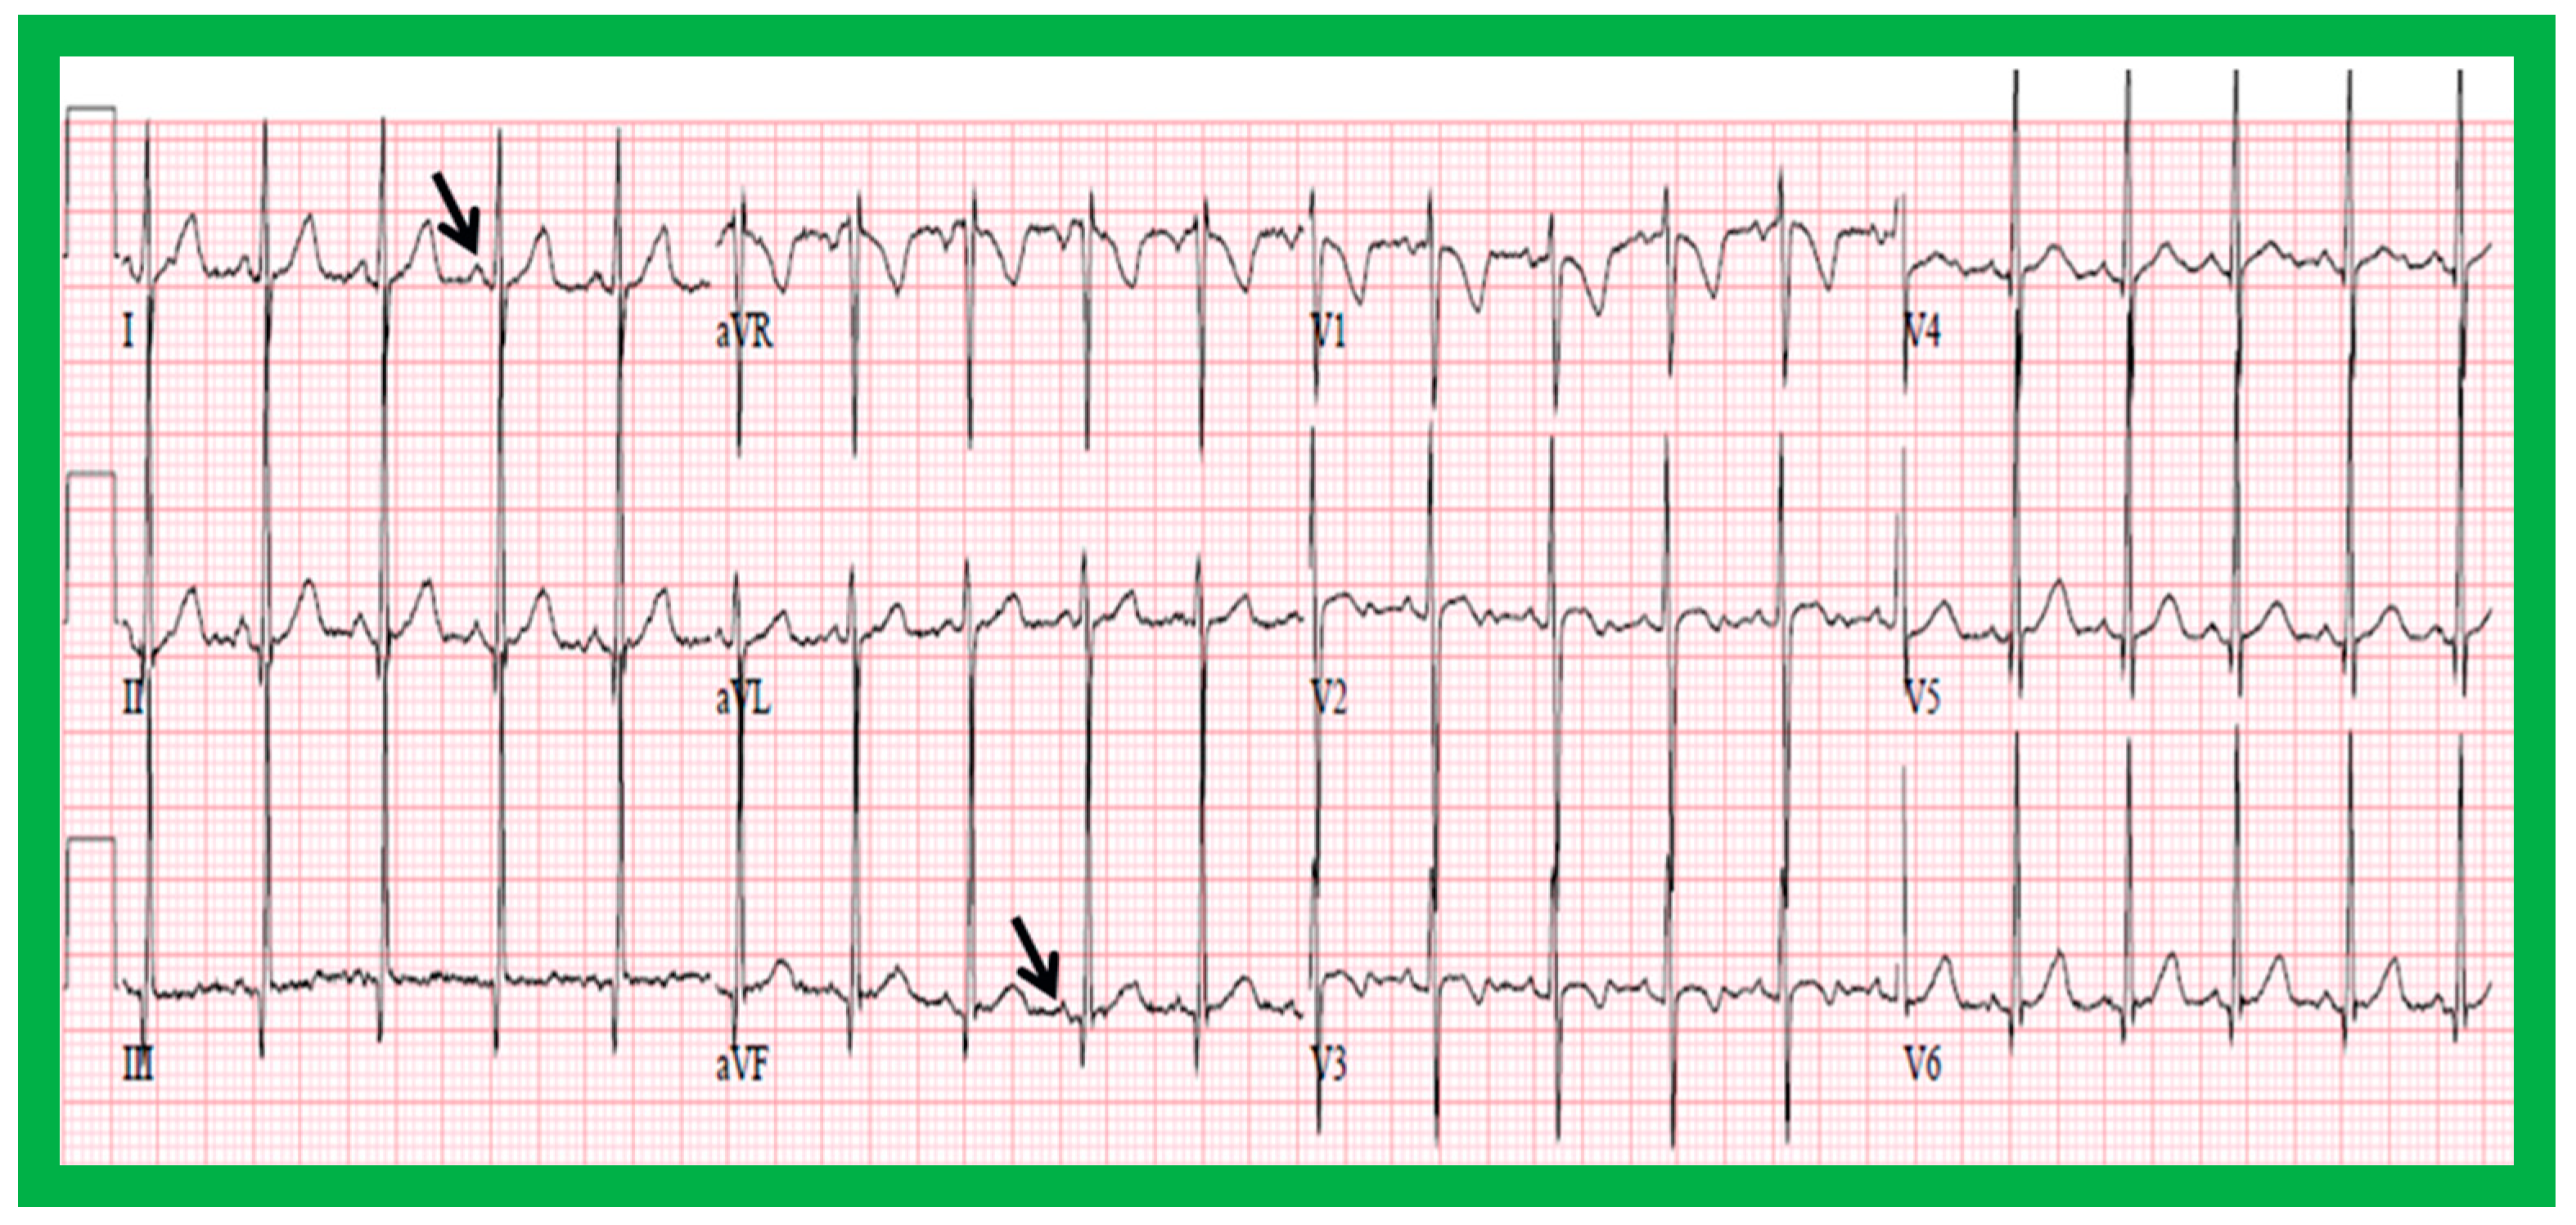
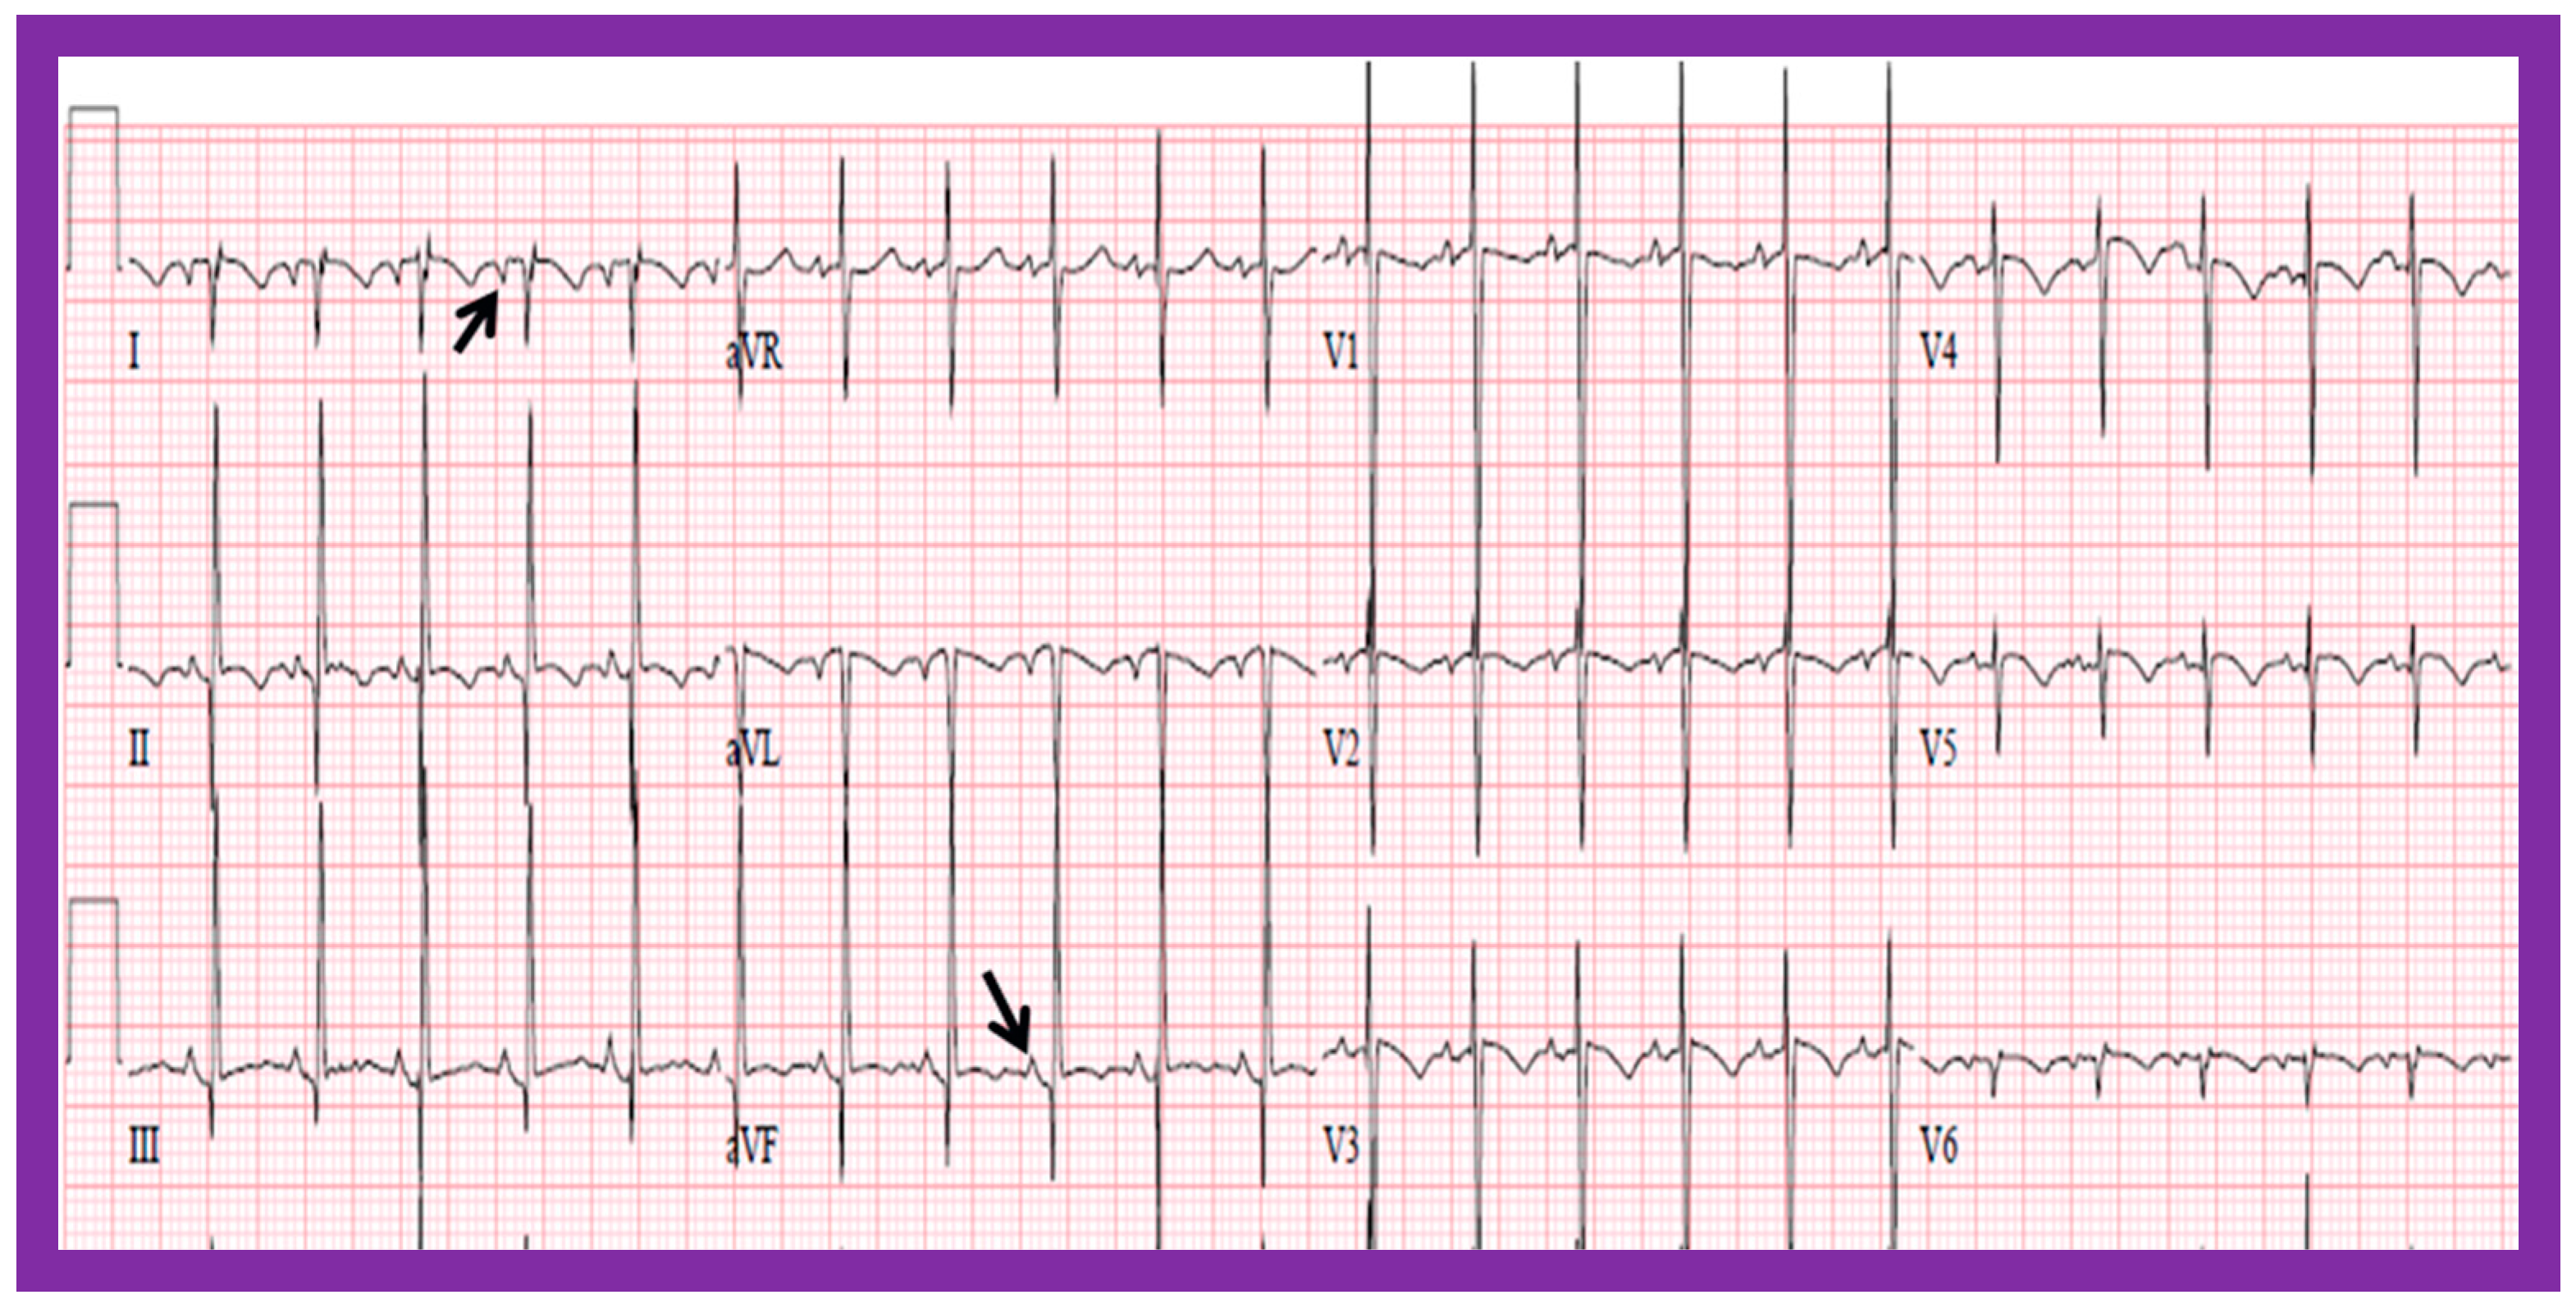
Figure 19.
Electrocardiogram (ECG) of a patient illustrating positive P waves in lead I and negative P waves in lead AVF (thick arrows) with a P wave vector of −45 degrees. Such a pattern is suggestive of a low atrial or coronary sinus rhythm. However, such P wave vectors are not useful in situs localization. The ECG also shows Q waves in the right chest leads (V1 and V2) and no Q waves in the left chest leads (V5 and V6) (thin arrows); such a pattern is indicative that the ventricles are inverted. However, such an abnormality may also be observed in patients with right ventricular hypertrophy of a severe degree. Reproduced from reference [
4].
Figure 20.
Value of stomach (St) gas shadow in determining situs localization is shown in this figure. In (
A), the St gas bubble was not seen, and therefore, visceral situs could not be classified. In a subsequent chest X-ray (
B), the St gas was seen, indicating situs inversus. This case exemplifies the requirement for seeing the St gaseous opacity on the chest X-ray. Li, liver. Modified from reference [
3].
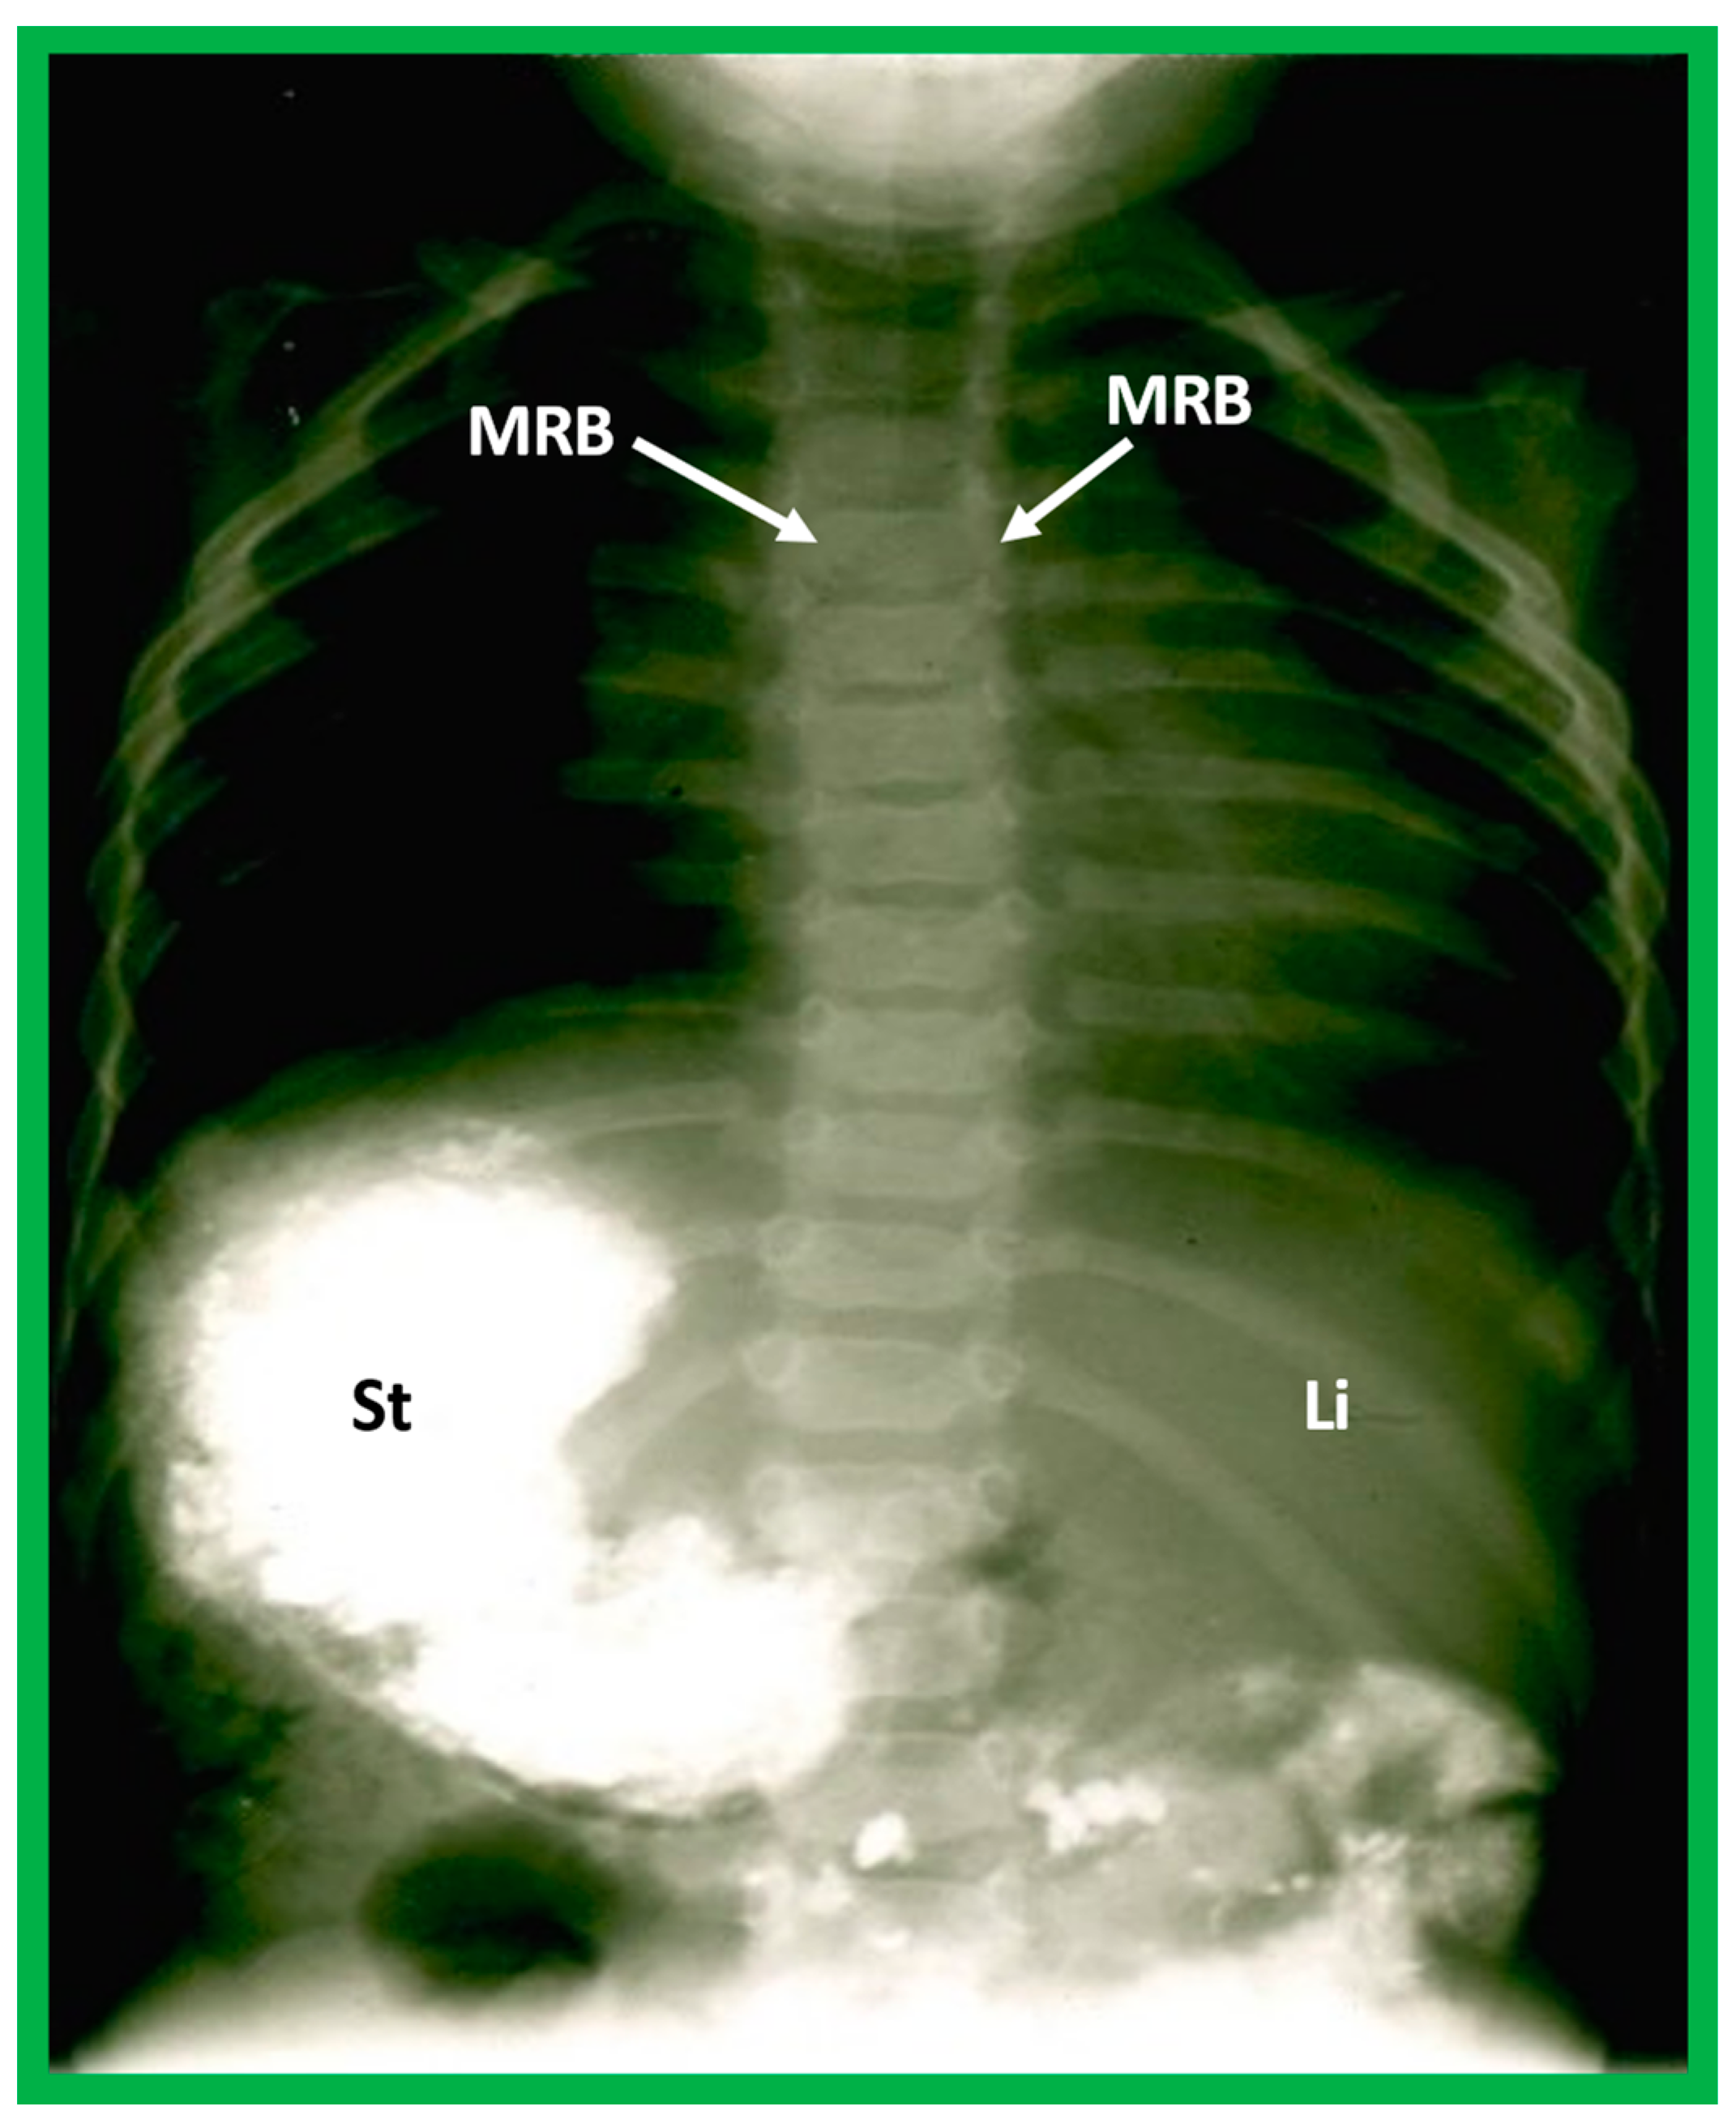
Figure 21.
Barium study showing barium in the stomach (St) on the right side while the liver (Li) is seen on the left, indicating situs inversus. The heart is on the left side, indicating isolated levocardia. Tracheobronchial tree pattern shows morphologic right bronchus (MRB) on both sides, indicative of dextro-isomerism.
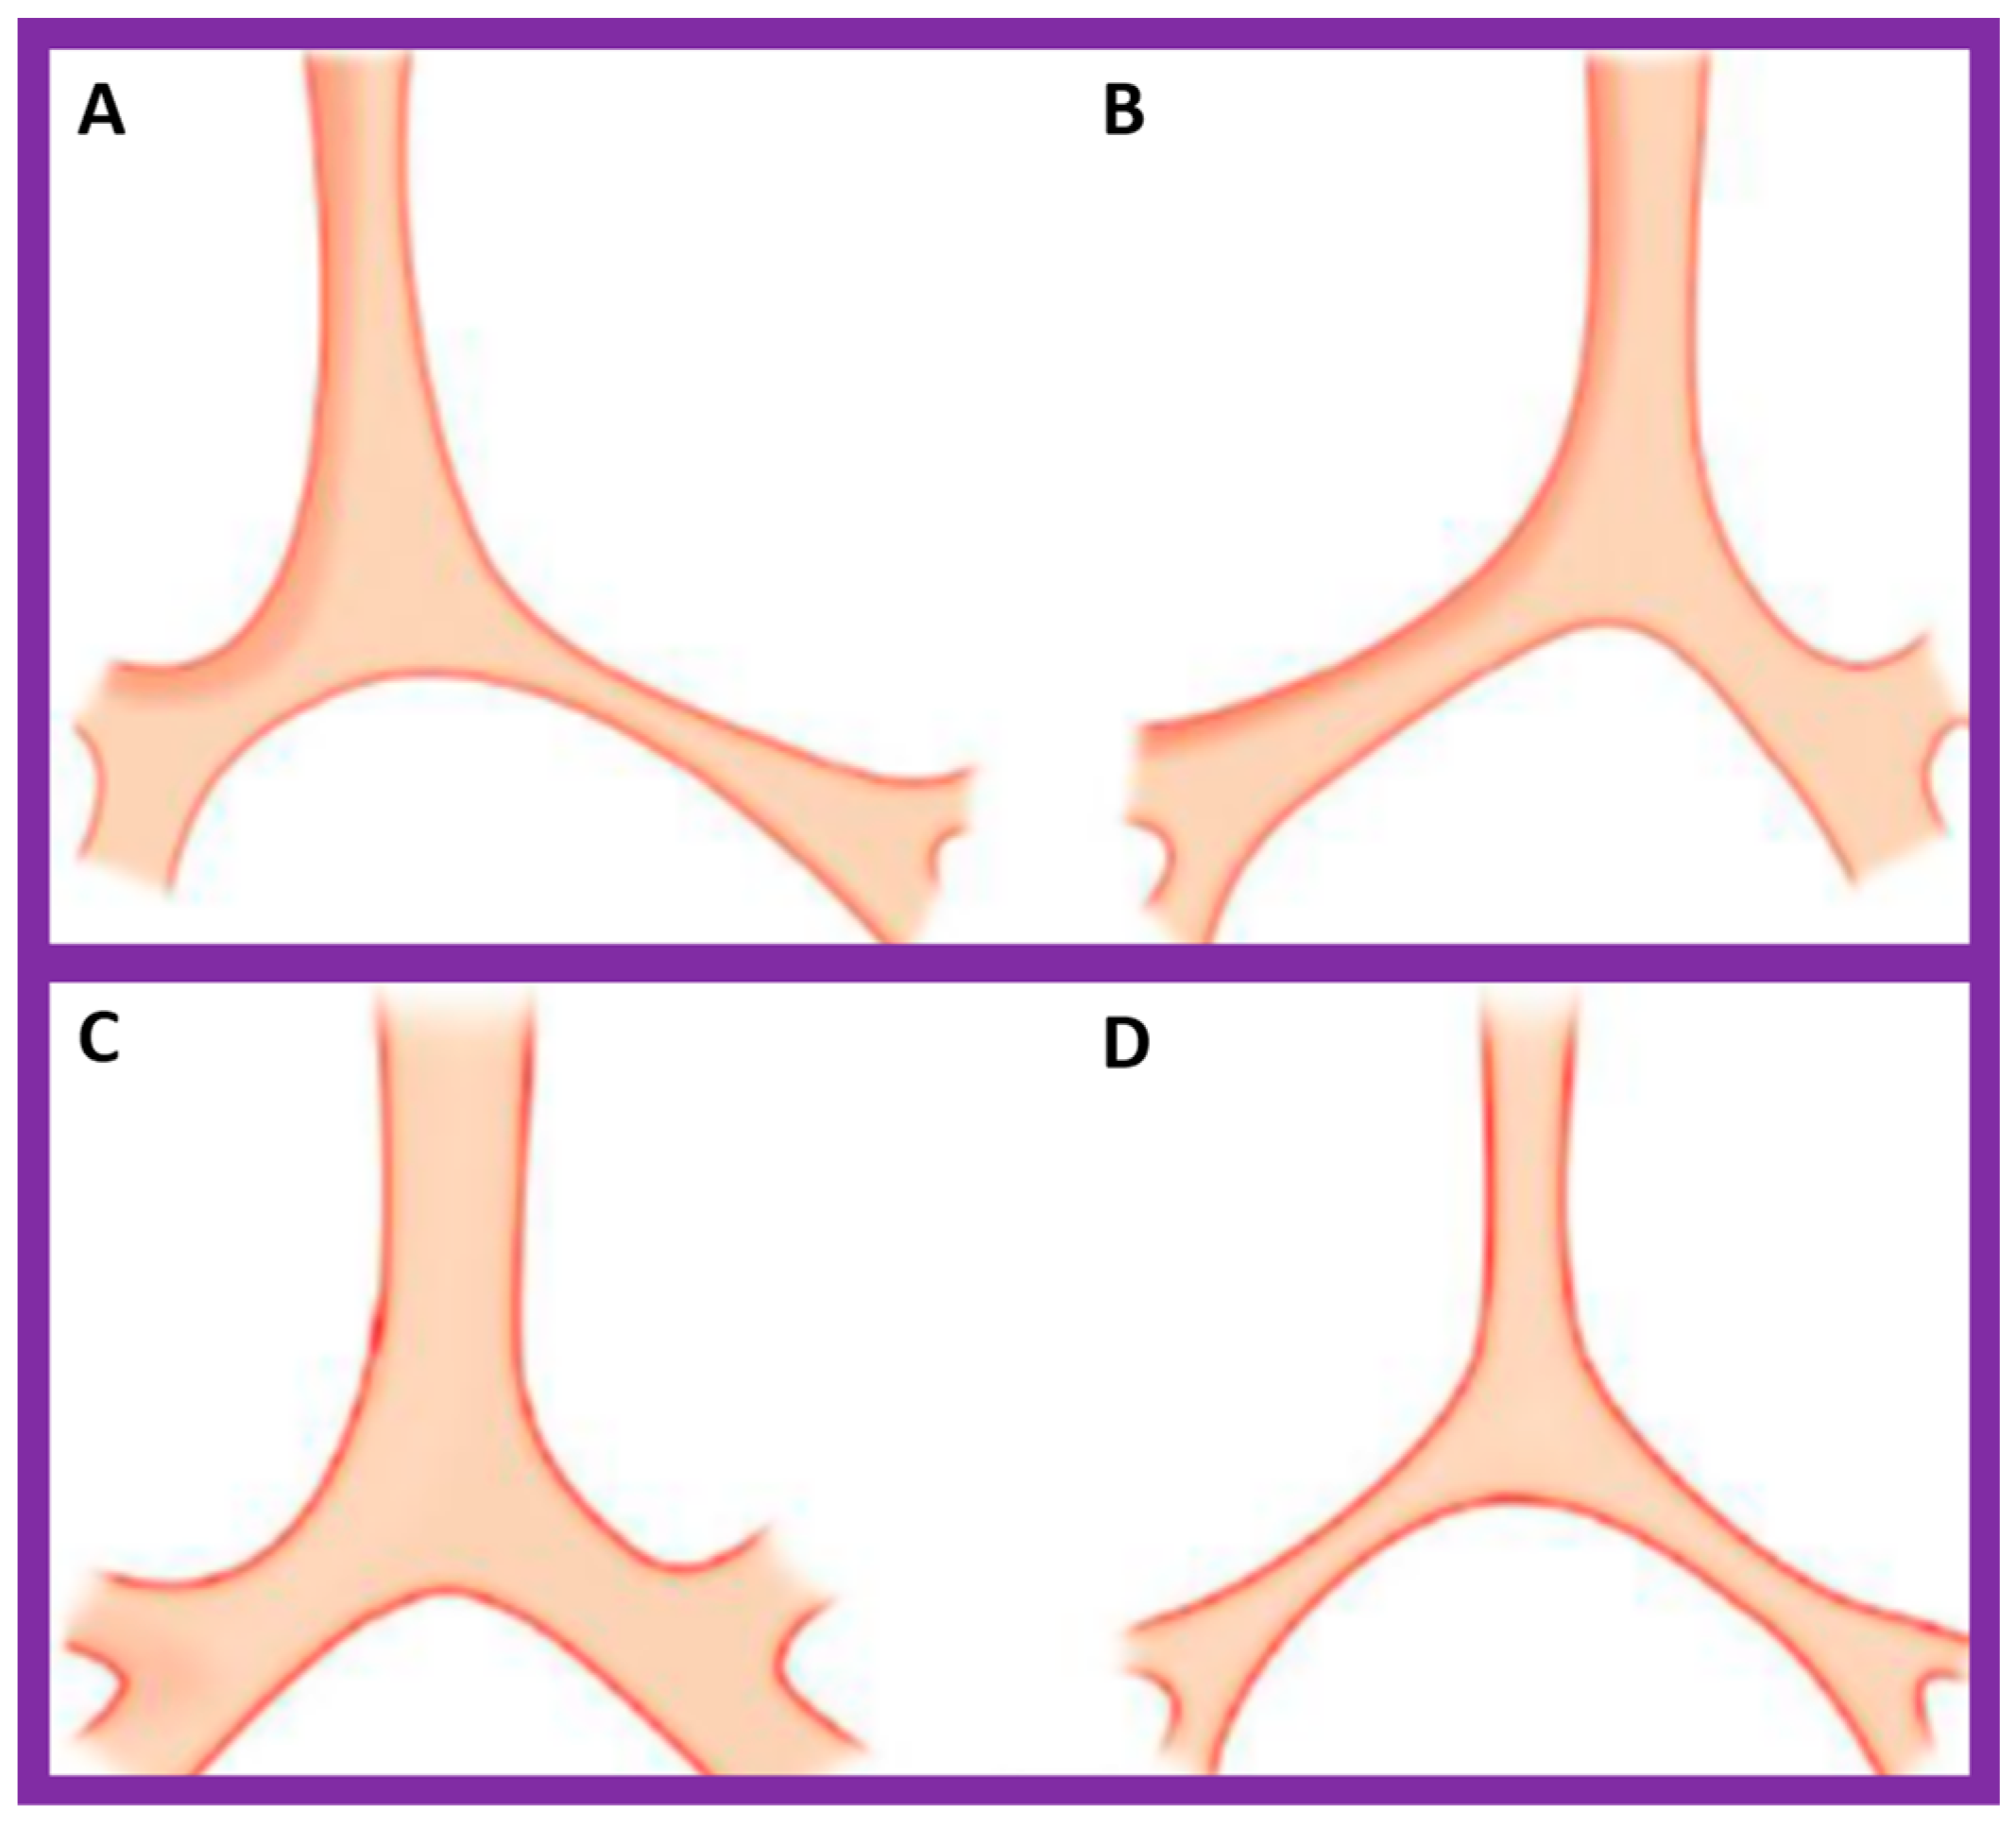
Figure 22.
Diagrammatic depiction of the anatomy of the tracheobronchial tree. (
A) In patients with situs solitus, the right bronchus is short and wide and inclines somewhat steeply, whereas the left bronchus is long and narrow and traverses in a horizontal pattern. (
B) In patients with situs inversus, the configuration of the bronchial pattern is inverted; the morphologic right bronchus is on the left side, while the morphologic left bronchus is on the right side. (
C) In patients with heterotaxy (asplenia syndrome), both right and left bronchi have the morphology of the right bronchus. (
D) In subjects with heterotaxy (polysplenia syndrome), both the right and left bronchi have the appearance of morphologic left bronchi. Concept is derived from Reference [
2], and the Figure is modified from Reference [
5].
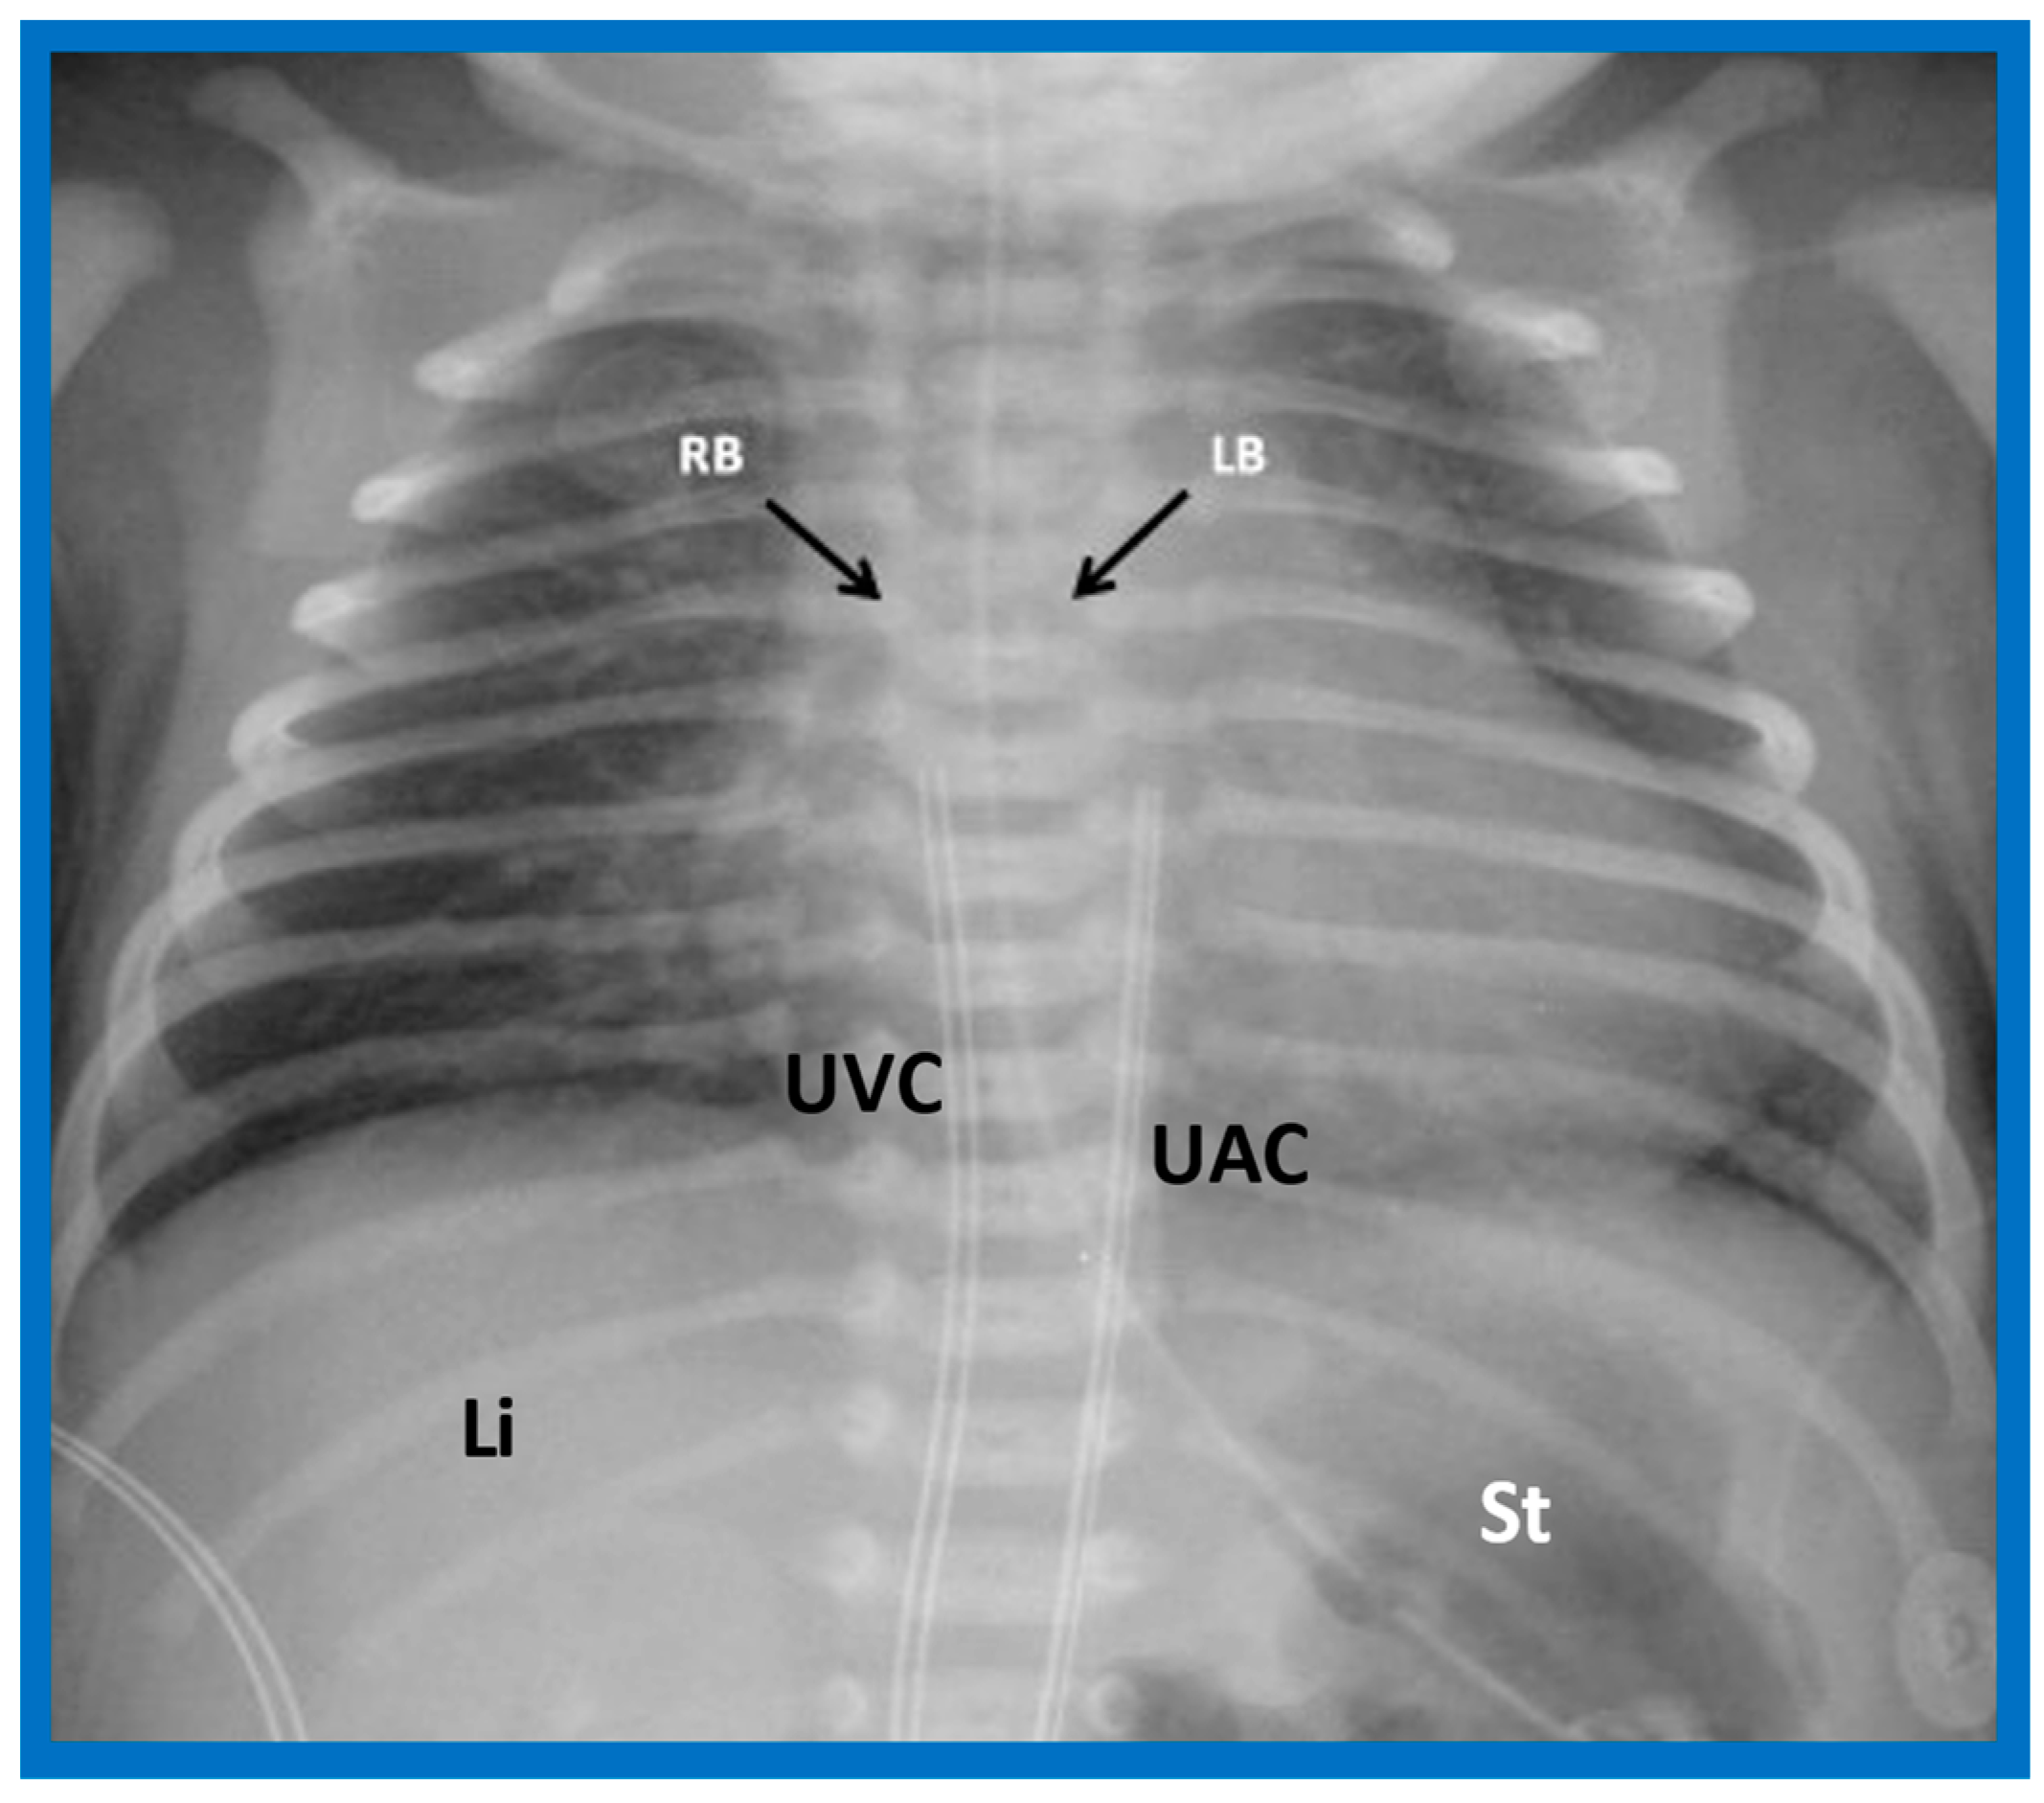
Figure 23.
A chest roentgenogram of a patient with situs solitus demonstrating a wide and short right bronchus (RB) which descends somewhat steeply, whereas the left-sided bronchus (LB) is narrow and long and traverses horizontally. The liver (Li) is seen on the right side, and the stomach (St) bubble is seen on the left side, consistent with situs solitus. Mild cardiac enlargement and increased lung vascular patterns are also seen. UAC indicates an umbilical arterial catheter, and UVC points to the catheter in the umbilical vein. Modified from reference [
4].
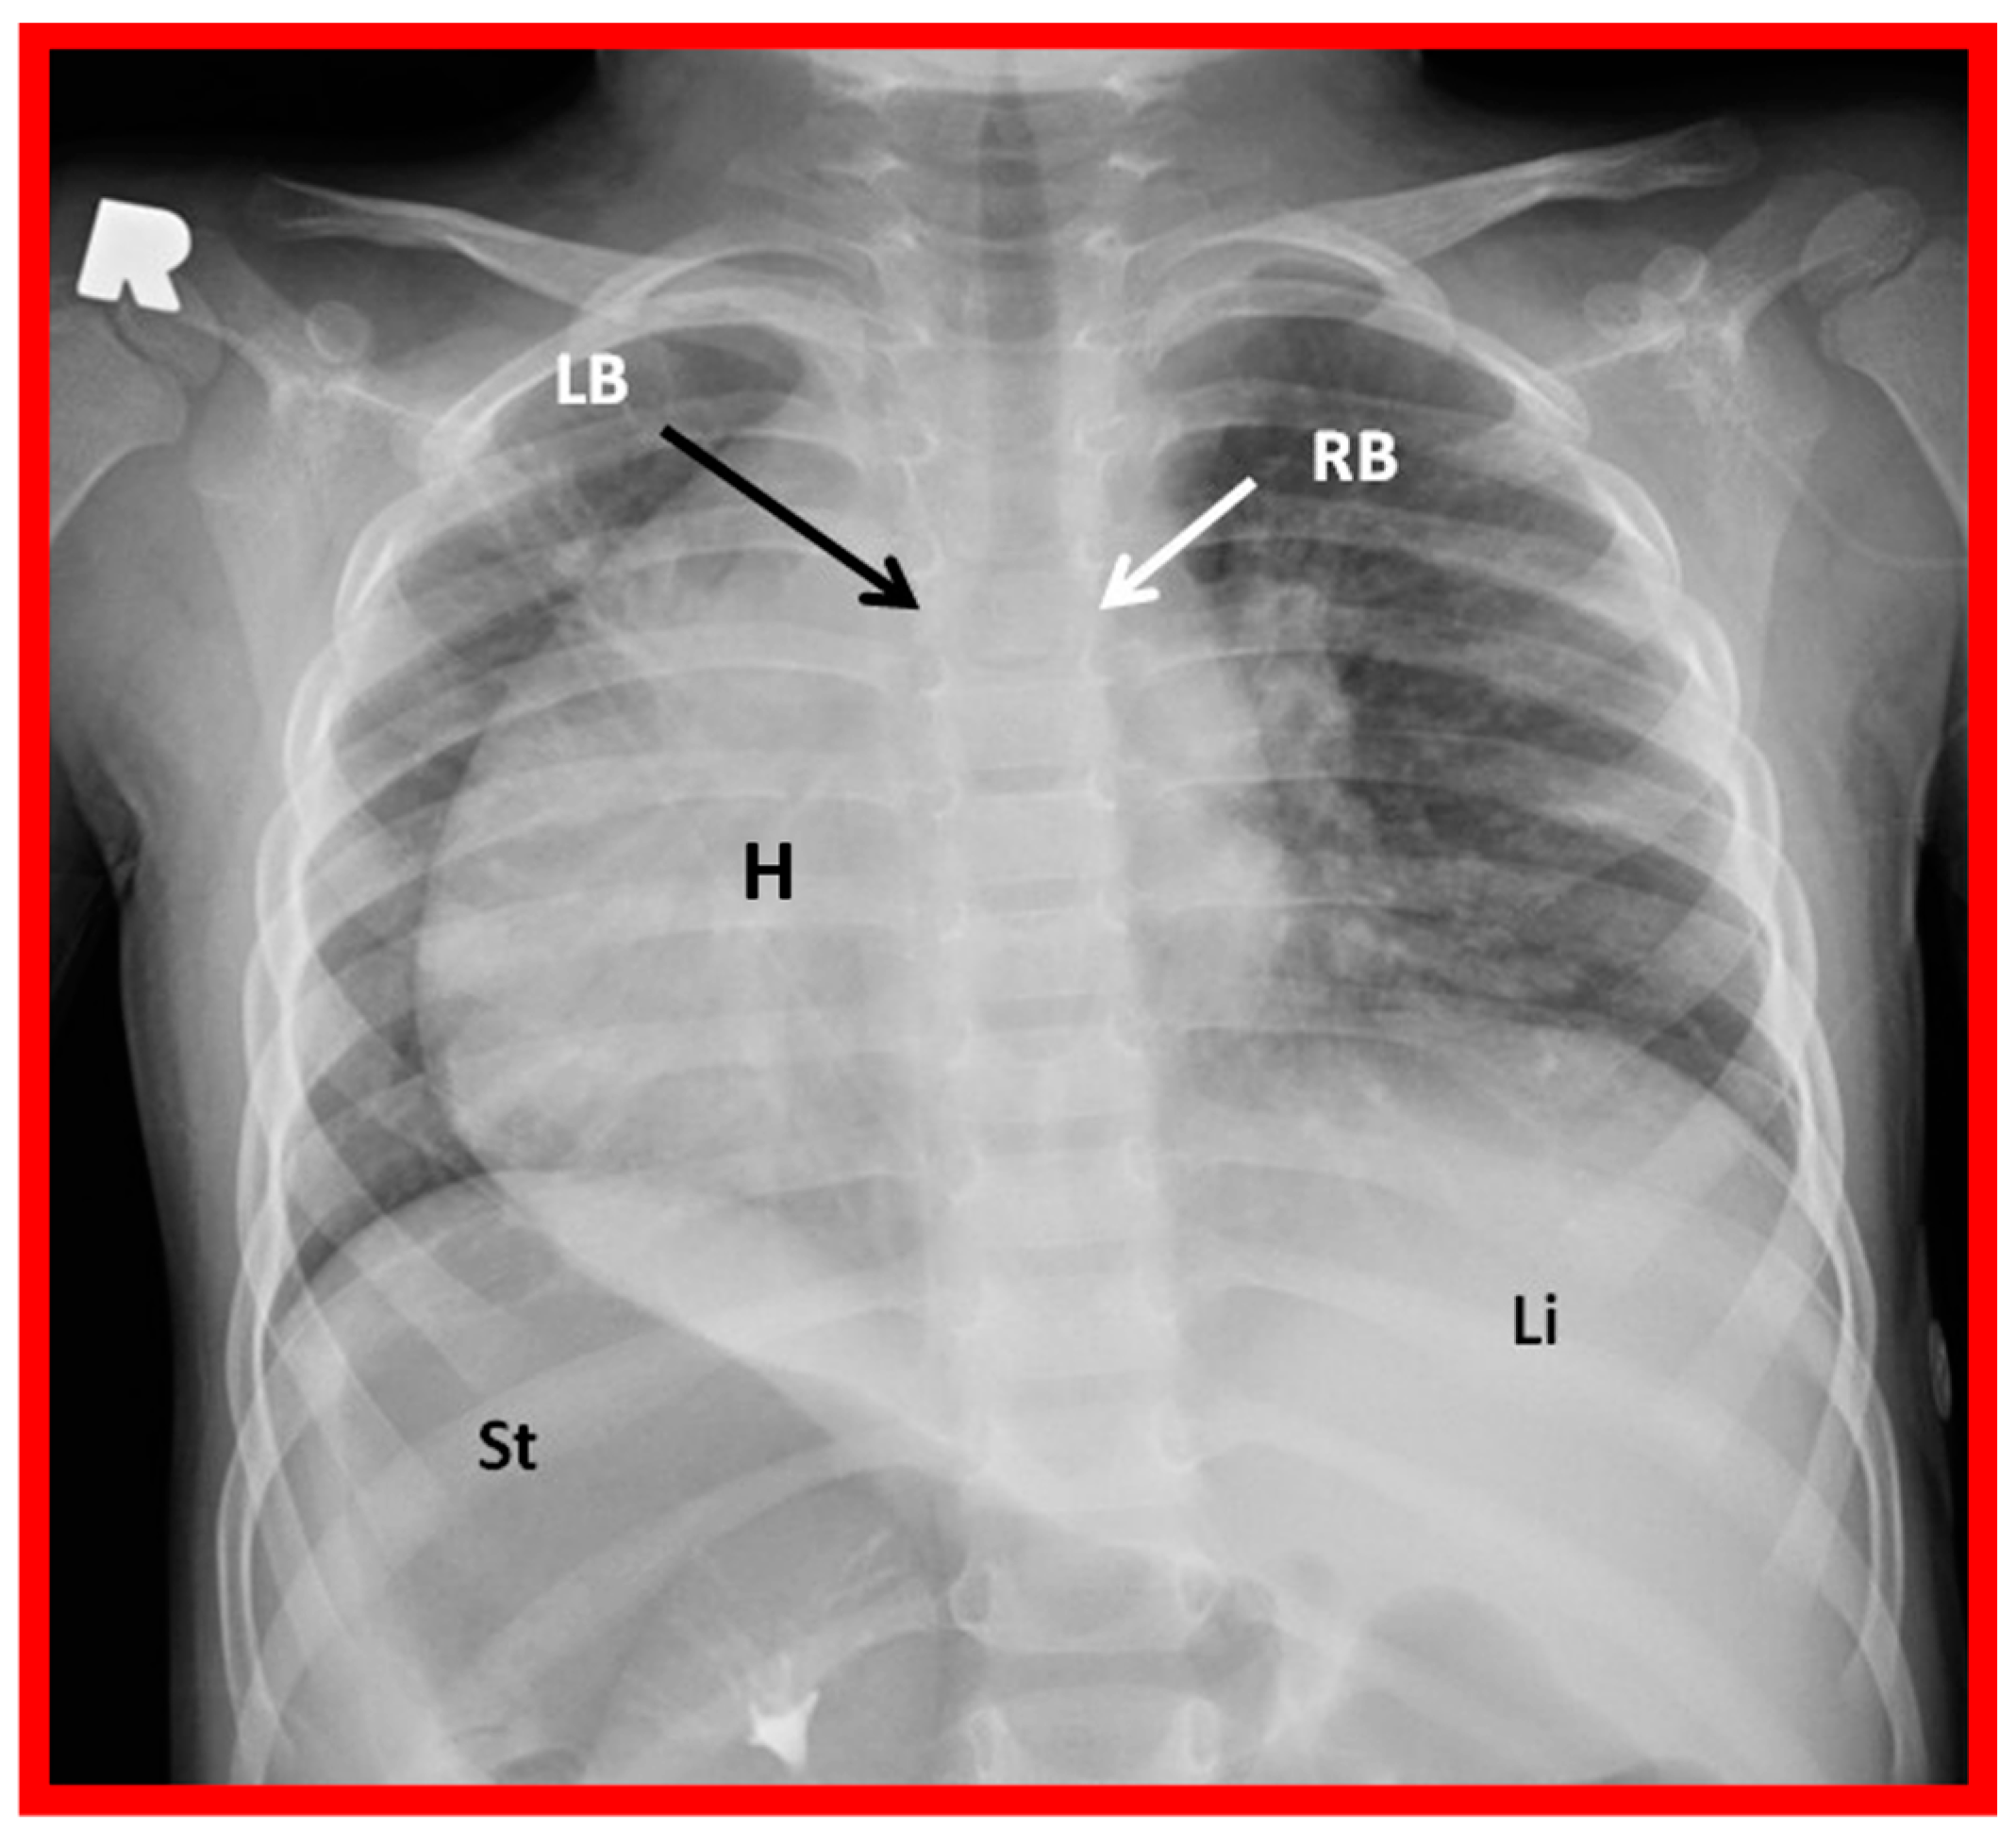
Figure 24.
A chest roentgenogram of a patient with situs inversus demonstrating left-to-right reversal of the normal bronchial pattern; the morphologically right bronchus (RB) is on the left side, and the morphologically left bronchus (LB) is on the right side. The left-to-right inversion of the viscera with the liver (Li) on the left and the stomach (St) on the right indicates situs inversus. The heart (H) is in the right hemithorax (dextrocardia). Modified from reference [
4].
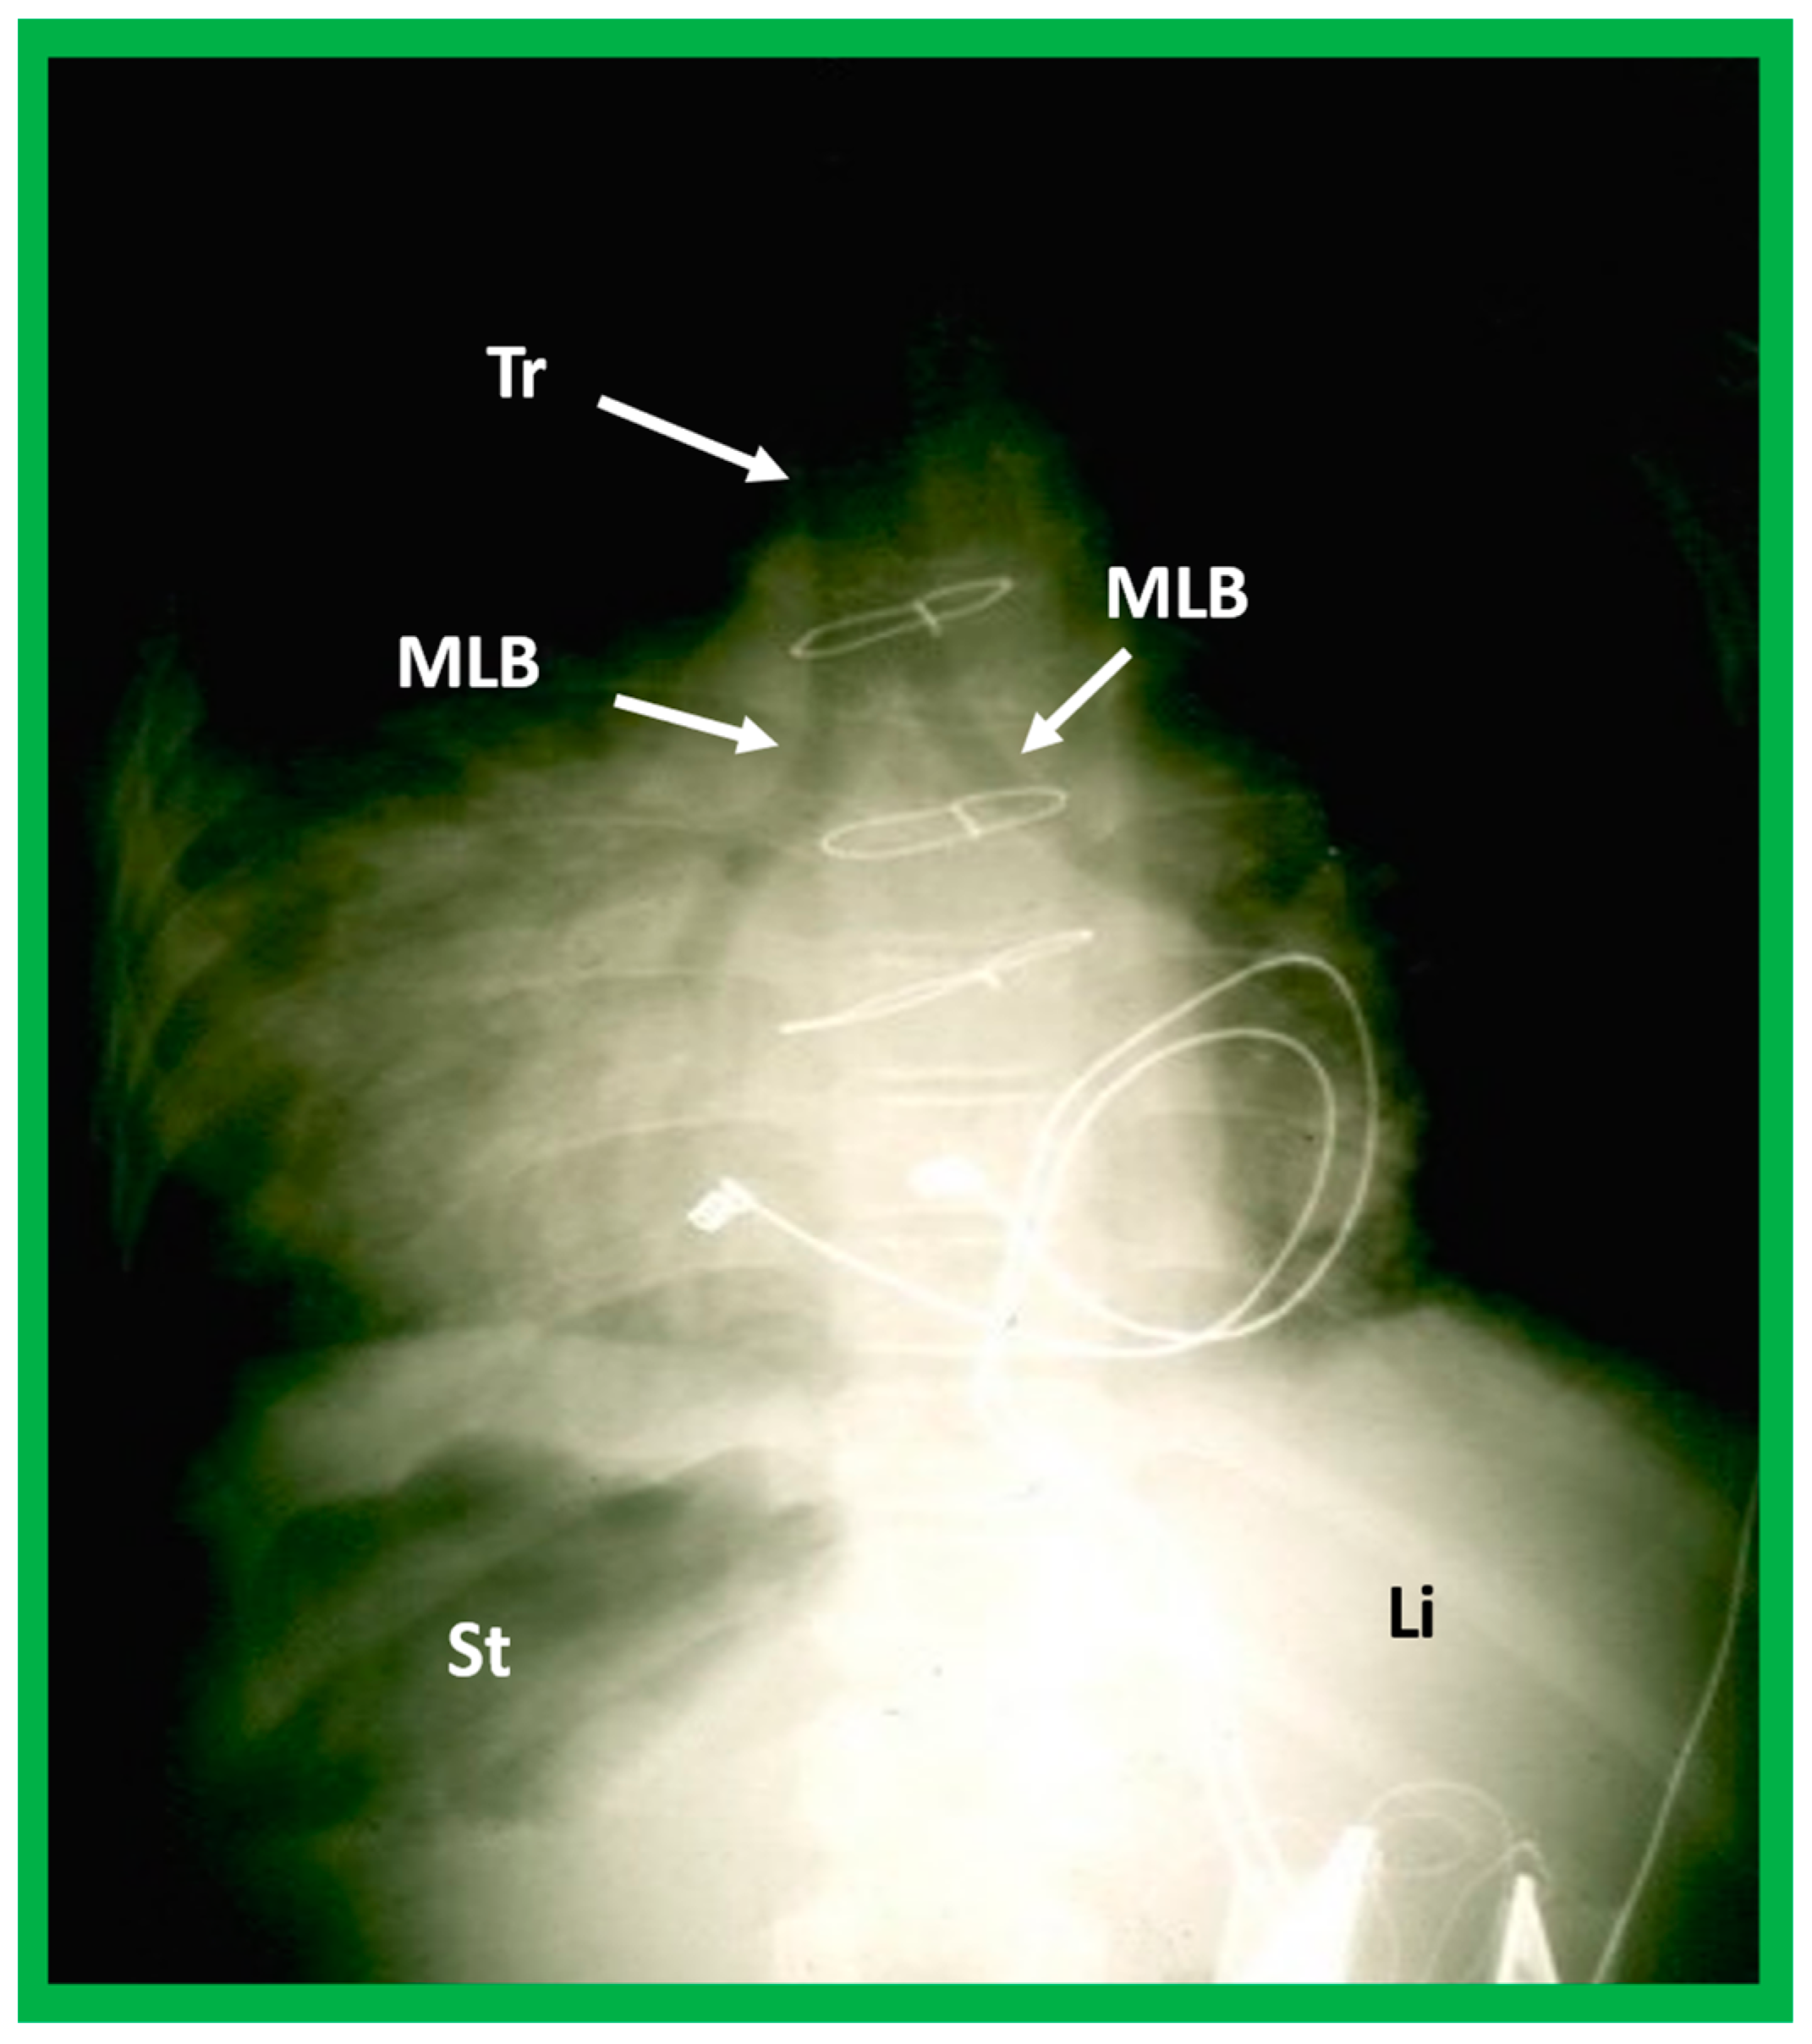
Figure 25.
A highly penetrated chest roentgenogram in an anteroposterior view of a child with dextrocardia associated with situs inversus demonstrates bilateral morphologic left bronchi (MLB); the patient was found to have polysplenia syndrome. Sternal wires and pacemaker artifacts (not labeled) from the previous operation are also seen. Li, liver, St, stomach; Tr, trachea.
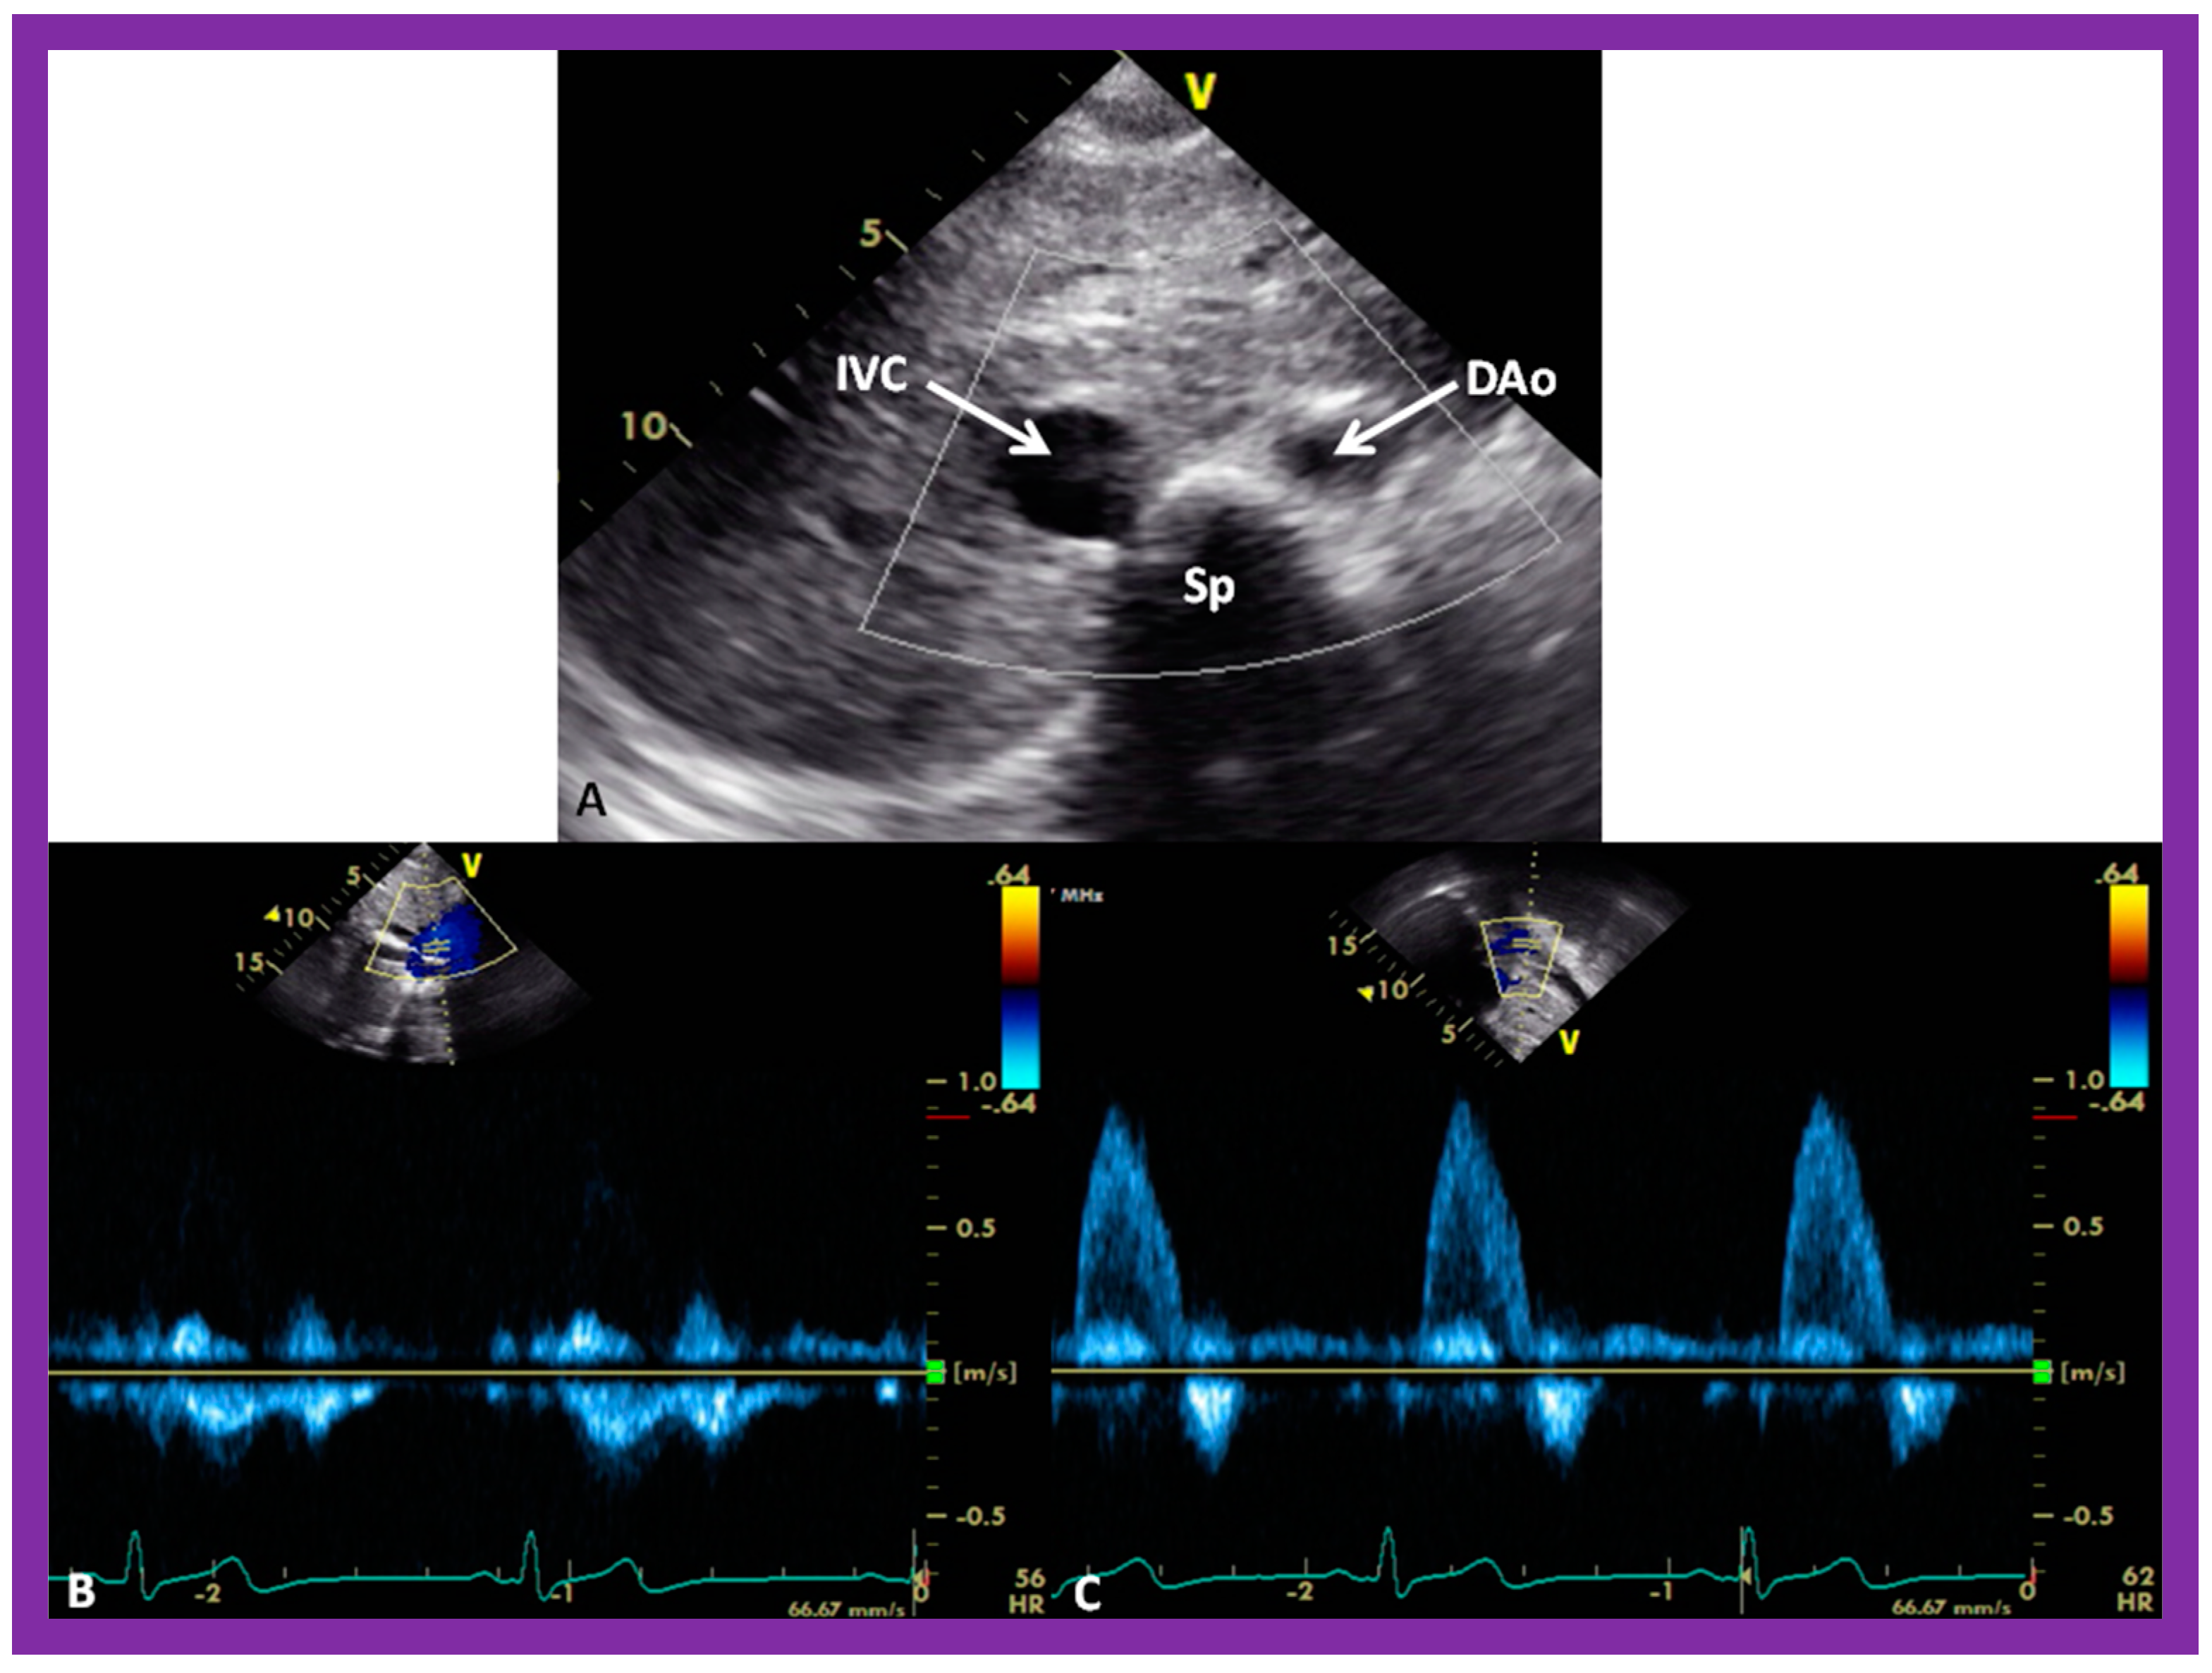
Figure 26.
Selected video images secured in a short axis echo view of a normal child, illustrating the positions of the aorta (Ao) on the left side of the spine (Sp) and the inferior vena cava (IVC) on the right side of the Sp. (
A) The IVC is generally larger than the Ao. (
B,
C) demonstrate Doppler flow characteristics with low-velocity venous flow in the IVC (
B) and a higher velocity arterial flow in the Ao (
C). These data are indicative of situs solitus. Reproduced from reference [
4].
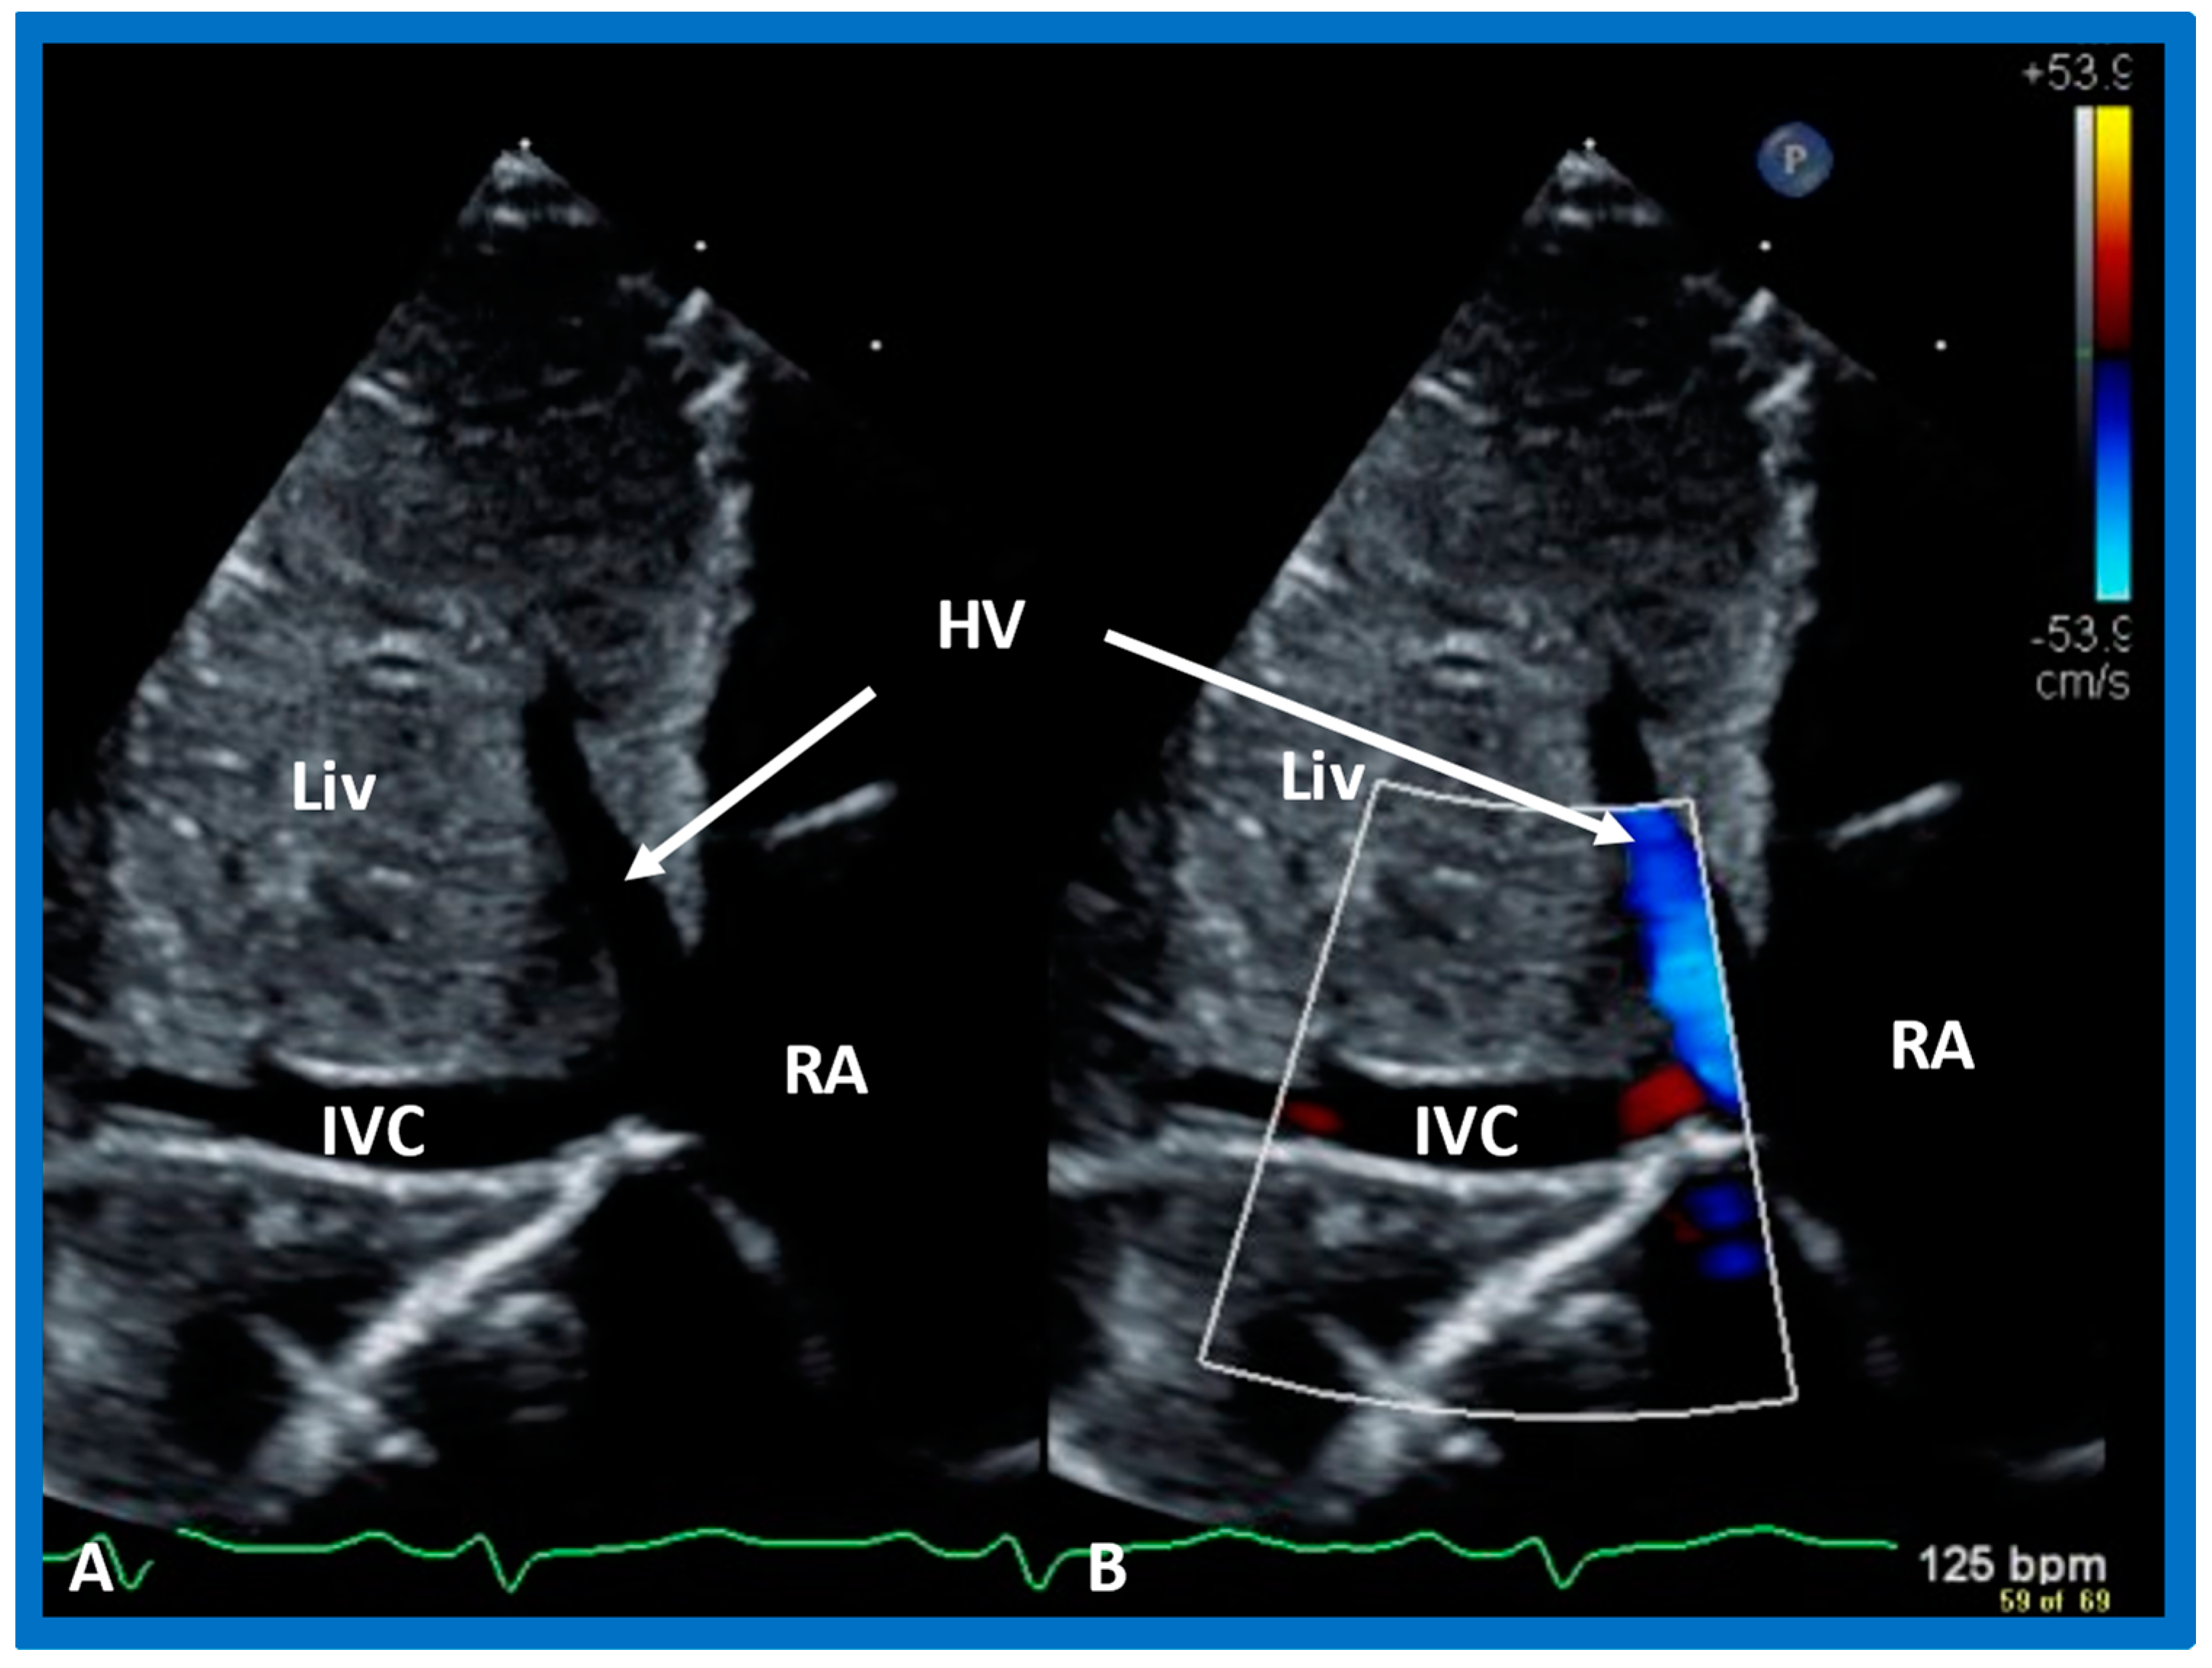
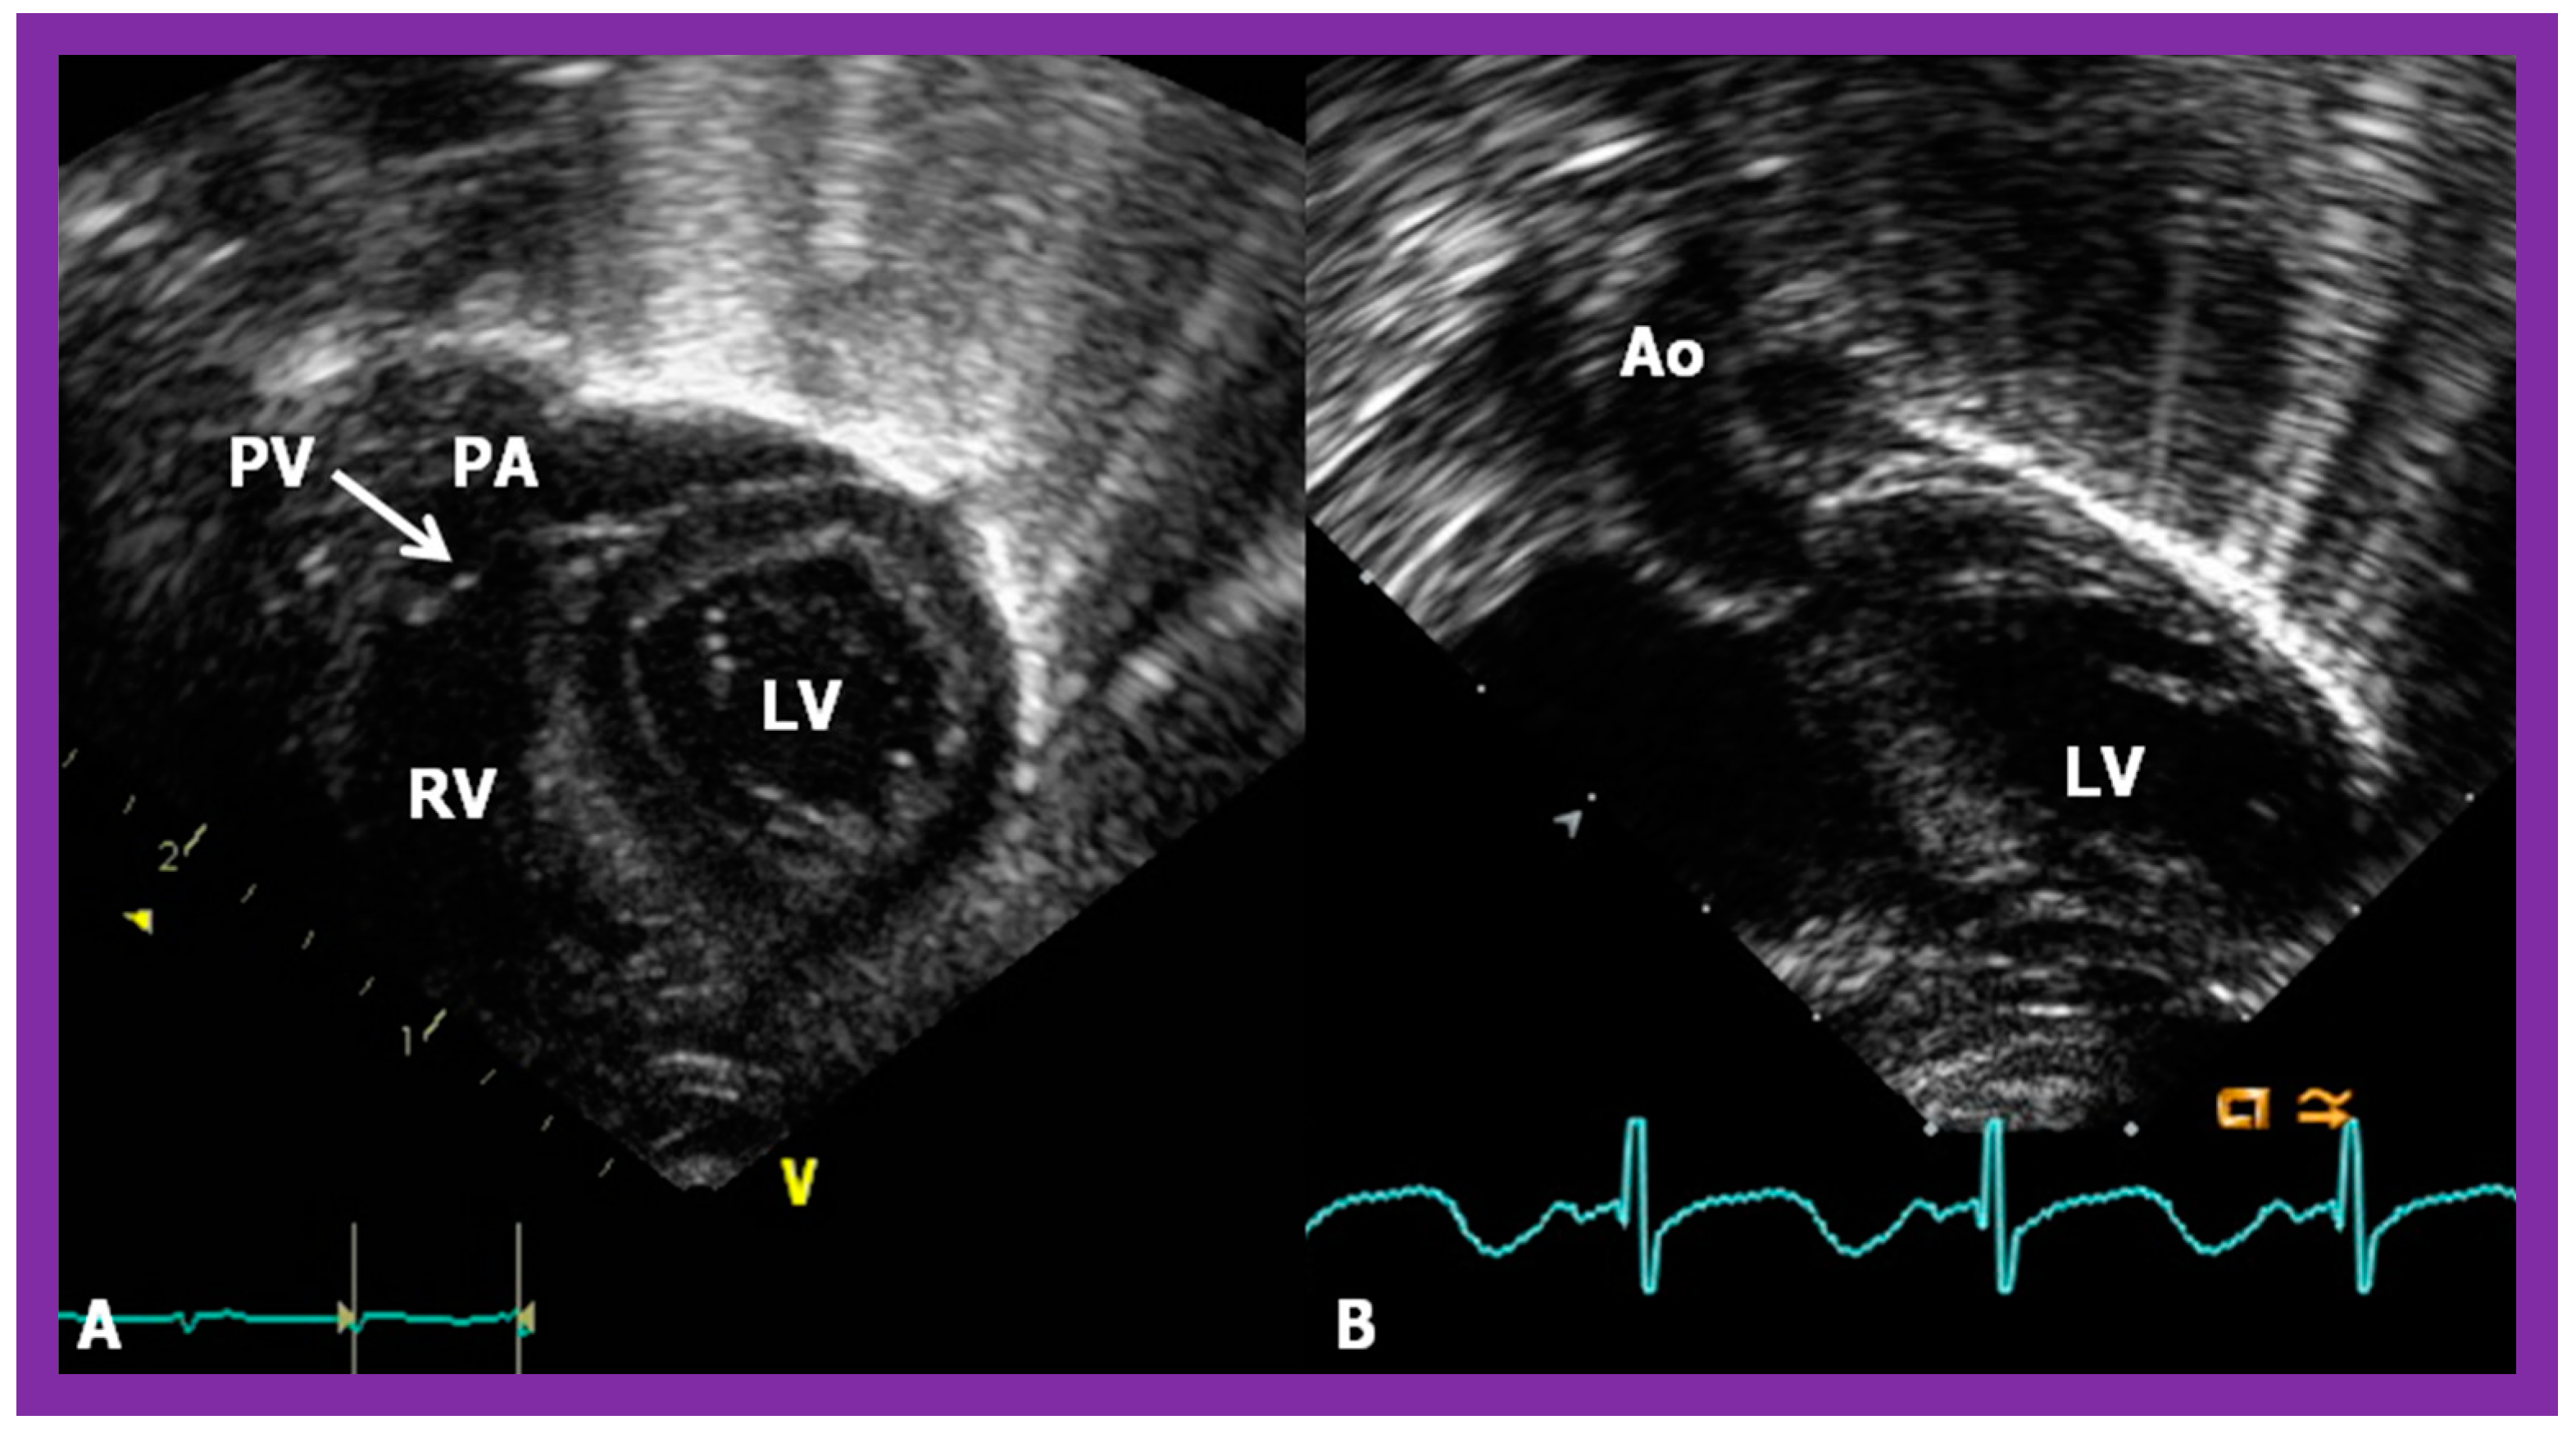
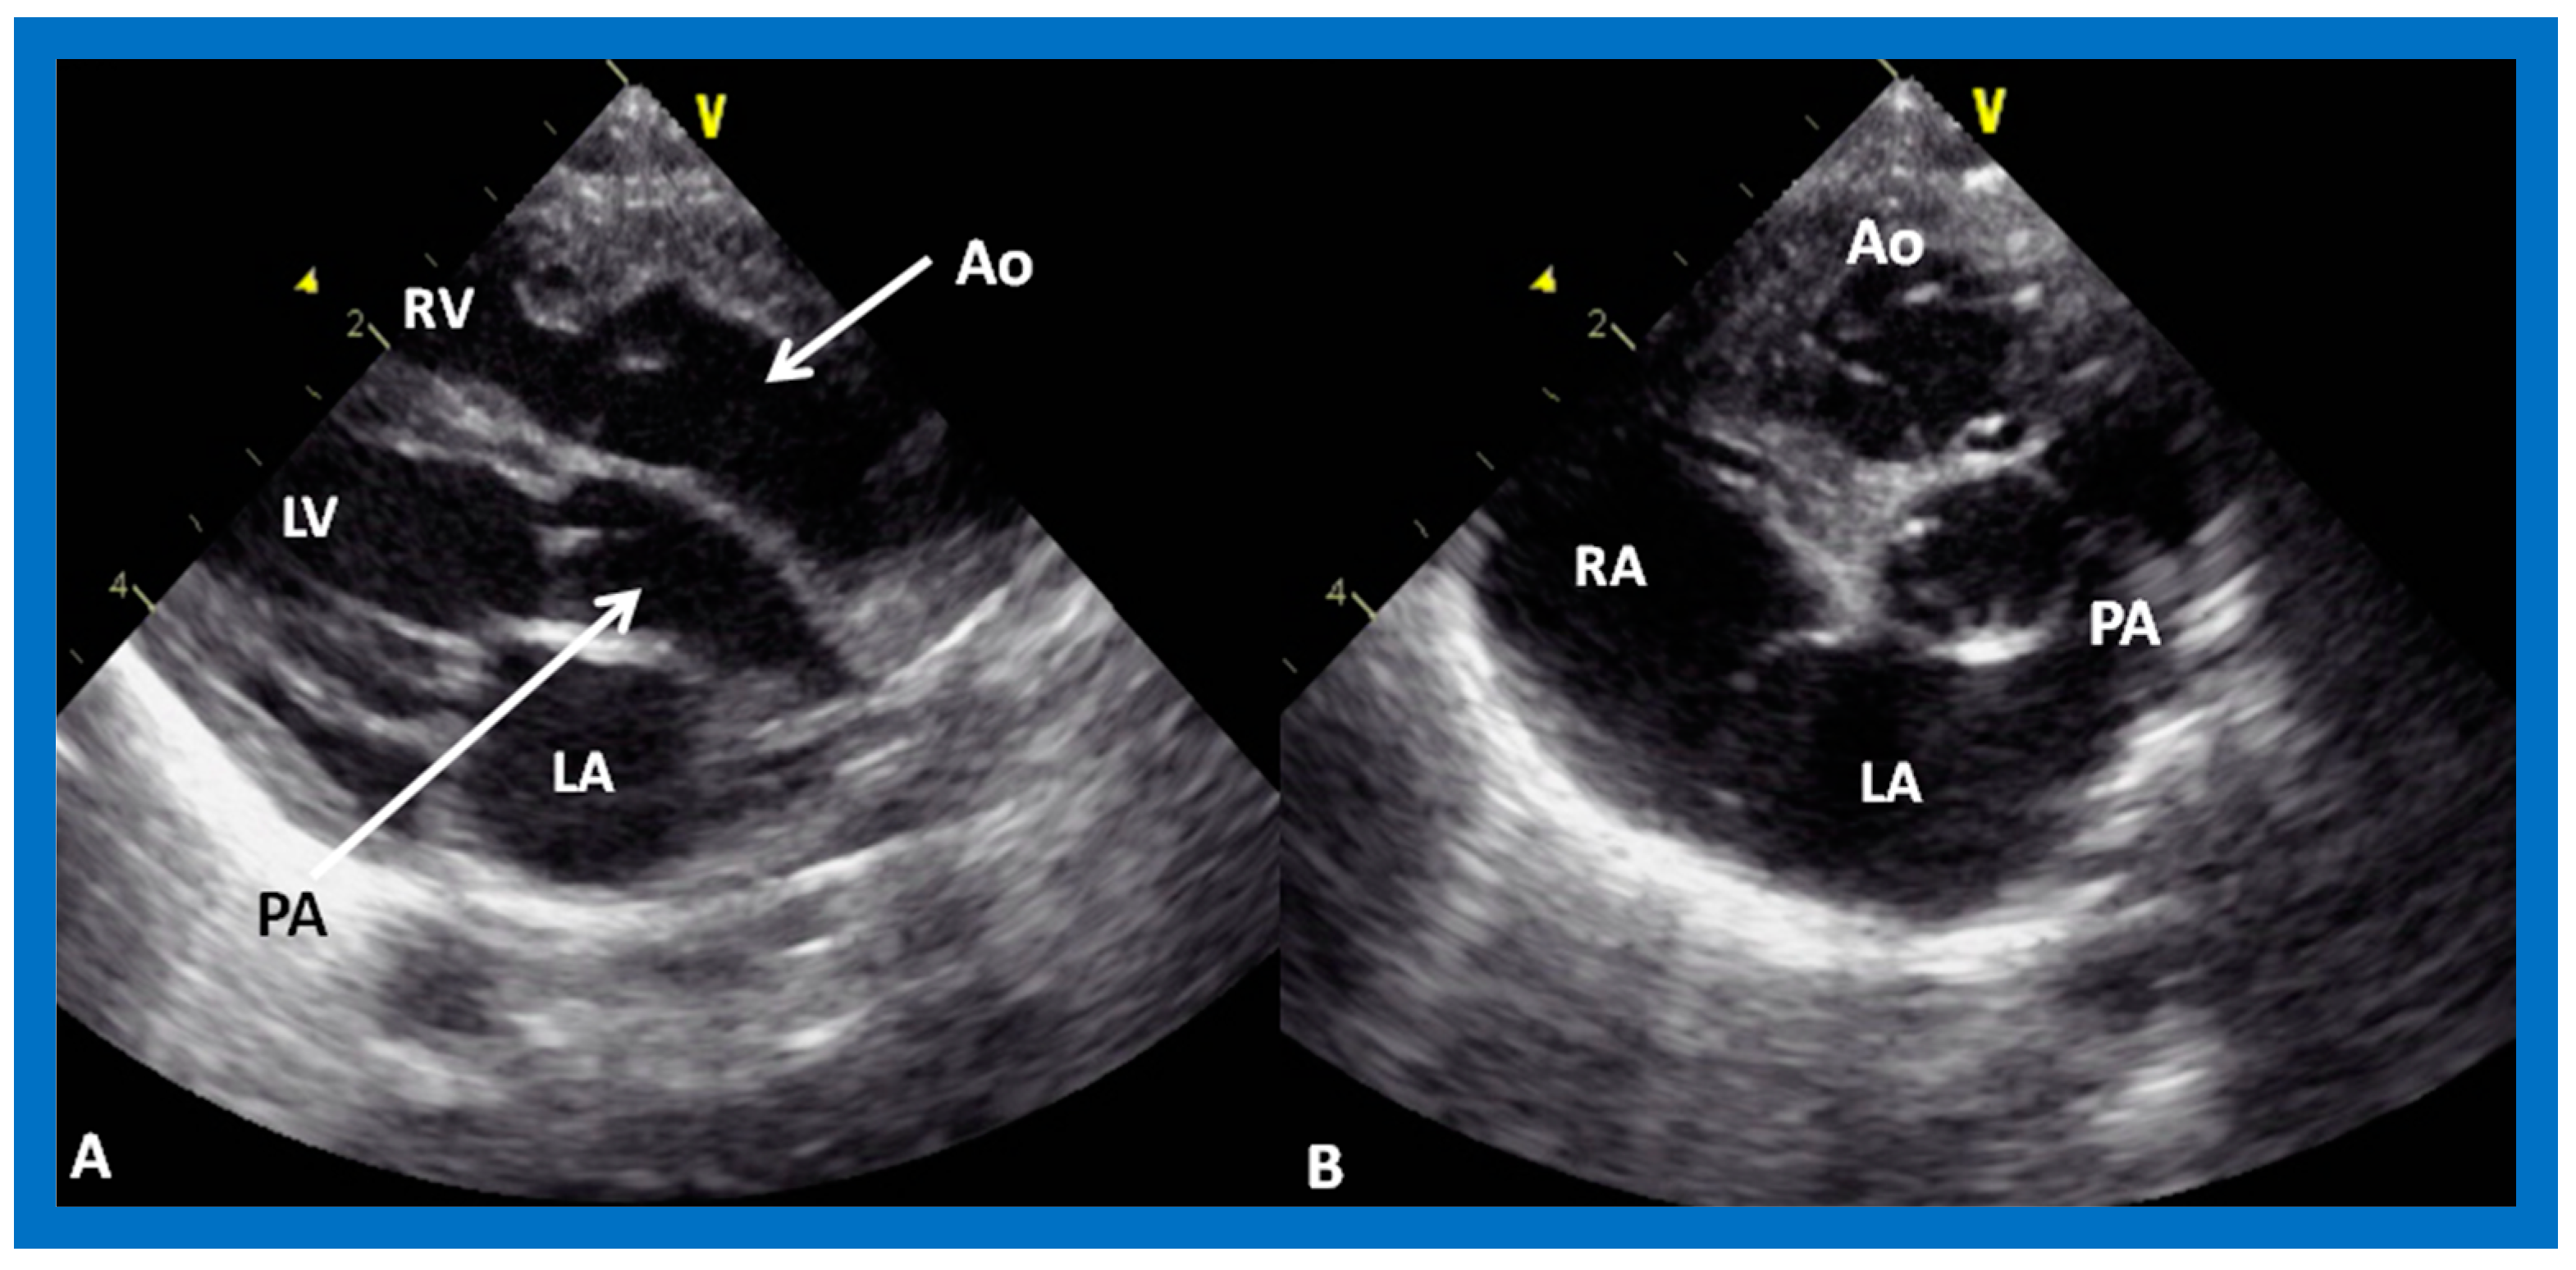
Figure 27.
Subcostal echo images in two-dimensional (A) and color flow (B) illustrate the entrance of the inferior vena cava (IVC) into the right atrium (RA). HV, hepatic vein; Liv, liver.
Figure 27.
Subcostal echo images in two-dimensional (A) and color flow (B) illustrate the entrance of the inferior vena cava (IVC) into the right atrium (RA). HV, hepatic vein; Liv, liver.
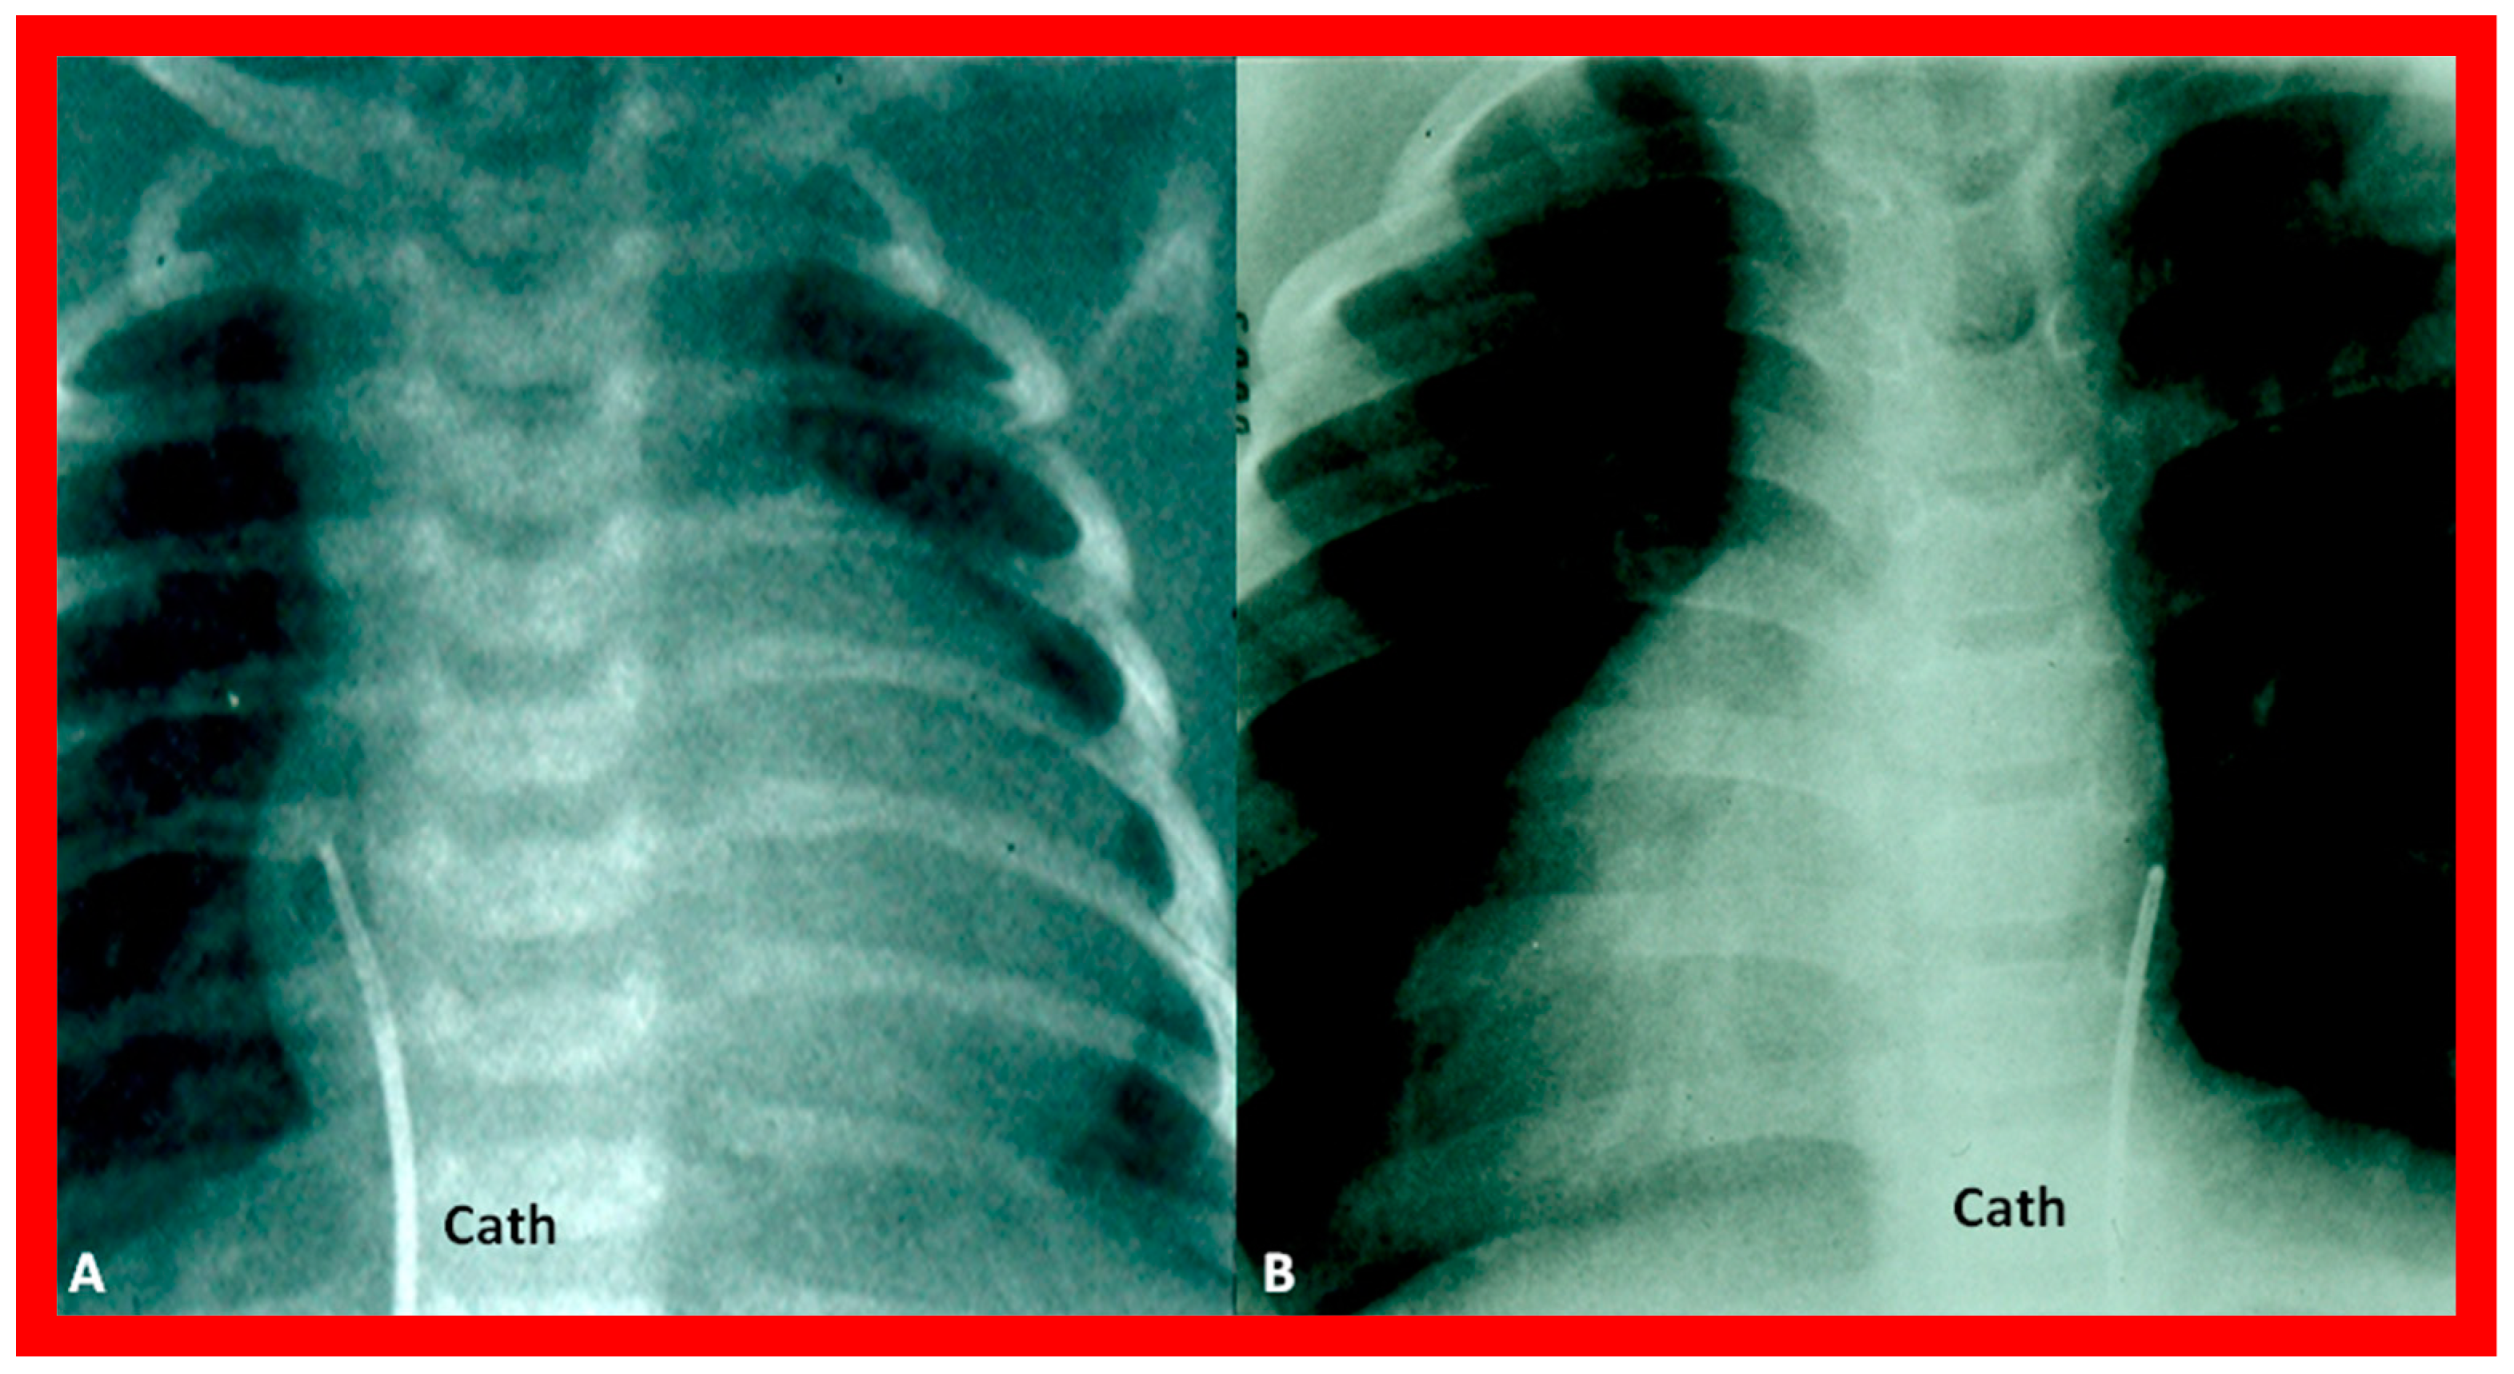
Figure 28.
Cinefluoro images in posteroanterior views, illustrating positions of the catheters (Cath) in the inferior vena cava as they enter the right atrium (not labeled) in a patient with situs solitus (
A) and another patient with situs inversus (
B). Reproduced from reference [
4].
Figure 28.
Cinefluoro images in posteroanterior views, illustrating positions of the catheters (Cath) in the inferior vena cava as they enter the right atrium (not labeled) in a patient with situs solitus (
A) and another patient with situs inversus (
B). Reproduced from reference [
4].
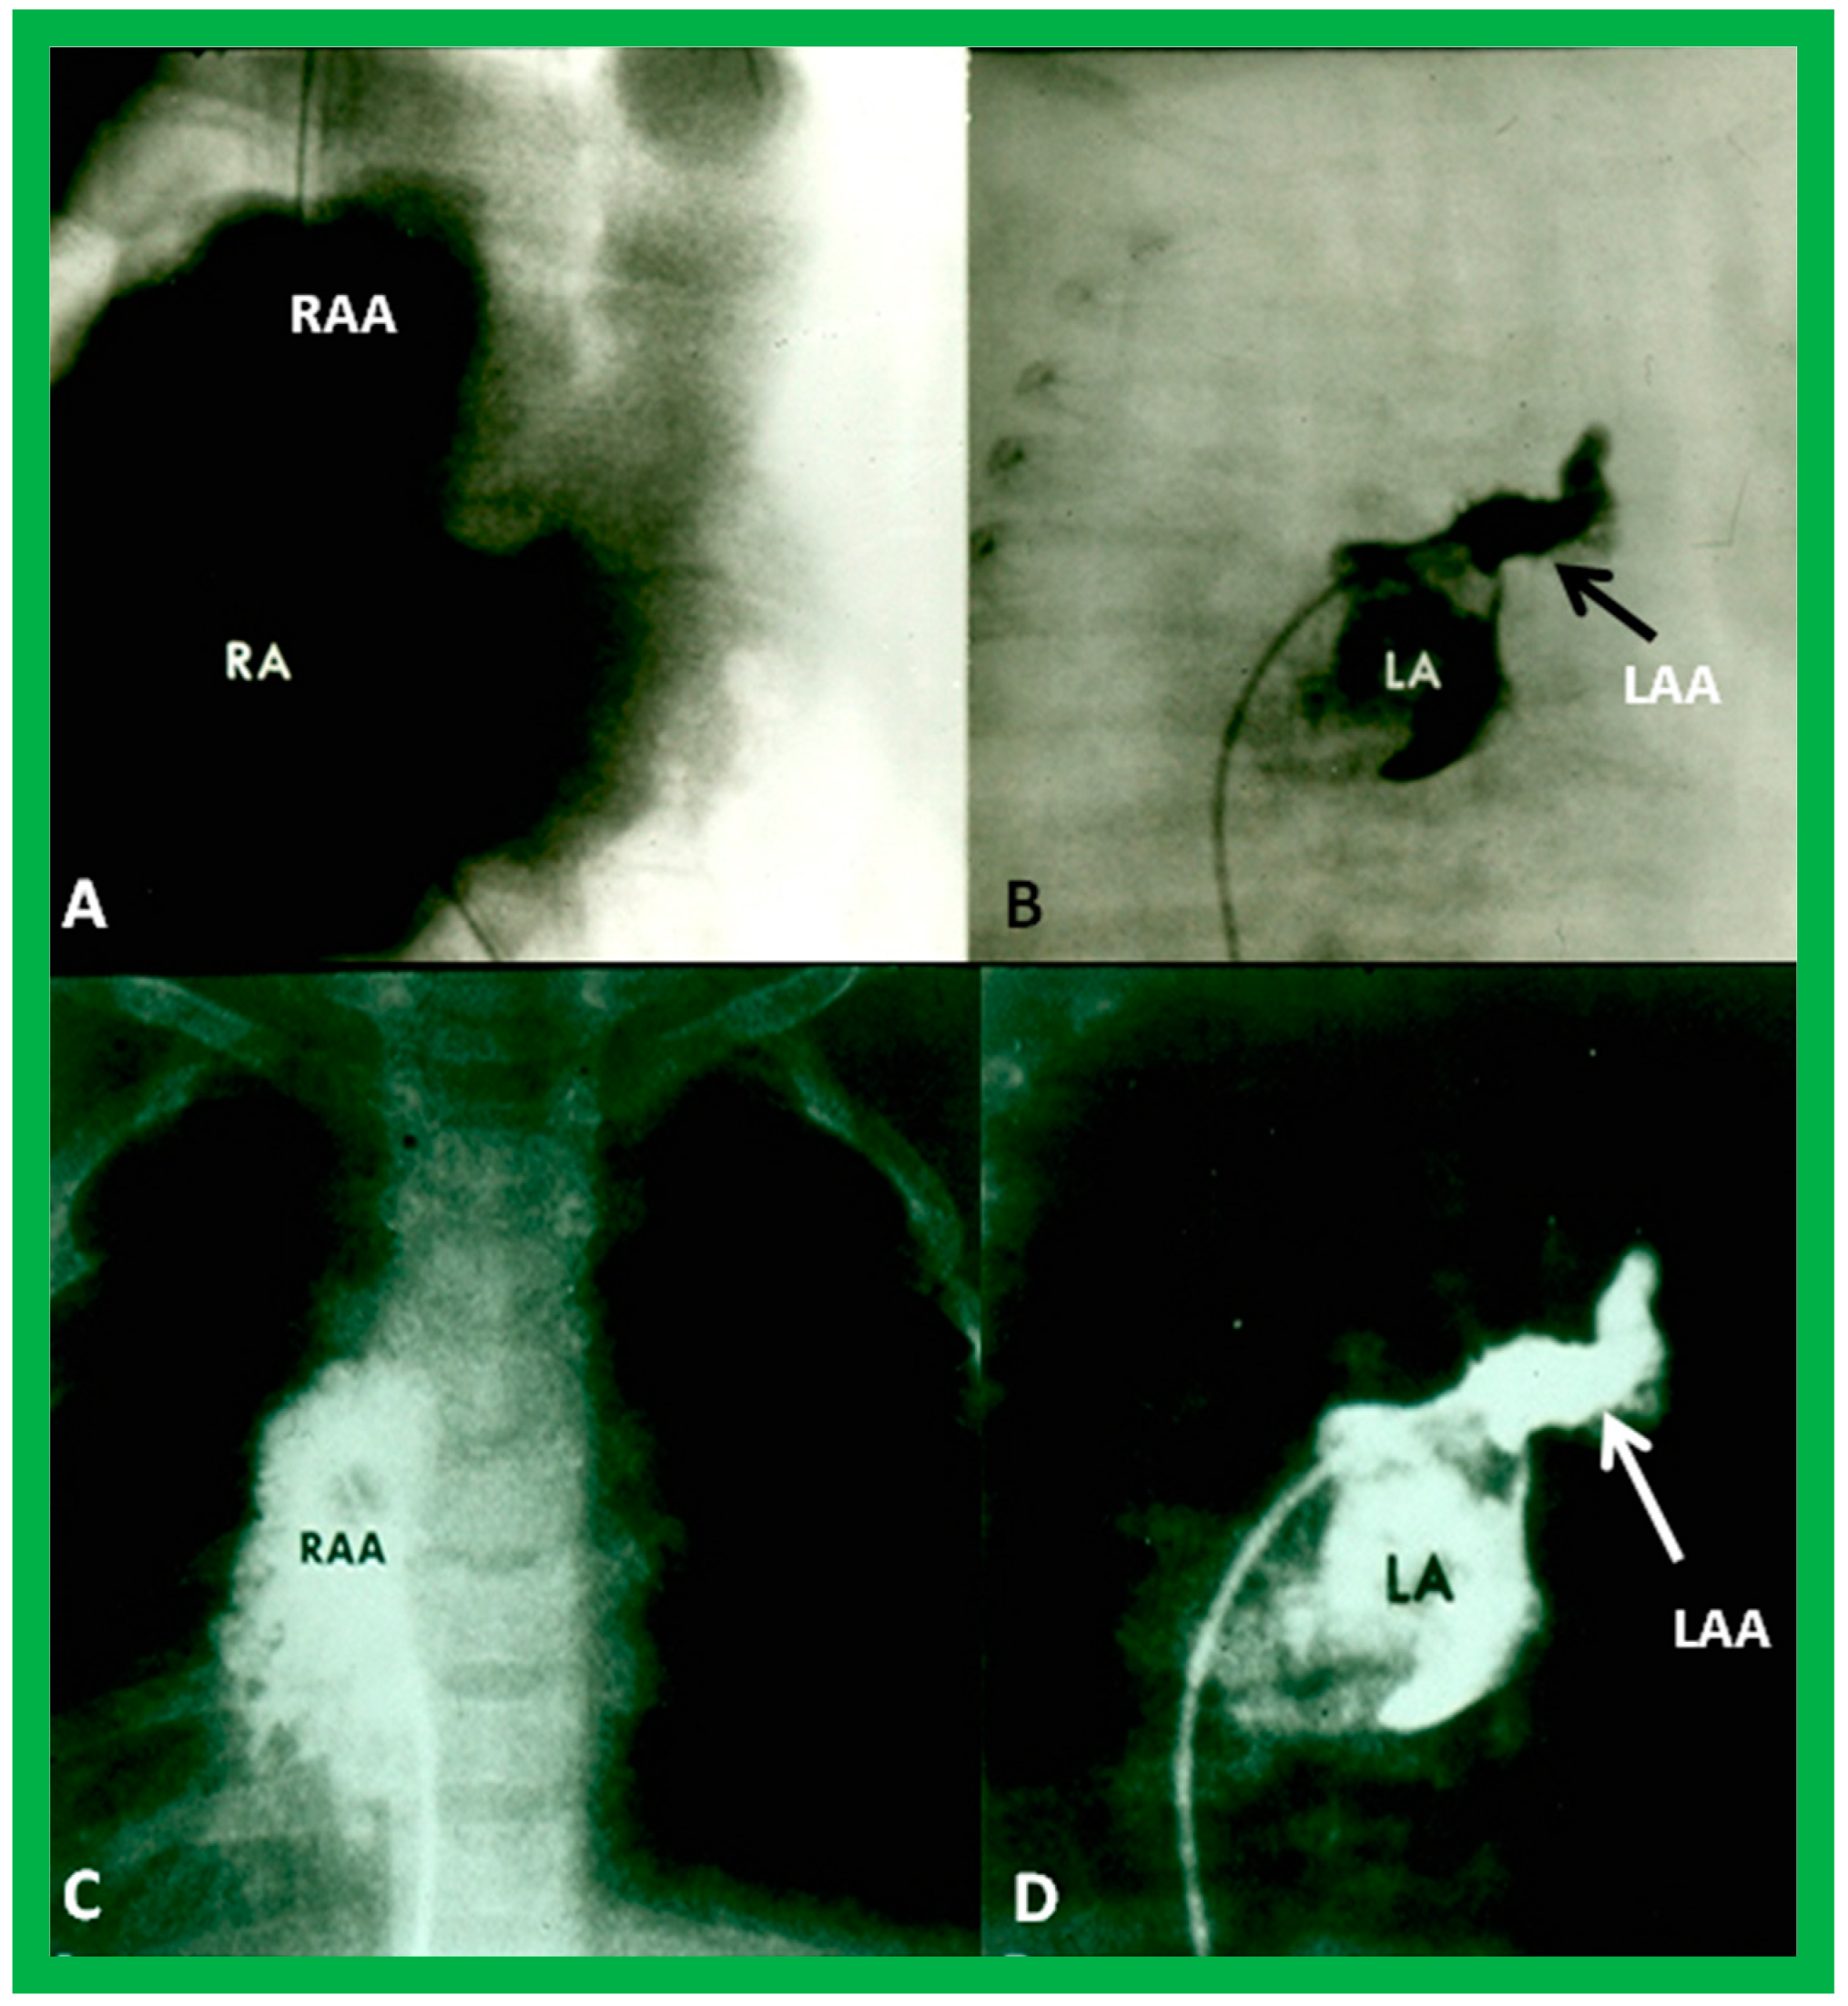
Figure 29.
Angiographic images of right (RA) (
A,
C) and left (LA) (
B,
D) atria in a posteroanterior view illustrating the atrial appendage morphology. The RA appendage (RAA) has a broad, large, and pyramidal shape (
A,
C), whereas the LA appendage (LAA) has a narrow, small, and tubular shape (
B,
D). Reproduced from reference [
4].
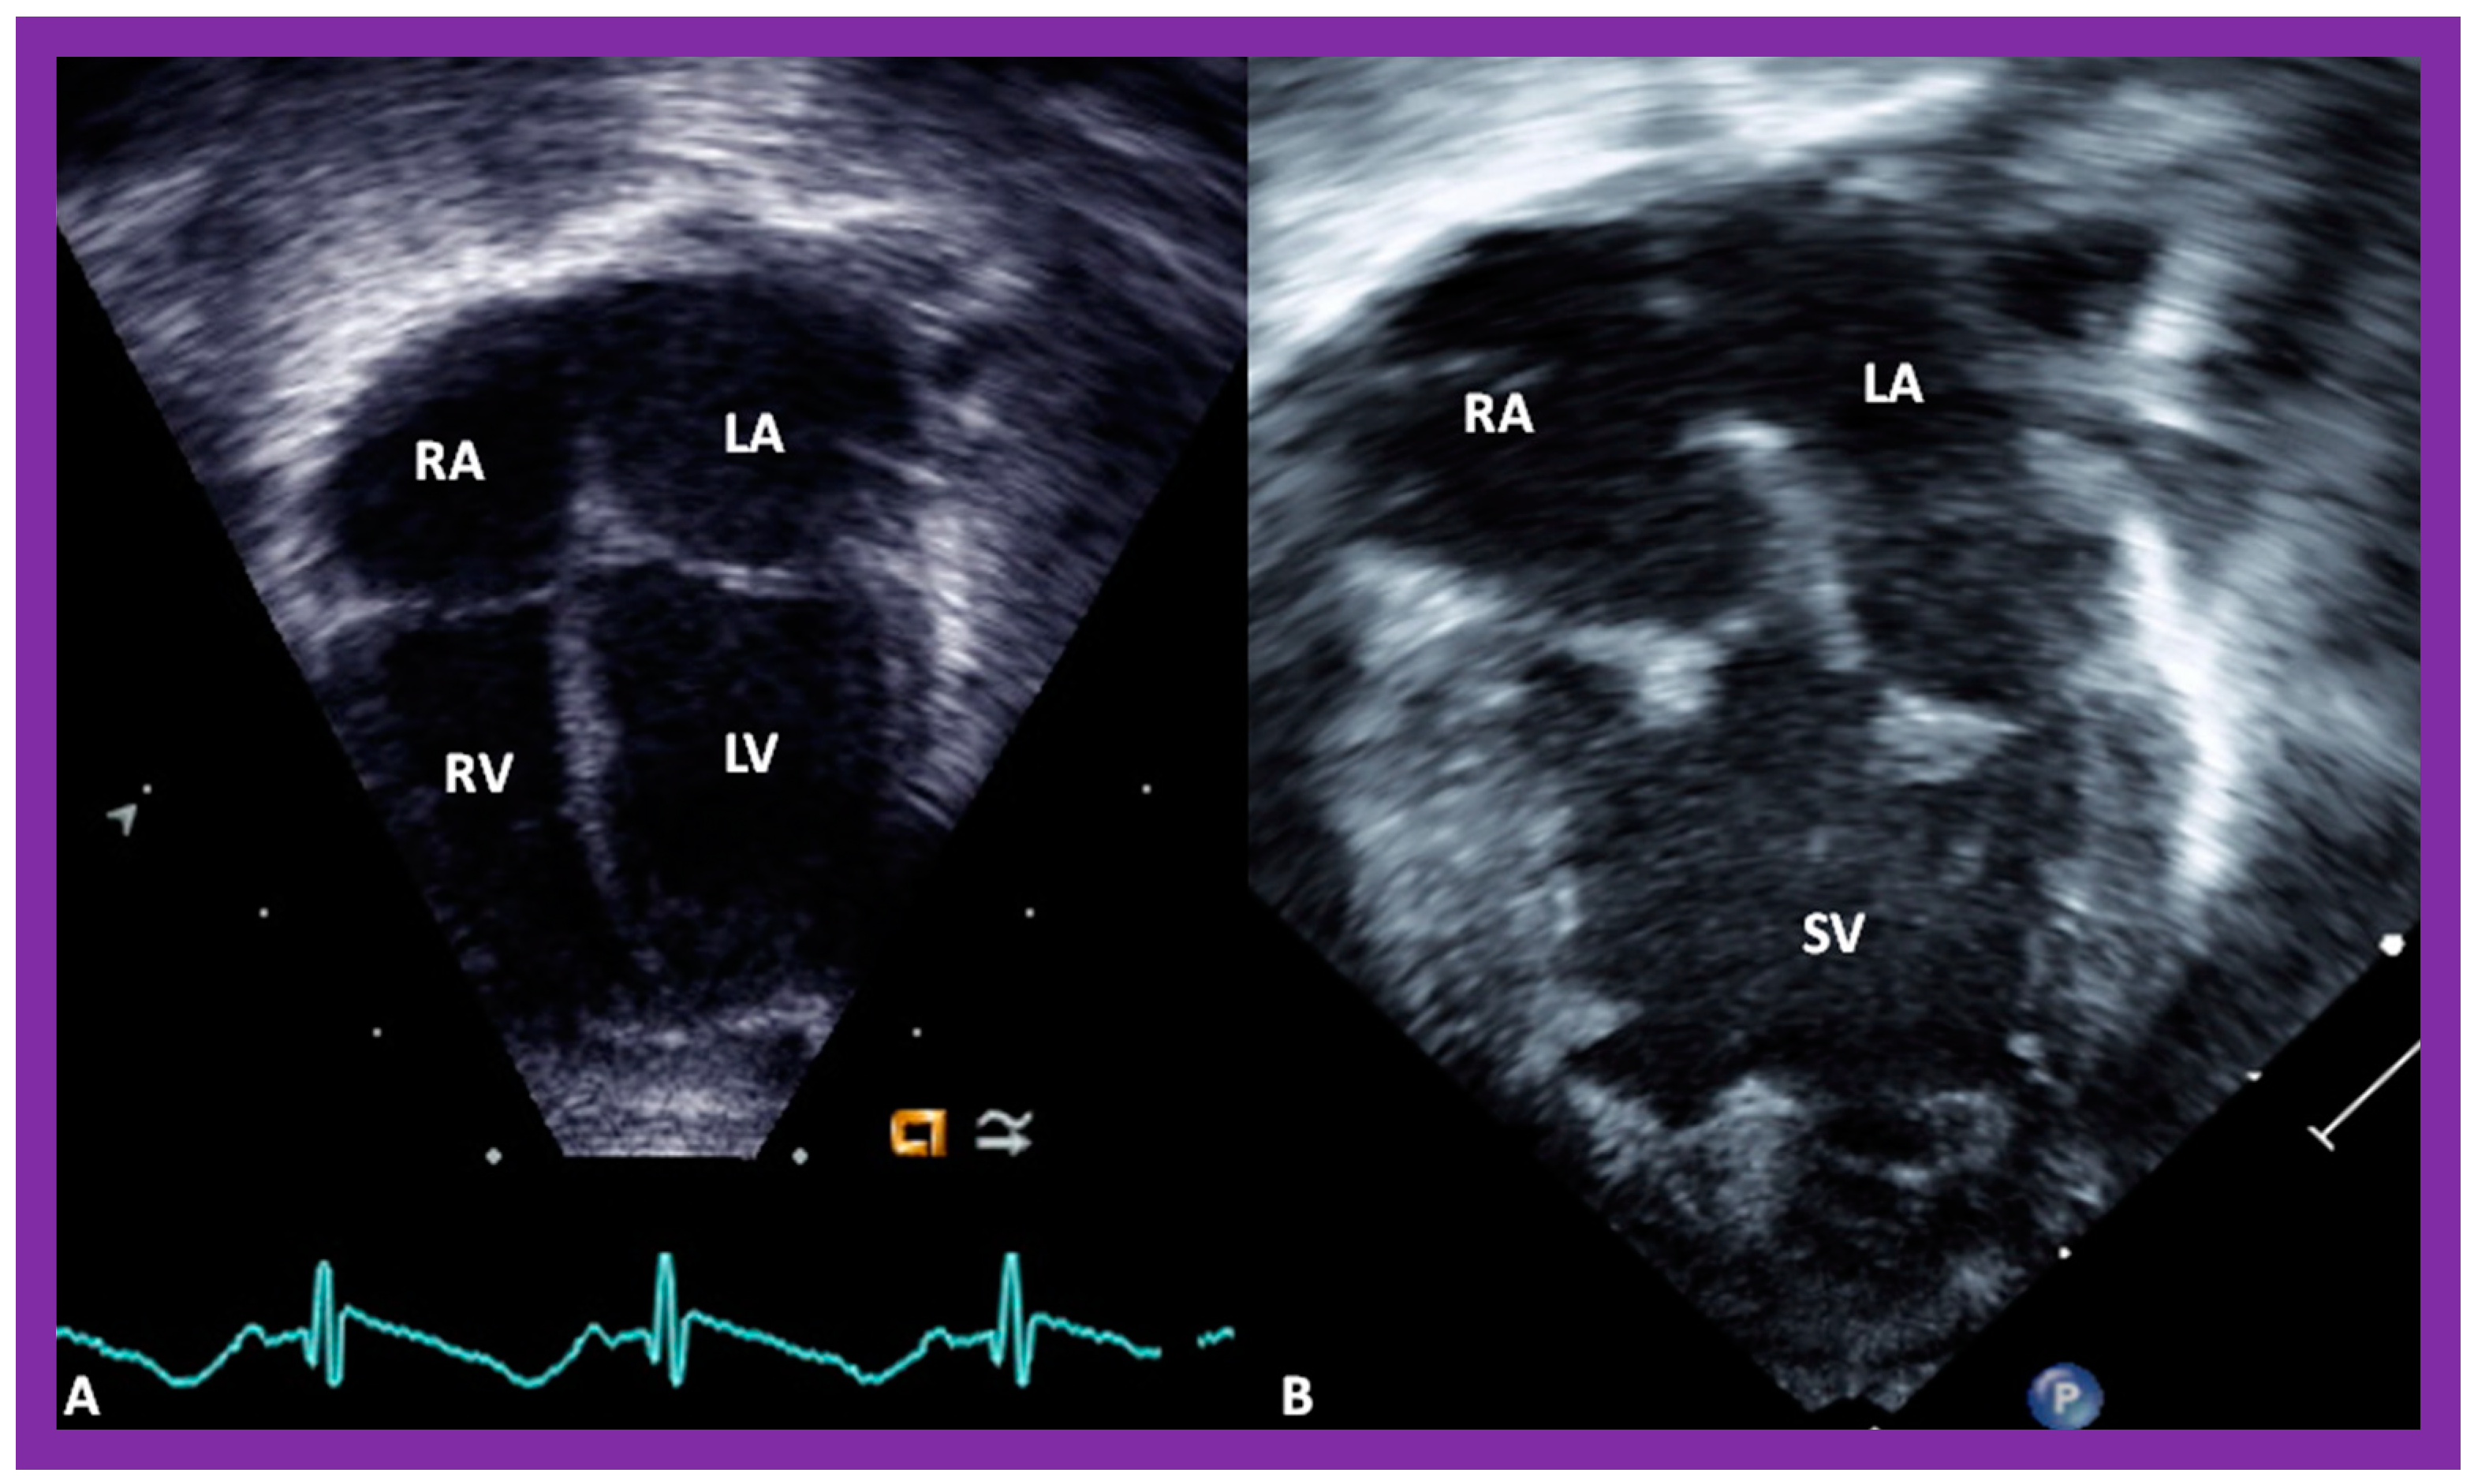
Figure 30.
Selected pictures from apical four-chamber echo views of two children, the first (
A), who has two ventricles, and the second (
B), who has one (single) ventricle (SV). The left atrium (LA), left ventricle (LV), right atrium (RA), and right ventricle (RV) are labeled. Reproduced from reference [
4].
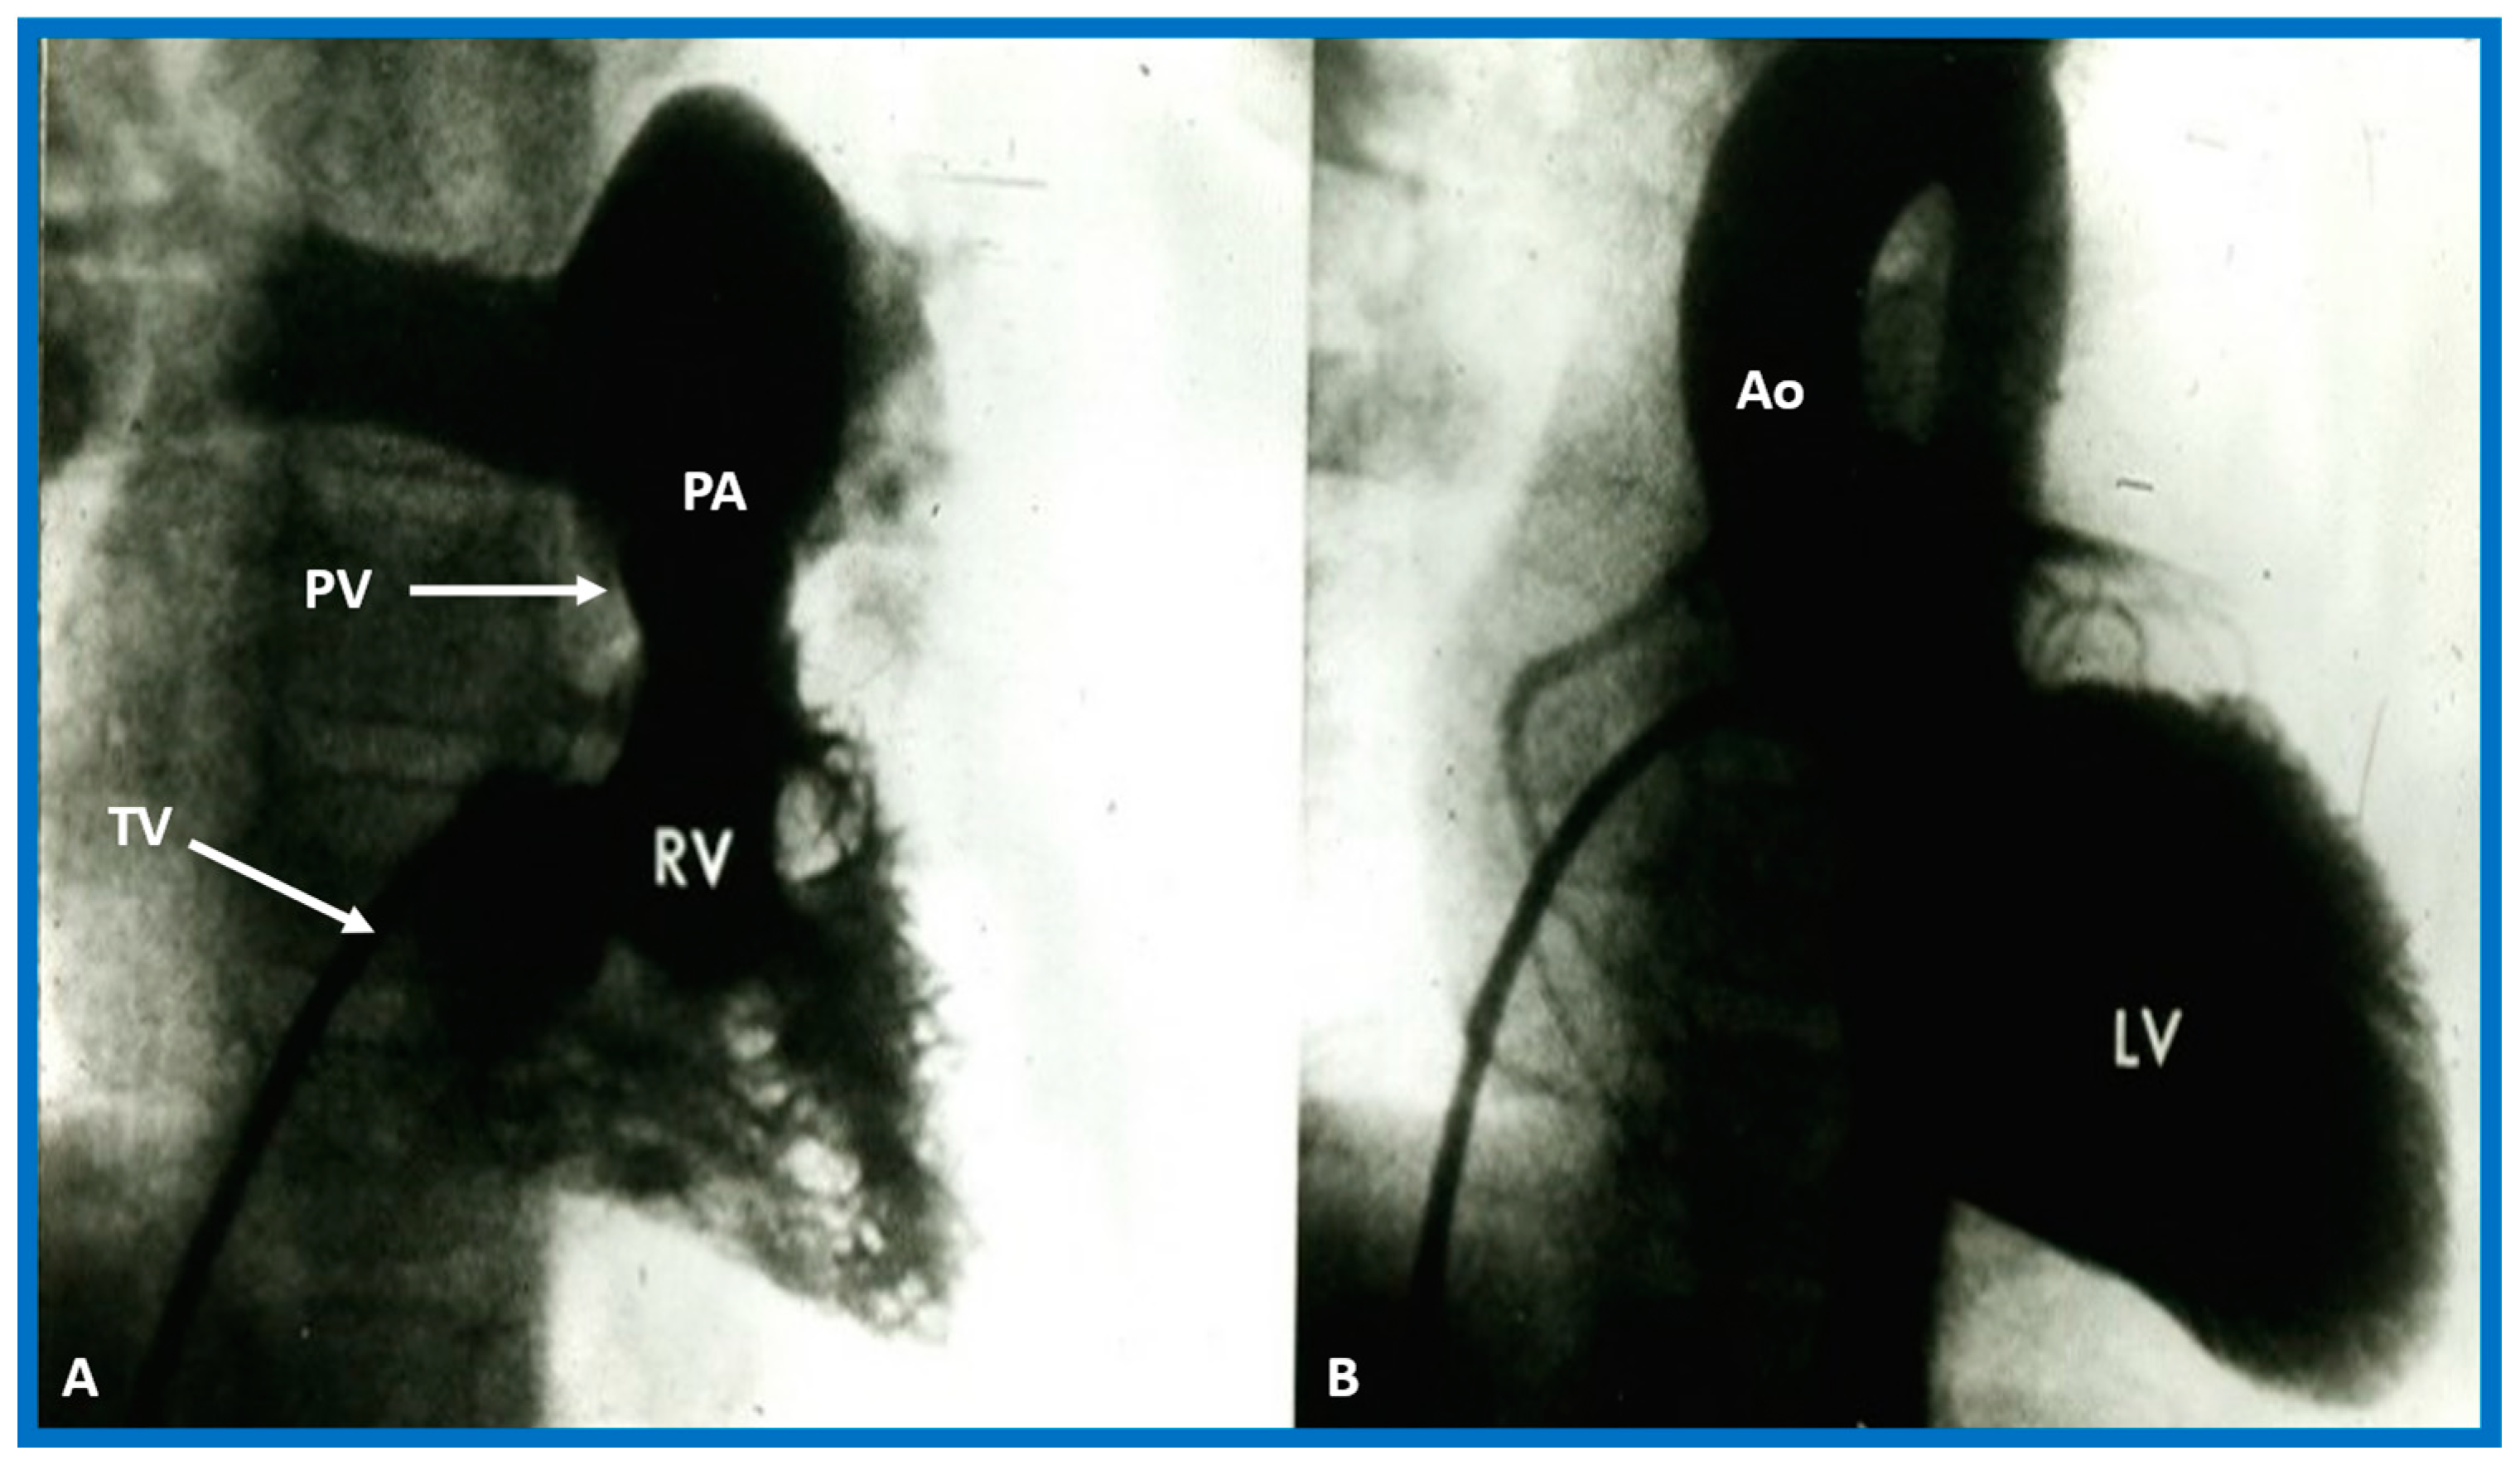
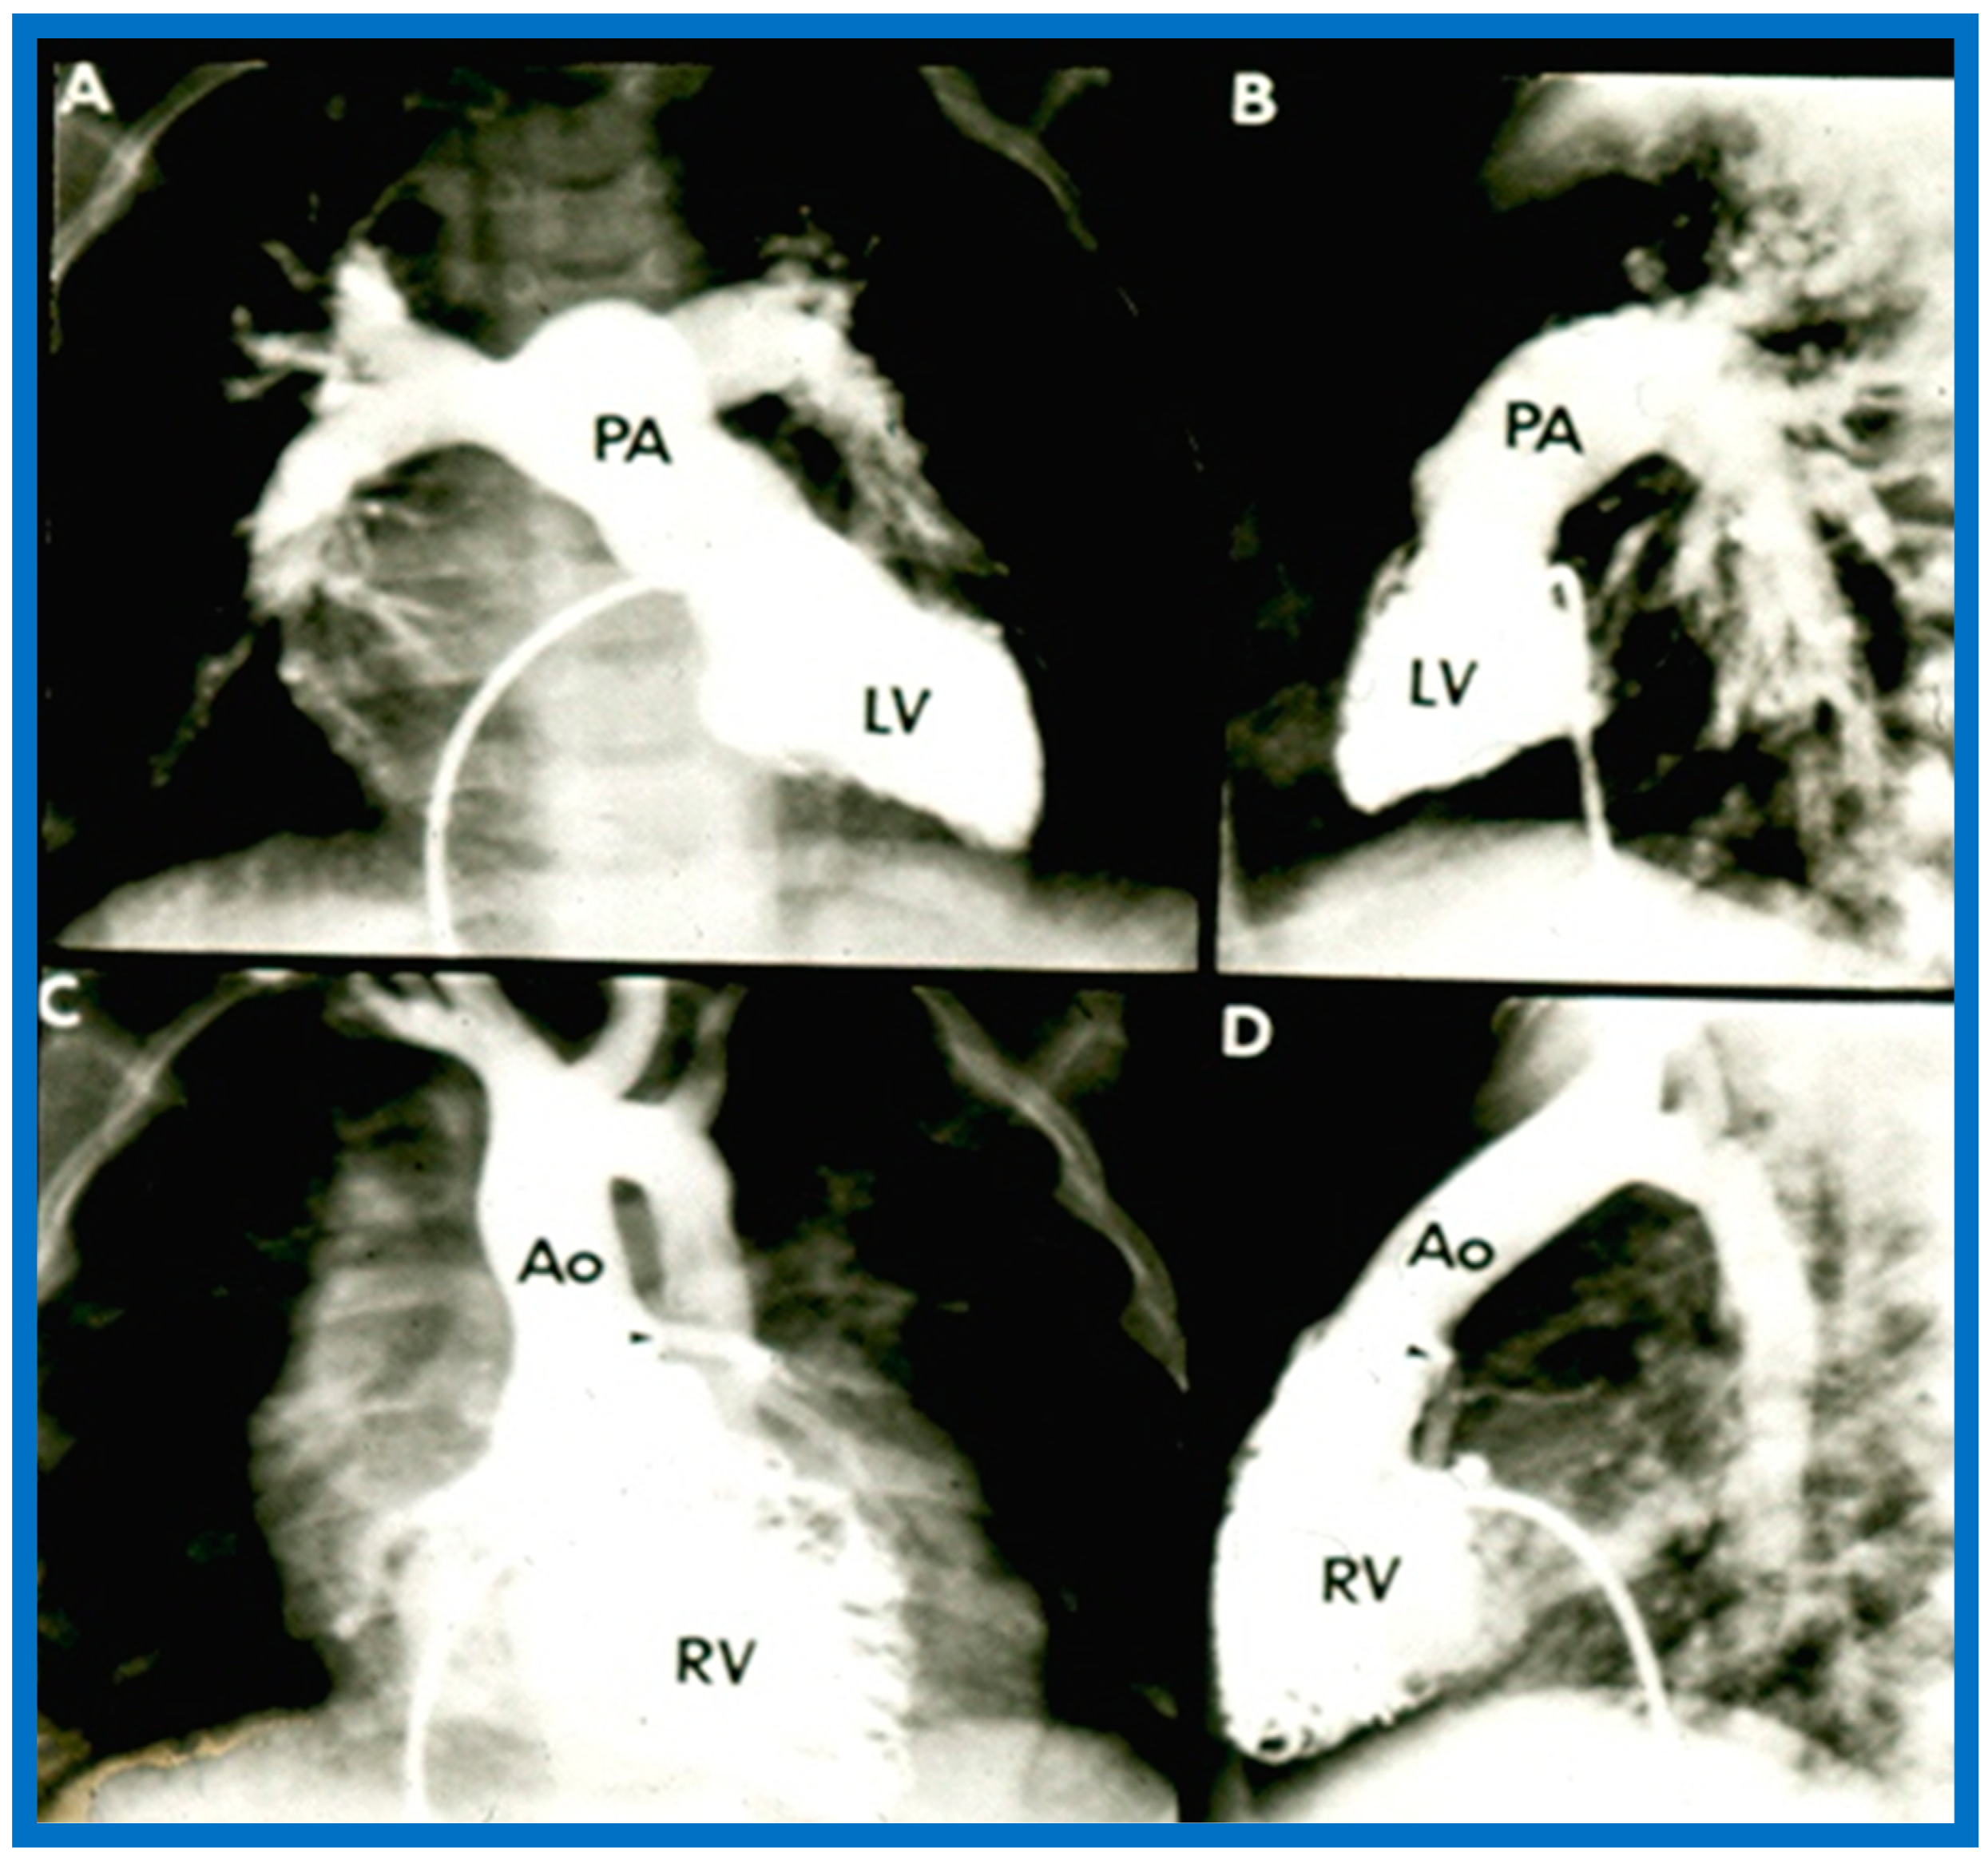
Figure 31.
Selected angiographic images demonstrating characteristic features of the right (
A) and left (
B) ventricles. The right ventricle (RV) exhibits coarse trabeculations (
A), while the left ventricle (LV) shows smooth or fine trabeculations (
B). In addition, the RV exhibits a triangular shape, whereas the LV is a foot-shaped structure. The tricuspid (TV) and pulmonary (PV) valves (arrows in (
A)) are separated by a muscular structure, crista supraventricularis. Aorta (Ao) and pulmonary artery (PA) are labeled. Modified from reference [
3].
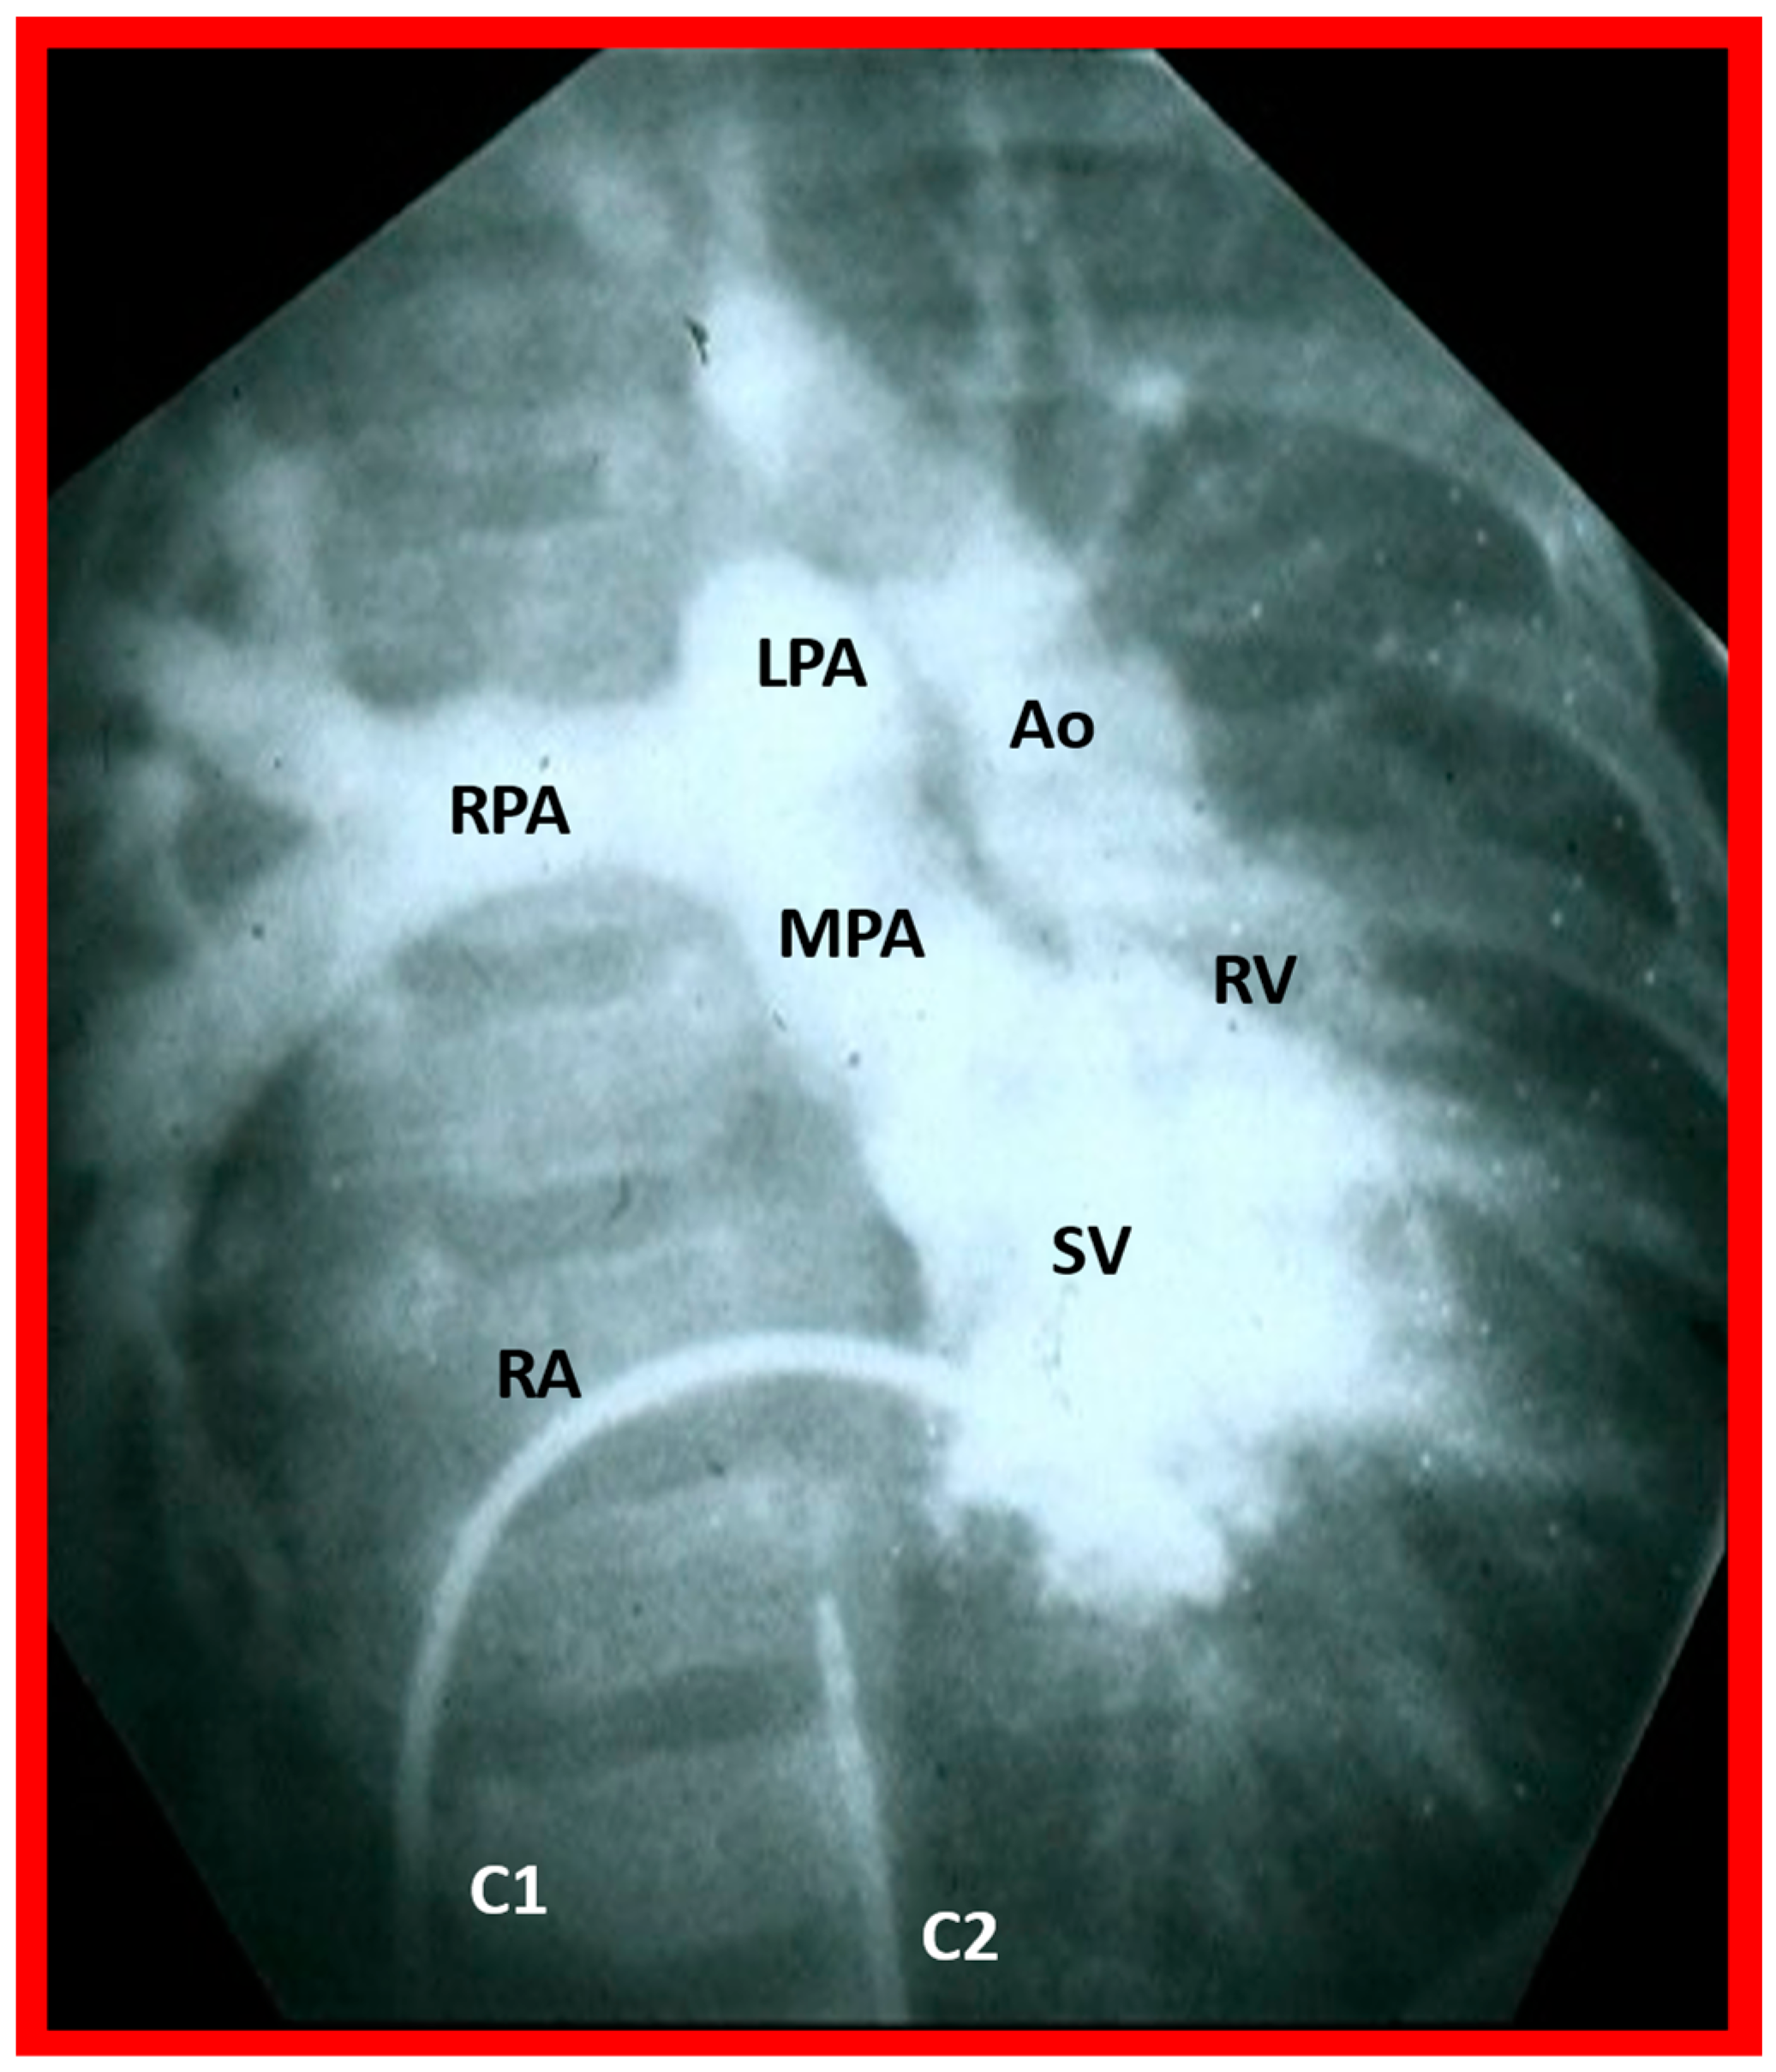
Figure 32.
Selected angiographic image in the posteroanterior view of a patient with a single ventricle (SV) illustrating opacification of the main pulmonary artery (MPA) from the main ventricular chamber and the aorta (Ao) arising from a smallish right ventricle (RV). The Ao is situated to the left of the pulmonary artery, signifying the l-transposition of the great arteries. C1. The catheter in the unmarked inferior vena cava was advanced into the right atrium (RA) and then manipulated into the ventricle; C2. Catheter in the unmarked descending aorta. The left pulmonary artery (LPA) and right pulmonary artery (RPA) are labeled. Reproduced from reference [
31].
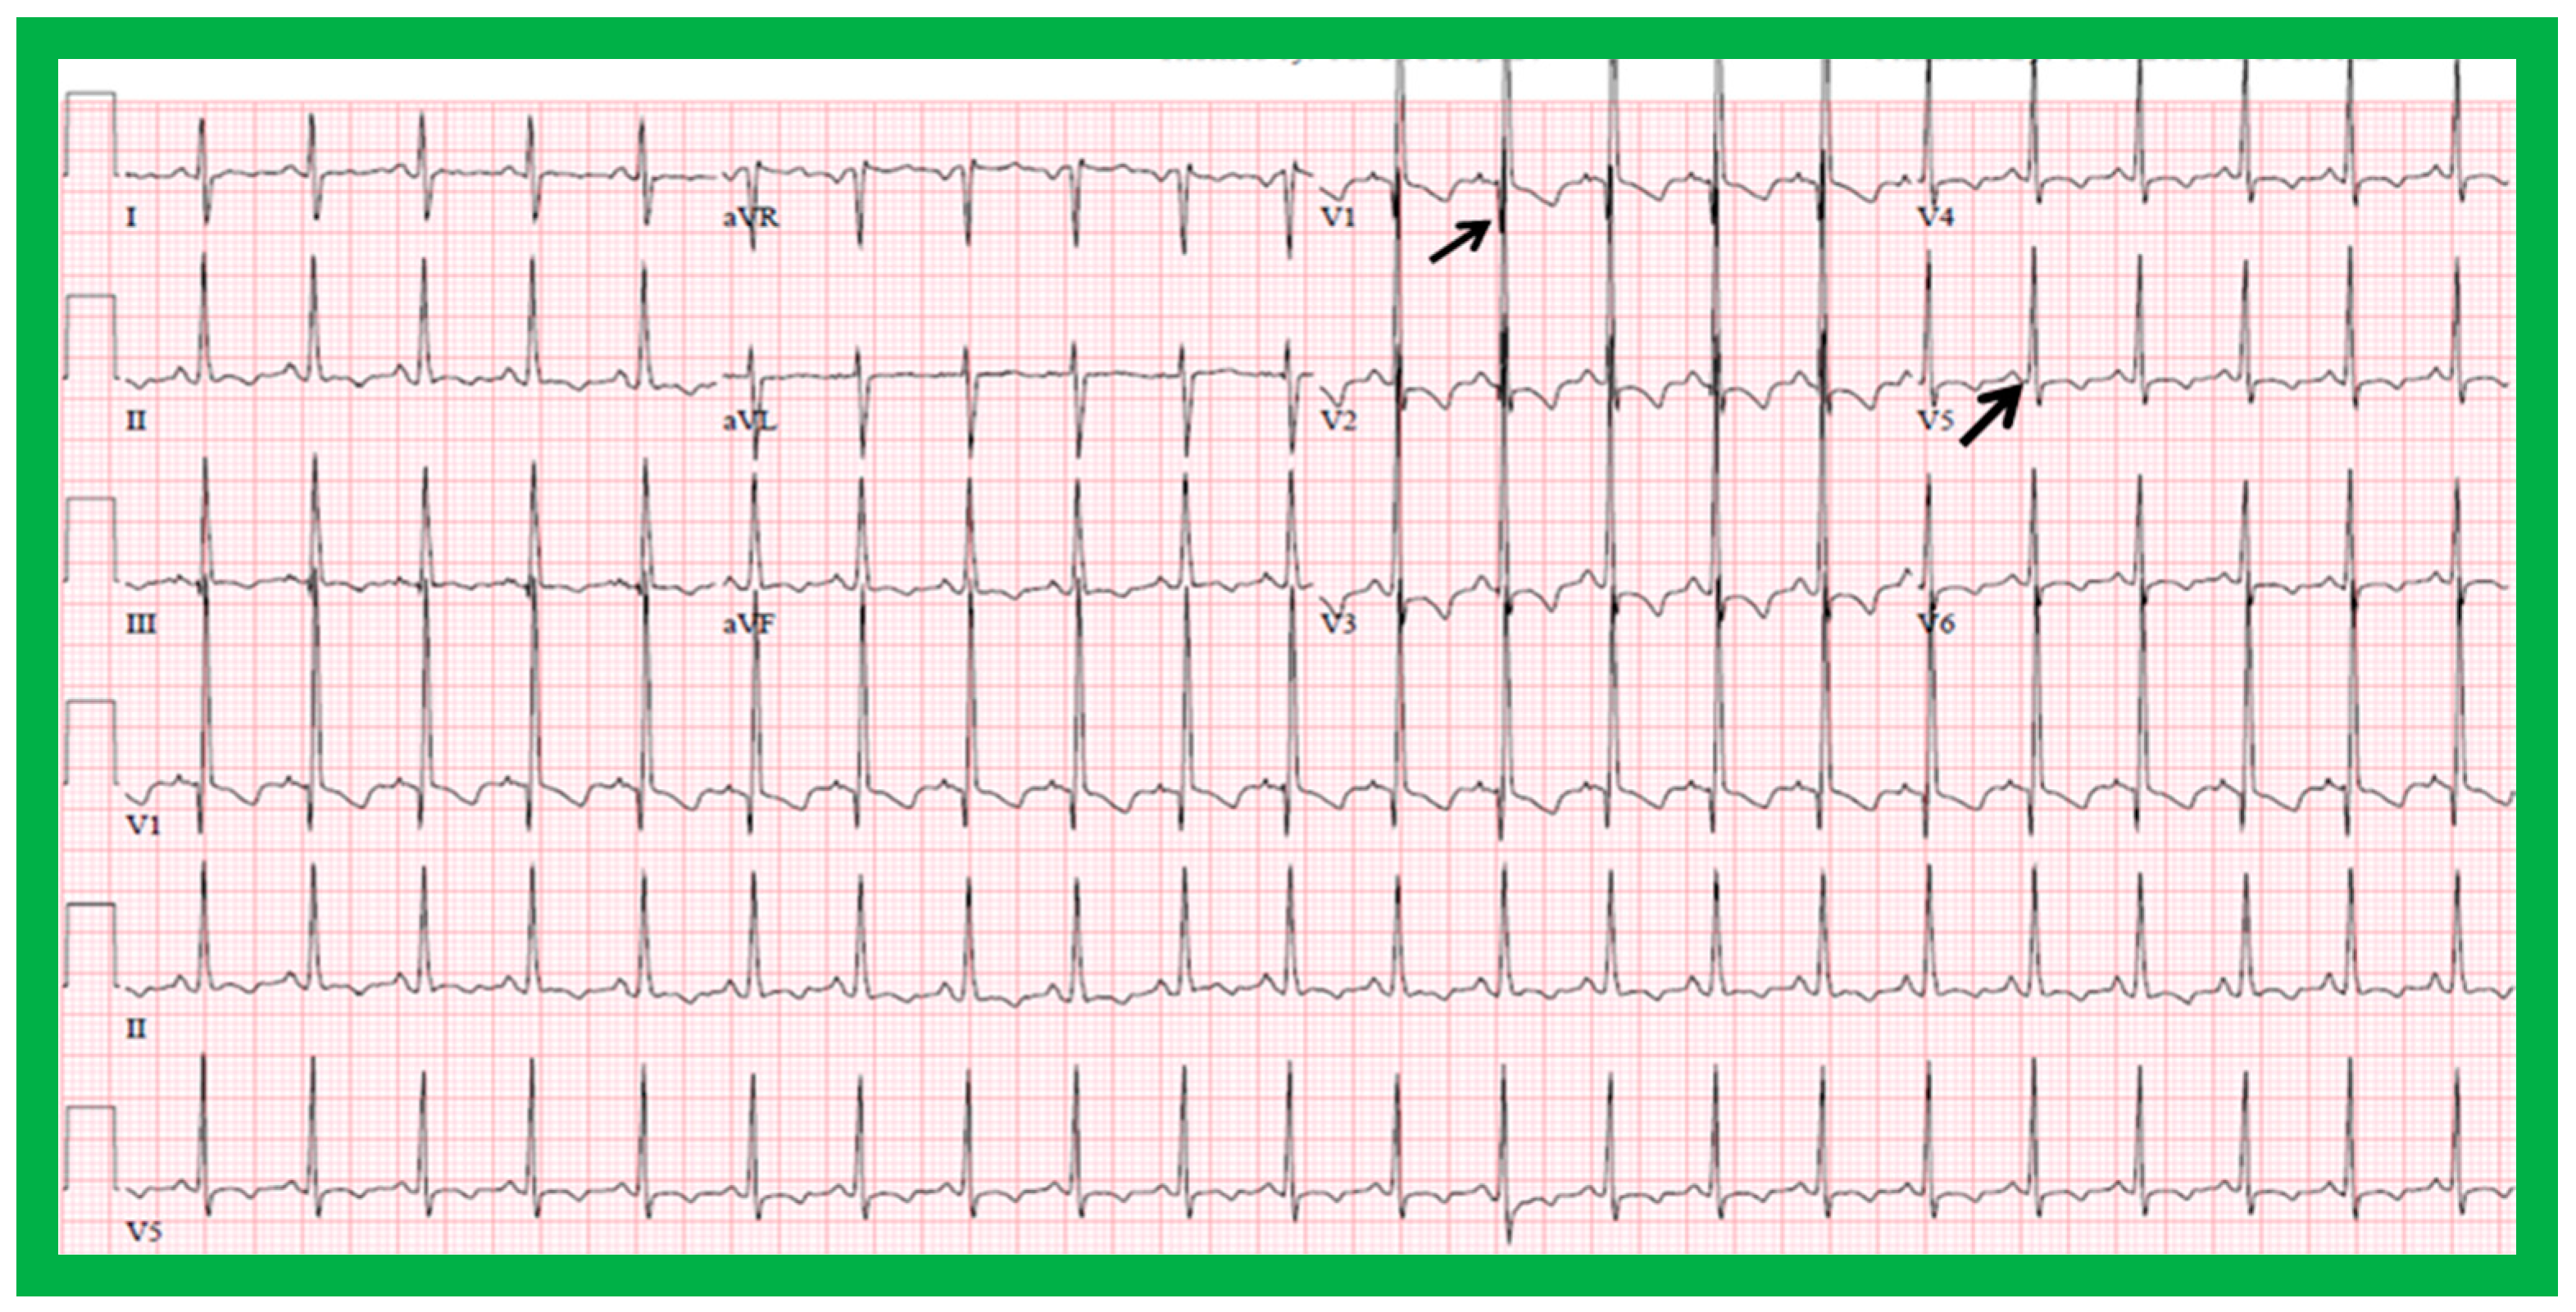
Figure 33.
Electrocardiogram of a child illustrating q waves in lead V1 (top arrow) and no q waves in leads V5 and V6 (lower arrow). Such a pattern is indicative of inversion of the ventricles. However, such an abnormality has also been seen in subjects with severe right ventricular hypertrophy. A P wave vector of +45 degrees with positive P waves in leads I and AVF is indicative of situs solitus.
Figure 34.
Echo images demonstrating finely trabeculated left ventricle (LV) (A,B) and coarsely trabeculated right ventricle (RV) (A,C) in apical precordial views. The LV trabeculations are barely seen in (A) but are better seen in (B). Similarly, the RV trabeculations are better seen in (C). Aorta (Ao), left atrium (LA), and right atrium (RA) are labeled.
Figure 35.
(
A,
B). Selected cine frames of the Left ventricle (LV) in posteroanterior (
A) and lateral (
B) projections of a child with d-transposition of the great arteries illustrating morphologic LV with fine trabeculations. The pulmonary artery (PA) originates from the LV. The pulmonary valve is positioned inferior and posterior to its normal position. (
C,
D). Selected cine frames of the right ventricle (RV) in posteroanterior (
C) and lateral (
D) projections of the same child shown in (
A,
B) illustrating morphologic RV with coarse trabeculations. The aorta (Ao) originates from the RV. The aortic valve is positioned superior and anterior (
C,
D) to its normal position. The closeness of the mitral with the pulmonary valve in a morphologic LV (
A,
B) and the separation of tricuspid and aortic valves in a morphologic RV (particularly in
D) is clearly seen. Replicated from reference [
35].
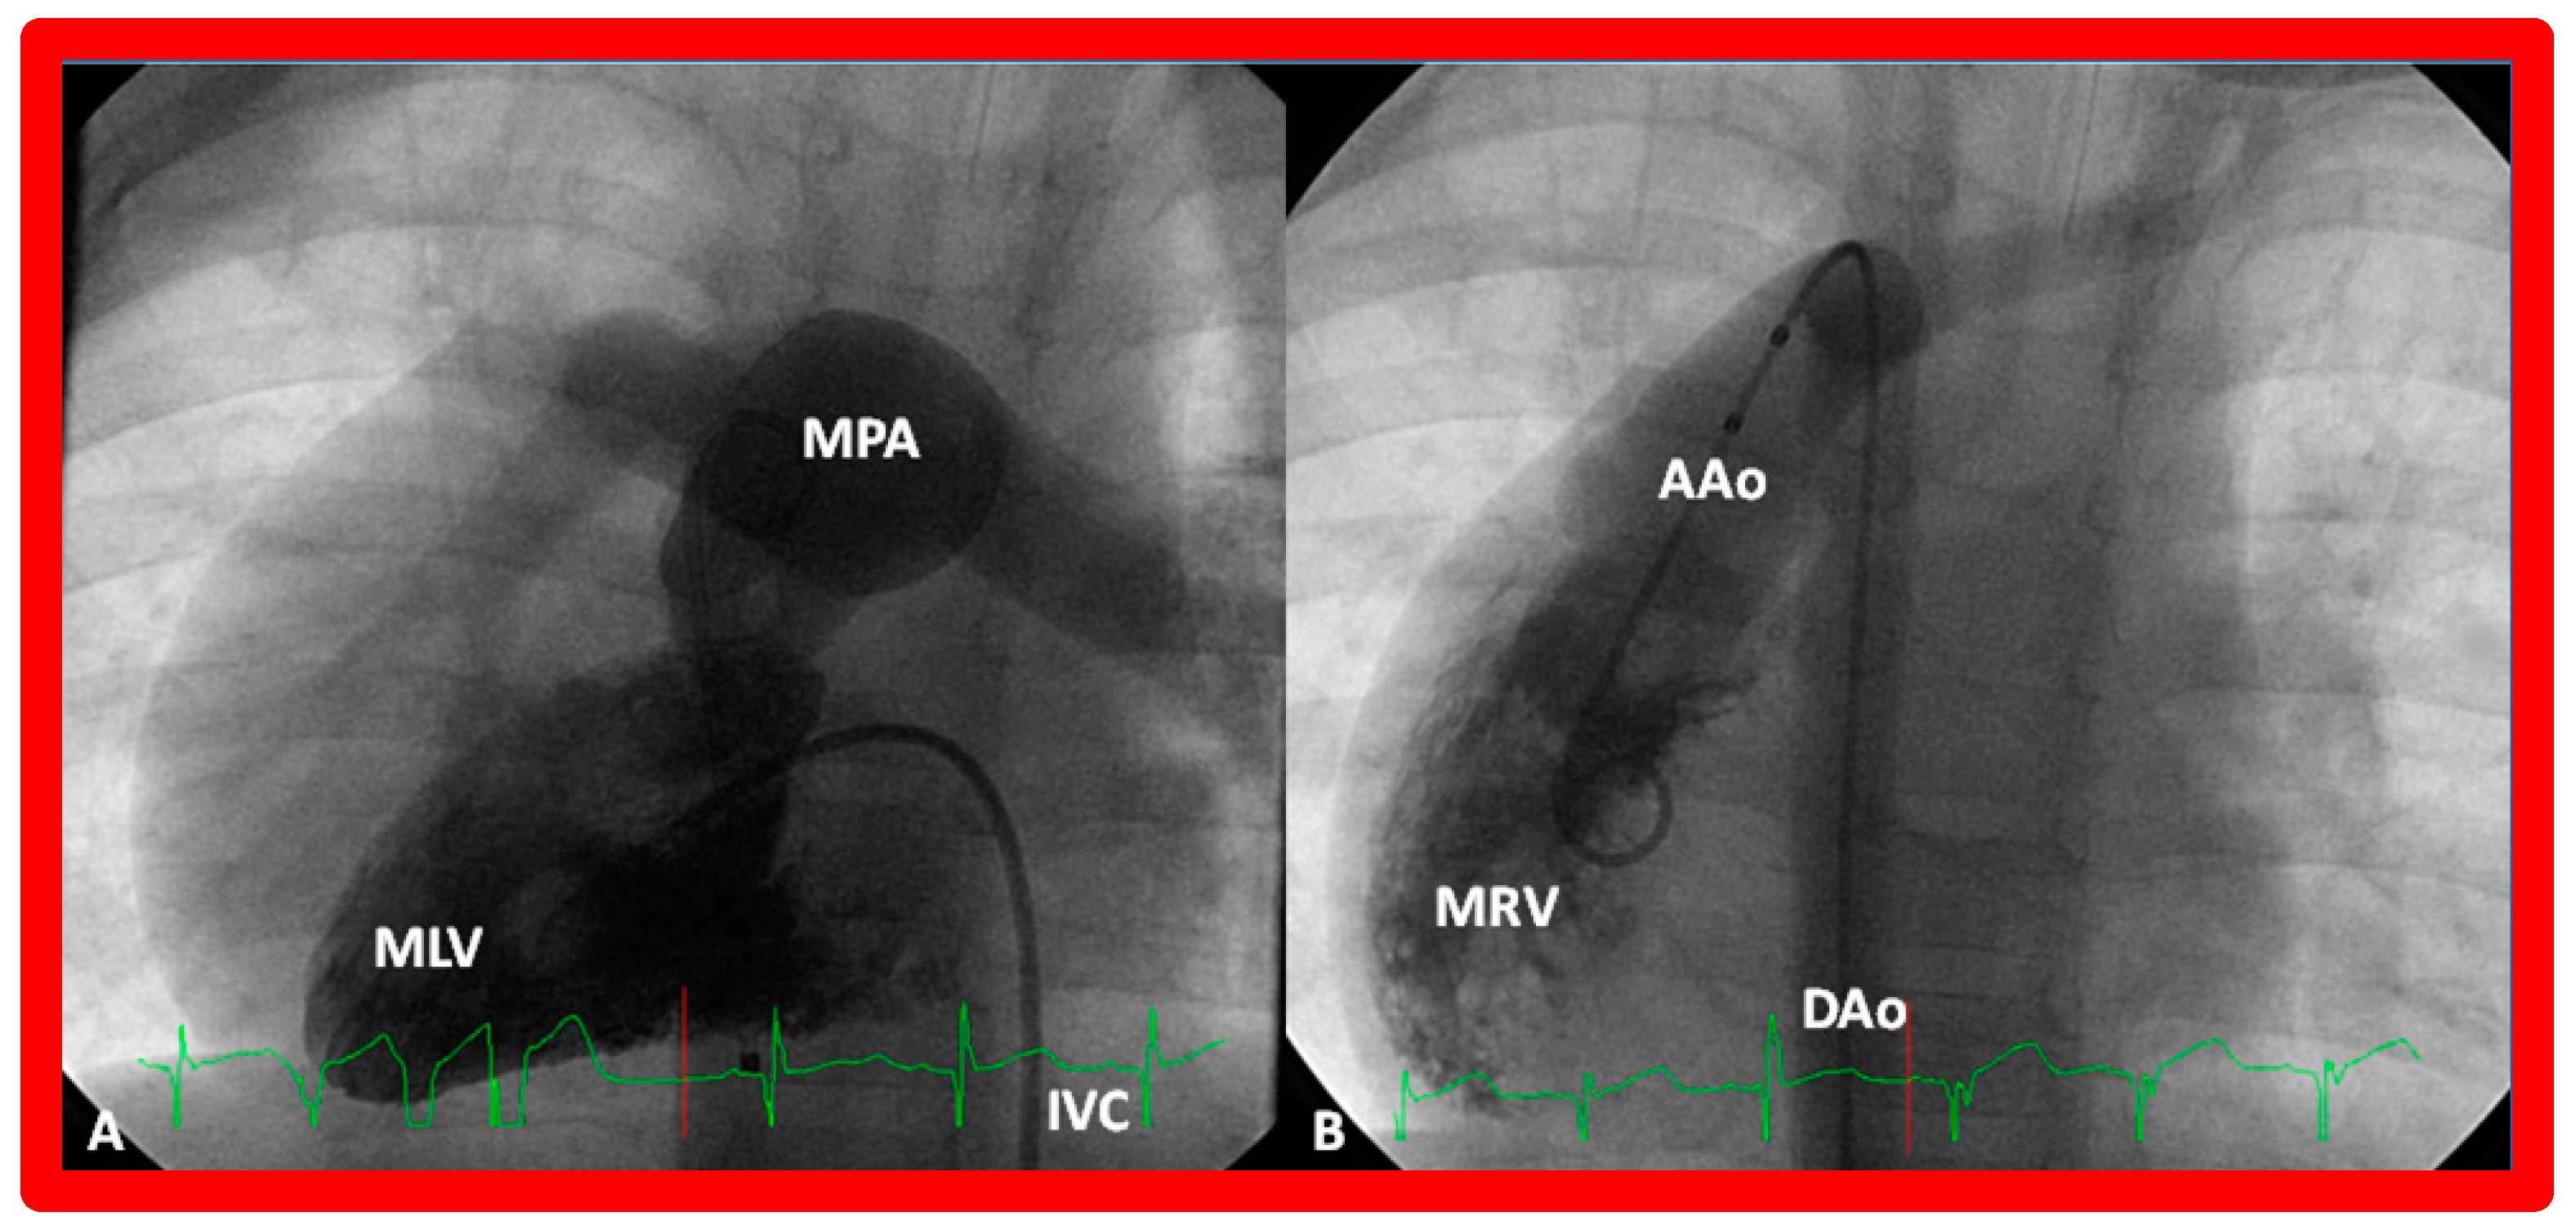
Figure 36.
(
A) Cine frame from morphologic left ventricular (MLV) cineangiogram in a posteroanterior view of an infant with dextrocardia, exhibiting fine trabeculations of the MLV on the left side. The MLV gives origin to the main pulmonary artery (MPA), which is dilated. The position of the catheter in the inferior vena cava (IVC) is on the left side of the spine. (
B) Demonstrates a morphologic right ventricle (MRV) in a posteroanterior view in the infant shown in (
A); coarse trabeculations are seen. The right-sided MRV gives rise to the aorta, denoted by AAo. The aorta descends on the right side of the spine. The aortic valve is situated rightward and superior to the pulmonary valve. It is located anteriorly in the lateral view (not shown). This information suggests a d-loop of the ventricles and d-transposition of the great arteries in a subject with dextrocardia, a disorder suggestive of corrected transposition physiology. DAo, descending aorta. Replicated from reference [
36].
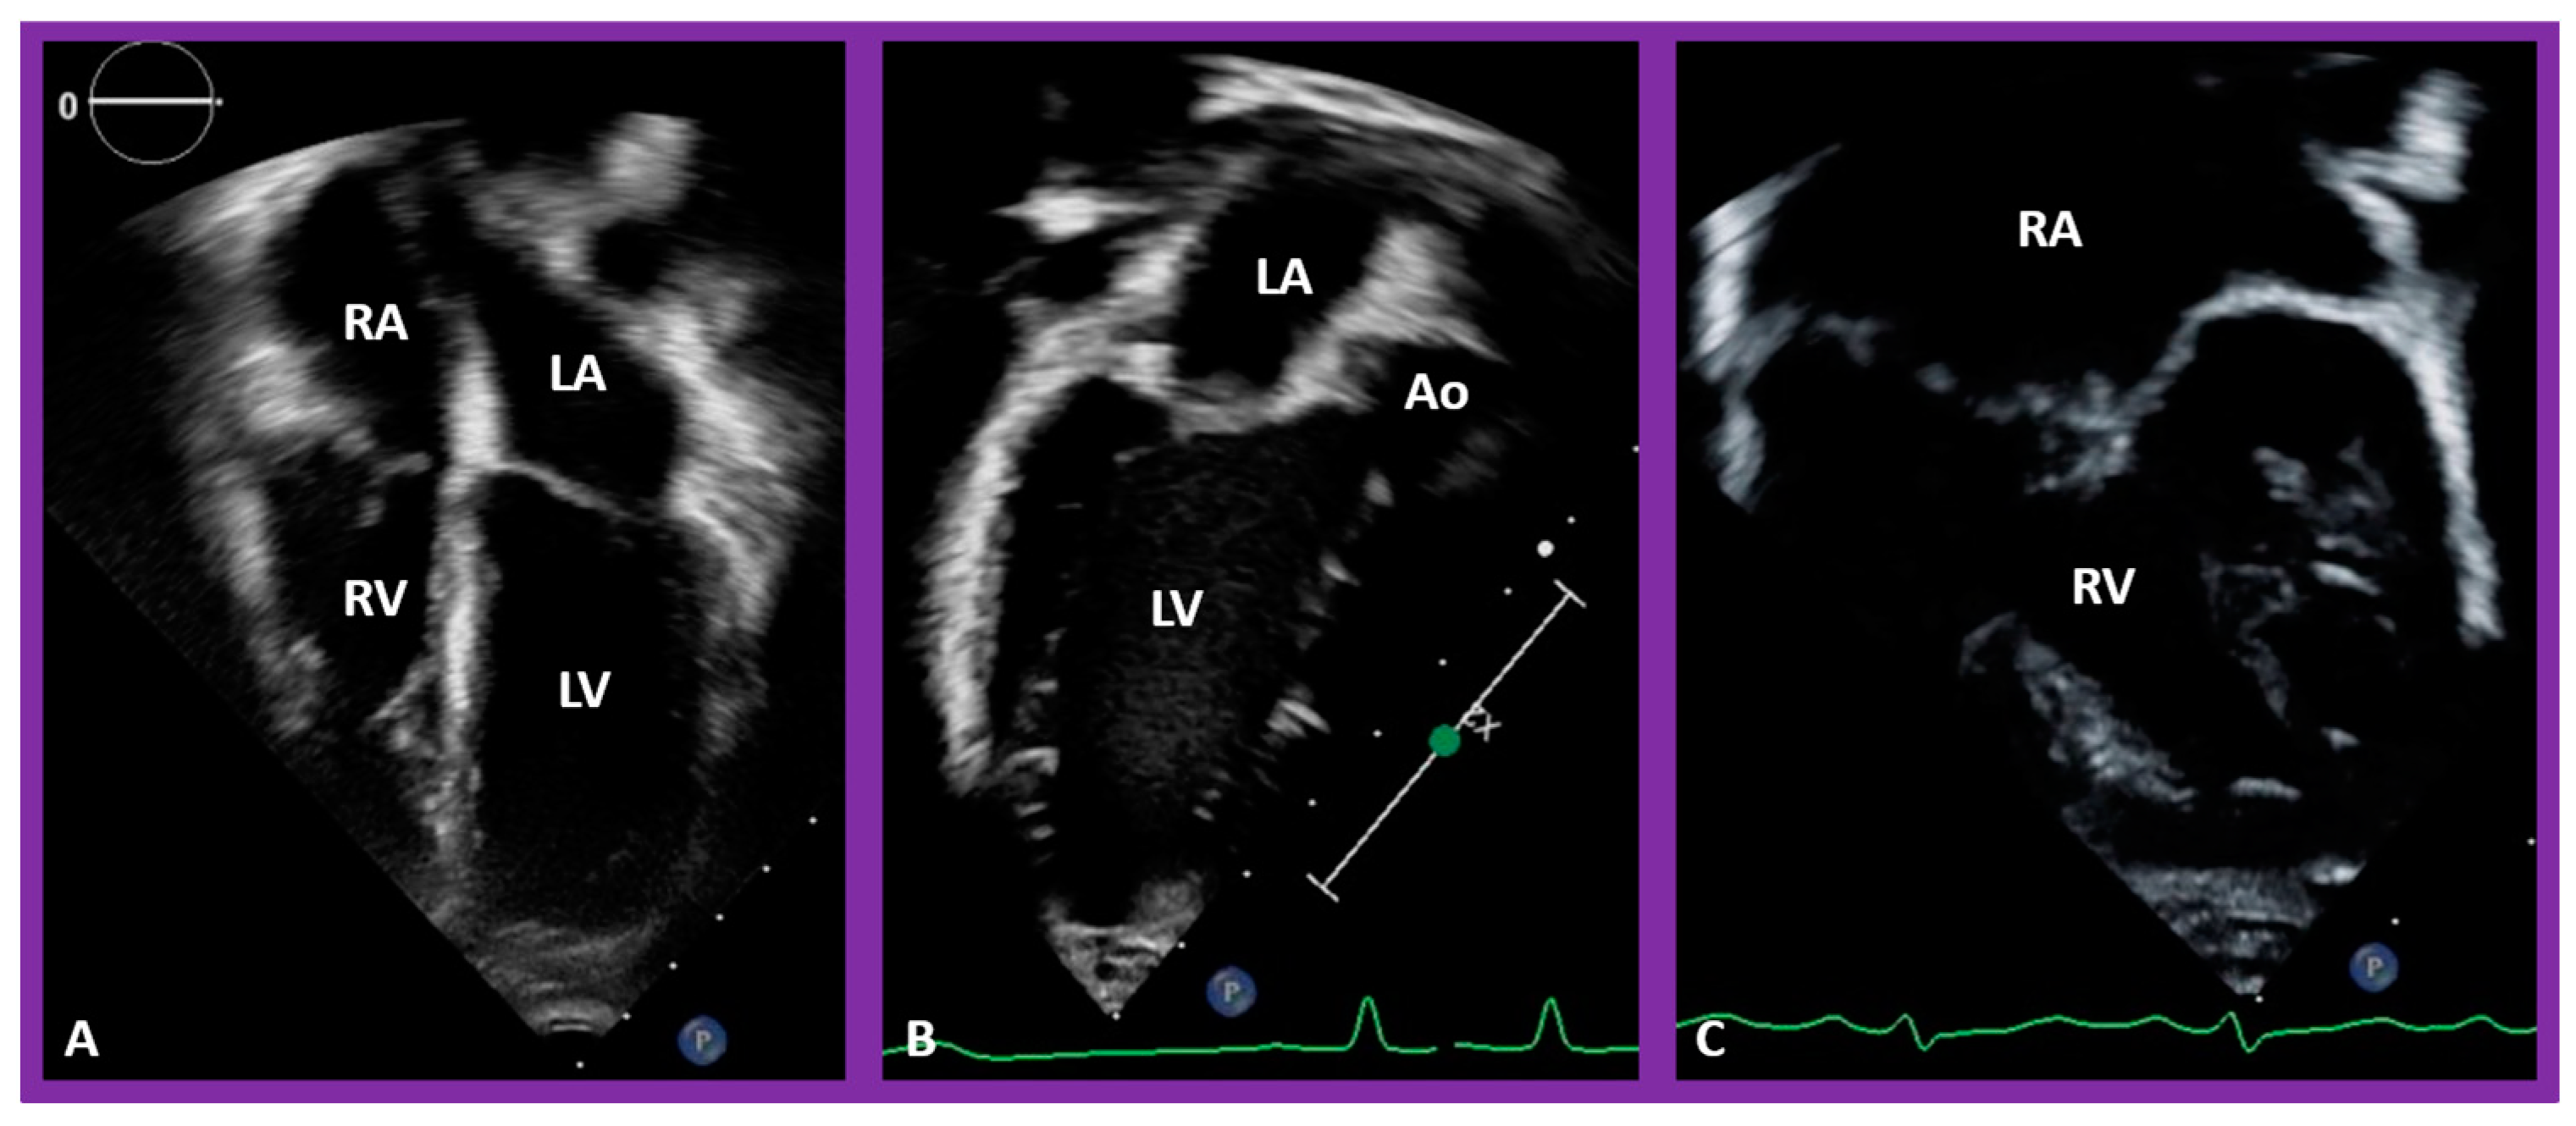
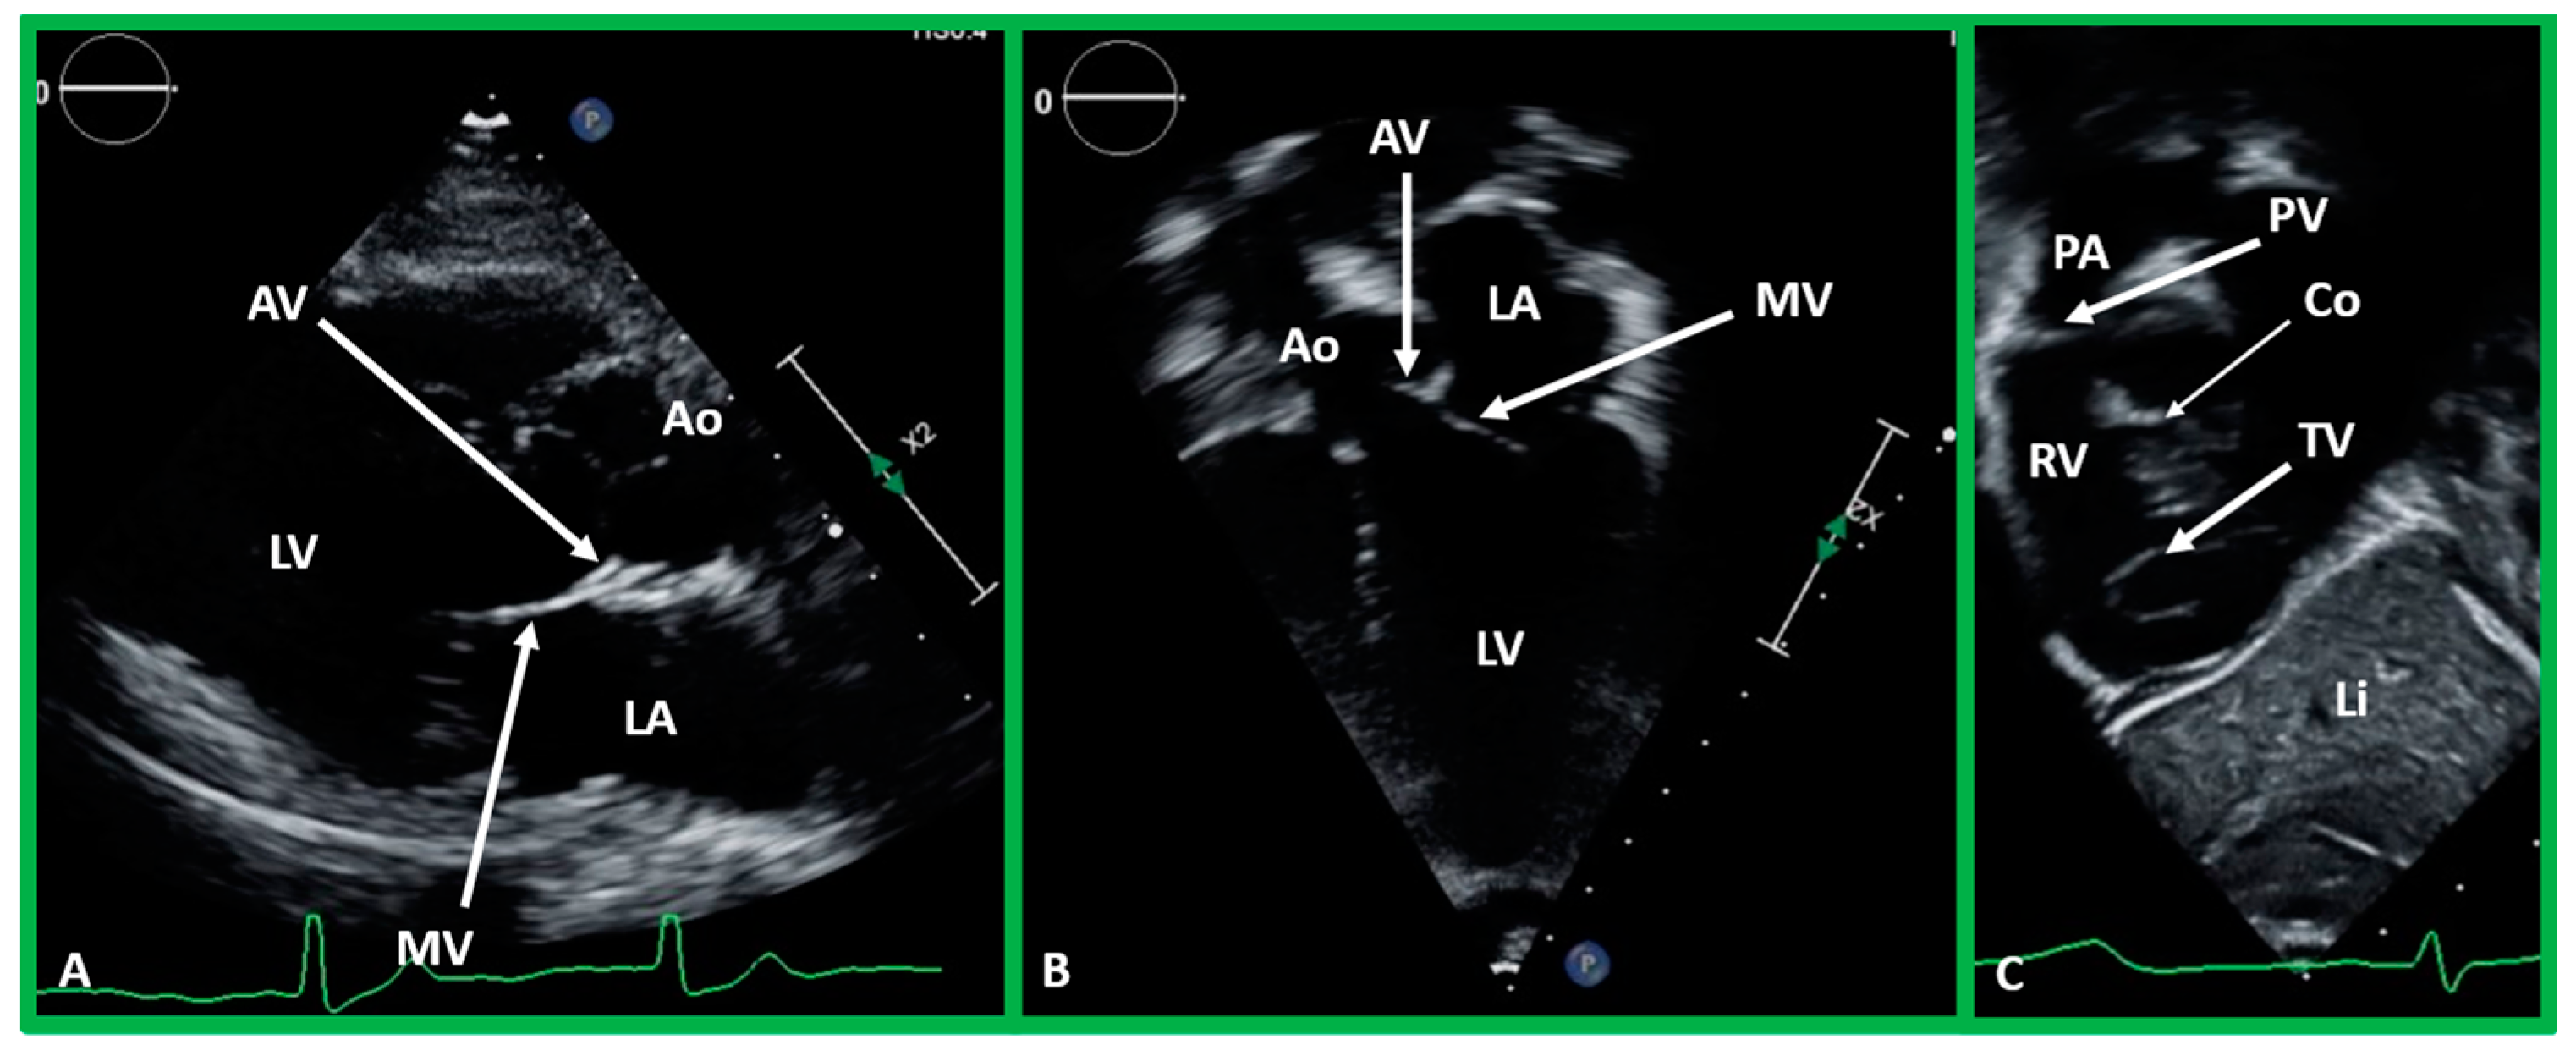
Figure 37.
(A,B). Echo images in the parasternal long axis (A) and modified apical four-chamber (B) views to demonstrate the atrioventricular valve-to-semilunar valve relationship. Note that the aortic (AV) and mitral (MV) valve leaflets are in fibrous continuity with each other, indicating that this ventricle is a morphologic left ventricle (LV). (C) Selected video frame in a subcostal view to demonstrate atrioventricular valve-to-semilunar valve relationship in a child with normally related great vessels demonstrating lack of continuity between the pulmonary (PV) and tricuspid (TV) valve leaflets due to conus (Co) separating them. Aorta (Ao), left atrium (LA), liver (Li), pulmonary artery (PA), and right ventricle (RV) are labeled.
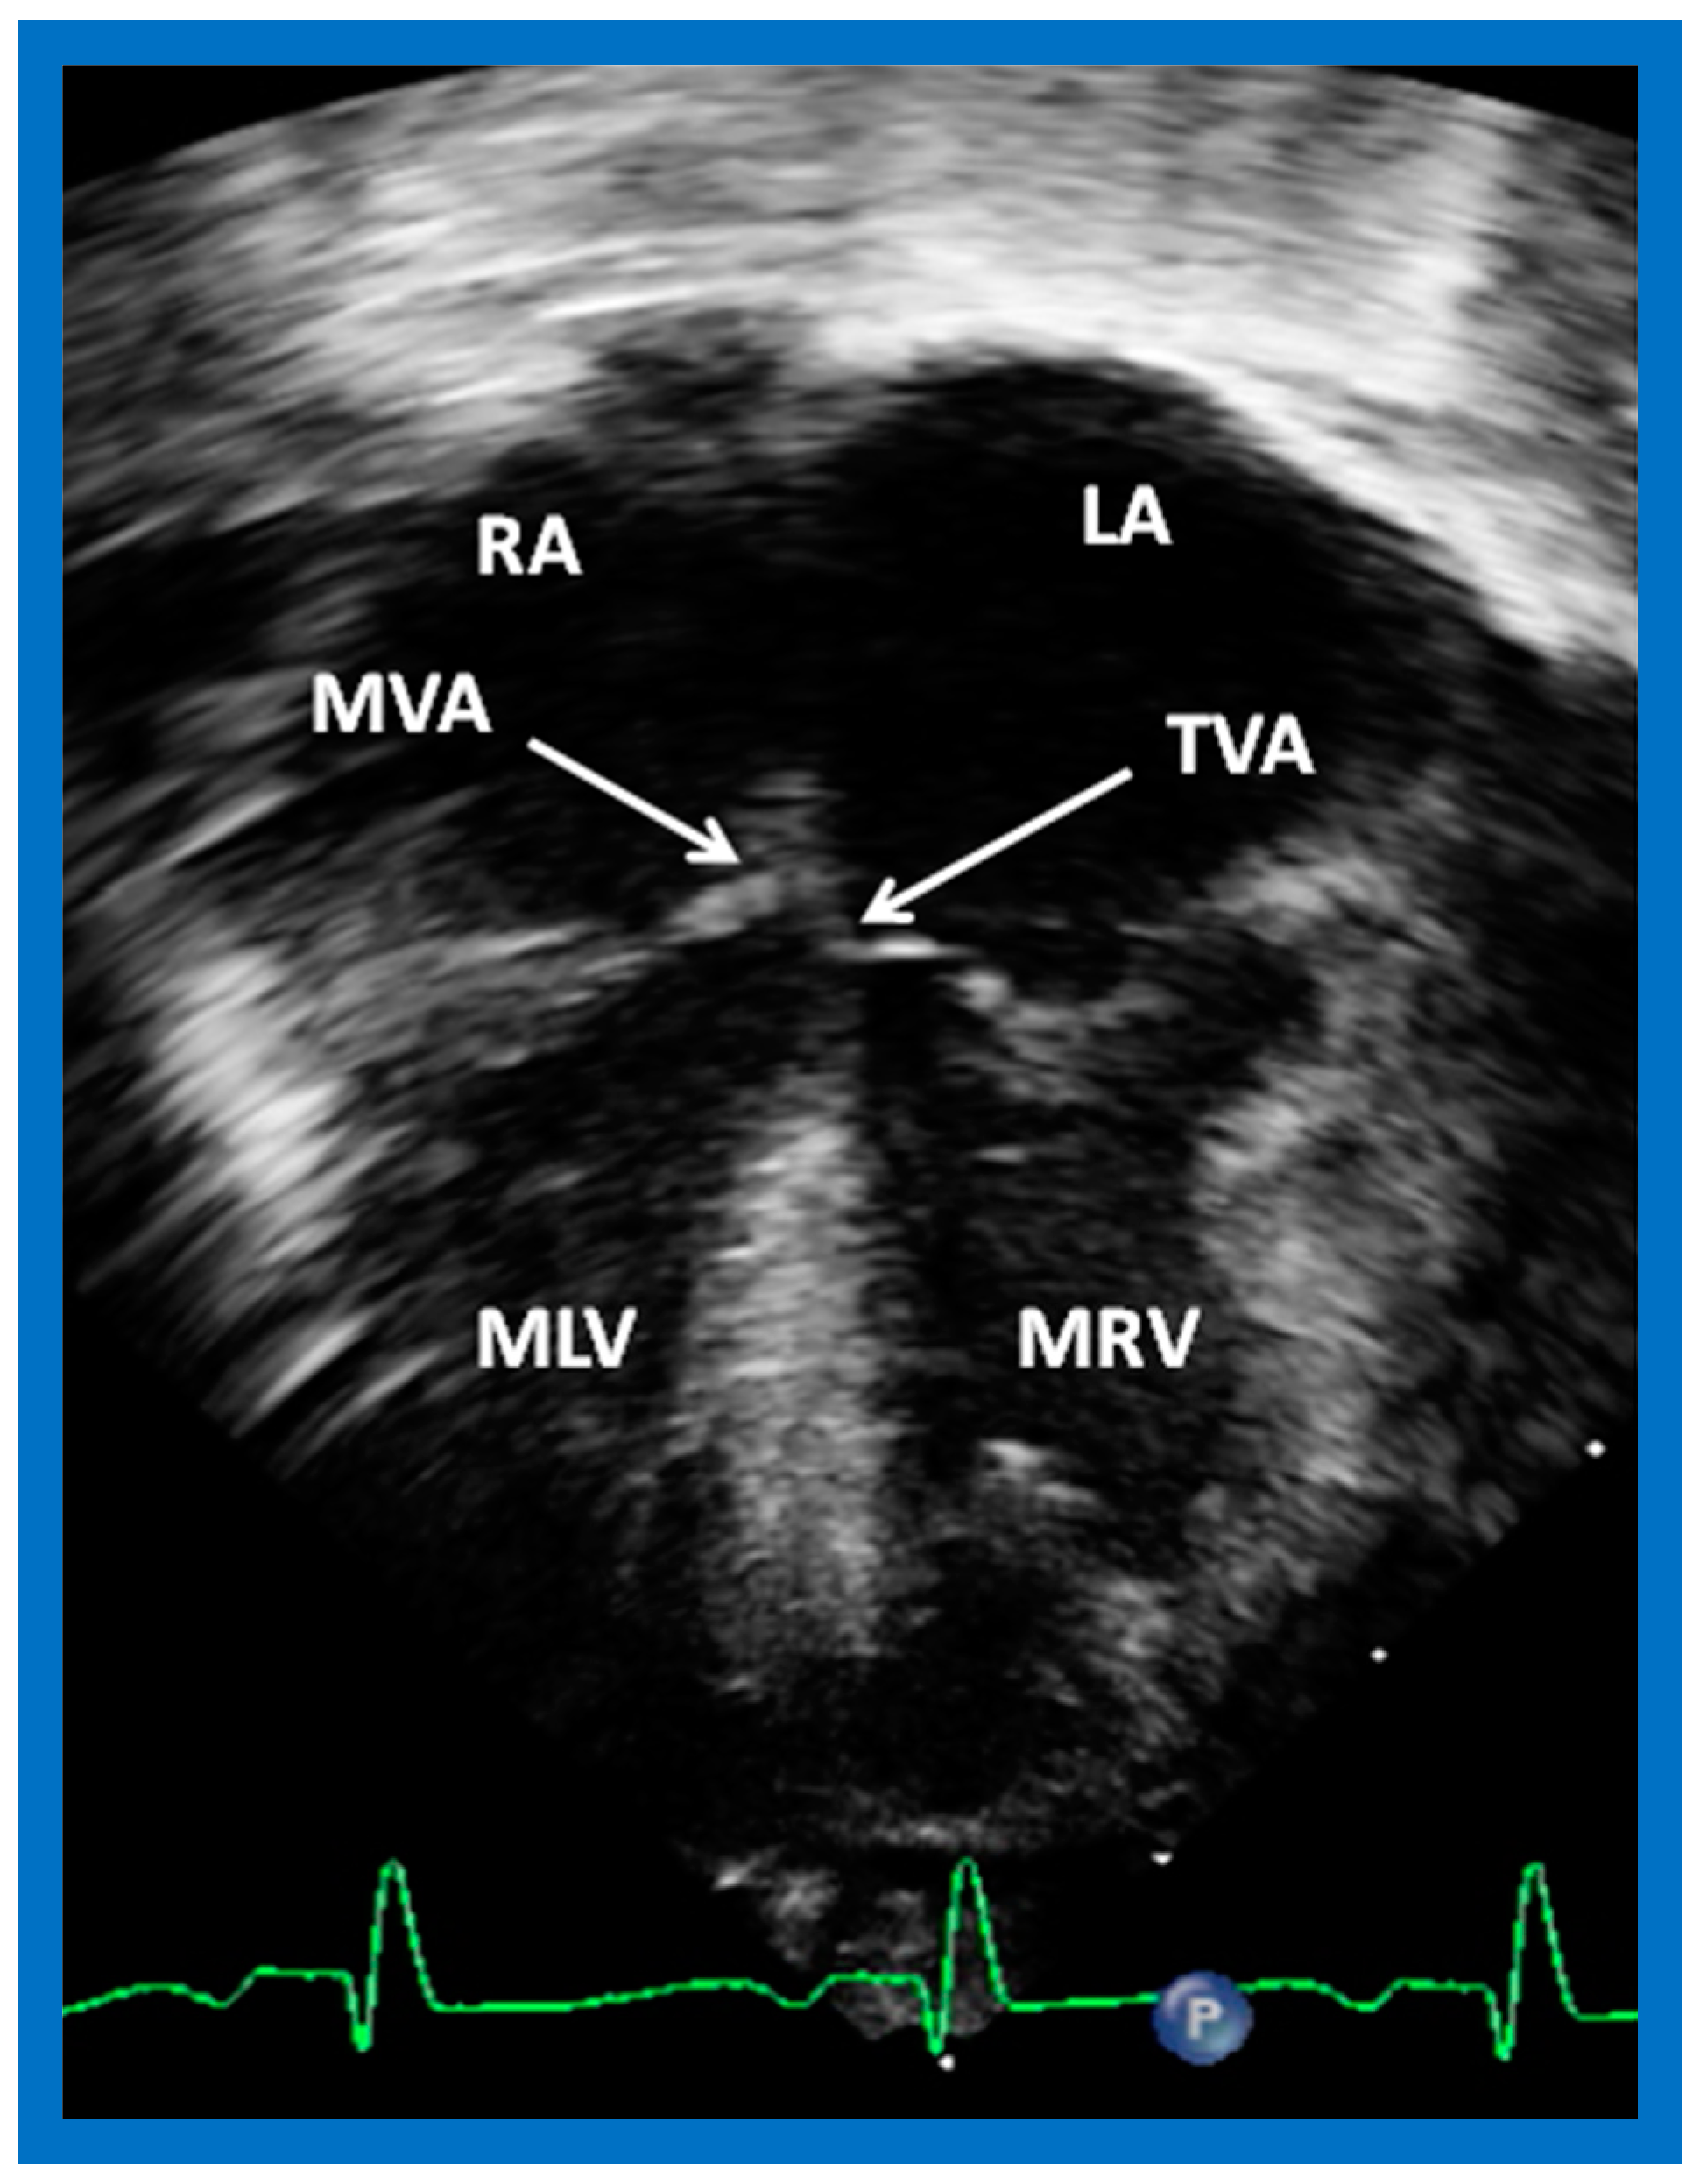
Figure 38.
(
A,
B). Echo images in apical four-chamber views of 2 children with a normal interventricular relationship. A superior level of mitral valve attachment (MVA) relative to attachment of the tricuspid valve (TVA) is seen in both children. Left atrium (LA), left ventricle (LV), right atrium (RA), and right ventricle RV are labeled. Replicated from reference [
4].
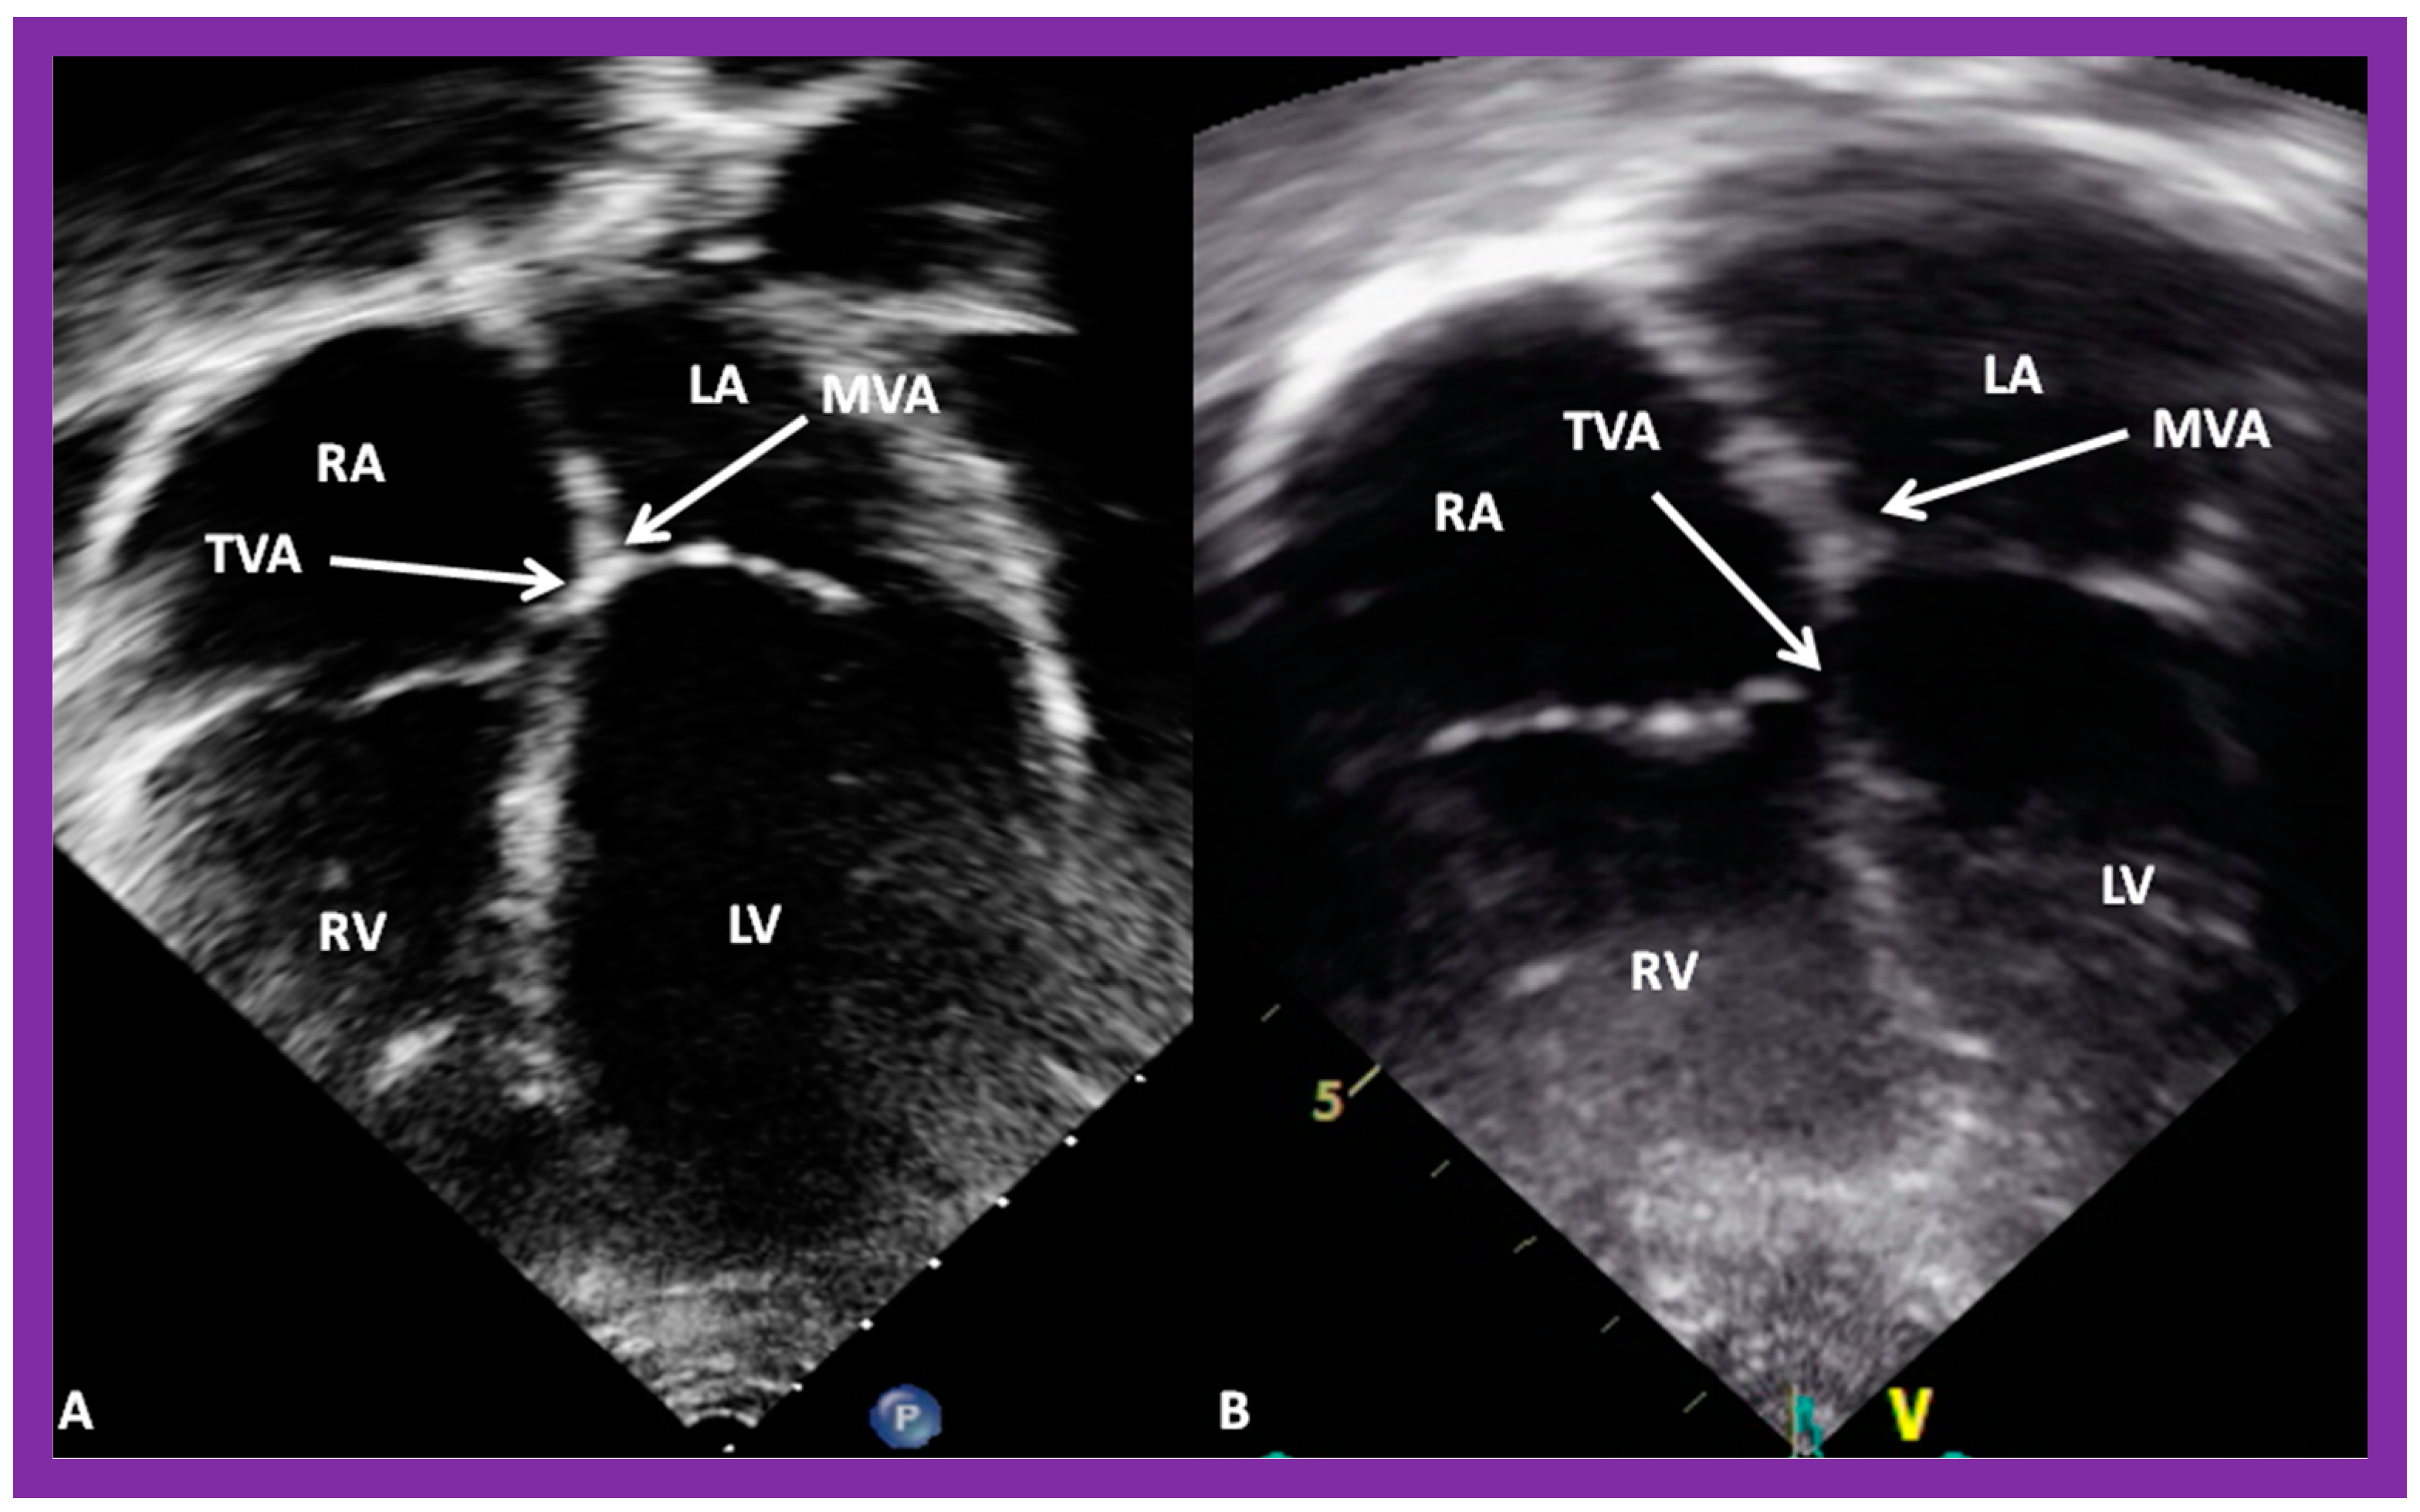
Figure 39.
Selected echo image in the apical four-chamber projection of a child with ventricular inversion. Note the superior level of mitral valve attachment (MVA) on the right side relative to the attachment of the tricuspid valve (TVA) on the left side, signifying that the ventricles are inverted. This is a reversal of what is illustrated in
Figure 38. Left atrium (LA), morphologic left ventricle (MLV), morphologic right ventricle (MRV), and right atrium (RA) are labeled. Replicated from reference [
4].
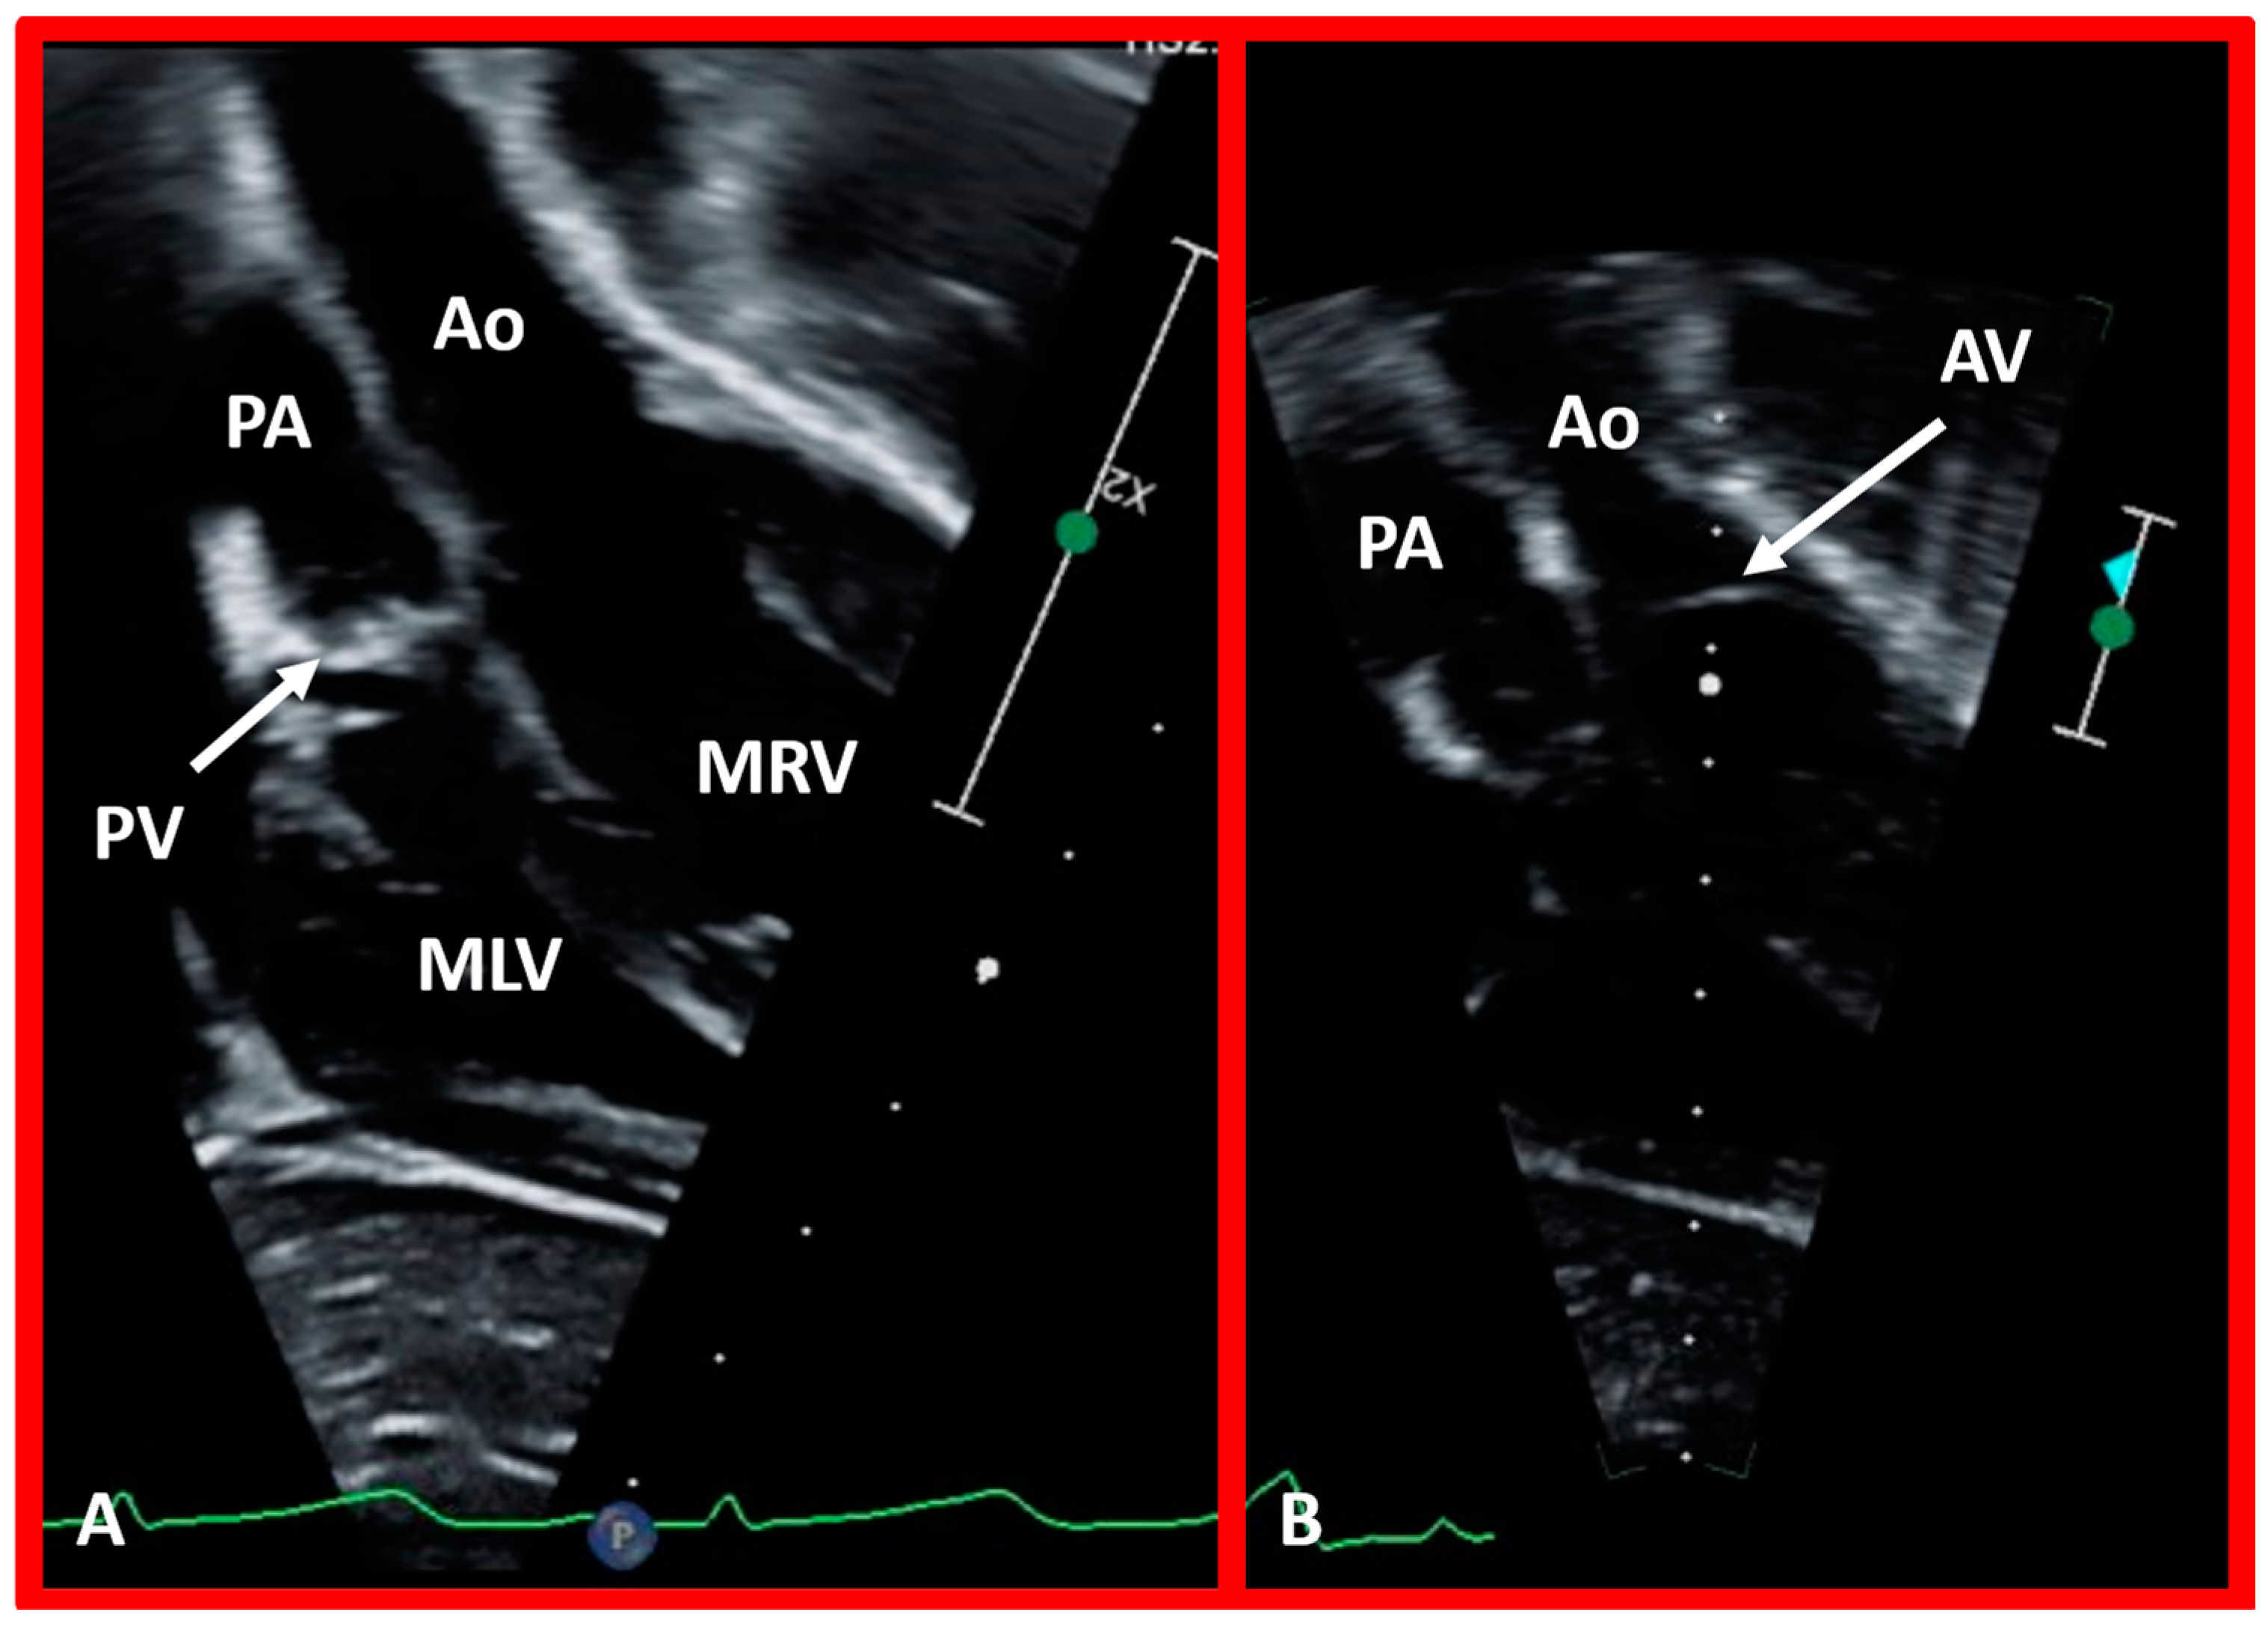
Figure 40.
Echo images in apical four-chamber projections of a child with ventricular inversion. The aortic valve (AV) and aorta (Ao) are located to the left of the pulmonary valve (PV) and pulmonary artery (PA), indicating an l-loop, and that morphologic right ventricle (MRV) is on the left, and the morphologic left ventricle (MLV) is on the right. In (A), the PV (arrow in (A)) is clearly seen, while AV is imaged in (B) (arrow in (B)).
Figure 41.
Cine images demonstrating an l-loop with the aortic valve located to the left of the pulmonary valve in a baby with corrected transposition of the great vessels. The aortic valve is also superior (
B) and anterior (in lateral view—not shown) of the pulmonary valve. (
A) Smooth-walled morphologic left ventricle (LV) is on the right side, giving origin to the pulmonary artery (PA). (
B) Left-sided, morphologic right ventricle (RV) is coarsely trabeculated and gives origin to the aorta (Ao). The angiogram in (
B) was obtained via a catheter positioned from the inferior vena cava to the right atrium, then into the left atrium through a patent foramen ovale, and then into the morphologic RV. Replicated from reference [
39].
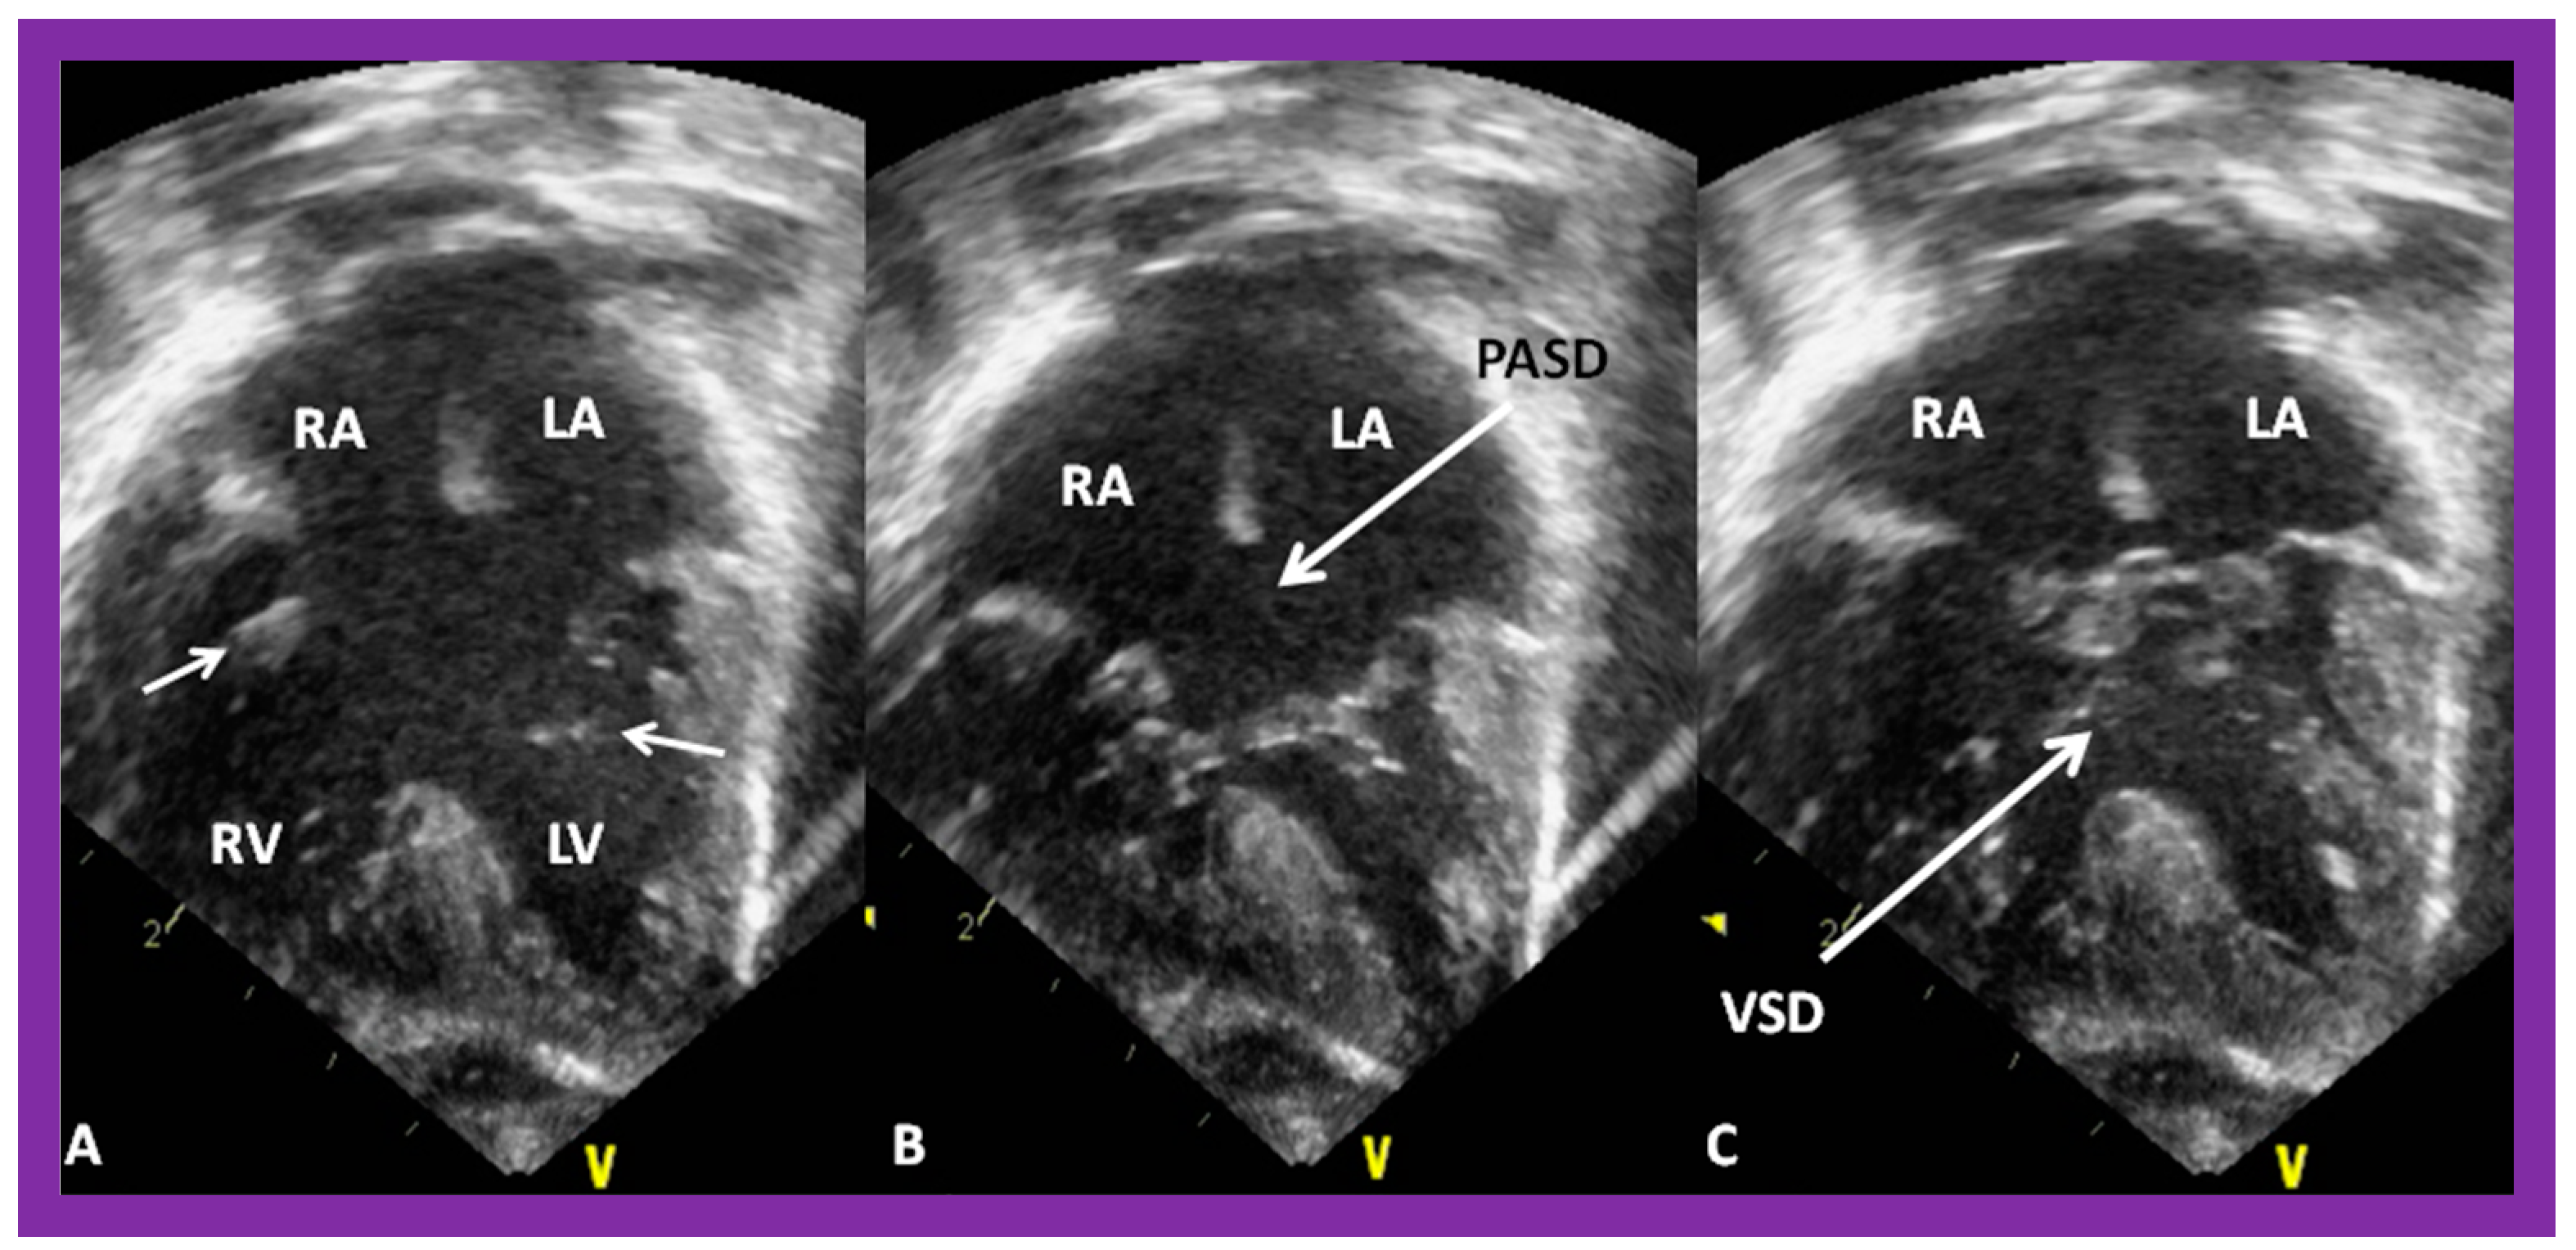
Figure 42.
Echo images in apical four-chamber projections demonstrating the connection of a common atrioventricular valve with the right (RV) and left (LV) ventricles. In (
A) (small arrows), the atrioventricular (AV) valve is open, whereas the AV valve is closed in (
B,
C) during varying phases of the cardiac cycle. Atrial septal defect of ostium primum (PASD) type of large size in (
B), as well as a large ventricular septal defect (VSD) in (
C), are illustrated. LA, left atrium; LV, left ventricle; RA, right atrium; RV, right ventricle. Replicated from reference [
41].
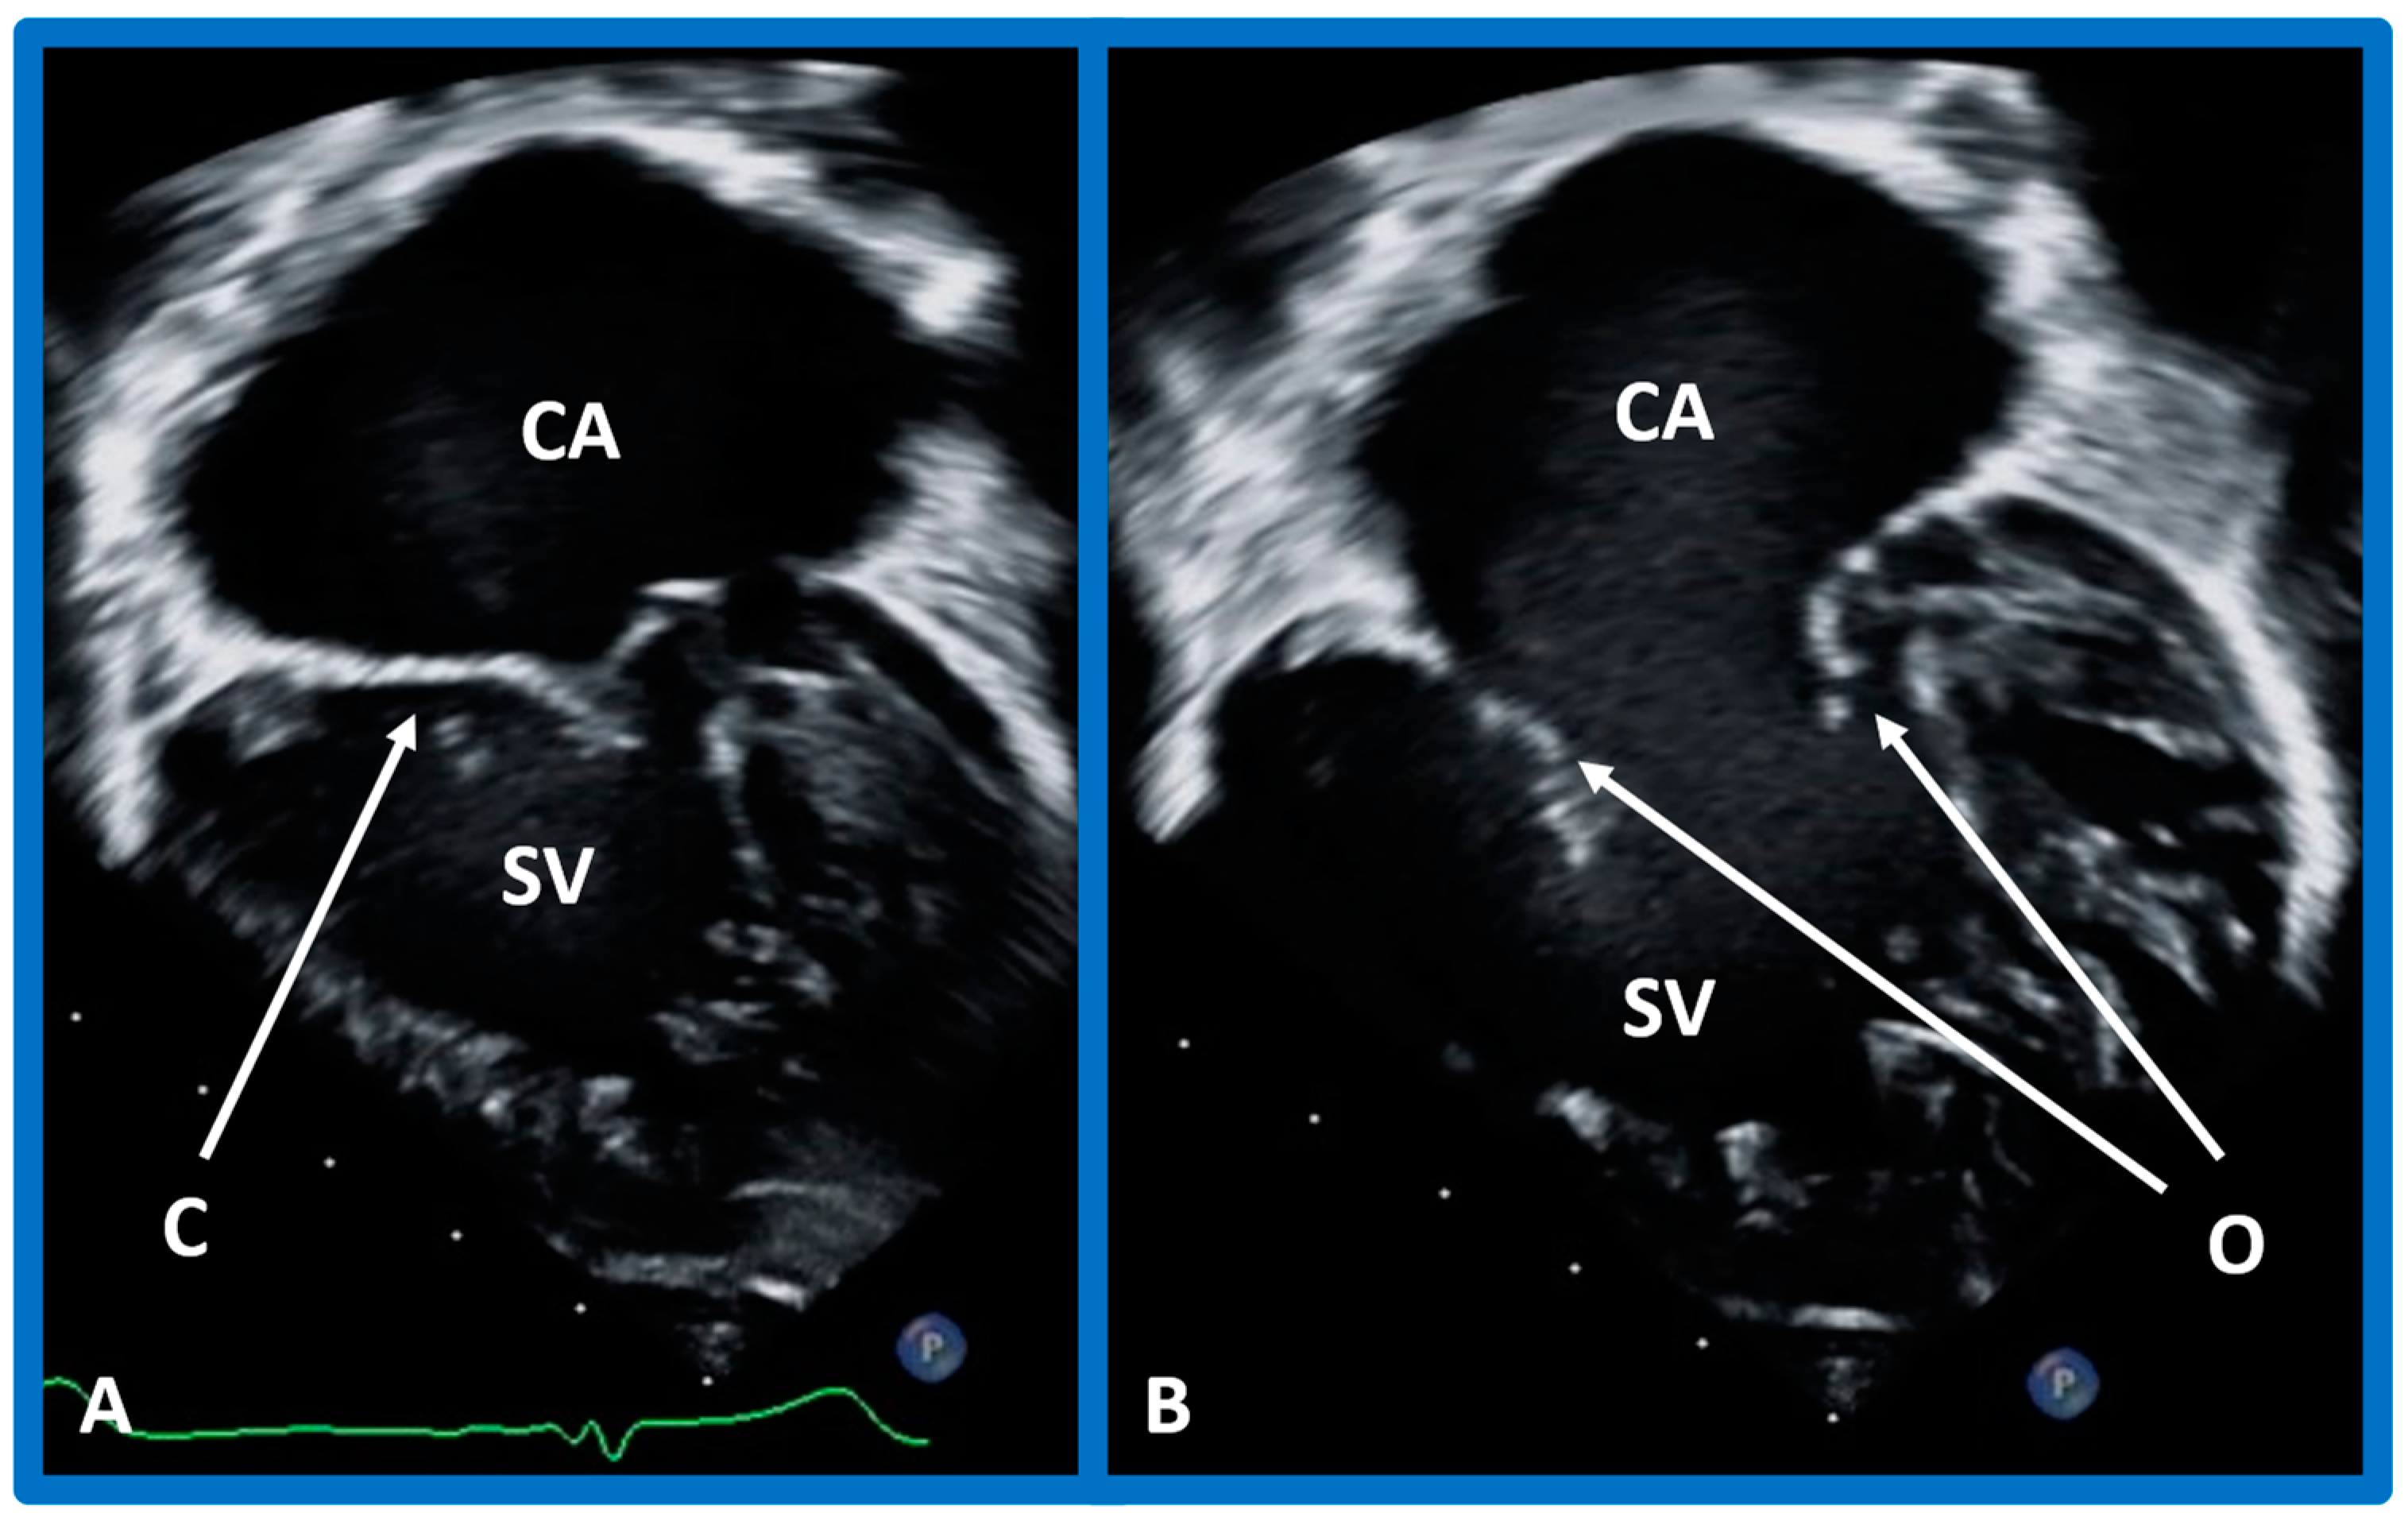
Figure 43.
Echo frames in apical four-chamber views demonstrating a connection of common atrium (CA) with single ventricle (SV) by a one (common) atrioventricular valve. In (A), the common atrioventricular valve is closed (C), whereas in (B), it is open (O). Heavy trabeculation is seen in the SV.
Figure 43.
Echo frames in apical four-chamber views demonstrating a connection of common atrium (CA) with single ventricle (SV) by a one (common) atrioventricular valve. In (A), the common atrioventricular valve is closed (C), whereas in (B), it is open (O). Heavy trabeculation is seen in the SV.
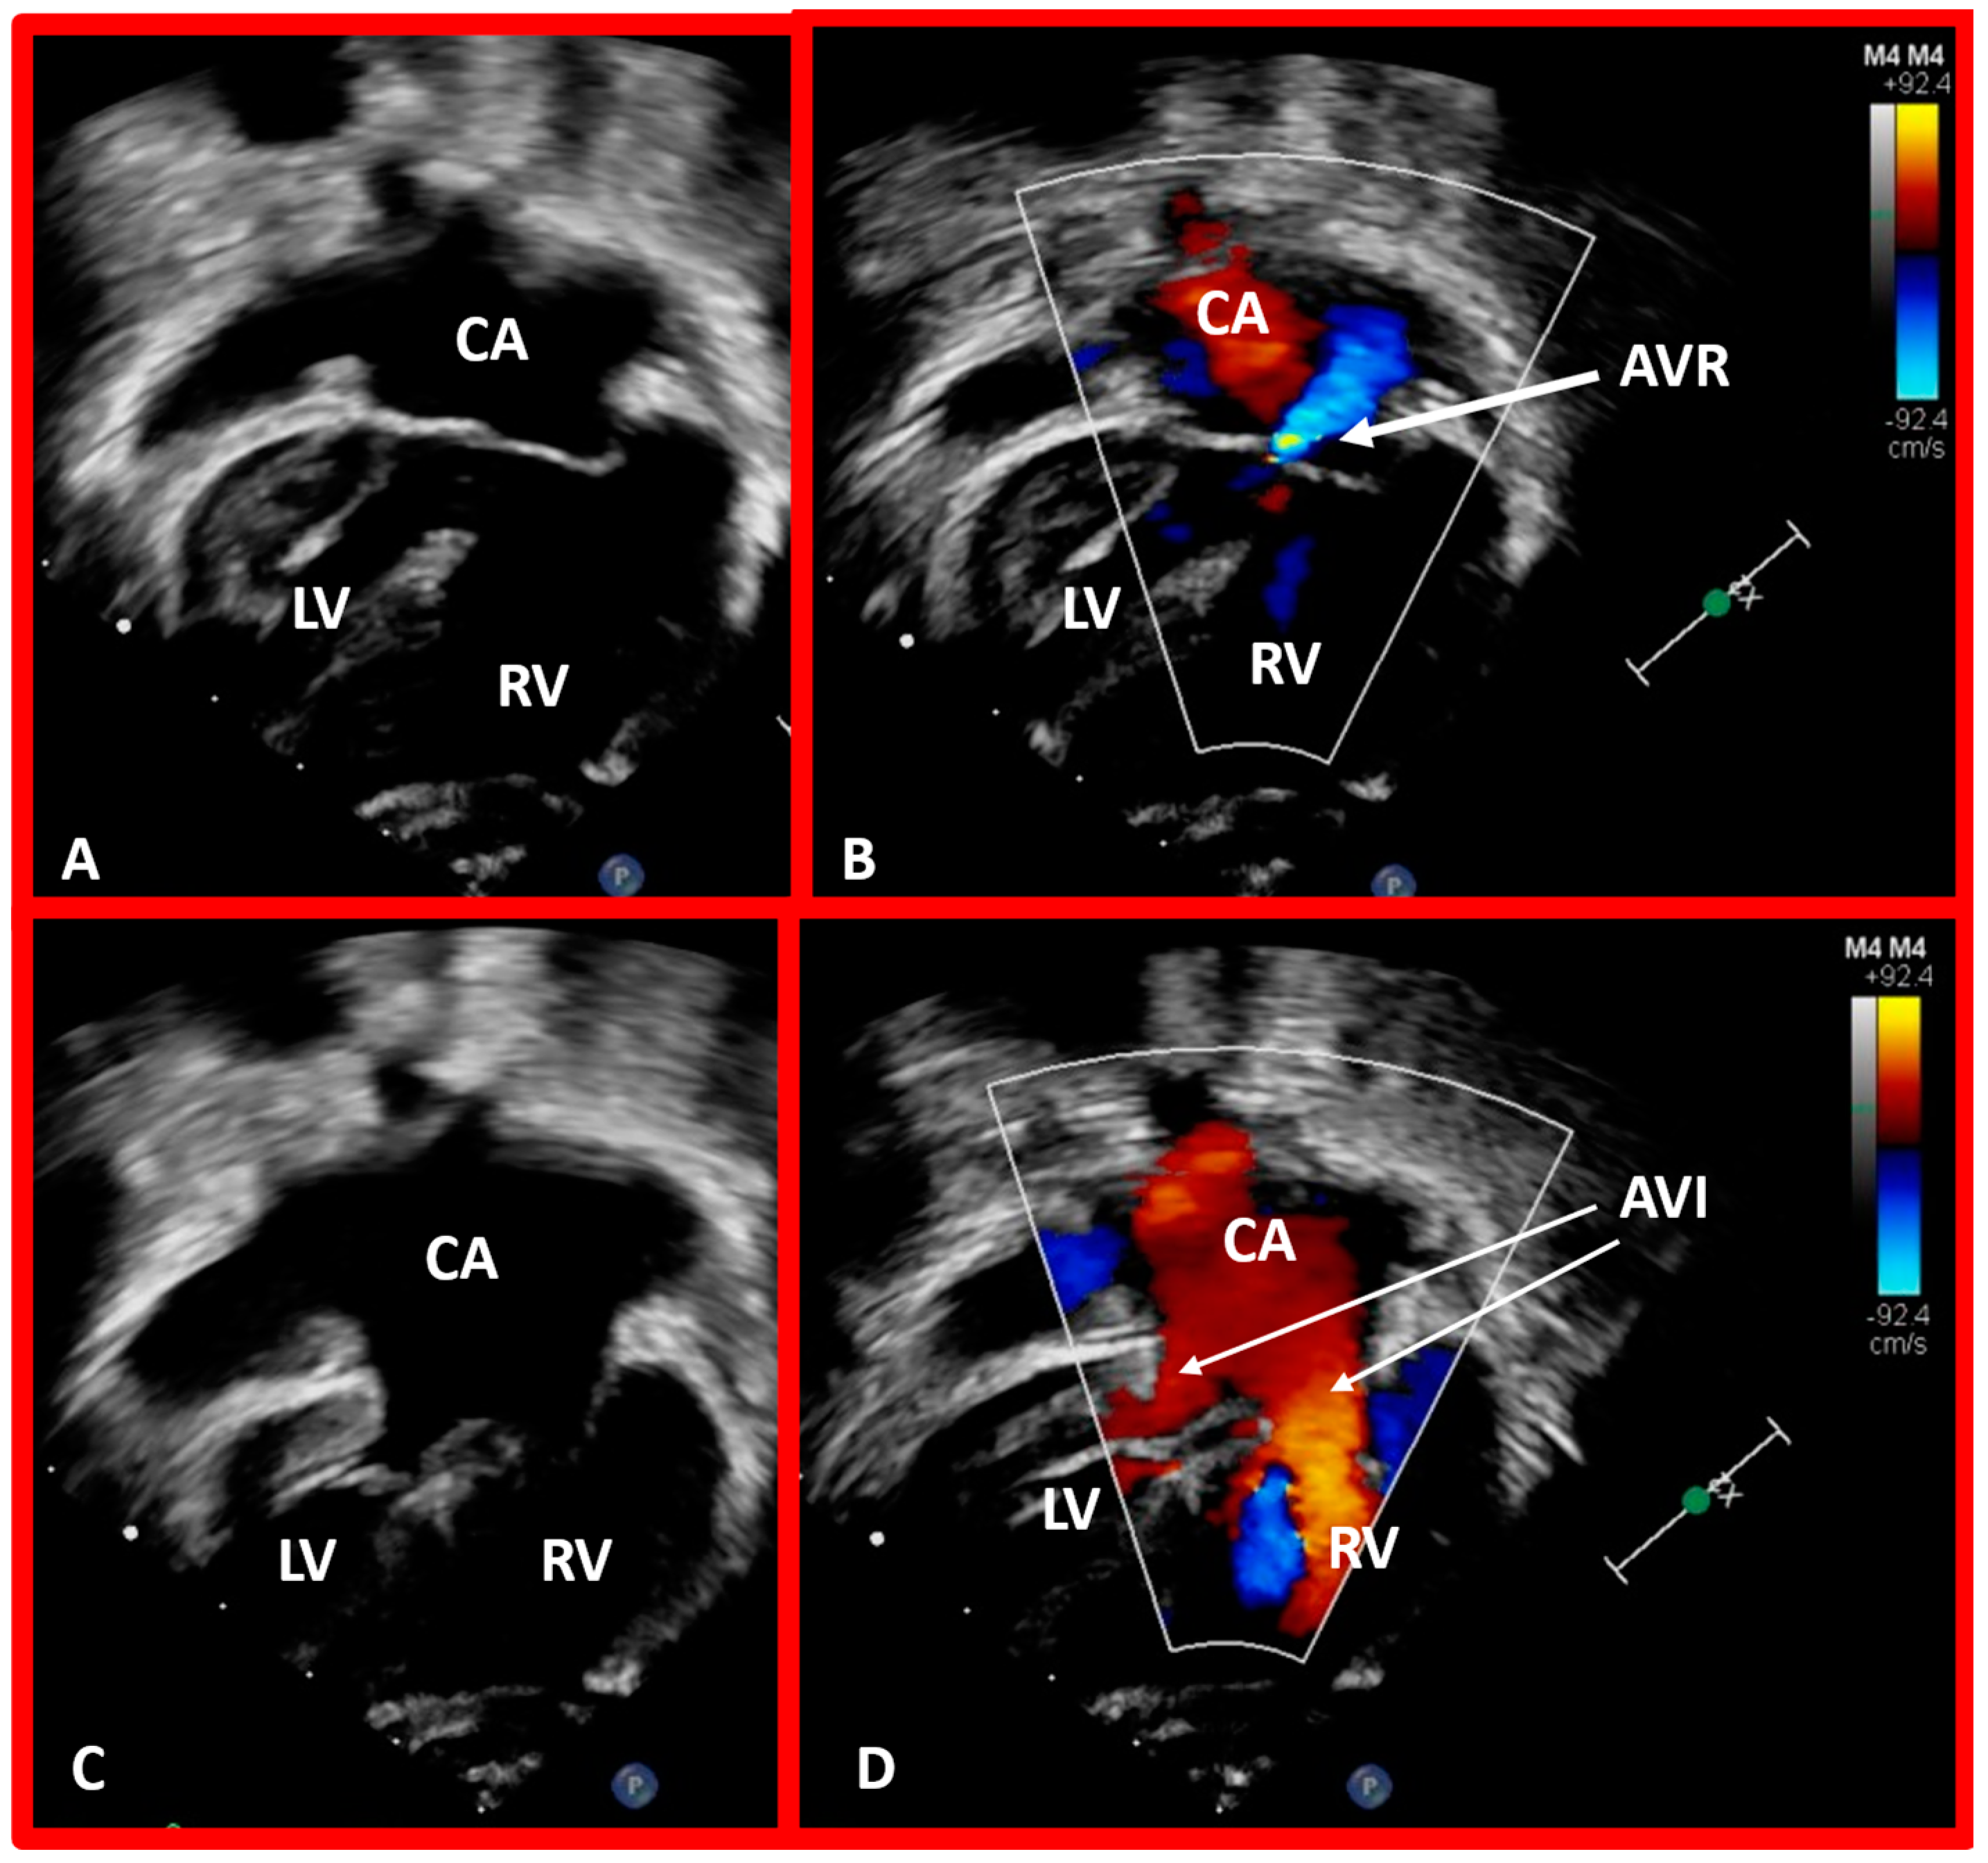
Figure 44.
Selected echo frames in apical four-chamber views of a patient with dextrocardia and ventricular inversion demonstrating the connection of the common atrium (CA) with both ventricles via a common atrioventricular valve. The common atrioventricular valve is completely closed in (A,B), whereas it is open in (C,D). Atrioventricular valve regurgitation (AVR) is shown in (B) with a thick arrow. Atrioventricular inflow (AVI) is marked with thin arrows in (D). Left ventricle (LV) and right ventricle (RV) are labeled.
Figure 45.
(A) Echo frames in apical four-chamber view of a patient with mitral atresia demonstrating atretic mitral valve (AMV), pointed out by an arrow in (A). A large right ventricle (RV), a small left atrium (LA), and a small left ventricle (LV) are also visualized. (B) Echo frames in apical four-chamber view of a patient with tricuspid atresia, demonstrating atretic tricuspid valve (ATV) shown by the thick arrow in (B). Dilated LV, a small RV, and moderate-sized ventricular septal defect (VSD; thin arrow in (B)) are also seen. Mitral valve (MV) and right atrium (RA) are labeled.
Figure 46.
Echo images in subcostal long-axis projections of the right (RV) (
A) and left (LV) (
B) ventricles illustrating the position of the pulmonary valve (PV). The PV is located higher and anterior to the aortic valve (AV). The AV is located on the right side of the PV in straight posteroanterior view (not shown in this illustration). As expected, the LV is seen posteriorly while the RV is anterior. Aorta (Ao) and pulmonary artery (PA) are labeled. Replicated from reference [
41].
Figure 47.
Echo images in parasternal long (
A) and short (
B) axis projections of a baby with transposition of the great vessels illustrating anterior (
A,
B) and right-ward (
B) position of the aortic valve and aorta (Ao) relative to the position of the pulmonary valve and pulmonary artery (PA). These images also demonstrate that the PA and Ao are in parallel position (
A). Left atrium (LA), left ventricle (LV), right atrium (RA), and right ventricle (RV) are labeled. Replicated from reference [
42].
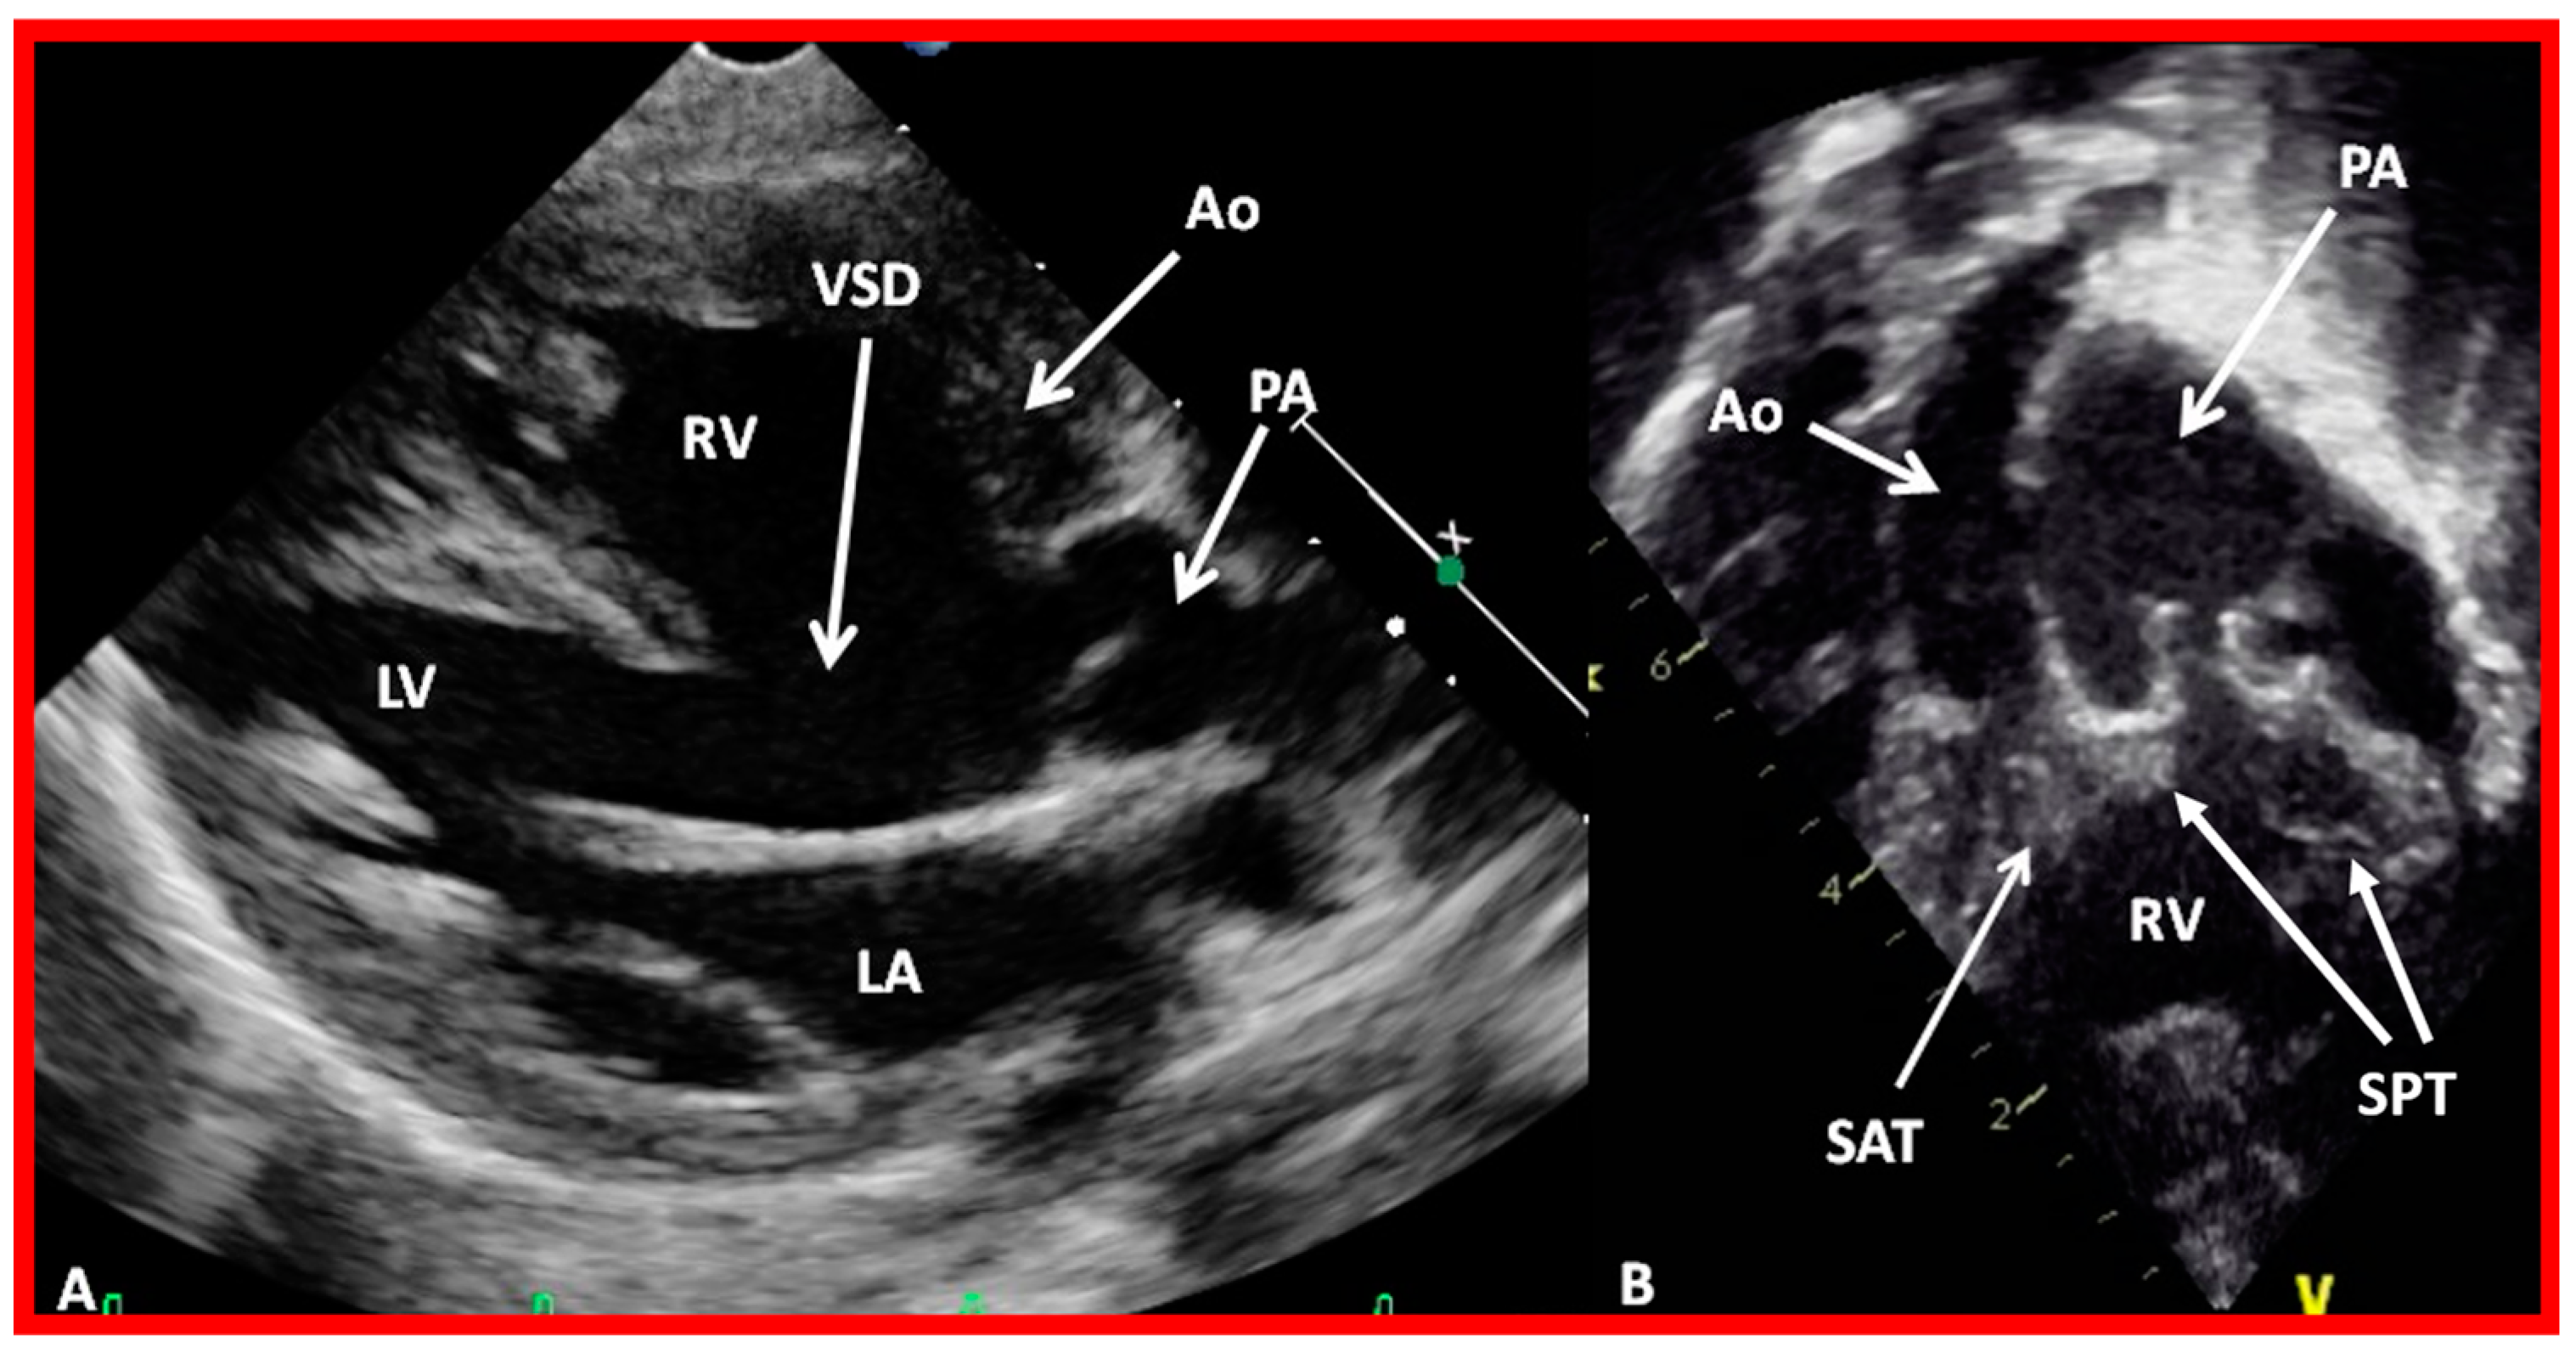
Figure 48.
Echo frames from the parasternal long axis (
A) and subcostal (
B) views illustrating that both the aorta (Ao) and the pulmonary artery (PA) arise from the right ventricle (RV), i.e., double-outlet right ventricle. Note that the great vessels are normally related to each other. A ventricular septal defect (VSD) (vertical arrow) is also seen. The conal tissue (CT) is shown by thin arrows in (
B). The vessel marked PA was traced further and demonstrated to subdivide into right and left pulmonary arteries. Left atrium (LA) and left ventricle (LV) are labeled. Modified from reference [
43].
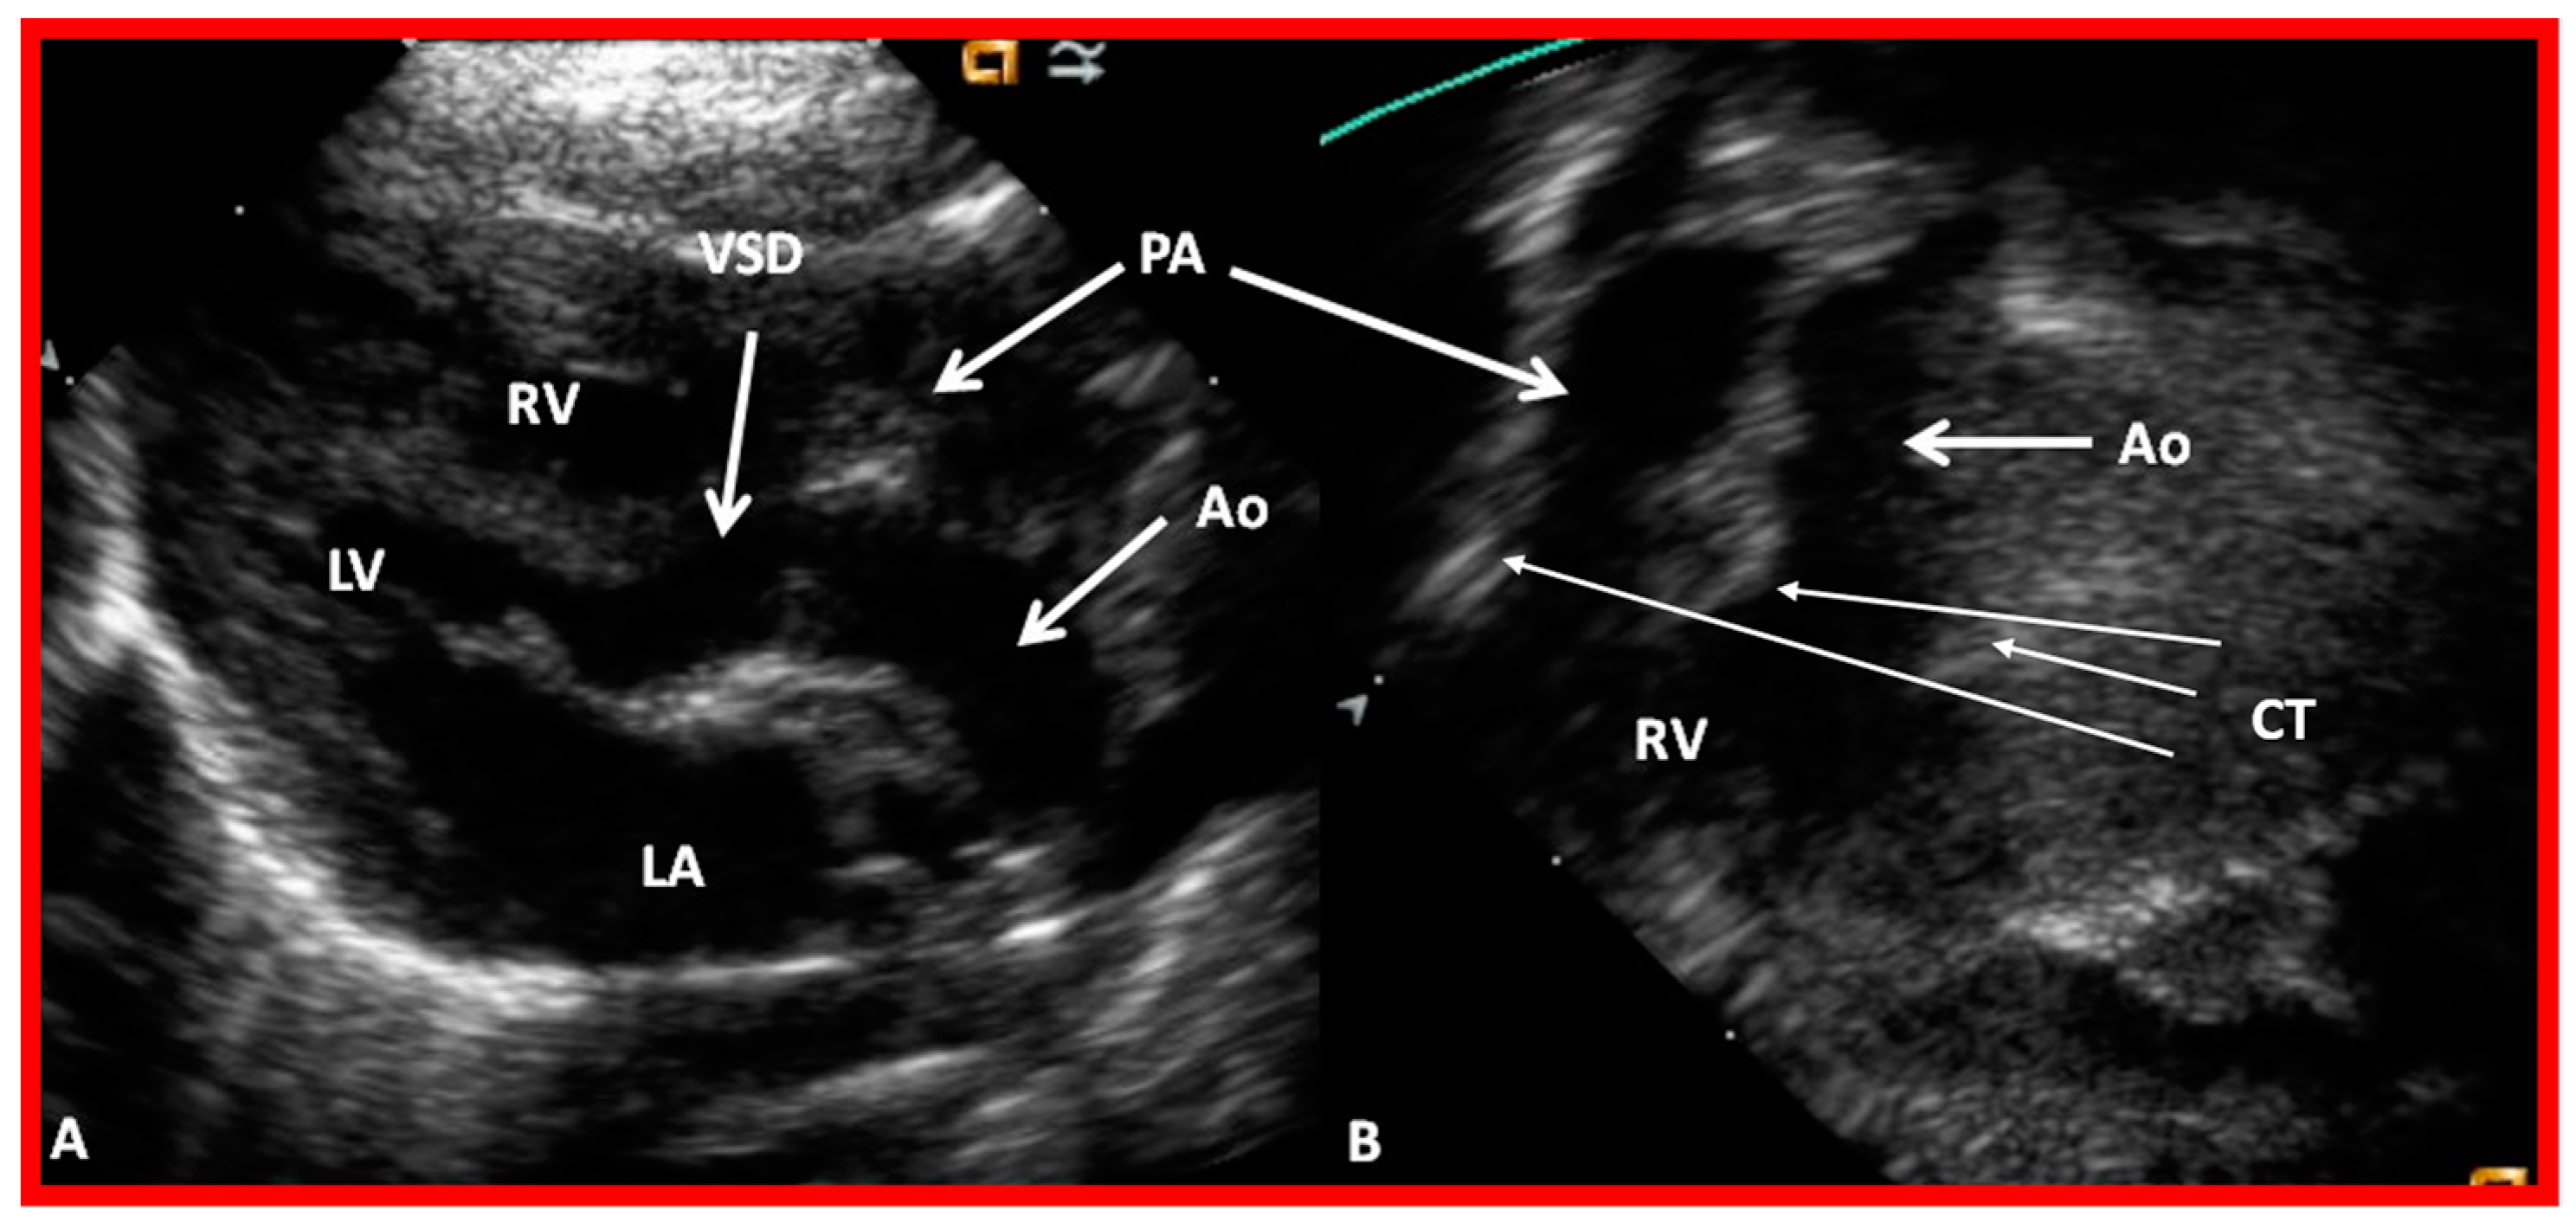
Figure 49.
Echo images from the parasternal long axis (
A) and subcostal (
B) projections of a child with Taussig-Bing type of double-outlet right ventricle (with transposition of great vessels) illustrating that both the pulmonary artery (PA) and the aorta (Ao) arise from the right ventricle (RV). A large ventricular septal defect (VSD) and subaortic (SAT) and subpulmonary (SPT) tissues are also shown. The vessel marked PA was further traced and was demonstrated to divide into right and left PAs. Left atrium (LA) and left ventricle (LV) are labeled. Modified from reference [
43].
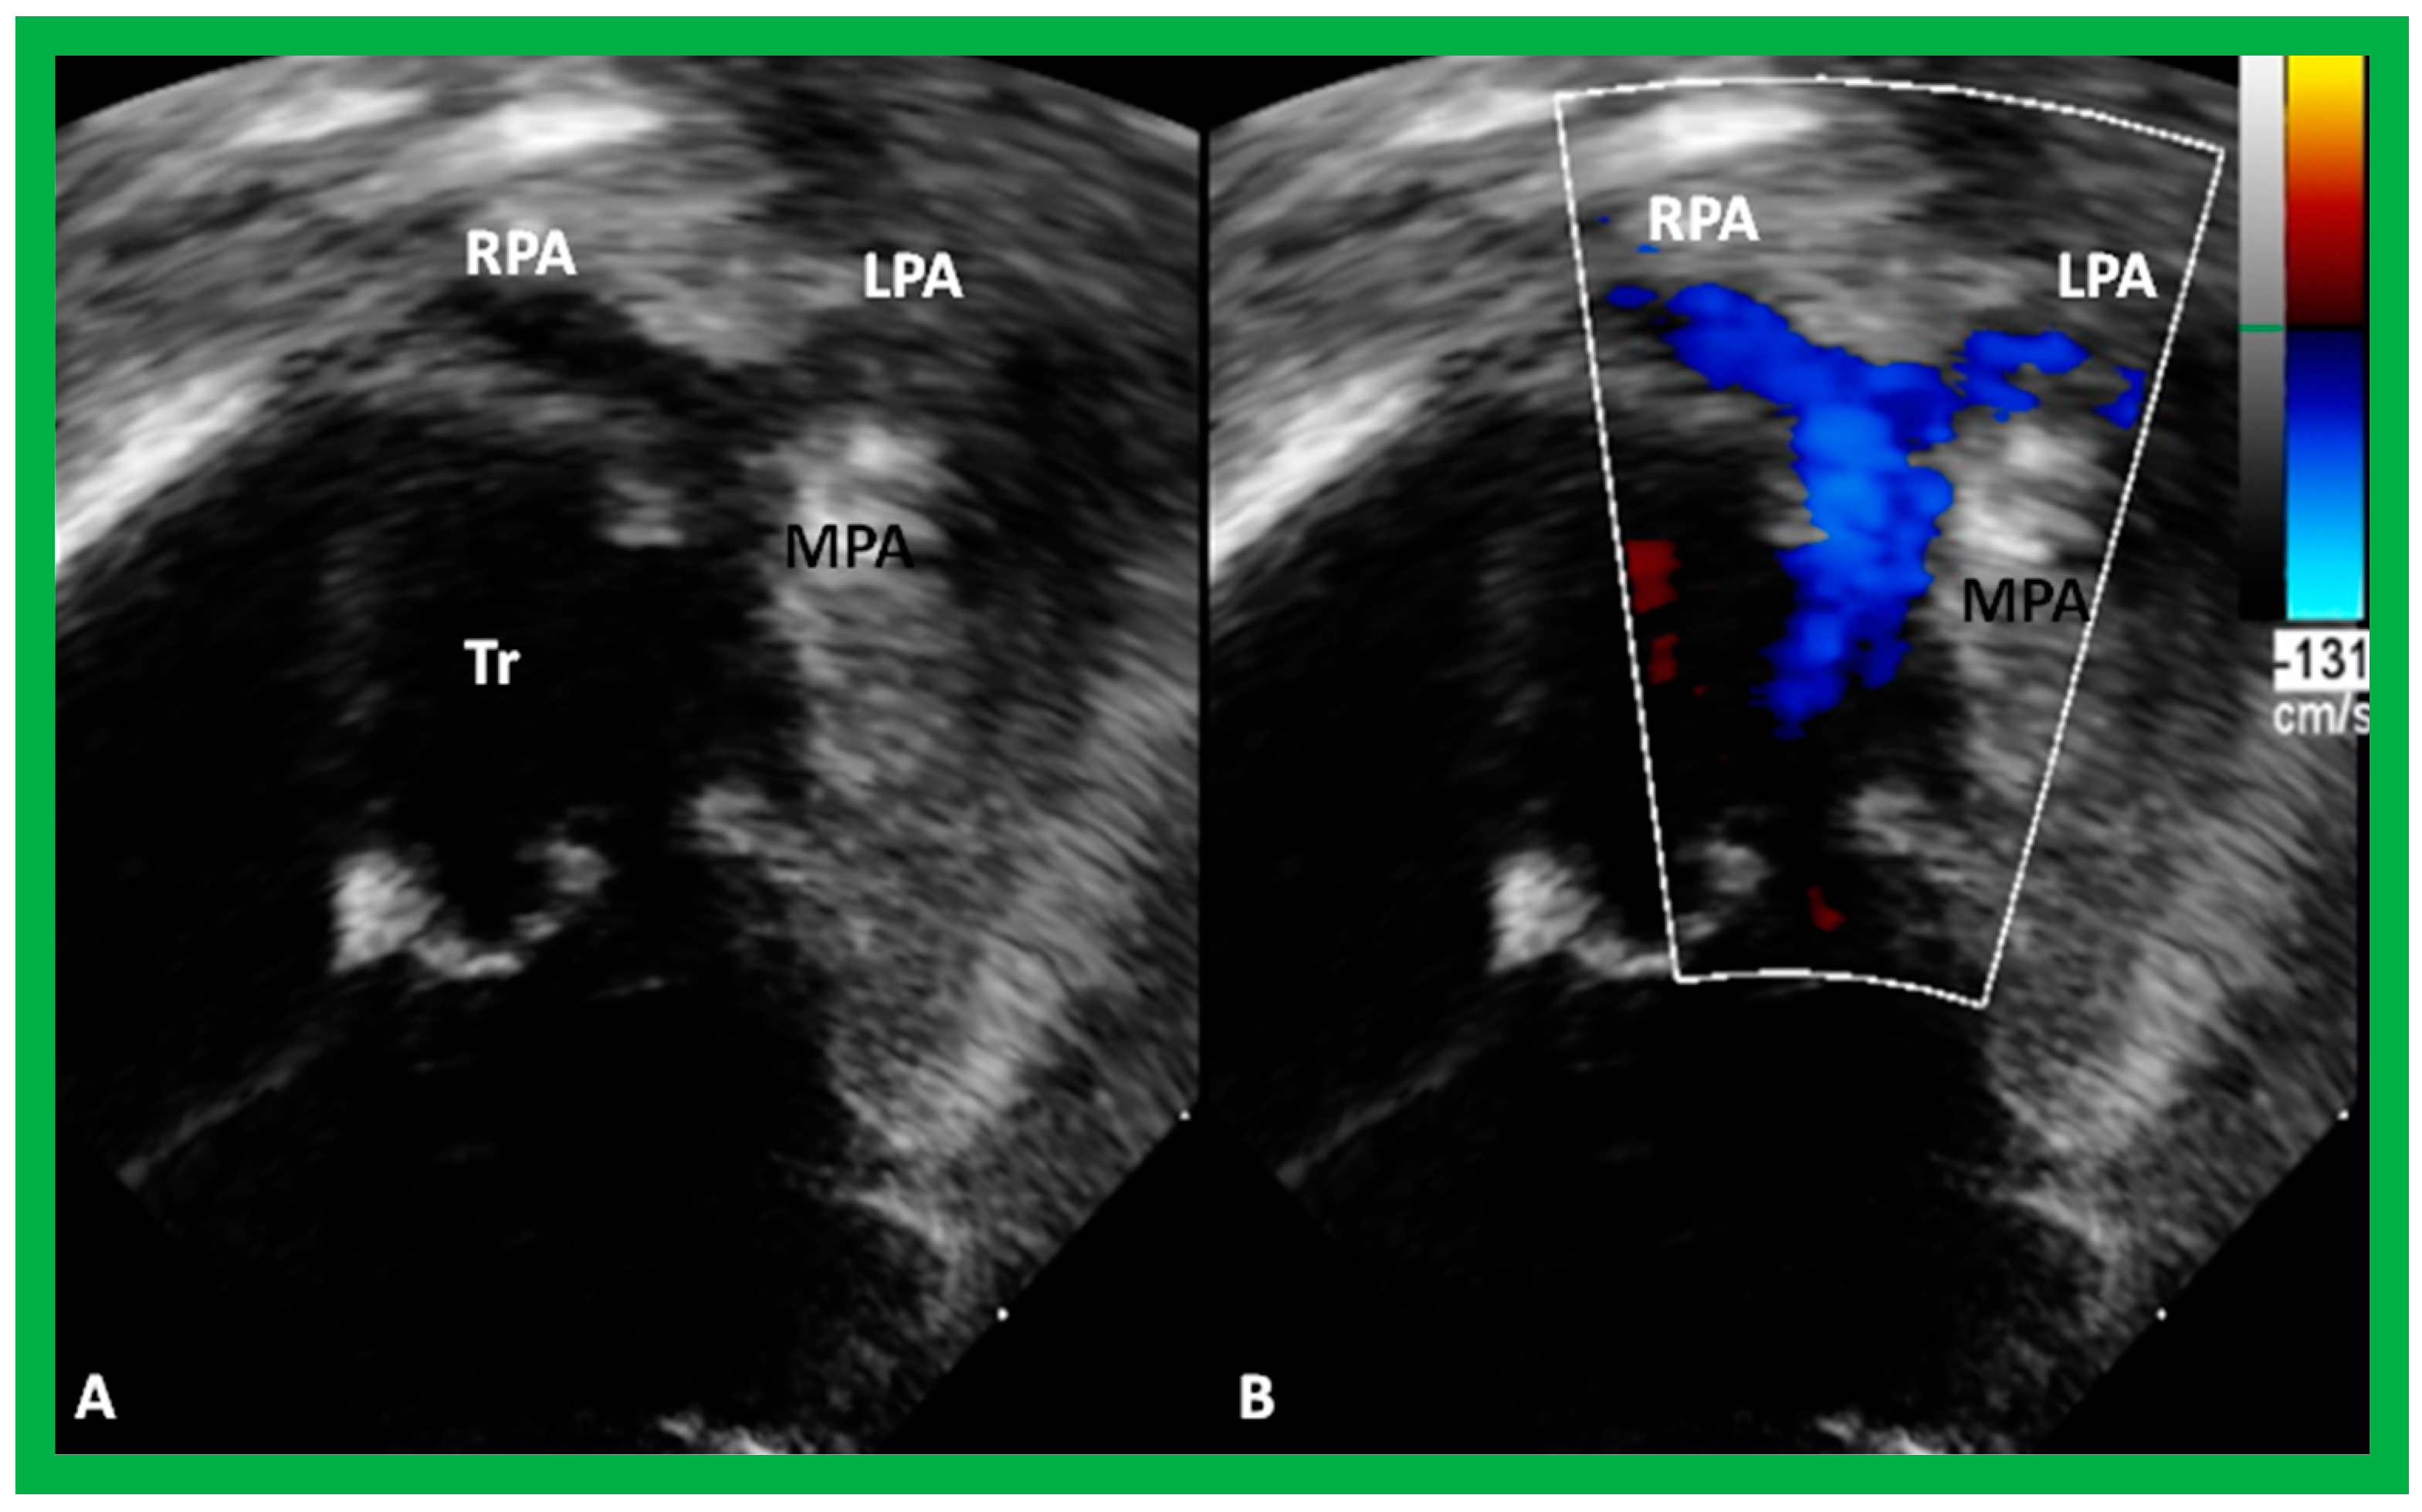
Figure 50.
Selected echo frames from modified apical four-chamber views demonstrating the origin of one great vessel, truncus arteriosus (Tr), from the heart. Two dimensional (
A) and color flow (
B) frames demonstrating the origin of the main pulmonary artery (MPA) from the left of the Tr bifurcating into the right (RPA) and left (LPA) pulmonary arteries are shown. Replicated from reference [
44].
Figure 51.
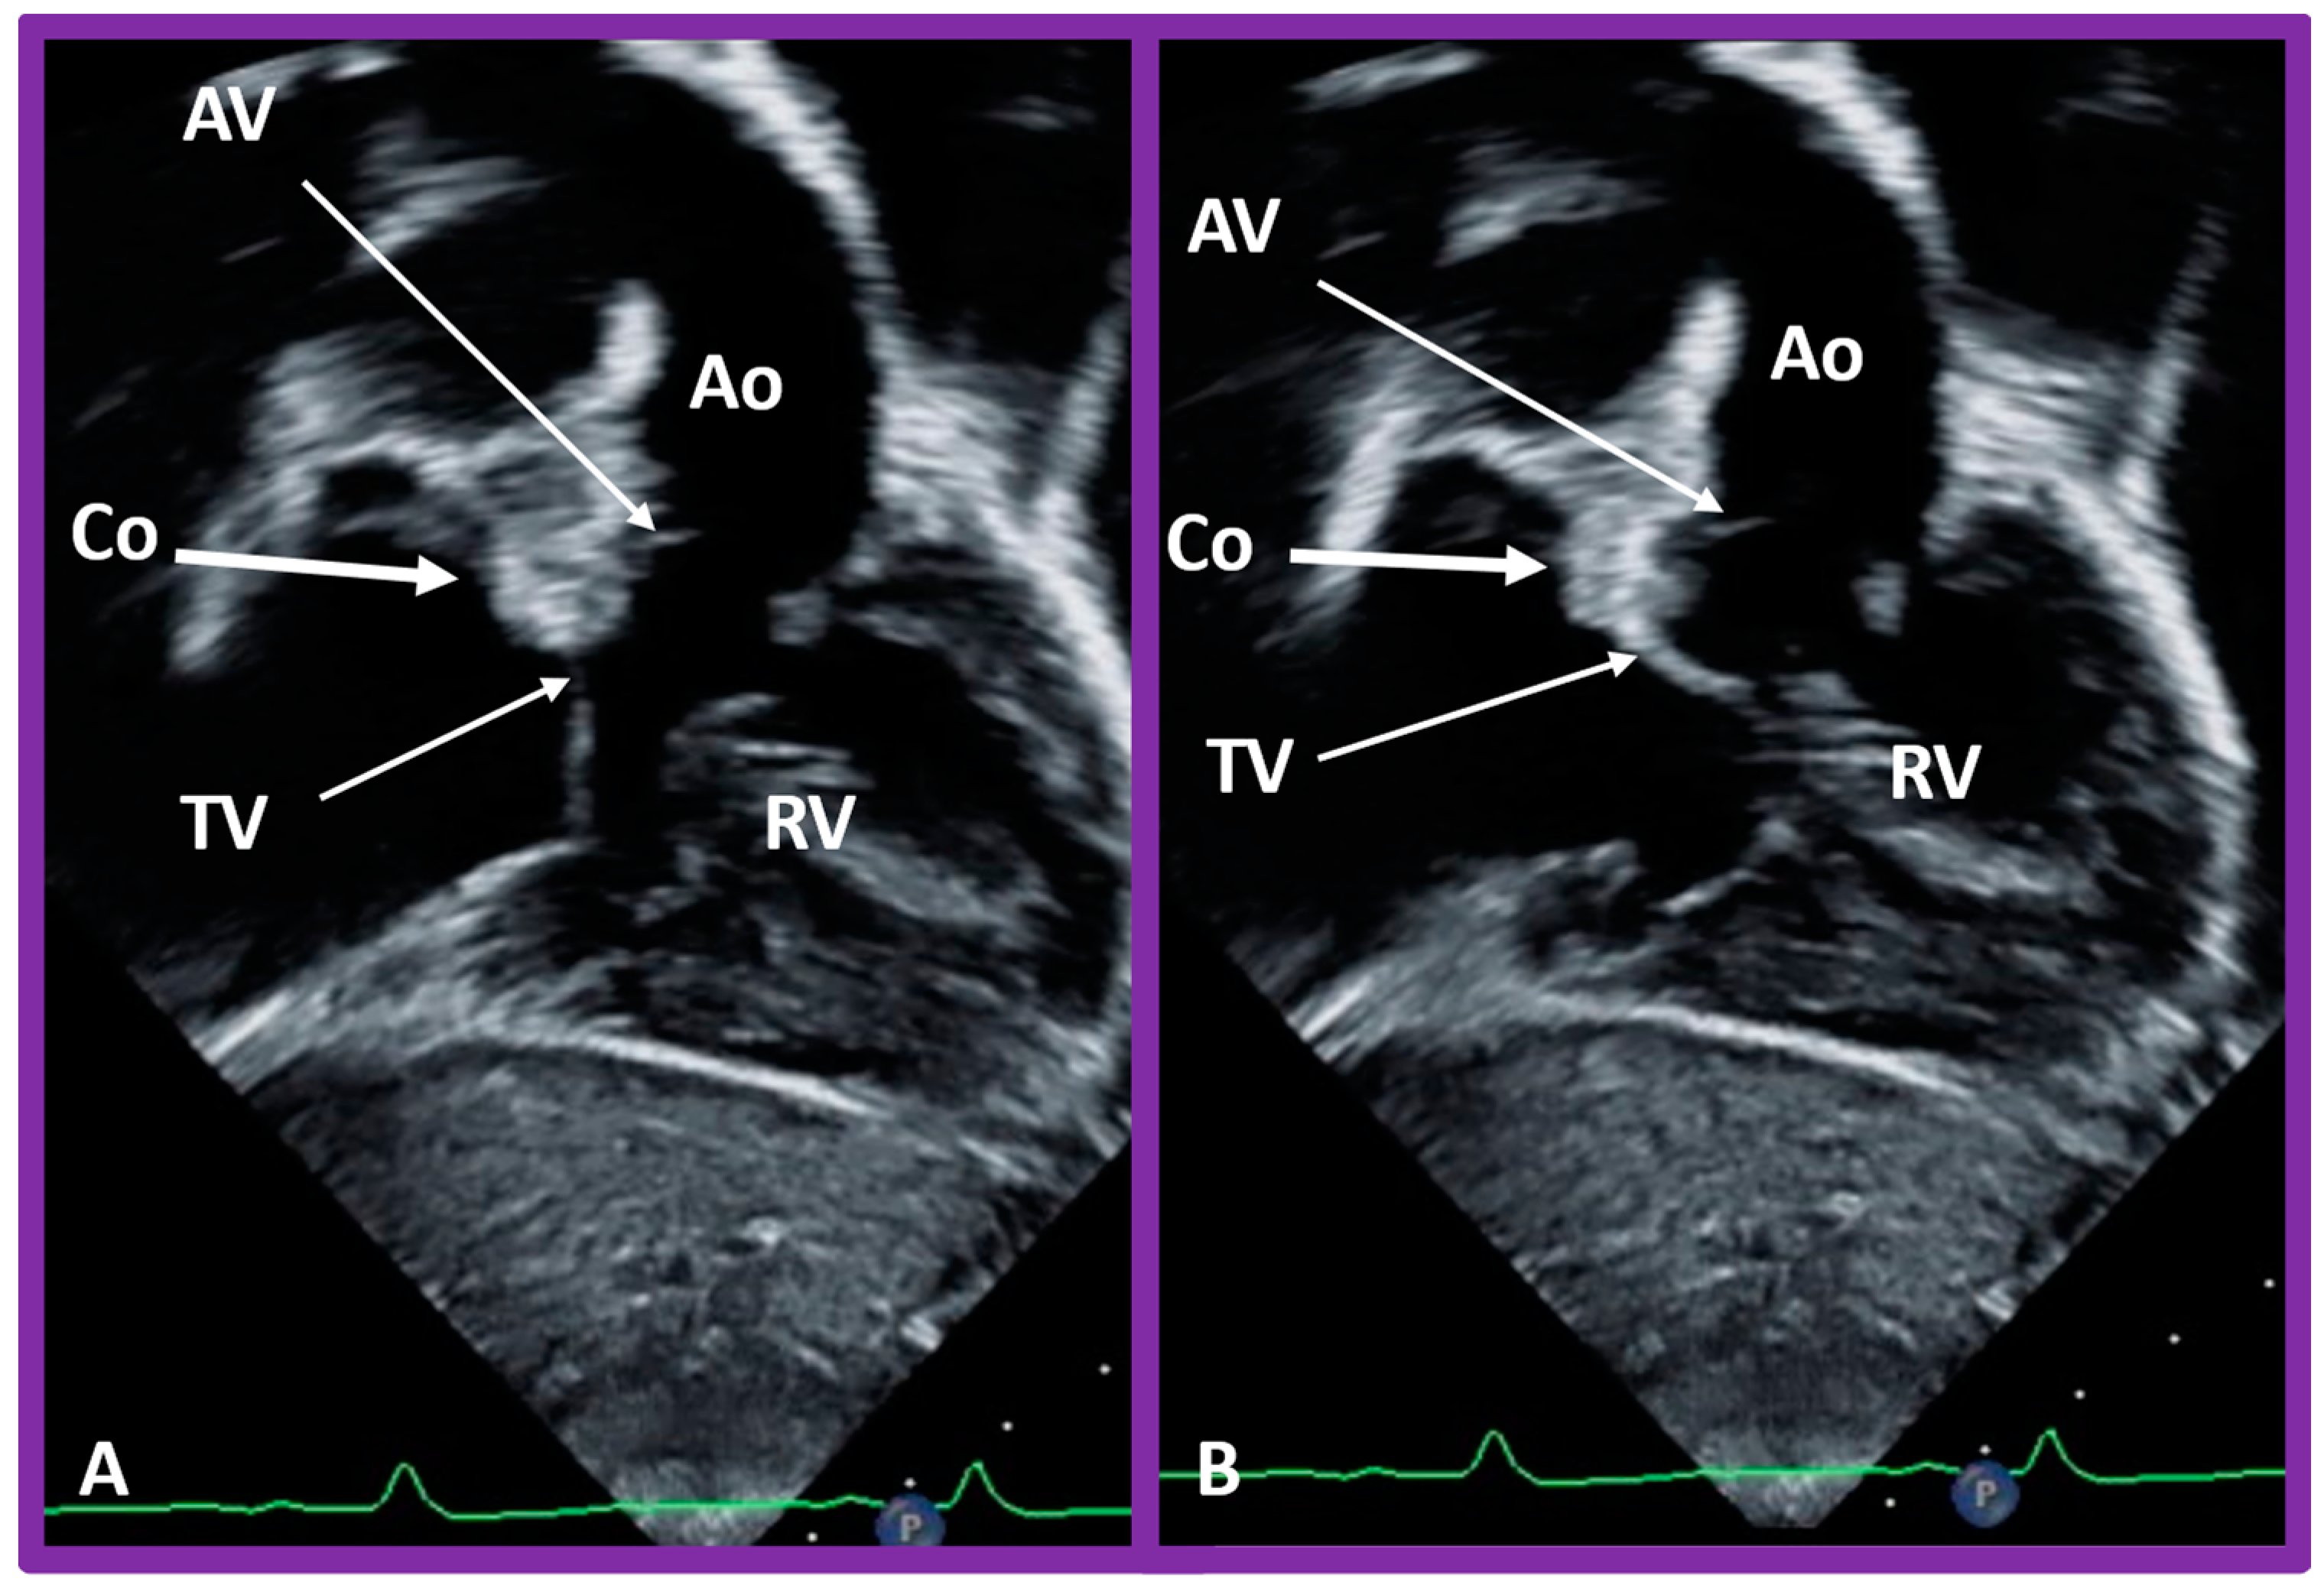
Selected video frames in subcostal views to demonstrate the atrioventricular valve-to-semilunar valve relationship in a child with l-transposition of the great vessels demonstrating a lack of continuity between the aortic valve (AV) and tricuspid valve (TV) leaflets due to conus (Co) separating them. The TV closed in (A) and open in (B). Ao, aorta; Right ventricle (RV).
Figure 51.
Selected video frames in subcostal views to demonstrate the atrioventricular valve-to-semilunar valve relationship in a child with l-transposition of the great vessels demonstrating a lack of continuity between the aortic valve (AV) and tricuspid valve (TV) leaflets due to conus (Co) separating them. The TV closed in (A) and open in (B). Ao, aorta; Right ventricle (RV).


