
Clinical Utility of Repeated Urimal Test of Articulation and Phonation for Patients with Childhood Apraxia of Speech


Abstract
:1. Introduction
2. Materials and Methods
2.1. Subjects
2.2. Assessment
2.3. Statistical Analysis
3. Results
4. Discussion
Author Contributions
Funding
Institutional Review Board Statement
Informed Consent Statement
Data Availability Statement
Conflicts of Interest
References
- Iuzzini, J. Inconsistency of Speech in Children with Childhood Apraxia of Speech, Phonological Disorders, and Typical Speech; Indiana University ProQuest Dissertations Publishing: Milwaukee, Brookfield, WI, USA, 2012. [Google Scholar]
- Duchow, H.; Lindsay, A.; Roth, K.; Schell, S.; Allen, D. The Co-Occurrence of Possible Developmental Coordination Disorder and Suspected childhood Apraxia of Speech. Can. J. Speech-Lang. Pathol. Audiol. 2019, 43, 81–93. [Google Scholar]
- Harris, S.R.; Mickelson, E.C.; Zwicker, J. Diagnosis and management of developmental coordination disorder. Can. Med Assoc. J. 2015, 187, 659–665. [Google Scholar] [CrossRef] [PubMed] [Green Version]
- Nijland, L.; Terband, H.; Maassen, B. Cognitive Functions in Childhood Apraxia of Speech. J. Speech, Lang. Hear. Res. 2015, 58, 550–565. [Google Scholar] [CrossRef] [PubMed]
- Gillon, G.T.; Moriarty, B.C. Childhood Apraxia of Speech: Children at Risk for Persistent Reading and Spelling Disorder. Semin. Speech Lang. 2007, 28, 48–57. [Google Scholar] [CrossRef] [PubMed]
- Lewis, B.A.; Freebairn, L.A.; Hansen, A.J.; Iyengar, S.; Taylor, H.G. School-Age Follow-Up of Children With Childhood Apraxia of Speech. Lang. Speech, Hear. Serv. Sch. 2004, 35, 122–140. [Google Scholar] [CrossRef]
- Overby, M.S.; Trainin, G.; Smit, A.B.; Bernthal, J.E.; Nelson, R. Preliteracy Speech Sound Production Skill and Later Literacy Outcomes: A Study Using the Templin Archive. Lang. Speech, Hear. Serv. Sch. 2012, 43, 97–115. [Google Scholar] [CrossRef]
- Peterson, R.L.; Pennington, B.F.; Shriberg, L.D.; Boada, R. What Influences Literacy Outcome in Children With Speech Sound Disorder? J. Speech, Lang. Hear. Res. 2009, 52, 1175–1188. [Google Scholar] [CrossRef]
- Kirby, A.; Williams, N.; Thomas, M.; Hill, E.L. Self-reported mood, general health, wellbeing and employment status in adults with suspected DCD. Res. Dev. Disabil. 2013, 34, 1357–1364. [Google Scholar] [CrossRef] [PubMed]
- Hill, E.L.; Brown, D. Mood impairments in adults previously diagnosed with developmental coordination disorder. J. Ment. Heal. 2013, 22, 334–340. [Google Scholar] [CrossRef] [PubMed]
- Tal-Saban, M.; Ornoy, A.; Parush, S. Young Adults With Developmental Coordination Disorder: A Longitudinal Study. Am. J. Occup. Ther. 2014, 68, 307–316. [Google Scholar] [CrossRef] [PubMed] [Green Version]
- Murray, E.; McCabe, P.; Heard, R.; Ballard, K. Differential Diagnosis of Children with Suspected Childhood Apraxia of Speech. J. Speech, Lang. Hear. Res. 2015, 58, 43–60. [Google Scholar] [CrossRef] [PubMed]
- Kim, Y.T.; Park, H.; Kang, J.K.; Kim, J.A.; Shin, M.J.; Kim, S.-J.; Ha, J.-W. Validity and Reliability Analyses for the Development of Urimal Test of Articulation and Phonology-2. Commun. Sci. Disord. 2018, 23, 959–970. [Google Scholar] [CrossRef]
- Lee, D.-W.; Oh, J.-Y.; Han, M.-H.; Kim, D.-Y.; Lee, J.-W.; Jang, D.-H. Korean language specific dysarthria associated with idiopathic peripheral facial palsy. Medicine 2020, 99, e19585. [Google Scholar] [CrossRef] [PubMed]
- Shin, M.; Ha, J.-W.; Kim, Y.T.; Kim, S.-J. Regional differences in Korean children’s development of speech production. Phon. Speech Sci. 2019, 11, 57–67. [Google Scholar] [CrossRef]
- Bae, S.-R.; Ha, J.-W.; Koo, M.-M.; Hwang, Y.M.; Pyun, S.-B. New Phonological Representation of Children with Speech Sound Disorders. Commun. Sci. Disord. 2016, 21, 24–36. [Google Scholar] [CrossRef] [Green Version]
- Choi, K.M.; Yoo, S.D.; Kim, D.H.; Chon, J.M.; Lee, S.A.; Han, Y.R.; Yoo, M.C.; Lee, J.J.; Yang, M.; Choi, Y.H.; et al. Correlations Between Values of Articulation Tests and Language Tests for Children With Articulation Disorder in Korea. Ann. Rehabil. Med. 2019, 43, 483–489. [Google Scholar] [CrossRef] [PubMed]
- Gierut, J.A. Treatment efficacy: Functional phonological disorders in children. J. Speech Lang. Hear. Res. 1998, 41, S85–S100. [Google Scholar] [CrossRef] [PubMed]
- Kim, Y.T.; Sung, T.J.; Lee, Y.K. Preschool Receptive-Expressive Language Scale (PRES); Seoul Welfare Center for People with Disabilities: Seoul, Korea, 2003. [Google Scholar]
- Jenya, L.S.; Tiffany, P.H.; Jordan, R.G. Speech Inconsistency in Children With Childhood Apraxia of Speech, Language Impairment, and Speech Delay: Depends on the Stimuli. J. Speech Lang. Hear. Res. 2017, 60, 1194–1210. [Google Scholar]
- Betz, S.K.; Stoel-Gammon, C. Measuring articulatory error consistency in children with developmental apraxia of speech. Clin. Linguistics Phon. 2005, 19, 53–66. [Google Scholar] [CrossRef] [PubMed]
- Oh, E.Y.; Kim, Y.H.; Lee, H.S.; Lee, I.G.; Lee, J.S.; Jang, E.S. Clinical Aspects of Functional Articulation Disorder. J. Korean Child Neurol. Soc. 2008, 16, 189–197. [Google Scholar]

| Age (Years) | Male (%) | |
|---|---|---|
| Normal group | 4.75 ± 0.50 | 3(75.0) |
| Functional articulation disorder group (FAD) | 4.44 ± 0.53 | 5(55.6) |
| Childhood apraxia of speech group (CAS) | 4.21 ± 0.42 | 10(52.6) |
| p value | ||
| † | 0.355 | 0.506 |
| †† | 0.115 | 0.412 |
| ††† | 0.264 | 0.885 |
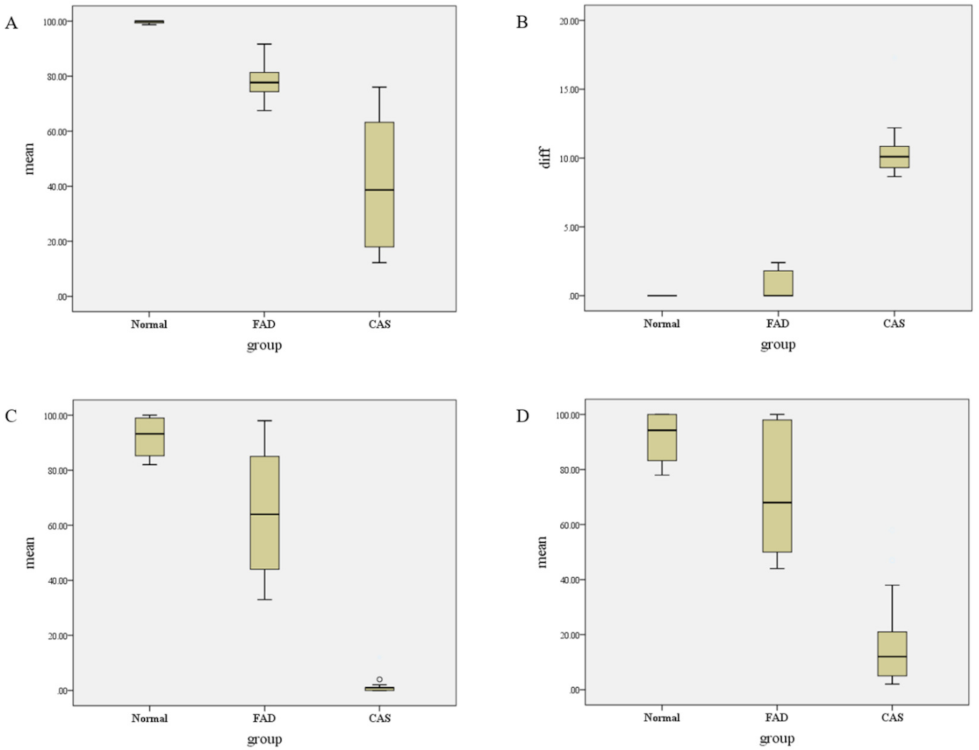
| Mean (%) | Difference (%) | PRES(E) (%ile) | PRES(R) (%ile) | |
|---|---|---|---|---|
| Normal group | 99.68 ± 0.65 | 0.00 ± 0.00 | 92.13 ± 8.41 | 91.62 ± 10.58 |
| FAD group | 77.92 ± 7.71 | 0.82 ± 1.01 | 64.44 ± 22.33 | 73.22 ± 24.04 |
| CAS group | 42.04 ± 23.83 | 10.01 ± 2.86 | 1.37 ± 2.75 | 17.10 ± 17.45 |
| p value | <0.00 * | <0.00 * | <0.00 * | <0.00 * |
| Mann-Whitney U post hoc test | ||||
| p value | ||||
| † | <0.00 ** | 0.26 | 0.03 | 0.26 |
| †† | <0.00 ** | <0.00 ** | <0.00 ** | <0.00 ** |
| ††† | < 0.00 ** | < 0.00 ** | < 0.00 ** | < 0.00 ** |
| PRES(E) (%ile) | PRES(R) (%ile) | p value | |
|---|---|---|---|
| Normal group | 92.13 ± 8.41 | 91.62 ± 10.58 | 0.89 |
| FAD group | 64.44 ± 22.33 | 73.22 ± 24.04 | 0.34 |
| CAS group | 1.37 ± 2.75 | 17.10 ± 17.45 | <0.00 * |
Publisher’s Note: MDPI stays neutral with regard to jurisdictional claims in published maps and institutional affiliations. |
© 2021 by the authors. Licensee MDPI, Basel, Switzerland. This article is an open access article distributed under the terms and conditions of the Creative Commons Attribution (CC BY) license (https://creativecommons.org/licenses/by/4.0/).
Share and Cite
Yun, J.-H.; Shin, S.-M.; Son, S.-M. Clinical Utility of Repeated Urimal Test of Articulation and Phonation for Patients with Childhood Apraxia of Speech. Children 2021, 8, 1106. https://doi.org/10.3390/children8121106
Yun J-H, Shin S-M, Son S-M. Clinical Utility of Repeated Urimal Test of Articulation and Phonation for Patients with Childhood Apraxia of Speech. Children. 2021; 8(12):1106. https://doi.org/10.3390/children8121106
Chicago/Turabian StyleYun, Jung-Hae, So-Min Shin, and Su-Min Son. 2021. "Clinical Utility of Repeated Urimal Test of Articulation and Phonation for Patients with Childhood Apraxia of Speech" Children 8, no. 12: 1106. https://doi.org/10.3390/children8121106
APA StyleYun, J.-H., Shin, S.-M., & Son, S.-M. (2021). Clinical Utility of Repeated Urimal Test of Articulation and Phonation for Patients with Childhood Apraxia of Speech. Children, 8(12), 1106. https://doi.org/10.3390/children8121106