
Correlation and Correspondence between Skeletal Maturation Indicators in Hand-Wrist and Cervical Vertebra Analyses and Skeletal Maturity Score in Korean Adolescents


Abstract
:1. Introduction
2. Materials and Methods
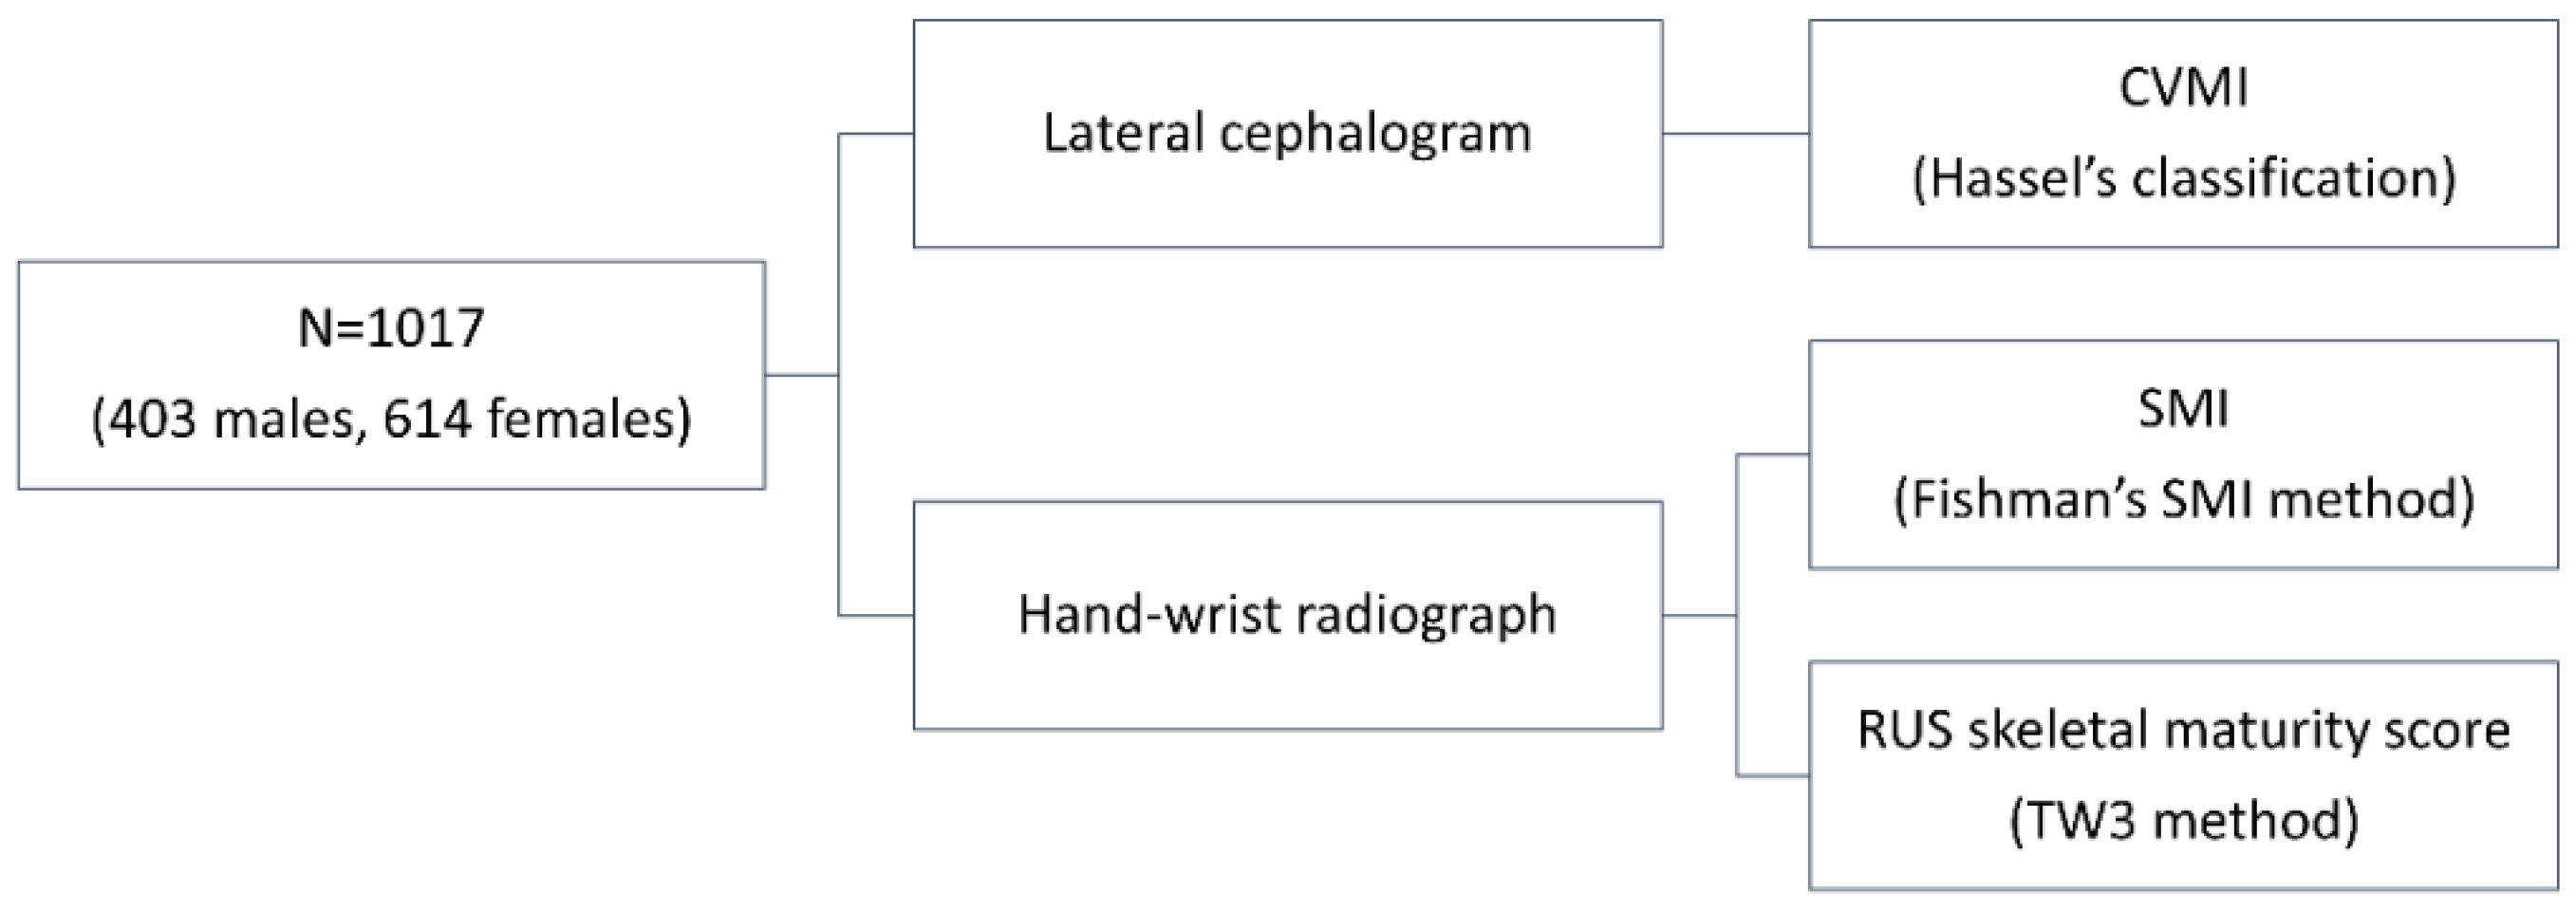
2.1. Samples
2.2. Radiograph Analysis
2.3. Reproducibility
2.4. Statistical Analysis
3. Results
4. Discussion
5. Conclusions
Author Contributions
Funding
Institutional Review Board Statement
Informed Consent Statement
Data Availability Statement
Conflicts of Interest
References
- Fishman, L.S. Chronological versus skeletal age, an evaluation of craniofacial growth. Angle Orthod. 1979, 49, 181–189. [Google Scholar]
- Demirjian, A.; Buschang, P.H.; Tanguay, R.; Patterson, D.K. Interrelationships among measures of somatic, skeletal, dental, and sexual maturity. Am. J. Orthod. 1985, 88, 433–438. [Google Scholar] [CrossRef]
- Fishman, L.S. Radiographic evaluation of skeletal maturation. A clinically oriented method based on hand-wrist films. Angle Orthod. 1982, 52, 88–112. [Google Scholar]
- Hägg, U.; Taranger, J. Skeletal stages of the hand and wrist as indicators of the pubertal growth spurt. Acta Odontol. Scand. 1980, 38, 187–200. [Google Scholar] [CrossRef] [PubMed]
- Tanner, J. Assessment of Skeletal Maturity and Prediction of Adult Height: (tw3 Method); W.B. Saunders: London, UK, 2001. [Google Scholar]
- Hassel, B.; Farman, A.G. Skeletal maturation evaluation using cervical vertebrae. Am. J. Orthod. Dentofac. Orthop. 1995, 107, 58–66. [Google Scholar] [CrossRef]
- Prion, S.; Haerling, K.A. Making sense of methods and measurement: Spearman-rho ranked-order correlation coefficient. Clin. Simul. Nurs. 2014, 10, 535–536. [Google Scholar] [CrossRef]
- Bland, J.M.; Altman, D.G. Statistics notes: Cronbach’s alpha. BMJ 1997, 314, 572. [Google Scholar] [CrossRef] [Green Version]
- Tavakol, M.; Dennick, R. Making sense of cronbach’s alpha. Int. J. Med. Educ. 2011, 2, 53–55. [Google Scholar] [CrossRef] [PubMed]
- Bambha, J.K.; Van Natta, P. Longitudinal study of facial growth in relation to skeletal maturation during adolescence. Am. J. Orthod. 1963, 49, 481–493. [Google Scholar] [CrossRef]
- Bambha, J.K. Longitudinal cephalometric roentgenographic study of face and cranium in relation to body height. J. Am. Dent. Assoc. 1961, 63, 776–799. [Google Scholar] [CrossRef]
- Nanda, R.S. The rates of growth of several facial components measured from serial cephalometric roentgenograms. Am. J. Orthod. 1955, 41, 658–673. [Google Scholar] [CrossRef]
- Rose, G.J. A cross-sectional study of the relationship of facial areas with several body dimensions. Angle Orthod. 1960, 30, 6–13. [Google Scholar]
- Proffit, W.; Fields, H. Contemporary Orthodontics, 5th ed.; Elsevier: Gurgaon, India, 2012. [Google Scholar]
- Al Khal, H.A.; Wong, R.W.; Rabie, A.B. Elimination of hand-wrist radiographs for maturity assessment in children needing orthodontic therapy. Skelet. Radiol. 2008, 37, 195–200. [Google Scholar] [CrossRef]
- Flores-Mir, C.; Burgess, C.A.; Champney, M.; Jensen, R.J.; Pitcher, M.R.; Major, P.W. Correlation of skeletal maturation stages determined by cervical vertebrae and hand-wrist evaluations. Angle Orthod. 2006, 76, 1–5. [Google Scholar]
- Franchi, L.; Baccetti, T.; McNamara, J.A. Mandibular growth as related to cervical vertebral maturation and body height. Am. J. Orthod. Dentofac. Orthop. 2000, 118, 335–340. [Google Scholar] [CrossRef] [Green Version]
- Rainey, B.-J.; Burnside, G.; Harrison, J.E. Reliability of cervical vertebral maturation staging. Am. J. Orthod. Dentofac. Orthop. 2016, 150, 98–104. [Google Scholar] [CrossRef] [Green Version]
- Uysal, T.; Ramoglu, S.I.; Basciftci, F.A.; Sari, Z. Chronologic age and skeletal maturation of the cervical vertebrae and hand-wrist: Is there a relationship? Am. J. Orthod. Dentofac. Orthop. 2006, 130, 622–628. [Google Scholar] [CrossRef]
- Zhao, X.-G.; Lin, J.; Jiang, J.-H.; Wang, Q.; Ng, S.H. Validity and reliability of a method for assessment of cervical vertebral maturation. Angle Orthod. 2011, 82, 229–234. [Google Scholar] [CrossRef]
- Wong, R.W.K.; Alkhal, H.A.; Rabie, A.B.M. Use of cervical vertebral maturation to determine skeletal age. Am. J. Orthod. Dentofac. Orthop. 2009, 136, 484.e481–484.e486. [Google Scholar] [CrossRef]
- Chalasani, S.; Kumar, J.; Prasad, M.; Kumar Shetty, B.S.; Ashok Kumar, T. An evaluation of skeletal maturation by hand-wrist bone analysis and cervical vertebral analysis: A comparitive study. J. Indian Orthod. Soc. 2013, 47, 433–437. [Google Scholar] [CrossRef]
- Sachan, K.; Sharma, V.; Tandon, P. A correlative study of dental age and skeletal maturation. Indian J. Dent. Res. 2011, 22, 882. [Google Scholar] [CrossRef]


| Total | Male | Female | p Value (Mann–Whitney U Test) | |
|---|---|---|---|---|
| Number of subjects | 1017 | 403 | 614 | |
| Chronological age (year) | 11.9 ± 2.5 a (range, 4.9–18.8; 95% CI (11.7–12.0); median, 12.1) | 11.7 ± 2.6 a (range, 6.6–18.6; 95% CI (11.5–12.0); median, 11.8) | 12.0 ± 2.4 a (range, 4.9–18.8; 95% CI (11.8–12.2); median, 12.3) | 0.053 |
| SMI | 6.0 ± 3.9 a (range, 1.0–11.0; 95% CI (5.7–6.2); median, 6.0) | 4.6 ± 3.5 a (range, 1.0–11.0; 95% CI (4.3–4.9); median, 3.0) | 6.9 ± 3.8 a (range, 1.0–11.0; 95% CI (6.6–7.2); median, 7.0) | <0.001 *** |
| CVMI | 3.4 ± 2.0 a (range, 1.0–6.0; 95% CI (3.3–3.5); median, 3.0) | 2.7 ± 1.8 a (range, 1.0–6.0; 95% CI (2.5–2.9); median, 2.0) | 3.8 ± 2.0 a (range, 1.0–6.0; 95% CI (3.7–4.0); median, 4.0) | <0.001 *** |
| RUS skeletal maturity score | 613.8 ± 272.0 a (range, 167–1000; 95% CI (597.1–630.5); median, 592.0) | 480.1 ± 256.6 a (range, 167–1000; 95% CI (455.0–505.3); median, 367.0) | 701.6 ± 244.9 a (range, 209–1000; 95% CI (682.2–721.0); median, 726.5) | <0.001 *** |
| Total | Male | Female | |
|---|---|---|---|
| CVMI and SMI | 0.955 (p < 0.001 ***) | 0.958 (p < 0.001 ***) | 0.917 (p < 0.001 ***) |
| SMI and RUS skeletal maturity score | 0.948 (p < 0.001 ***) | 0.957 (p < 0.001 ***) | 0.944 (p < 0.001 ***) |
| CVMI and RUS skeletal maturity score | 0.921 (p < 0.001 ***) | 0.935 (p < 0.001 ***) | 0.890 (p < 0.001 ***) |
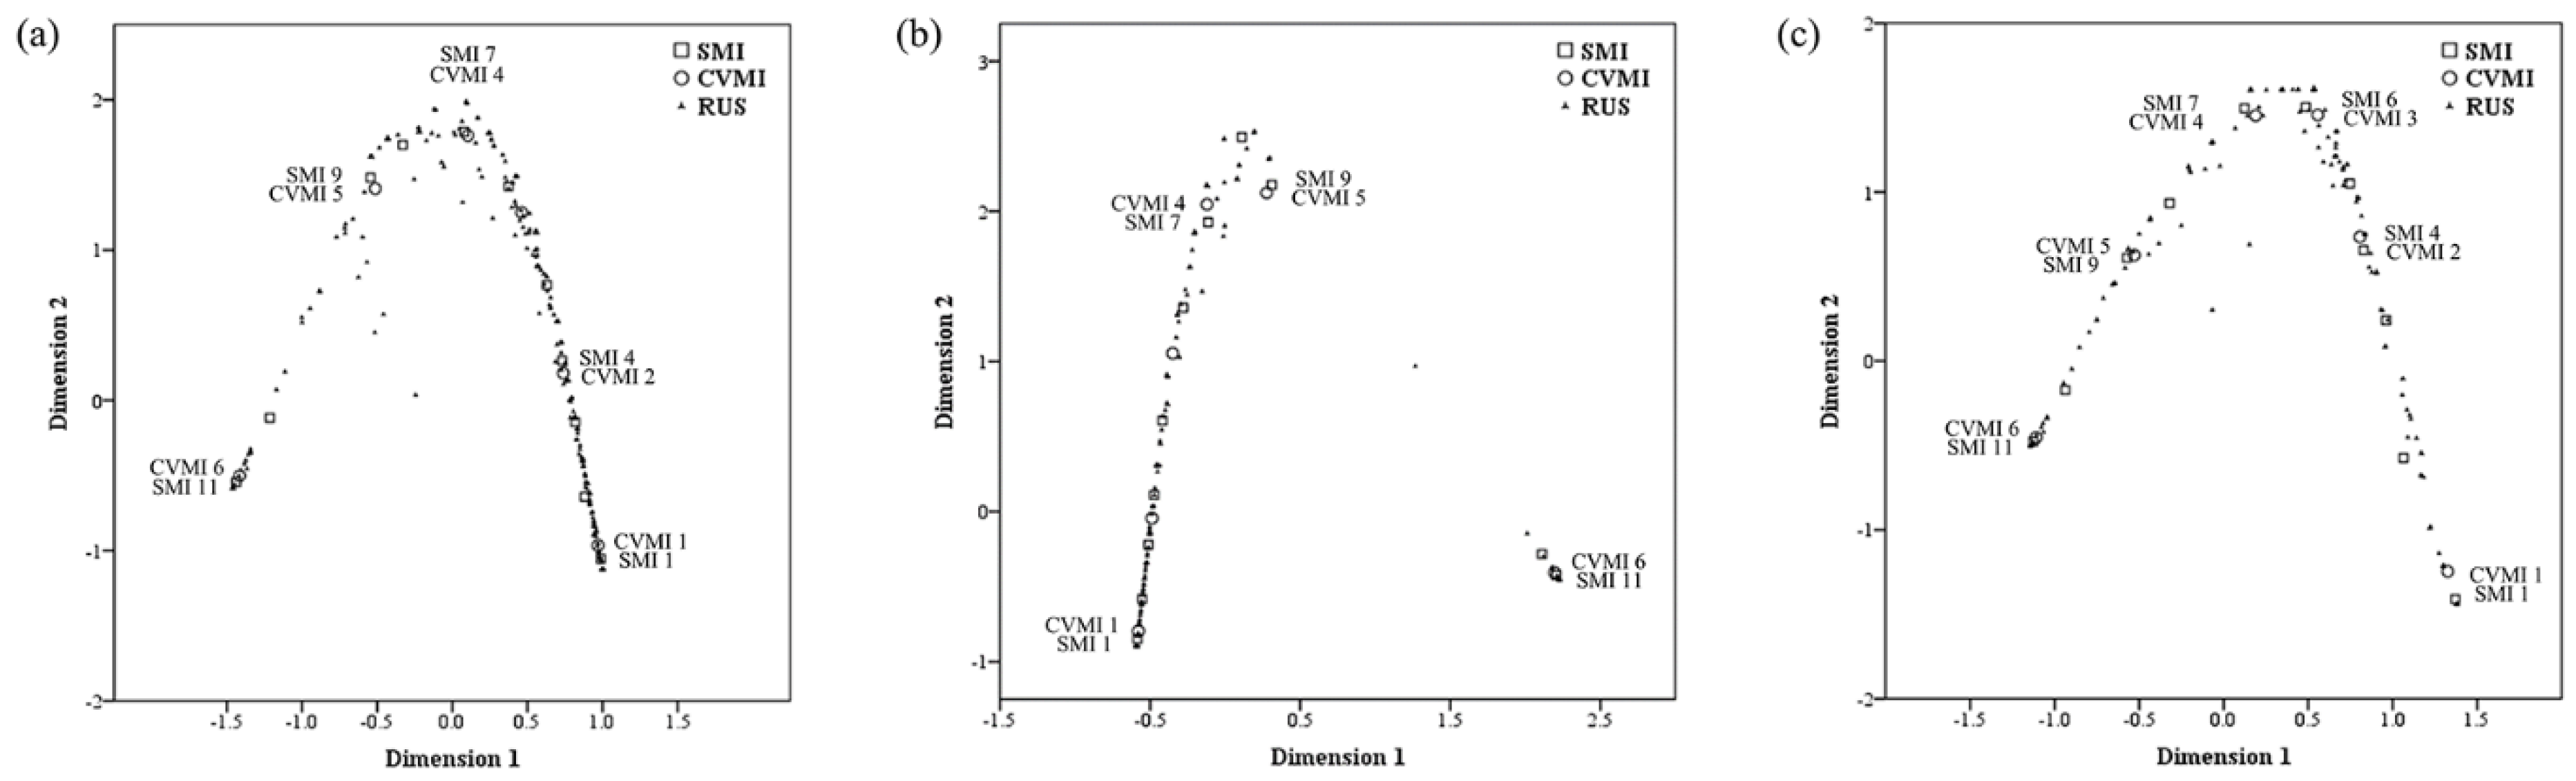
| Total | Male | Female | |||||||
|---|---|---|---|---|---|---|---|---|---|
| Multiple Correspondence Analysis Dimensions | Mean | Multiple Correspondence Analysis Dimensions | Mean | Multiple Correspondence Analysis Dimensions | Mean | ||||
| 1 | 2 | 1 | 2 | 1 | 2 | ||||
| SMI | 0.984 | 0.933 | 0.958 | 0.993 | 0.937 | 0.965 | 0.982 | 0.946 | 0.964 |
| CVMI | 0.980 | 0.901 | 0.940 | 0.987 | 0.912 | 0.949 | 0.980 | 0.924 | 0.952 |
| RUS skeletal maturity score | 0.993 | 0.960 | 0.976 | 0.998 | 0.983 | 0.990 | 0.994 | 0.974 | 0.984 |
| Active total | 2.956 | 2.793 | 2.875 | 2.977 | 2.831 | 2.904 | 2.956 | 2.844 | 2.900 |
| % of variance | 98.538 | 93.104 | 95.821 | 99.231 | 94.375 | 96.803 | 98.541 | 94.813 | 96.677 |
| Total (n = 1017) | Male (n = 403) | Female (n = 614) | |||||||||
|---|---|---|---|---|---|---|---|---|---|---|---|
| CVMI | RUS Skeletal Maturity Score | SMI | RUS Skeletal Maturity Score | CVMI | RUS Skeletal Maturity Score | SMI | RUS Skeletal Maturity Score | CVMI | RUS Skeletal Maturity Score | SMI | RUS Skeletal Maturity Score |
| 1 | 328 | 1 | 277 | 1 | 277 | 1 | 249, 265, 266, 268, 273, 276, 286 | 1 | 411, 423, 427, 432 | 1 | 209, 243, 264, 265, 269, 273, 276, 277, 280, 283, 284, 286, 290, 291, 293, 298, 301, 302, 303, 305, 306, 308, 309, 311, 312, 319, 320, 321, 325, 328, 329, 336, 337, 338, 349, 354, 359, 361, 365, 366, 368, 373, 374, 378, 382, 385, 387, 390, 391, 393, 400, 403, 405, 409, 412, 422, 435, 436, 438, 447 |
| 2 | 467 | 2 | 314, 372, 424 | 2 | 318 | 2 | 326 | 2 | 455, 459, 474, 478, 505, 506, 521, 522, 557 | 2 | 404, 426 |
| 3 | 564 | 3 | 334, 374, 380 | 3 | 564 | 3 | 334, 380 | 3 | 565 | 3 | 464 |
| 4 | 635 | 4 | 295 | 4 | 785 | 4 | 241 | 4 | 635 | 4 | 473 |
| 5 | 779 | 5 | 534 | 5 | 689, 744, 768, 896 | 5 | 401 | 5 | 809 | 5 | 458 |
| 6 | 928 | 6 | 516 | 6 | 928 | 6 | 399 | 6 | 945 | 6 | 611 |
| 7 | 724 | 7 | 586, 614 | 7 | 767 | ||||||
| 8 | 745 | 8 | 745 | 8 | 796 | ||||||
| 9 | 744, 759, 768, 774, 781, 822, 824, 830, 835 | 9 | 689, 744, 768, 896 | 9 | 809 | ||||||
| 10 | 852 | 10 | 854 | 10 | 852 | ||||||
| 11 | 1000 | 11 | 928 | 11 | 1000 | ||||||
Publisher’s Note: MDPI stays neutral with regard to jurisdictional claims in published maps and institutional affiliations. |
© 2021 by the authors. Licensee MDPI, Basel, Switzerland. This article is an open access article distributed under the terms and conditions of the Creative Commons Attribution (CC BY) license (https://creativecommons.org/licenses/by/4.0/).
Share and Cite
Jeon, J.Y.; Kim, C.-S.; Kim, J.-S.; Choi, S.-H. Correlation and Correspondence between Skeletal Maturation Indicators in Hand-Wrist and Cervical Vertebra Analyses and Skeletal Maturity Score in Korean Adolescents. Children 2021, 8, 910. https://doi.org/10.3390/children8100910
Jeon JY, Kim C-S, Kim J-S, Choi S-H. Correlation and Correspondence between Skeletal Maturation Indicators in Hand-Wrist and Cervical Vertebra Analyses and Skeletal Maturity Score in Korean Adolescents. Children. 2021; 8(10):910. https://doi.org/10.3390/children8100910
Chicago/Turabian StyleJeon, Ji Yoon, Cheol-Soon Kim, Jung-Suk Kim, and Sung-Hwan Choi. 2021. "Correlation and Correspondence between Skeletal Maturation Indicators in Hand-Wrist and Cervical Vertebra Analyses and Skeletal Maturity Score in Korean Adolescents" Children 8, no. 10: 910. https://doi.org/10.3390/children8100910
APA StyleJeon, J. Y., Kim, C.-S., Kim, J.-S., & Choi, S.-H. (2021). Correlation and Correspondence between Skeletal Maturation Indicators in Hand-Wrist and Cervical Vertebra Analyses and Skeletal Maturity Score in Korean Adolescents. Children, 8(10), 910. https://doi.org/10.3390/children8100910