Diminished Returns of Parental Education in Terms of Youth School Performance: Ruling out Regression toward the Mean


Abstract
:1. Introduction
2. Materials and Methods
2.1. Design and Settings
2.2. Sample and Sampling
2.3. Study Variables
2.4. Statistics
2.5. Ethics
3. Results
3.1. Univariate Analysis
3.2. ANOVA Results
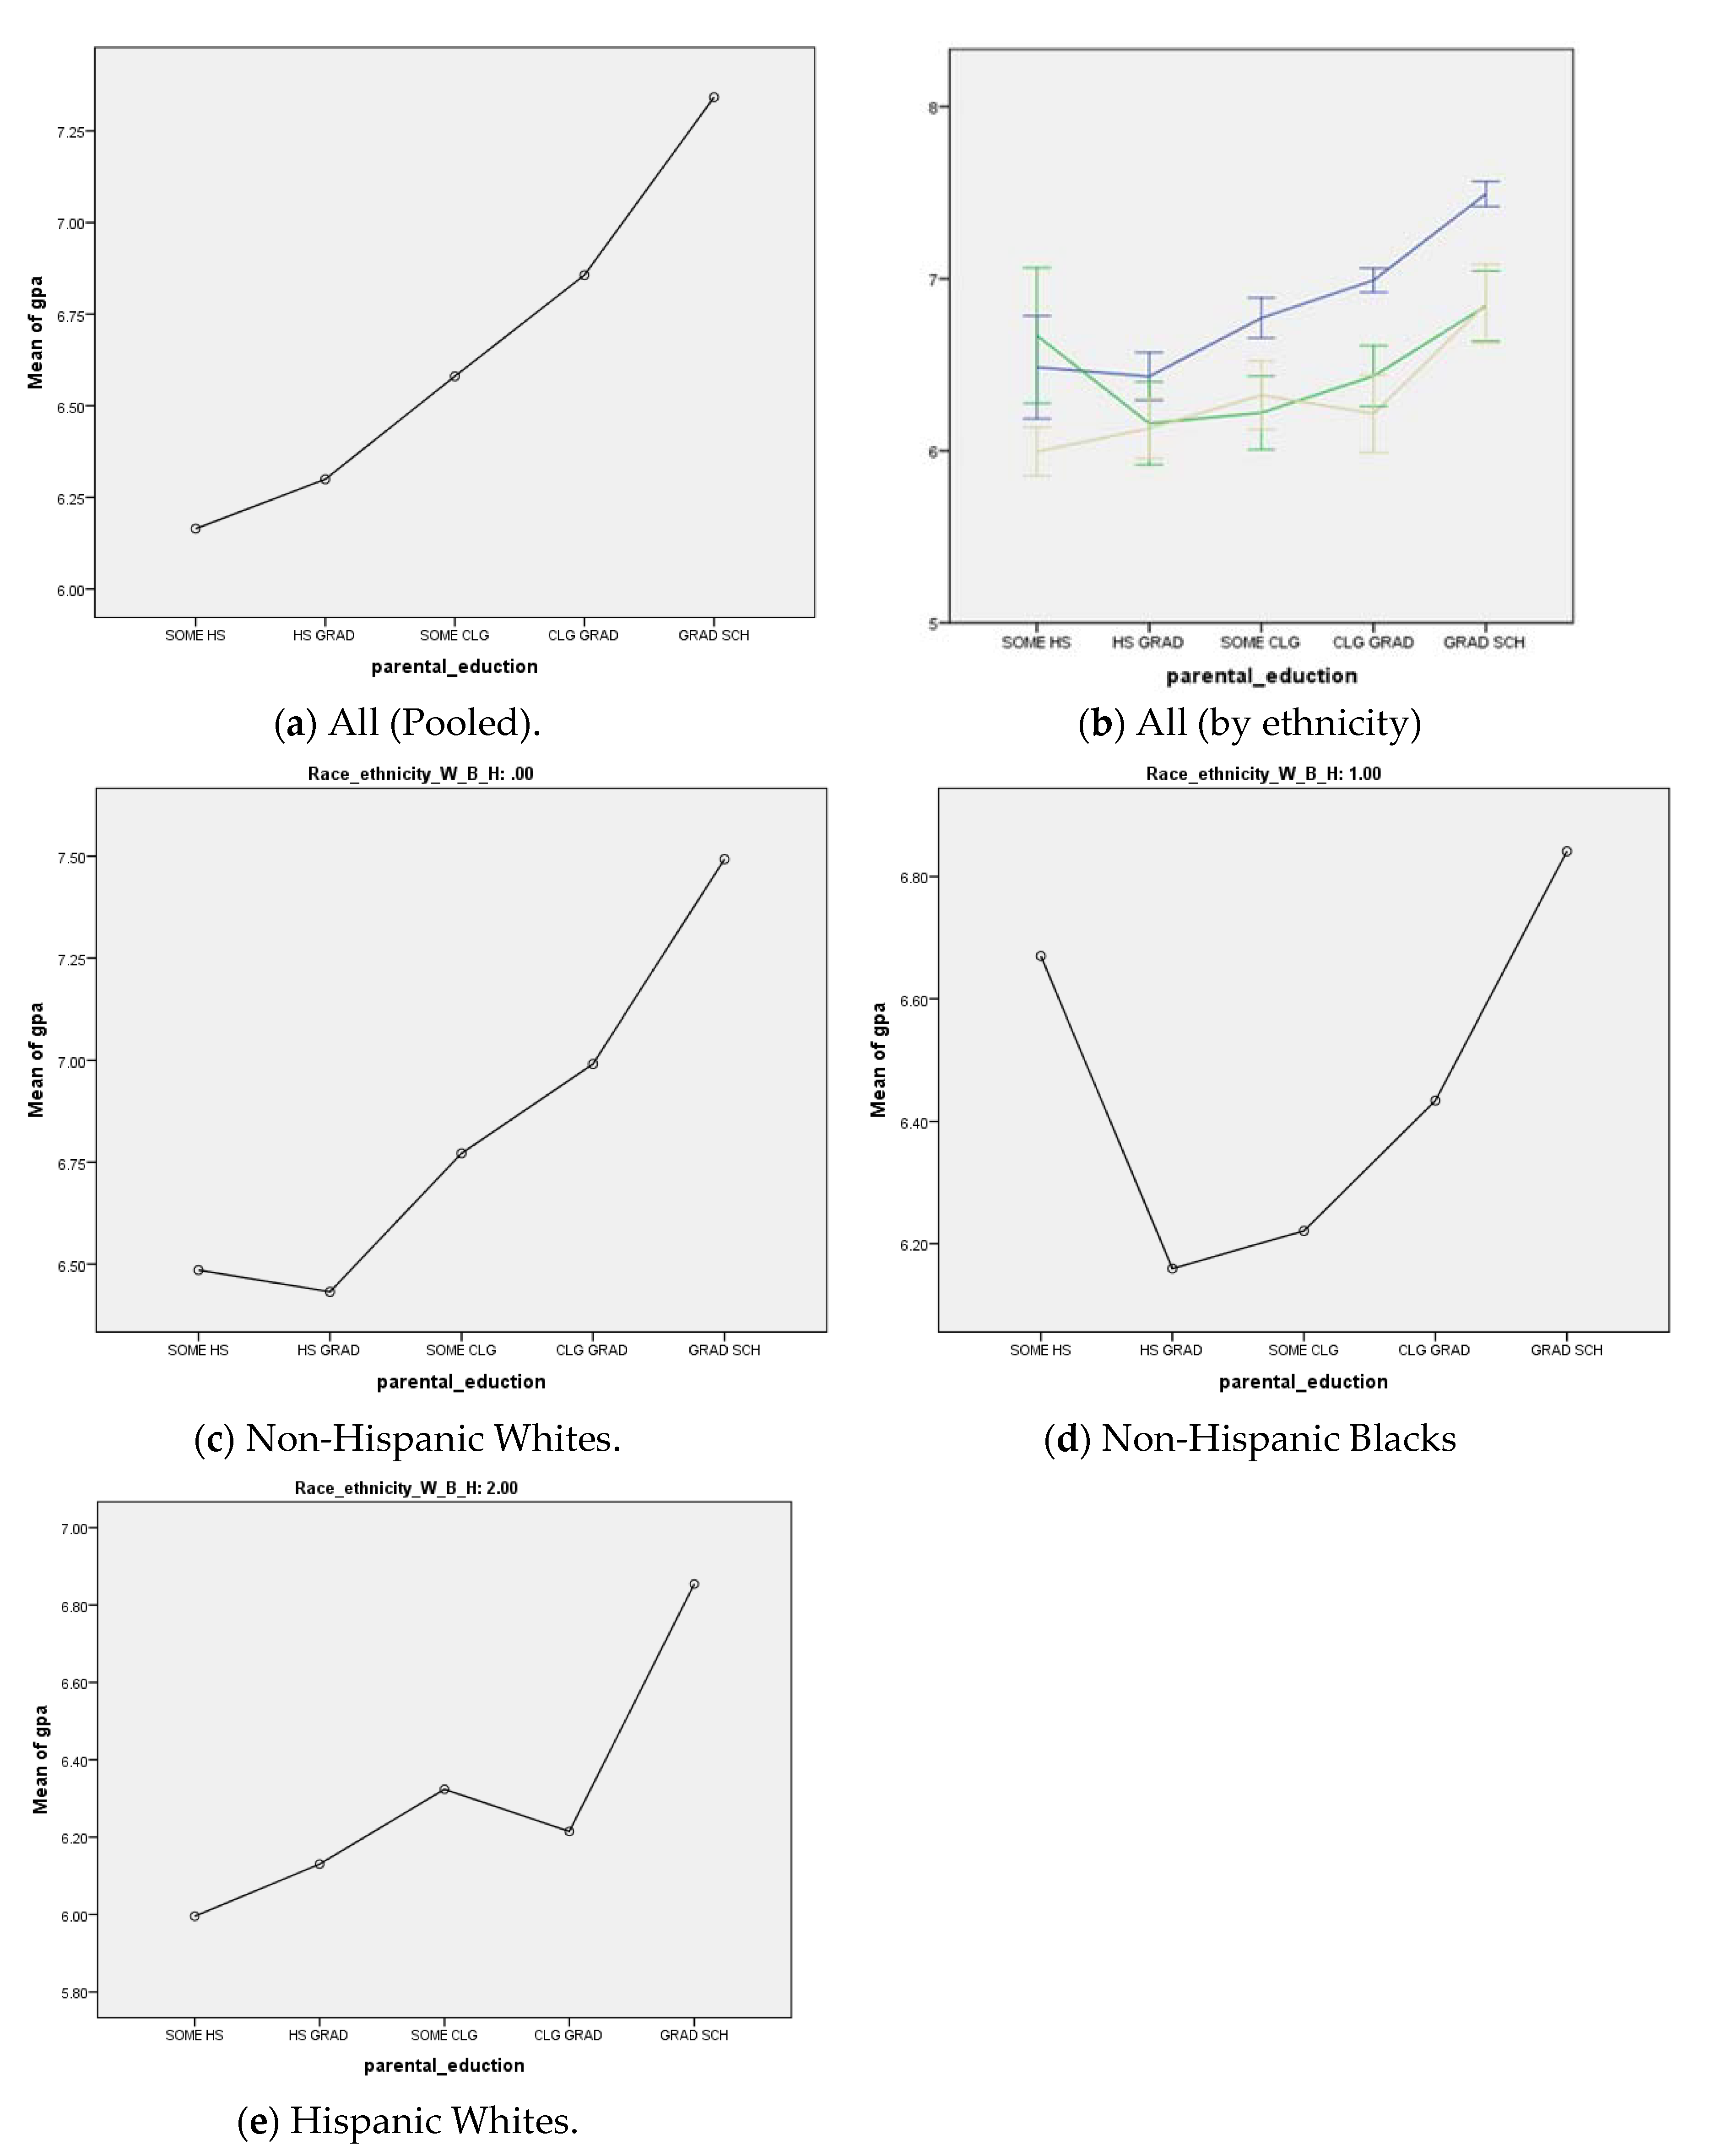
3.3. Data Visualization
4. Discussion
5. Limitations
6. Conclusions
Author Contributions
Funding
Conflicts of Interest
References
- Assari, S. Health disparities due to diminished return among Black Americans: Public policy solutions. Soc. Issues Policy Rev. 2018, 12, 112–145. [Google Scholar] [CrossRef]
- Assari, S. Unequal gain of equal resources across racial groups. Int. J. Health Policy Manag. 2017, 7, 1–9. [Google Scholar] [CrossRef] [Green Version]
- Assari, S.; Farokhnia, M.; Mistry, R. Education attainment and alcohol binge drinking: Diminished returns of hispanics in Los Angeles. Behav. Sci. 2019, 9, 9. [Google Scholar] [CrossRef] [Green Version]
- Assari, S. Parental education attainment and educational upward mobility; Role of race and gender. Behav. Sci. 2018, 8, 107. [Google Scholar] [CrossRef] [Green Version]
- Assari, S. Blacks’ diminished return of education attainment on subjective health; Mediating effect of income. Brain Sci. 2018, 8, 176. [Google Scholar] [CrossRef] [PubMed] [Green Version]
- Assari, S.; Caldwell, C.H.; Mincy, R. Family socioeconomic status at birth and youth impulsivity at age 15; Blacks’ diminished return. Children 2018, 5, 58. [Google Scholar] [CrossRef] [PubMed] [Green Version]
- Assari, S.; Mistry, R. Educational attainment and smoking status in a national sample of American adults; Evidence for the Blacks’ diminished return. Int. J. Env. Res. Public Health 2018, 15, 763. [Google Scholar] [CrossRef] [PubMed] [Green Version]
- Assari, S.; Lankarani, M.M. Education and alcohol consumption among older Americans; Black-White differences. Front. Public Health 2016, 4, 67. [Google Scholar] [CrossRef] [PubMed] [Green Version]
- Assari, S.; Lankarani, M. Educational attainment promotes fruit and vegetable intake for Whites but not Blacks. J 2018, 1, 5. [Google Scholar] [CrossRef] [Green Version]
- Assari, S.; Thomas, A.; Caldwell, C.H.; Mincy, R.B. Blacks’ diminished health return of family structure and socioeconomic status; 15 years of follow-up of a national urban sample of youth. J. Urban. Health 2018, 95, 21–35. [Google Scholar] [CrossRef]
- Assari, S. Separate and combined effects of anxiety, depression and problem drinking on subjective health among Black, hispanic and non-hispanic White men. Int. J. Prev Med. 2014, 5, 269–279. [Google Scholar] [PubMed]
- Assari, S. Ethnic and gender differences in additive effects of socio-economics, psychiatric disorders, and subjective religiosity on suicidal ideation among Blacks. Int. J. Prev Med. 2015, 6, 53. [Google Scholar] [CrossRef] [PubMed]
- Assari, S.; Lankarani, M.M. Race and urbanity alter the protective effect of education but not income on mortality. Front. Public Health 2016, 4, 100. [Google Scholar] [CrossRef]
- Assari, S.; Moghani Lankarani, M. Poverty status and childhood asthma in White and Black families: National survey of children’s health. Healthcare 2018, 6, 62. [Google Scholar] [CrossRef] [PubMed] [Green Version]
- Assari, S.; Caldwell, C.H. High risk of depression in high-income African American boys. J. Racial Ethn. Health Disparities 2018, 5, 808–819. [Google Scholar] [CrossRef]
- Assari, S. Income and mental well-being of middle-aged and older Americans: Immigrants’ diminished returns. Int. J. Travel Med. Glob. Health 2020, 8, 37–43. [Google Scholar] [CrossRef]
- Chalian, H.; Khoshpouri, P.; Assari, S. Patients’ age and discussion with doctors about lung cancer screening: Diminished returns of Blacks. Aging Med. 2019, 2, 35–41. [Google Scholar] [CrossRef]
- Assari, S.; Caldwell, C.H.; Mincy, R.B. Maternal educational attainment at birth promotes future self-rated health of White but not Black youth: A 15-year cohort of a national sample. J. Clin. Med. 2018, 7, 93. [Google Scholar] [CrossRef] [Green Version]
- Assari, S.; Caldwell, C.H. Family income at birth and risk of attention deficit hyperactivity disorder at Age 15: Racial differences. Children 2019, 6, 10. [Google Scholar] [CrossRef] [Green Version]
- Assari, S. Parental educational attainment and mental well-being of college students; Diminished returns of Blacks. Brain Sci. 2018, 8, 193. [Google Scholar] [CrossRef] [Green Version]
- Assari, S. Family socioeconomic position at birth and school bonding at age 15; Blacks’ diminished returns. Behav. Sci. 2019, 9, 26. [Google Scholar] [CrossRef] [PubMed] [Green Version]
- Assari, S. Parental educational attainment and academic performance of American college students; Blacks’ diminished returns. J. Health Econ. Dev. 2019, 1, 21–31. [Google Scholar] [PubMed]
- Assari, S. Does school racial composition explain why high income Black youth perceive more discrimination? A gender analysis. Brain Sci. 2018, 8, 140. [Google Scholar] [CrossRef] [Green Version]
- Benner, A.D.; Wang, Y.; Shen, Y.; Boyle, A.E.; Polk, R.; Cheng, Y.P. Racial/ethnic discrimination and well-being during adolescence: A meta-analytic review. Am. Psychol 2018, 73, 855–883. [Google Scholar] [CrossRef]
- Lockwood, K.G.; Marsland, A.L.; Matthews, K.A.; Gianaros, P.J. Perceived discrimination and cardiovascular health disparities: A multisystem review and health neuroscience perspective. Ann. N. Y. Acad Sci. 2018, 1428, 170–207. [Google Scholar] [CrossRef] [PubMed]
- Richards, M.; James, S.N.; Sizer, A.; Sharma, N.; Rawle, M.; Davis, D.H.J.; Kuh, D. Identifying the lifetime cognitive and socioeconomic antecedents of cognitive state: Seven decades of follow-up in a British birth cohort study. BMJ Open 2019, 9, e024404. [Google Scholar] [CrossRef] [Green Version]
- Manly, J.J.; Jacobs, D.M.; Touradji, P.; Small, S.A.; Stern, Y. Reading level attenuates differences in neuropsychological test performance between African American and White elders. J. Int. Neuropsychol Soc. 2002, 8, 341–348. [Google Scholar] [CrossRef]
- Assari, S. Parental education better helps White than Black families escape poverty: National survey of children’s health. Economies 2018, 6, 30. [Google Scholar] [CrossRef] [Green Version]
- Assari, S.; Caldwell, C.H. Teacher discrimination reduces school performance of African American youth: Role of gender. Brain Sci. 2018, 8, 183. [Google Scholar] [CrossRef] [Green Version]
- Assari, S.; Caldwell, C.H. Social determinants of perceived discrimination among Black youth: Intersection of ethnicity and gender. Children 2018, 5, 24. [Google Scholar] [CrossRef] [Green Version]
- Vines, A.I.; Ward, J.B.; Cordoba, E.; Black, K.Z. Perceived racial/ethnic discrimination and mental health: A review and future directions for social epidemiology. Curr. Epidemiol. Rep. 2017, 4, 156–165. [Google Scholar] [CrossRef] [PubMed]
- Hudson, D.L.; Bullard, K.M.; Neighbors, H.W.; Geronimus, A.T.; Yang, J.; Jackson, J.S. Are benefits conferred with greater socioeconomic position undermined by racial discrimination among African American men? J. Mens Health 2012, 9, 127–136. [Google Scholar] [CrossRef] [PubMed] [Green Version]
- Hudson, D.L.; Neighbors, H.W.; Geronimus, A.T.; Jackson, J.S. The relationship between socioeconomic position and depression among a US nationally representative sample of African Americans. Soc. Psychiatry Psychiatr. Epidemiol. 2012, 47, 373–381. [Google Scholar] [CrossRef] [PubMed] [Green Version]
- Moore, M.N.; Atkins, E.R.; Salam, A.; Callisaya, M.L.; Hare, J.L.; Marwick, T.H.; Nelson, M.R.; Wright, L.; Sharman, J.E.; Rodgers, A. Regression to the mean of repeated ambulatory blood pressure monitoring in five studies. J. Hypertens 2019, 37, 24–29. [Google Scholar] [CrossRef]
- Novack, G.D.; Crockett, R.S. Regression to the mean. Ocul. Surf. 2009, 7, 163–165. [Google Scholar] [CrossRef]
- Stout, R.L. Regression to the mean in addiction research. Addiction 2008, 103, 53. [Google Scholar] [CrossRef]
- Gu, Y.; Razlighi, Q.R.; Zahodne, L.B.; Janicki, S.C.; Ichise, M.; Manly, J.J.; Devanand, D.P.; Brickman, A.M.; Schupf, N.; Mayeux, R.; et al. Brain amyloid deposition and longitudinal cognitive decline in nondemented older subjects: Results from a multi-ethnic population. PLoS ONE 2015, 10, e0123743. [Google Scholar] [CrossRef] [Green Version]
- Jefferson, A.L.; Gibbons, L.E.; Rentz, D.M.; Carvalho, J.O.; Manly, J.; Bennett, D.A.; Jones, R.N. A life course model of cognitive activities, socioeconomic status, education, reading ability, and cognition. J. Am. Geriatr. Soc. 2011, 59, 1403–1411. [Google Scholar] [CrossRef]
- Gao, S.; Jin, Y.; Unverzagt, F.W.; Liang, C.; Hall, K.S.; Ma, F.; Murrell, J.R.; Cheng, Y.; Matesan, J.; Bian, J.; et al. Hypertension and cognitive decline in rural elderly Chinese. J. Am. Geriatr. Soc. 2009, 57, 1051–1057. [Google Scholar] [CrossRef] [Green Version]
- Roche, M.; Mukadam, N.; Adelman, S.; Livingston, G. The idemcare study-improving dementia care in Black African and Caribbean groups: A feasibility cluster randomised controlled trial. Int. J. Geriatr. Psychiatry 2018, 33, 1048–1056. [Google Scholar] [CrossRef] [Green Version]
- Huang, H.; Tanner, J.; Parvataneni, H.; Rice, M.; Horgas, A.; Ding, M.; Price, C. Impact of total knee arthroplasty with general anesthesia on brain networks: Cognitive efficiency and ventricular volume predict functional connectivity decline in older adults. J. Alzheimers Dis 2018, 62, 319–333. [Google Scholar] [CrossRef] [Green Version]
- Assari, S. Parental education and youth inhibitory control in the Adolescent Brain Cognitive Development (ABCD) Study: Blacks’ diminished returns. Brain Sci. 2020, 10, 312. [Google Scholar] [CrossRef]
- Assari, S.; Boyce, S.; Bazargan, M.; Caldwell, C.H. Mathematical performance of American youth: Diminished returns of educational attainment of Asian-American parents. Educ. Sci. 2020, 10, 32. [Google Scholar] [CrossRef] [Green Version]
- Assari, S.; Caldwell, C.H.; Bazargan, M. Parental Educational attainment and relatives¡¯ Substance use of American youth: Hispanics¡¯ diminished returns. J. BioSci. Med. 2020, 8, 13. [Google Scholar] [CrossRef] [PubMed] [Green Version]
- Assari, S.B.M.; Caldwell, C.H.; Zimmerman, M.A. Educational attainment and tobacco harm knowledge among American Adults: Diminished returns of African Americans and Hispanics. Int. J. Epidemiol. Res. 2020, 7, 6–11. [Google Scholar] [CrossRef]
- Assari, S. Education attainment and obesitydifferential returns based on sexual orientation. Behav. Sci. 2019, 9, 16. [Google Scholar] [CrossRef] [Green Version]
- Assari, S. Family socioeconomic status and exposure to childhood trauma: Racial differences. Children 2020, 7, 57. [Google Scholar] [CrossRef]
- NCES. Enrolments to the 9–12 Grades in the US. Available online: https://nces.ed.gov/programs/projections/projections2020/tables/table_01.asp (accessed on 5 May 2020).
- Assari, S. Family Income Reduces Risk of Obesity for White but Not Black Children. Children 2018, 5, 73. [Google Scholar] [CrossRef] [Green Version]
- Assari, S.; Bazargan, M. Protective effects of educational attainment against cigarette smoking; Diminished returns of American Indians and Alaska natives in the national health interview survey. Int. J. Travel Med. Glob. Health 2019, 7, 105. [Google Scholar] [CrossRef]
- Assari, S. Socioeconomic determinants of systolic blood pressure; Minorities’ diminished returns. J. Health Econ. Dev. 2019, 1, 1–11. [Google Scholar] [PubMed]
- Assari, S.; Mistry, R.; Bazargan, M. Race, educational attainment, and e-cigarette use. J. Med. Res. Innov. 2020, 4, e000185. [Google Scholar] [CrossRef] [PubMed] [Green Version]
- Assari, S.; Mistry, R. Diminished return of employment on ever smoking among Hispanic Whites in Los Angeles. Health Equity 2019, 3, 138–144. [Google Scholar] [CrossRef] [PubMed] [Green Version]
- Bumpus, J.P.; Umeh, Z.; Harris, A.L. Social class and educational attainment: Do Blacks benefit less from increases in parents’ social class status? Sociol. Race Ethn. 2020, 6, 223–241. [Google Scholar] [CrossRef]
- Assari, S. Life Expectancy gain due to employment status depends on race, gender, education, and their intersections. J. Racial Ethn. Health Disparities 2018, 5, 375–386. [Google Scholar] [CrossRef] [PubMed]
- Assari, S. High income protects whites but not african americans against risk of depression. Healthcare 2018, 6, 37. [Google Scholar] [CrossRef] [Green Version]
- Assari, S.; Lapeyrouse, L.M.; Neighbors, H.W. Income and self-rated mental health: Diminished returns for high income Black Americans. Behav. Sci. 2018, 8, 50. [Google Scholar] [CrossRef] [Green Version]
- Assari, S.; Caldwell, C.H.; Zimmerman, M.A. Family structure and subsequent anxiety symptoms; Minorities’ diminished return. Brain Sci. 2018, 8, 97. [Google Scholar] [CrossRef] [Green Version]
- Chavous, T.M.; Rivas-Drake, D.; Smalls, C.; Griffin, T.; Cogburn, C. Gender matters, too: The influences of school racial discrimination and racial identity on academic engagement outcomes among African American adolescents. Dev. Psychol. 2008, 44, 637. [Google Scholar] [CrossRef]
- Assari, S.; Bazargan, M. Unequal associations between educational attainment and occupational stress across racial and ethnic groups. Int. J. Env. Res. Public Health 2019, 16, 3539. [Google Scholar] [CrossRef] [Green Version]
- Assari, S.; Lankarani, M.M.; Caldwell, C.H. Does discrimination explain high risk of depression among high-income African American men? Behav. Sci. 2018, 8, 40. [Google Scholar] [CrossRef] [Green Version]
- Assari, S.; Preiser, B.; Lankarani, M.M.; Caldwell, C.H. Subjective socioeconomic status moderates the association between discrimination and depression in African American youth. Brain Sci. 2018, 8, 71. [Google Scholar] [CrossRef] [PubMed] [Green Version]
- Bailey, Z.D.; Krieger, N.; Agenor, M.; Graves, J.; Linos, N.; Bassett, M.T. Structural racism and health inequities in the USA: Evidence and interventions. Lancet 2017, 389, 1453–1463. [Google Scholar] [CrossRef]
- Assari, S.; Boyce, S.; Akhlaghipour, G.; Bazargan, M.; Caldwell, C.H. Reward responsiveness in the Adolescent Brain Cognitive Development (ABCD) study: African Americans’ diminished returns of parental education. Brain Sci. 2020, 10, 391. [Google Scholar] [CrossRef]
- Kendler, K.S.; Turkheimer, E.; Ohlsson, H.; Sundquist, J.; Sundquist, K. Family environment and the malleability of cognitive ability: A Swedish national home-reared and adopted-away cosibling control study. Proc. Natl. Acad. Sci. USA 2015, 112, 4612–4617. [Google Scholar] [CrossRef] [Green Version]
- Rimfeld, K.; Malanchini, M.; Krapohl, E.; Hannigan, L.J.; Dale, P.S.; Plomin, R. The stability of educational achievement across school years is largely explained by genetic factors. Npj Sci. Learn. 2018, 3, 16. [Google Scholar] [CrossRef] [PubMed]
- Krieger, N. Living and dying at the crossroads: Racism, embodiment, and why theory is essential for a public health of consequence. Am. J. Public Health 2016, 106, 832–833. [Google Scholar] [CrossRef] [PubMed]
- Krieger, N.; Smith, K.; Naishadham, D.; Hartman, C.; Barbeau, E.M. Experiences of discrimination: Validity and reliability of a self-report measure for population health research on racism and health. Soc. Sci. Med. 2005, 61, 1576–1596. [Google Scholar] [CrossRef] [PubMed] [Green Version]
- Krieger, N. Does racism harm health? Did child abuse exist before 1962? On explicit questions, critical science, and current controversies: An ecosocial perspective. Am. J. Public Health 2008, 98, S20–S25. [Google Scholar] [CrossRef] [PubMed]
- Odenstad, A.; Hjern, A.; Lindblad, F.; Rasmussen, F.; Vinnerljung, B.; Dalen, M. Does age at adoption and geographic origin matter? A national cohort study of cognitive test performance in adult inter-country adoptees. Psychol Med. 2008, 38, 1803–1814. [Google Scholar] [CrossRef]


| All n = 10,262 | ||
|---|---|---|
| n | % | |
| Ethnicity | ||
| Non-Hispanic White | 6398 | 62.4 |
| Hispanic White | 2335 | 22.7 |
| Non-Hispanic Black | 1529 | 14.9 |
| Age | ||
| <18 Years | 4335 | 42.3 |
| 18+ Years | 5913 | 57.7 |
| Gender | ||
| Female | 5062 | 51.6 |
| Male | 4739 | 48.4 |
| Parents Present in the Household | ||
| One | 3258 | 32.0 |
| Two | 6939 | 68.0 |
| Parental Education | ||
| Some Highschool | 991 | 10.7 |
| Highschool Graduate | 1426 | 15.4 |
| Some College | 1611 | 17.3 |
| College Graduate | 3132 | 33.7 |
| Graduate School | 2128 | 22.9 |
| Parental Education | ||
| Some Highschool | 991 | 10.7 |
| Highschool Graduate | 1426 | 15.4 |
| Some College | 1611 | 17.3 |
| College Graduate | 3132 | 33.7 |
| Graduate School | 2128 | 22.9 |
| Mean | SD | |
| School Performance | 6.69 | 1.86 |
| Hispanic | Non-Hispanic White | Non-Hispanic Black | ||||
|---|---|---|---|---|---|---|
| n | % | n | % | n | % | |
| Parental Education | ||||||
| Some Highschool | 687 | 35.5 | 204 | 3.4 | 100 | 7.9 |
| Highschool Graduate | 422 | 21.8 | 778 | 12.8 | 226 | 17.8 |
| Some College | 349 | 18.0 | 986 | 16.2 | 276 | 21.7 |
| College Graduate | 270 | 14.0 | 2482 | 40.8 | 380 | 29.9 |
| Graduate School | 206 | 10.7 | 1632 | 26.8 | 290 | 22.8 |
| All | 1934 | 100.0 | 6082 | 100.0 | 1272 | 100.0 |
| All | Non-Hispanic Whites | Blacks | Hispanics | |||||
|---|---|---|---|---|---|---|---|---|
| Mean | SD | Mean | SD | Mean | SD | Mean | SD | |
| Some Highschool | 6.16 | 1.98 | 6.49 | 2.16 | 6.67 | 1.99 | 6.00 | 1.89 |
| Highschool Graduate | 6.30 | 1.91 | 6.43 | 1.98 | 6.16 | 1.84 | 6.13 | 1.81 |
| Some College | 6.58 | 1.87 | 6.77 | 1.86 | 6.22 | 1.80 | 6.32 | 1.89 |
| College Graduate | 6.86 | 1.80 | 6.99 | 1.78 | 6.43 | 1.76 | 6.21 | 1.87 |
| Graduate School | 7.34 | 1.58 | 7.49 | 1.50 | 6.84 | 1.76 | 6.85 | 1.66 |
| p value | <0.001 | <0.001 | <0.001 | <0.001 | ||||
| All | Non-Hispanic Whites | Non-Hispanic Blacks | Hispanics | ||||||||||
|---|---|---|---|---|---|---|---|---|---|---|---|---|---|
| (J) Parental Education | Mean Difference (I-J) | SE | p | Mean Difference (I-J) | SE | p | Mean Difference (I-J) | SE | p | Mean Difference (I-J) | SE | p | |
| Some Highschool | Highschool Graduate | −0.13 | 0.07 | 0.368 | 0.05 | 0.14 | 0.995 | 0.51 | 0.22 | 0.127 | −0.13 | 0.11 | 0.764 |
| Some College | −0.42 * | 0.07 | <0.001 | −0.29 | 0.14 | 0.215 | 0.45 | 0.21 | 0.206 | −0.33 | 0.12 | 0.054 | |
| College Graduate | −0.69 * | 0.07 | <0.001 | −0.51 * | 0.13 | 0.001 | 0.24 | 0.20 | 0.772 | −0.22 | 0.13 | 0.466 | |
| Graduate School | −1.18 * | 0.07 | <0.001 | −1.01 * | 0.13 | <0.001 | −0.17 | 0.21 | 0.924 | −0.86 * | 0.15 | <0.001 | |
| Highschool Graduate | Some Highschool | 0.13 | 0.07 | 0.368 | −0.05 | 0.14 | 0.995 | −0.51 | 0.22 | 0.127 | 0.13 | 0.11 | 0.764 |
| Some College | −0.28 * | 0.07 | <0.001 | −0.34 * | 0.08 | 0.001 | −0.06 | 0.16 | 0.995 | −0.19 | 0.13 | 0.598 | |
| College Graduate | −0.56 * | 0.06 | <0.001 | −0.56 * | 0.07 | <0.001 | −0.27 | 0.15 | 0.365 | −0.08 | 0.14 | 0.977 | |
| Graduate School | −1.04 * | 0.06 | <0.001 | −1.06 * | 0.08 | <0.001 | −0.68 * | 0.16 | <0.001 | −0.72 * | 0.16 | <0.001 | |
| Some College | Some Highschool | 0.42 * | 0.07 | <0.001 | 0.29 | 0.14 | 0.215 | −0.45 | 0.21 | 0.206 | 0.33 | 0.12 | 0.054 |
| Highschool Graduate | 0.28 * | 0.07 | <0.001 | 0.34 * | 0.08 | 0.001 | 0.06 | 0.16 | 0.995 | 0.19 | 0.13 | 0.598 | |
| College Graduate | −0.28 * | 0.06 | <0.001 | −0.22 * | 0.07 | 0.009 | −0.21 | 0.14 | 0.565 | 0.11 | 0.15 | 0.950 | |
| Graduate School | −0.76 * | 0.06 | <0.001 | −0.72 * | 0.07 | <0.001 | −0.62 * | 0.15 | 0.000 | −0.53 * | 0.16 | 0.010 | |
| College Graduate | Some Highschool | 0.69 * | 0.07 | <0.001 | 0.51 * | 0.13 | 0.001 | −0.24 | 0.20 | 0.772 | 0.22 | 0.13 | 0.466 |
| Highschool Graduate | 0.56 * | 0.06 | <0.001 | 0.56 * | 0.07 | <0.001 | 0.27 | 0.15 | 0.365 | 0.08 | 0.14 | 0.977 | |
| Some College | 0.28 * | 0.06 | <0.001 | 0.22 * | 0.07 | 0.009 | 0.21 | 0.14 | 0.565 | −0.11 | 0.15 | 0.950 | |
| Graduate School | −0.49 * | 0.05 | <0.001 | −0.50 * | 0.06 | <0.001 | −0.41 * | 0.14 | 0.031 | −0.64 * | 0.17 | 0.002 | |
| Graduate School | Some Highschool | 1.18 * | 0.07 | <0.001 | 1.01 * | 0.13 | <0.001 | 0.17 | 0.21 | 0.924 | 0.86 * | 0.15 | <0.001 |
| Highschool Graduate | 1.04 * | 0.06 | <0.001 | 1.06 * | 0.08 | <0.001 | 0.68 * | 0.16 | <0.001 | 0.72 * | 0.16 | <0.001 | |
| Some College | 0.76 * | 0.06 | <0.001 | 0.72 * | 0.07 | <0.001 | 0.62 * | 0.15 | <0.001 | 0.53 * | 0.16 | 0.010 | |
| College Graduate | 0.49 * | 0.05 | <0.001 | 0.50 * | 0.06 | <0.001 | 0.41 * | 0.14 | 0.031 | 0.64 * | 0.17 | 0.002 |
| 1 | 2 | 3 | 4 | 5 | |
|---|---|---|---|---|---|
| All | n | Mean | Mean | Mean | Mean |
| Some Highschool | 991 | 6.16 | |||
| Highschool Graduate | 1426 | 6.30 | |||
| Some College | 1611 | 6.58 | |||
| College Graduate | 3132 | 6.86 | |||
| Graduate School | 2128 | 7.34 | |||
| p value | 0.212 | 1.000 | 1.000 | 1.000 | |
| NHWs | |||||
| Some Highschool | 778 | 6.43 | |||
| Highschool Graduate | 204 | 6.49 | |||
| Some College | 986 | 6.77 | |||
| College Graduate | 2482 | 6.99 | |||
| Graduate School | 1632 | 7.49 | |||
| p value | 0.985 | 0.192 | 1.000 | ||
| NHBs | |||||
| Some Highschool | 226 | 6.16 | |||
| Highschool Graduate | 276 | 6.22 | 6.22 | ||
| Some College | 380 | 6.43 | 6.43 | 6.43 | |
| College Graduate | 100 | 6.67 | 6.67 | ||
| Graduate School | 290 | 6.84 | |||
| p value | 0.528 | 0.083 | 0.145 | ||
| HWs | |||||
| Some Highschool | 687 | 6.00 | |||
| Highschool Graduate | 422 | 6.13 | |||
| Some College | 270 | 6.21 | |||
| College Graduate | 349 | 6.32 | |||
| Graduate School | 206 | 6.85 | |||
| p value | 0.155 | 1.000 |
© 2020 by the authors. Licensee MDPI, Basel, Switzerland. This article is an open access article distributed under the terms and conditions of the Creative Commons Attribution (CC BY) license (http://creativecommons.org/licenses/by/4.0/).
Share and Cite
Assari, S.; Boyce, S.; Bazargan, M.; Caldwell, C.H. Diminished Returns of Parental Education in Terms of Youth School Performance: Ruling out Regression toward the Mean. Children 2020, 7, 74. https://doi.org/10.3390/children7070074
Assari S, Boyce S, Bazargan M, Caldwell CH. Diminished Returns of Parental Education in Terms of Youth School Performance: Ruling out Regression toward the Mean. Children. 2020; 7(7):74. https://doi.org/10.3390/children7070074
Chicago/Turabian StyleAssari, Shervin, Shanika Boyce, Mohsen Bazargan, and Cleopatra H. Caldwell. 2020. "Diminished Returns of Parental Education in Terms of Youth School Performance: Ruling out Regression toward the Mean" Children 7, no. 7: 74. https://doi.org/10.3390/children7070074
APA StyleAssari, S., Boyce, S., Bazargan, M., & Caldwell, C. H. (2020). Diminished Returns of Parental Education in Terms of Youth School Performance: Ruling out Regression toward the Mean. Children, 7(7), 74. https://doi.org/10.3390/children7070074