

Carbon Dioxide and Hemoglobin at Presentation with Hypertrophic Pyloric Stenosis—Are They Relevant? Cohort Study and Current Opinions

 ,
,  and
and
Abstract
Highlights
- In infantile hypertrophic pyloric stenosis, recurrent vomiting of gastric contents leads to metabolic alkalosis, which is compensated for by an increase in carbon dioxide.
- Carbon dioxide acts as a respiratory stimulus a priori, but at high concentrations it may have a depressant effect on respiration.
- The role of blood carbon dioxide tension (pCO2) in the development of respiratory problems remains unclear.
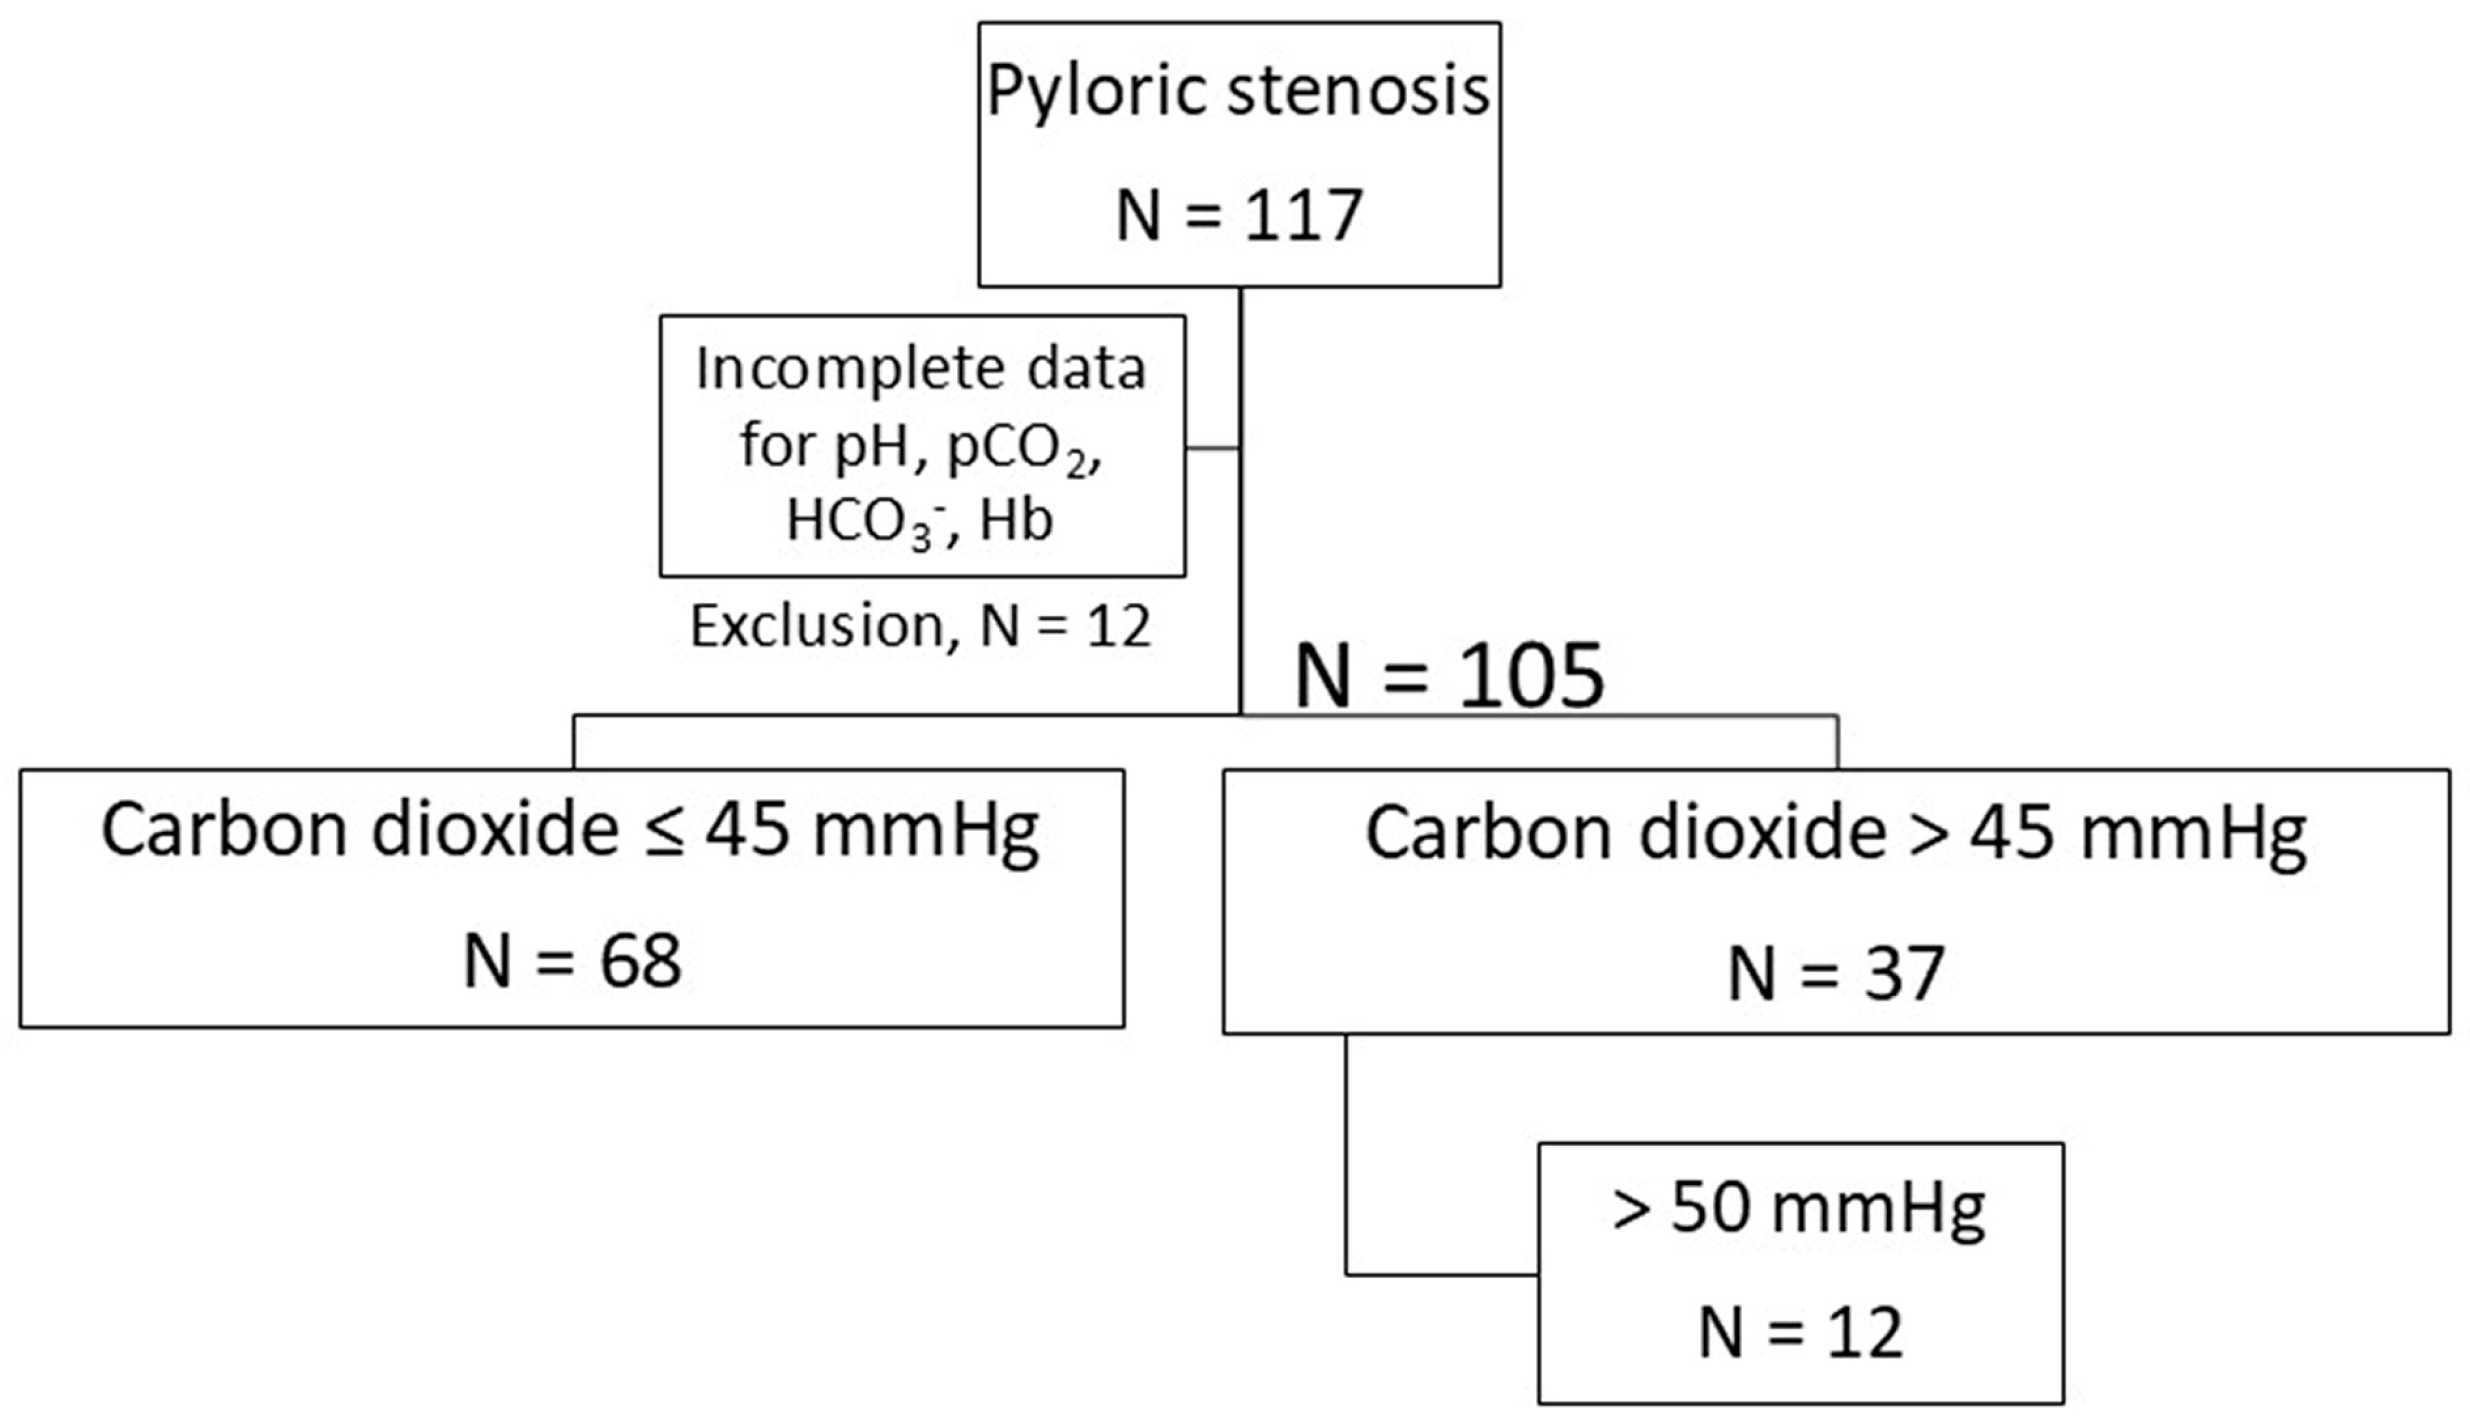
- A retrospective monoinstitutional cohort study was conducted on 105 infants.
- The following parameters were recorded on admission: biometrics, acid/base status, hemoglobin, lactate and sodium.
- The present study aims to determine the interaction between hemoglobin and the other acid/base components on pCO2.
- Hypercapnia was observed in a relevant number of children.
- Infants exhibiting hypercapnia have been observed to demonstrate signs of hemoconcentration.
- A positive correlation was identified between the concentration of hemoglobin and the partial pressure of carbon dioxide.
- The lactate level was not affected by the elevated partial pressure of carbon dioxide (pCO2).
- There is a dependence of pCO2 on hemoglobin.
- An increase in carbon dioxide cannot easily be attributed to reduced carbon dioxide transport function due to hemoglobin deficiency.
- The physico-chemical Stewart model is a theoretical framework that can be utilized to elucidate the complex pathophysiology of gastric alkalosis in IHPS. This approach offers a novel perspective on the investigation of this condition.
Abstract
1. Introduction
2. Methods
2.1. Study Design
2.2. Study Framework
- First, we determined the respective mean and dispersion values for the investigated parameters (Table 1).
- In the second step, we carried out corresponding correlation analyses focusing on the parameters pCO2, hemoglobin and lactate (Table 2). Additionally, we determined the quantitative dependence of the carbon dioxide partial pressure on standard bicarbonate and hemoglobin (linear regression analysis).
- We used multivariate regression analysis to determine the main factors influencing the carbon dioxide partial pressure (Table 3).
- A group comparison of biometric and biochemical parameters should reveal the differences between infants with elevated pCO2 values and those with normal pCO2 values (Table 4).
- Finally, we investigated the constellations
2.3. Clinical Pathway of Our Patients
2.4. Definitions and Stratification of Patients
2.5. Technical Considerations
2.6. Statistical Analysis
3. Results
3.1. Basic Data
3.2. Correlation Analysis
3.3. Linear Regression Analysis
3.4. Identification of the Main Factors That Determine pCO2
3.5. Comparison of Infants with Normocapnia vs. Elevated pCO2 (Hyperkapnia)
3.6. Comparison of pCO2 and Hemoglobin in Premature vs. Full-Term Infants
3.7. Comparison of Infants with Low Hemoglobin vs. Infants with Hemoglobin Above 10 g/dL
4. Discussion
4.1. Carbon Dioxide
4.2. Hypercapnia
4.3. Hemoglobin
4.4. Hemoconcentration
4.5. Anemia
4.6. Lactate
4.7. Preterms
4.8. Clinical Considerations
4.9. Limitations
5. Conclusions
Author Contributions
Funding
Institutional Review Board Statement
Informed Consent Statement
Data Availability Statement
Conflicts of Interest
References
- Jobson, M.; Hall, N.J. Contemporary management of pyloric stenosis. Semin. Pediatr. Surg. 2016, 25, 219–224. [Google Scholar] [CrossRef]
- Oetzmann von Sochaczewski, C.; Muensterer, O.J. The incidence of infantile hypertrophic pyloric stenosis nearly halved from 2005 to 2017: Analysis of German administrative data. Pediatr. Surg. Int. 2021, 37, 579–585. [Google Scholar] [CrossRef]
- Donda, K.; Asare-Afriyie, B.; Ayensu, M.; Sharma, M.; Amponsah, J.K.; Bhatt, P.; Hesse, M.A.; Dapaah-Siakwan, F. Pyloric stenosis: National trends in the incidence rate and resource use in the United States from 2012 to 2016. Hosp. Pediatr. 2019, 9, 923–932. [Google Scholar] [CrossRef]
- van den Bunder, F.A.I.M.; Allema, J.H.; Benninga, M.A.; de Blaauw, I.; van de Brug, T.; Dulk, M.D.; Hulscher, J.B.F.; Keyzer-Dekker, C.M.G.; Witvliet, M.J.; van Heurn, E.L.W.; et al. The Dutch incidence of infantile hypertrophic pyloric stenosis and the influence of seasons. Eur. J. Pediatr. Surg. 2021, 31, 525–529. [Google Scholar] [CrossRef]
- Saula, P.W.; Hadley, G.P. Hypertrophic pyloric stenosis in the third world. Trop. Dr. 2011, 41, 204–210. [Google Scholar] [CrossRef]
- Tiao, M.M.; Tsai, S.S.; Kuo, H.W.; Yang, C.-Y. Epidemiological features of infantile hypertrophic pyloric stenosis in Taiwan: A national study 1996–2004. J. Gastroenterol. Hepatol. 2011, 26, 78–81. [Google Scholar] [CrossRef]
- Oakley, E.A.; Barnett, P.L. Is acid base determination an accurate predictor of pyloric stenosis? J. Paediatr. Child Health 2000, 36, 587–589. [Google Scholar] [CrossRef]
- Glatstein, M.; Carbell, G.; Boddu, S.K.; Bernardini, A.; Scolnik, D. The changing clinical presentation of hypertrophic pyloric stenosis: The experience of a large, tertiary care pediatric hospital. Clin. Pediatr. 2011, 50, 192–195. [Google Scholar] [CrossRef]
- van den Bunder, F.A.I.M.; van Woensel, J.B.M.; Stevens, M.F.; van de Brug, T.; van Heurn, L.W.E.; Derikx, J.P. Respiratory problems owing to severe metabolic alkalosis in infants presenting with hypertrophic pyloric stenosis. J. Pediatr. Surg. 2020, 55, 2772–2776. [Google Scholar] [CrossRef]
- Sur, M.; Hashmi, M.F. Alkalosis. In StatPearls; StatPearls Publishing: Treasure Island, FL, USA, 2024. Available online: https://www.ncbi.nlm.nih.gov/books/NBK545269/ (accessed on 31 January 2024).
- Oppersma, E.; Doorduin, J.; van der Hoeven, J.G.; Veltink, P.H.; van Hees, H.W.H.; Heunks, L.M.A. The effect of metabolic alkalosis on the ventilatory response in healthy subjects. Respir. Physiol. Neurobiol. 2018, 249, 47–53. [Google Scholar] [CrossRef]
- van den Bunder, F.A.I.M.; Lvan Wijk van Woensel, J.B.M.; Stevens, M.F.; van Heurn, L.W.E.; Derikx, J.P.M. Perioperative apnea in infants with hypertrophic pyloric stenosis: A systematic review. Paediatr. Anaesth. 2020, 30, 749–758. [Google Scholar] [CrossRef] [PubMed]
- van den Bunder, F.A.I.M.; Stevens, M.F.; van Woensel, J.B.M.; van de Brug, T.; van Heurn, L.E.; Derikx, J.P. Perioperative hypoxemia and postoperative respiratory events in infants with hypertrophic pyloric stenosis. Eur. J. Pediatr. Surg. 2023, 33, 485–492. [Google Scholar] [CrossRef]
- Camporesi, A.; Diotto, V.; Zoia, E.; Rotta, S.; Tarantino, F.; Eccher, L.M.G.; Calcaterra, V.; Pelizzo, G.; Gemma, M. Postoperative apnea after pyloromyotomy for infantile hypertrophic pyloric stenosis. World J. Pediatr. Surg. 2022, 5, e000391. [Google Scholar] [CrossRef] [PubMed]
- Zierk, J.; Hirschmann, D.; Toddenroth, F.; Arzideh, F.; Haeckel, R.; Bertram, A.; Cario, H.; Frühwald, M.C.; Groß, H.-J.; Groening, A.; et al. Next-generation reference intervals for pediatric hematology. Clin. Chem. Lab. Med. 2019, 57, 1595–1607. [Google Scholar] [CrossRef]
- Emmett, M. Metabolic alkalosis: A brief pathophysiologic review. Clin. J. Am. Soc. Nephrol. 2020, 15, 1848–1856. [Google Scholar] [CrossRef]
- Chipps, B.E.; Moynihan, R.; Schieble, T.; Stene, R.; Feaster, W.; Marr, C.; Greenholz, S.; Poulos, N.; Groza, D.; Staff of Sutter Community Hospitals Sleep Disorders Center. Infants undergoing pyloromyotomy are not at risk for postoperative apnea. Pediatr. Pulmonol. 1999, 27, 278–281. [Google Scholar] [CrossRef]
- Pappano, D. Alkalosis-induced respiratory depression from infantile hypertrophic pyloric stenosis. Pediatr. Emerg. Care 2011, 27, 124. [Google Scholar] [CrossRef]
- Tigges, C.R.; Bigham, M.T. Hypertrophic pyloric stenosis: It can take your breath away. Air Med. J. 2012, 31, 45–48. [Google Scholar] [CrossRef]
- Ezomike, U.O.; Ekenze, S.O.; Amah, C.C.; Nwankwo, E.P.; Obianyo, N.E. Infantile hypertrophic pyloric stenosis—Our experience and challenges in a developing country. Afr. J. Paediatr. Surg. 2018, 15, 26–30. [Google Scholar] [CrossRef]
- Bašković, M.; Sinjeri, D. Diagnostic accuracy of acid-base status in infants with hypertrophic pyloric stenosis. Children 2022, 9, 1815. [Google Scholar] [CrossRef]
- Shanbhogue, L.K.R.; Sikdar, T.; Jackson, M.; Lloyd, A.D. Serum electrolytes and capillary blood gases in the management of hypertrophic pyloric stenosis. Br. J. Surg. 1992, 79, 251–253. [Google Scholar] [CrossRef] [PubMed]
- Smith, G.A.; Mihalov, L.; Shields, B.J. Diagnostic aids in the differentiation of pyloric stenosis from severe gastroesophageal reflux during early infancy: The utility of serum bicarbonate and serum chloride. Am. J. Emerg. Med. 1999, 17, 28–31. [Google Scholar] [CrossRef]
- Vinycomb, T.I.; Laslett, K.; Gwini, S.M.; Teague, W.; Nataraja, R.M. Presentation and outcomes in hypertrophic pyloric stenosis: An 11-year review. J. Paediatr. Child Health 2019, 55, 1183–1187. [Google Scholar] [CrossRef] [PubMed]
- Deem, S.; Alberts, M.K.; Bishop, M.J.; Bidani, A.; Swenson, E.R. CO2 transport in normovolemic anemia: Complete compensation and stability of blood CO2 tensions. J. Appl. Physiol. 1997, 83, 240–246. [Google Scholar] [CrossRef] [PubMed]
- Barrett, K.E.; Barman, S.M.; Boitano, S.S.; Brooks, H. Ganong’s Review of Medical Physiology, 24th ed.; McGraw-Hill Medical: New York, NY, USA, 2012. [Google Scholar]
- Feng, Z.; Nie, Y.; Zhang, Y.; Li, Q.; Xia, H.; Gong, S.; Huang, H.; Huang, L.-M. The clinical features of infantile hypertrophic pyloric stenosis in Chinese Han Population: Analysis from 1998 to 2010. PLoS ONE 2014, 9, e88925. [Google Scholar] [CrossRef]
- Wong, S.K.; Chim, M.; Allen, J.; Butler, A.; Tyrrell, J.; Hurley, T.; McGovern, M.; Omer, M.; Lagan, N.; Meehan, J.; et al. Carbon dioxide levels in neonates: What are safe parameters? Pediatr. Res. 2022, 91, 1049–1056. [Google Scholar] [CrossRef]
- Permentier, K.; Vercammen, S.; Soetaert, S.; Schellemans, C. Carbon dioxide poisoning: A literature review of an often forgotten cause of intoxication in the emergency department. Int. J. Emerg. Med. 2017, 10, 14. [Google Scholar] [CrossRef]
- Wikipedia Contributors. Hypercapnia. Wikipedia, The Free Encyclopedia. Available online: https://en.wikipedia.org/w/index.php?title=Hypercapnia&oldid=1229466630 (accessed on 8 October 2024).
- Berend, K. Diagnostic use of base excess in acid-base disorders. N. Engl. J. Med. 2018, 378, 1419–1428. [Google Scholar] [CrossRef]
- Delivoria-Papadopoulos, M.; McGowan, J.E. Oxygen transport and delivery. In Fetal and Neonatal Physiology, 4th ed.; Polin, R.A., Fox, W.W., Abman, S.H., Eds.; Elsevier, W.B. Saunders Company: Philadelphia, PA, USA, 2011; Volume 1, pp. 970–979. [Google Scholar]
- van den Bunder, F.A.I.M.; Hall, N.J.; van Heurn, L.W.E.; Derikx, J.P.M. A Delphi analysis to reach consensus on preoperative care in infants with hypertrophic pyloric stenosis. Eur. J. Pediatr. Surg. 2020, 30, 497–504. [Google Scholar] [CrossRef]
- Kedir, H.; Miller, R.; Syed, F.; Hakim, M.; Walia, H.; Tumin, D.; McKee, C.; Tobias, J.D. Association between anemia and postoperative complications in infants undergoing pyloromyotomy. J. Pediatr. Surg. 2019, 54, 2075–2079. [Google Scholar] [CrossRef]
- Nissen, N.; Cernaianu, G.; Thraenhardt, R.; Vahdad, M.R.; Barenberg, K.; Tröbs, R.-B. Does metabolic alkalosis influence cerebral oxygenation in infantile hypertrophic pyloric stenosis? J. Surg. Res. 2017, 212, 229–237. [Google Scholar] [CrossRef] [PubMed]
- Li, X.; Yang, Y.; Zhang, B.; Lin, X.; Fu, X.; An, Y.; Zou, Y.; Wang, J.-X.; Wang, Z.; Yu, T. Lactate metabolism in human health and disease. Signal Transduct. Target. Ther. 2022, 7, 305. [Google Scholar] [CrossRef]
- Cohen, R.D.; Simpson, R. Lactate metabolism. Anesthesiology 1975, 43, 661–673. [Google Scholar] [CrossRef] [PubMed]
- Huang, I.F.; Tiao, M.M.; Chiou, C.C.; Shih, H.; Hu, H.; Ruiz, J.P. Infantile hypertrophic pyloric stenosis before 3 weeks of age in infants and preterm babies. Pediatr. Int. 2011, 53, 18–23. [Google Scholar] [CrossRef]
- Stark, C.M.; Rogers, P.L.; Eberly, M.D.; Nylund, C.M. Association of prematurity with the development of infantile hypertrophic pyloric stenosis. Pediatr. Res. 2015, 78, 218–222. [Google Scholar] [CrossRef]
- Costanzo, C.M.; Vinocur, C.; Berman, L. Prematurity affects age of presentation of pyloric stenosis. Clin. Pediatr. 2017, 56, 127–131. [Google Scholar] [CrossRef] [PubMed]
- Lunger, F.; Staerkle, R.F.; Muff, J.L.; Fink, L.; Holland-Cunz, S.G.; Vuille-Dit-Bille, R.N. Open versus laparoscopic pyloromyotomy for pyloric stenosis. A systematic review and meta-analysis. J. Surg. Res. 2022, 274, 1–8. [Google Scholar] [CrossRef]
- Alain, J.L.; Grousseau, D.; Longis, B.; Ugazzi, M.; Terrier, G. Extramucous pyloromyotomy by laparoscopy. Chir. Pediatr. 1990, 31, 223–224. [Google Scholar]
- Tan, R.N.G.B.; Pauws, S.C.; van Loon, E.; Smits, V.E.H.J.; Lopriore, E.; Pas, A.B.T. Correlation and Interchangeability of Venous and Capillary Blood Gases in Non-Critically Ill Neonates. Front. Pediatr. 2018, 6, 89. [Google Scholar] [CrossRef]
- Dent, R.G.; Boniface, D.R.; Fyffe, J.; Yousef, Z. The effects of time delay and temperature on capillary blood gas measurements. Respir. Med. 1999, 93, 794–797. [Google Scholar] [CrossRef]
- Shastri, L.; Kjærgaard, S.; Thyrrestrup, P.S.; Rees, S.E.; Thomsen, L.P. Is venous blood a more reliable description of acid-base state following simulated hypo- and hyperventilation? Scand. J. Trauma Resusc. Emerg. Med. 2021, 29, 35. [Google Scholar] [CrossRef] [PubMed]
- Xie, H.; Lv, S.; Chen, S.; Pang, Z.; Ye, D.; Guo, J.; Xu, W.; Jin, W. Agreement of potassium, sodium, glucose, and hemoglobin measured by blood gas analyzer with dry chemistry analyzer and complete blood count analyzer: A two-center retrospective analysis. Front. Med. 2022, 9, 799642. [Google Scholar] [CrossRef] [PubMed]
- Killilea, D.W.; Kuypers, F.A.; Larkin, S.K.; Schultz, K. Blood draw site and analytic device influence hemoglobin measurements. PLoS ONE 2022, 17, e0278350. [Google Scholar] [CrossRef] [PubMed]


| Parameter | N | Median (IQR) | Mean (SD) | p-Value # |
|---|---|---|---|---|
| Gestational age [weeks] | 92 | 39.0 (3.0) | 38.0 (2.8) | <0.001 |
| Age at presentation [d] | 105 | 36.0 (19) | 40.4 (16.4) | <0.001 |
| Birth weight [g] | 102 | 3215 (840) | 3213 (681) | 0.004 |
| Weight at presentation [g] | 105 | 3850 (860) | 3917 (740) | 0.245 |
| pH | 105 | 7.5 (0.1) | 7.5 (0.1) | <0.001 |
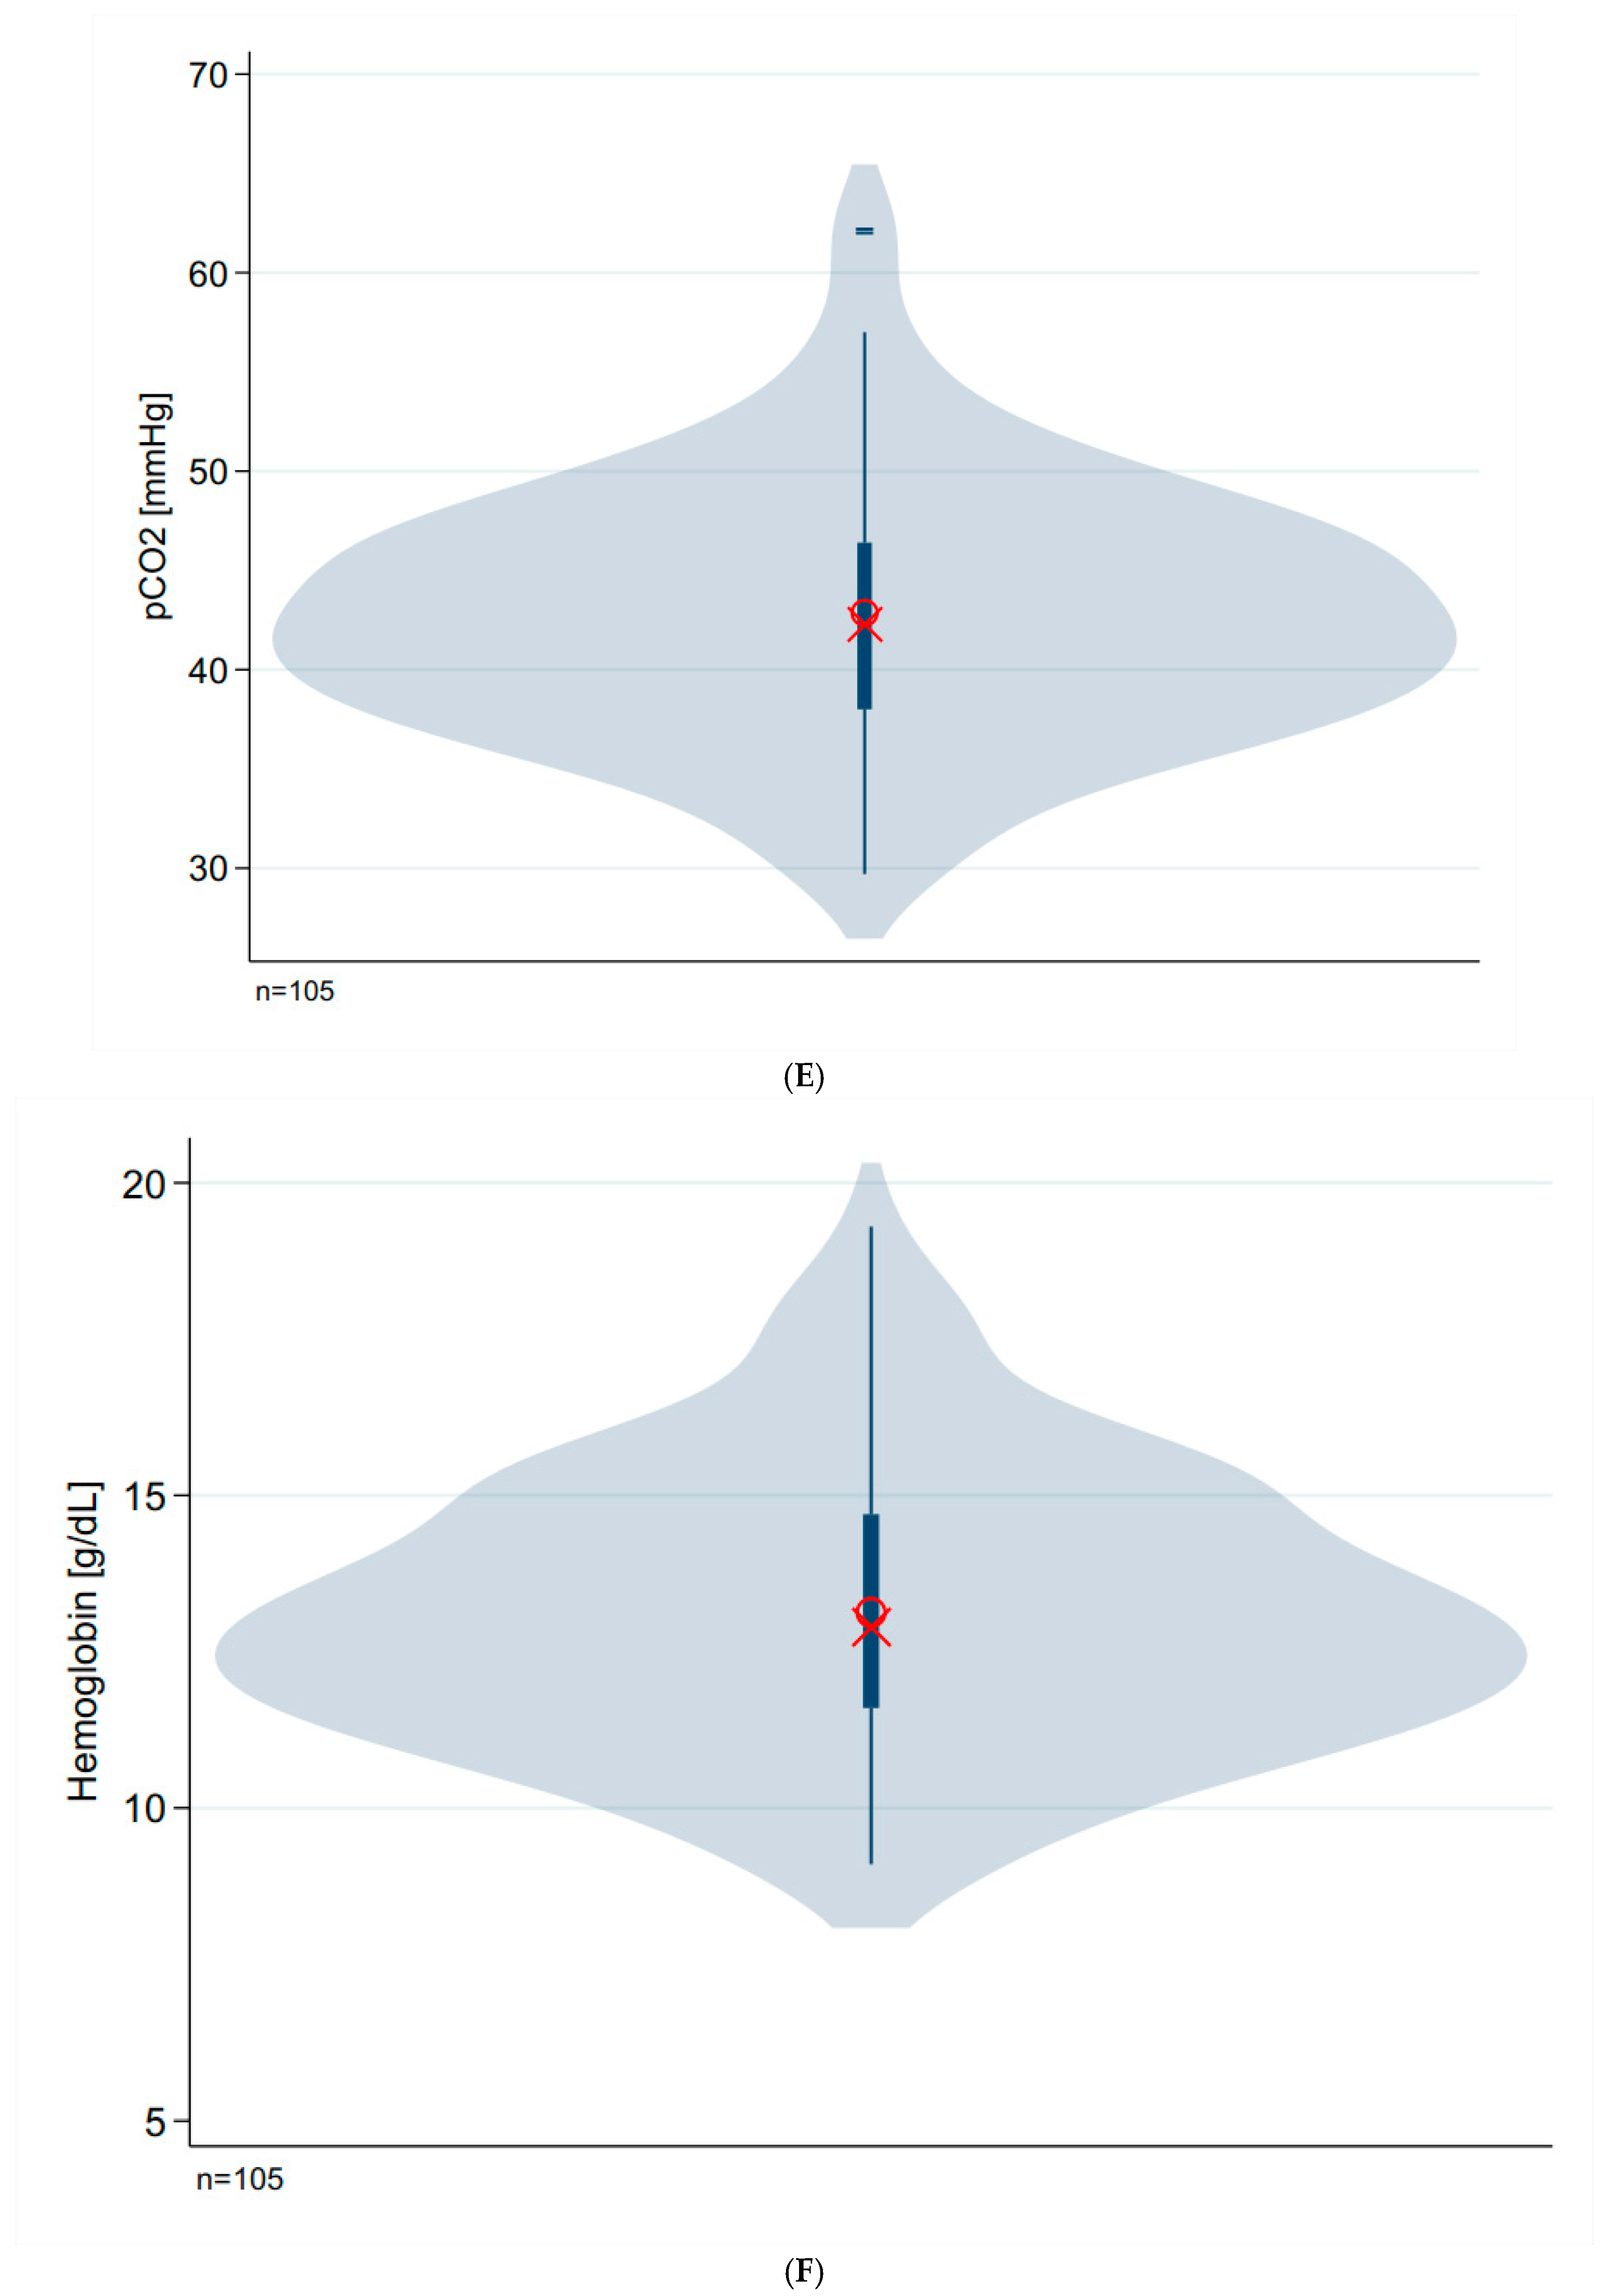
| pCO2 [mmHg] | 105 | 42.0 (8.0) | 42.9 (6.2) | 0.087 |
| SBicarb, HCO3− [mmol/L] | 105 | 28.0 (5.3) | 29.4 (5.5) | <0.001 |
| BE [mmol/L] | 105 | 4.6 (6.4) | 6.1 (6.5) | <0.001 |
| Sodium [mmol/L] | 105 | 137.0 (3.0) | 136.9 (3.2) | <0.001 |
| Lactate [mmol/L] | 80 | 1.8 (1.2) | 2.0 (1.2) | <0.001 |
| Hemoglobin [g/dL] | 105 | 12.9 (3.1) | 13.1 (2.2) | 0.080 |
| Hematocrit | 98 | 36.5 (10.0) | 37.9 (7.7) | 0.001 |
| MCHC [g/dL] | 98 | 35.1 (2.7) | 35 (2.6) | 0.001 |
| Parameter | N | rho (95%-CI) | p-Value |
|---|---|---|---|
| Carbon dioxide partial pressure (pCO2) | |||
| Gestational age [weeks] | 92 | −0.12 (−0.32; 0.09) | 0.250 |
| Birth weight [g] | 102 | 0.03 (−0.17; 0.22) | 0.783 |
| Weight at admission [g] | 105 | −0.10 (−0.29; 0.09) | 0.290 |
| pH | 105 | −0.11 (−0.30; 0.08) | 0.262 |
| SBicarb, HCO3− [mmol/L] | 105 | 0.48 (0.32; 0.62) | <0.001 |
| BE [mmol/L] | 105 | 0.52 (0.36; 0.65) | <0.001 |
| Hemoglobin [g/dL] | 105 | 0.20 (0.01; 0.38) | 0.042 |
| MCHC [g/dL] | 98 | −0.13 (−0.32; 0.07) | 0.214 |
| Lactate [mmol/L] | 80 | −0.09 (−0.30; 0.14) | 0.443 |
| Hemoglobin | |||
| Gestational age [weeks] | 92 | 0.25 (0.05; 0.43) | 0.016 |
| Birth weight [g] | 102 | 0.30 (0.11; 0.46) | 0.003 |
| Weight at admission [g] | 105 | −0.30 (−0.46; −0.11) | 0.002 |
| pH | 105 | 0.23 (0.04; 0.40) | 0.020 |
| SBicarb, HCO3− [mmol/L] | 105 | 0.24 (0.05; 0.41) | 0.013 |
| BE [mmol/L] | 105 | 0.28 (0.09; 0.44) | 0.004 |
| MCHC [g/dL] | 98 | −0.18 (−0.37; 0.02) | 0.073 |
| Lactate [mmol/L] | 80 | −0.07 (−0.29; 0.15) | 0.520 |
| Lactate | |||
| Gestational age [weeks] | 73 | −0.01 (−0.24; 0.22) | 0.908 |
| Birth weight [g] | 79 | −0.06 (−0.28; 0.16) | 0.570 |
| Weight at admission [g] | 80 | 0.06 (−0.16; 0.28) | 0.585 |
| pH | 80 | 0.10 (−0.12; 0.31) | 0.382 |
| SBicarb, HCO3− [mmol/L] | 80 | 0.10 (−0.12; 0.31) | 0.368 |
| BE [mmol/L] | 80 | 0.10 (−0.12; 0.31) | 0.369 |
| MCHC [g/dL] | 75 | −0.13 (−0.34; 0.10) | 0.279 |
| Full Model | Stepwise with SBicarb | |||
|---|---|---|---|---|
| Coeff (95%-CI) | p-Value | Coeff. (95%-CI) | p-Value | |
| Weight | 0.20 (0.25; 0.64) | 0.388 | † | † |
| pH | −125.7 (−134.3; −117.1) | <0.001 | −126.9 (−138.4; −115.3) | <0.001 |
| SBicarb | −0.21 (−0.86; 0.43) | 0.511 | 1.6 (1.4; 1.9) | <0.001 |
| Base excess | 1.6 (1.1; 2.0) | <0.001 | N.a. | N.a. |
| Hemoglobin | 0.22 (0.08; 0.37) | 0.003 | 0.39 (0.15; 0.63) | 0.002 |
| Constant | 973.0 (913.1; 1033.0) | <0.001 | 936.4 (854.0; 1018.9) | <0.001 |
| AIC | 425.0 | † | 479.0 | † |
| Parameter | Normal pCO2 ≤ 45 mmHg | N | p-Value Normal pCO2 # | pCO2 > 45 mm Hypercapnia Hy | N | p-Value Elevated pCO2 # | p-Value * |
|---|---|---|---|---|---|---|---|
| Gestational age [weeks] | 39 (3) | 64 | < 0.001 | 38 (2.5) | 28 | 0.001 | 0.128 [M] |
| Birthweight [g] | 3162 (1010) | 68 | 0.069 | 3315 (690) | 34 | 0.010 | 0.678 [M] |
| pH | 7.5 (0.1) | 68 | 0.009 | 7.5 (0.1) | 37 | 0.017 | 0.561 [M] |
| pCO2 [mmHg] | 39.8 (5.0) | 68 | † | 48 (5.0) | 37 | † | † |
| SBicarb, HCO3− [mmol/L] | 27.0 (3.7) | 68 | <0.001 | 31.1 (5.3) | 37 | <0.001 | <0.001 [M] |
| BE [mmol/L] | 3.0 (4.6) | 68 | <0.001 | 8.1 (5.9) | 37 | <0.001 | <0.001 [M] |
| Sodium [mmol/L] | 137 (2.5) | 68 | 0.320 | 137 (3.0) | 37 | 0.001 | 0.628 [M] |
| Lactate [mmol/L] | 1.8 (1.4) | 54 | <0.001 | 1.4 (1.2) | 26 | <0.001 | 0.025 [M] |
| Hemoglobin [g/dL] | 12.4 (2.8) | 68 | 0.001 | 13.6 (2,6) | 37 | 0.198 | 0.026 [M] |
| Hematocrit | 35.6 (8.0) | 65 | 0.001 | 40.0 (8.7) | 33 | 0.432 | 0.031 [M] |
| MCHC [g/dL] | 35.5 (2.9) | 65 | 0.020 | 34.6 (2.1) | 33 | 0.003 | 0.077 [M] |
| Preterm | N | p-Value Preterm # | Full Term | N | p-Value Term # | p-Value * | |
|---|---|---|---|---|---|---|---|
| Gestational age [weeks] | 35.0 (2.8) | 22 | <0.001 | 39 (2.0) | 70 | 0.120 | † |
| Age at presentation [d] | 46.0 (25.5) | 22 | 0.976 | 35.0 (17) | 70 | <0.001 | 0.074 [M] |
| pCO2 [mmHg] | 41.9 (8.4) | 22 | 0.009 | 41.7 (8.4) | 70 | 0.271 | 0.769 [M] |
| Hemoglobin [g/dL] | 12.2 (1.4) | 22 | 0.308 | 13.4 (3.9) | 70 | 0.222 | 0.006 [t] |
| MCHC [g/dL] | 34.4 (3.8) | 22 | 0.136 | 35.4 (2.8) | 66 | <0.001 | 0.673 [M] |
| Low Hb | N | p-Value, Low Hb # | Normal Hb | N | p-Value, Low Hb # | p-Value * | |
|---|---|---|---|---|---|---|---|
| Gestational age [weeks] | 37 (4) | 6 | 0.326 | 39 (3.0) | 86 | <0.001 | 0.044 [M] |
| Age at presentation [d] | 58 (12) | 6 | 0.413 | 36 (18) | 99 | <0.001 | 0.001 [M] |
| pCO2 [mmHg] | 47.5 (4) | 6 | 0.269 | 42 (18) | 99 | 0.376 | 0.135 [t] |
| Hemoglobin [g/dL] | 9.2 (0.5) | 6 | 0.210 | 13.0 (3.2) | 99 | 0.001 | † |
| MCHC [g/dL] | 34.7 (4) | 6 | 0.741 | 35.2 (2.6) | 92 | <0.001 | 0.932 [M] |
Disclaimer/Publisher’s Note: The statements, opinions and data contained in all publications are solely those of the individual author(s) and contributor(s) and not of MDPI and/or the editor(s). MDPI and/or the editor(s) disclaim responsibility for any injury to people or property resulting from any ideas, methods, instructions or products referred to in the content. |
© 2025 by the authors. Licensee MDPI, Basel, Switzerland. This article is an open access article distributed under the terms and conditions of the Creative Commons Attribution (CC BY) license (https://creativecommons.org/licenses/by/4.0/).
Share and Cite
Tröbs, R.-B.; Niggemann, H.; Cernaianu, G.; Lipphaus, A.; Nissen, M. Carbon Dioxide and Hemoglobin at Presentation with Hypertrophic Pyloric Stenosis—Are They Relevant? Cohort Study and Current Opinions. Children 2025, 12, 885. https://doi.org/10.3390/children12070885
Tröbs R-B, Niggemann H, Cernaianu G, Lipphaus A, Nissen M. Carbon Dioxide and Hemoglobin at Presentation with Hypertrophic Pyloric Stenosis—Are They Relevant? Cohort Study and Current Opinions. Children. 2025; 12(7):885. https://doi.org/10.3390/children12070885
Chicago/Turabian StyleTröbs, Ralf-Bodo, Hiltrud Niggemann, Grigore Cernaianu, Andreas Lipphaus, and Matthias Nissen. 2025. "Carbon Dioxide and Hemoglobin at Presentation with Hypertrophic Pyloric Stenosis—Are They Relevant? Cohort Study and Current Opinions" Children 12, no. 7: 885. https://doi.org/10.3390/children12070885
APA StyleTröbs, R.-B., Niggemann, H., Cernaianu, G., Lipphaus, A., & Nissen, M. (2025). Carbon Dioxide and Hemoglobin at Presentation with Hypertrophic Pyloric Stenosis—Are They Relevant? Cohort Study and Current Opinions. Children, 12(7), 885. https://doi.org/10.3390/children12070885