
Assessment of Stunting and Its Effect on Wasting in Children Under Two in Rural Madagascar
 , and
, and 
Abstract
1. Introduction
2. Methods
2.1. Study Design
2.2. Study Setting
2.3. Study Population
2.4. Data Collection
2.5. Data Analysis
3. Results
3.1. General Characteristic of the Mothers
3.2. Profile of the Infants
3.3. Maternal Care and Feeding Practices
3.4. Socio-Economic Conditions of the Household
3.5. Infant Anthropometry and Overlapping Nutritional Conditions
3.6. Infant Anthropometry and Impact of Wasting
3.7. Theoretical Impact of Wasting
4. Discussion
Strengths/Limitations
5. Conclusions
Author Contributions
Funding
Institutional Review Board Statement
Informed Consent Statement
Data Availability Statement
Acknowledgments
Conflicts of Interest
References
- Waterlow, J.C. Protein-energy malnutrition: The nature and extent of the problem. Clin. Nutr. 1997, 16, 3–9. [Google Scholar] [CrossRef]
- Waterlow, J.C. Classification and definition of protein-calorie malnutrition. Br. Med. J. 1972, 3, 566. [Google Scholar] [CrossRef]
- World Health Organization. Measuring a Child’s Growth. In WHO Child Growth Standards: Training Course on Child Growth Assessment; Onyango, A.W., de Onis, M., Eds.; World Health Organization: Geneva, Switzerland, 2008. [Google Scholar]
- Victora, C.G.; De Onis, M.; Hallal, P.C.; Blössner, M.; Shrimpton, R. Worldwide timing of growth faltering: Revisiting implications for interventions. Pediatrics 2010, 125, e473–e480. [Google Scholar] [CrossRef] [PubMed]
- Garenne, M.; Willie, D.; Maire, B.; Fontaine, O.; Eeckels, R.; Briend, A.; Van den Broeck, J. Incidence and duration of severe wasting in two African populations. Public Health Nutr. 2009, 12, 1974–1982. [Google Scholar] [CrossRef]
- Isanaka, S.; Grais, R.F.; Briend, A.; Checchi, F. Estimates of the duration of untreated acute malnutrition in children from Niger. Am. J. Epidemiol. 2011, 173, 932–940. [Google Scholar] [CrossRef] [PubMed]
- Kerac, M.; Bunn, J.; Chagaluka, G.; Bahwere, P.; Tomkins, A.; Collins, S.; Seal, A. Follow-up of post-discharge growth and mortality after treatment for severe acute malnutrition (FuSAM study): A prospective cohort study. PLoS ONE 2014, 9, e96030. [Google Scholar] [CrossRef] [PubMed]
- Cahill, G.F., Jr. Fuel metabolism in starvation. Annu. Rev. Nutr. 2006, 26, 1–22. [Google Scholar] [CrossRef]
- Olofin, I.; McDonald, C.M.; Ezzati, M.; Flaxman, S.; Black, R.E.; Fawzi, W.W.; Caulfield, L.E.; Danaei, G.; Nutrition Impact Model Study (anthropometry cohort pooling). Associations of suboptimal growth with all-cause and cause-specific mortality in children under five years: A pooled analysis of ten prospective studies. PLoS ONE 2013, 8, e64636. [Google Scholar] [CrossRef]
- Briend, A.; Khara, T.; Dolan, C. Wasting and stunting—Similarities and differences: Policy and programmatic implications. Food Nutr. Bull. 2015, 36, S15–S23. [Google Scholar] [CrossRef]
- Martorell, R.; Young, M.F. Patterns of stunting and wasting: Potential explanatory factors. Adv. Nutr. 2012, 3, 227–233. [Google Scholar] [CrossRef]
- Richard, S.A.; Black, R.E.; Gilman, R.H.; Guerrant, R.L.; Kang, G.; Lanata, C.F.; Mølbak, K.; Rasmussen, Z.A.; Sack, R.B.; Valentiner-Branth, P. Wasting is associated with stunting in early childhood. J. Nutr. 2012, 142, 1291–1296. [Google Scholar] [CrossRef] [PubMed]
- World Health Organization; United Nations Children’s Fund (UNICEF); International Bank for Reconstruction and Development/The World Bank. Levels and trends in child malnutrition: UNICEF/WHO/The World Bank Group joint child malnutrition estimates: Key findings of the 2023 edition. In Levels and Trends in Child Malnutrition: UNICEF/WHO/The World Bank Group Joint Child Malnutrition Estimates: Key Findings of the 2021 Edition; World Health Organization: Geneva, Switzerland, 2023. [Google Scholar]
- Rakotomanana, H.; Gates, G.E.; Hildebrand, D.; Stoecker, B.J. Determinants of stunting in children under 5 years in Madagascar. Matern. Child. Nutr. 2017, 13, e12409. [Google Scholar] [CrossRef]
- Asgary, R.; Liu, M.; Naderi, R.; Grigoryan, Z.; Malachovsky, M. Malnutrition prevalence and nutrition barriers in children under 5 years: A mixed methods study in Madagascar. Int. Health 2015, 7, 426–432. [Google Scholar] [CrossRef]
- Centre de Recherches, d’Etudes et d’Appui a l’Analyse Economique à Madagascar (CREAM). Monographie de la Région ITASY. 2013. Available online: https://www.pseau.org/outils/ouvrages/mg_mef_monographie-region-itasy_2014.pdf (accessed on 19 June 2024).
- Ramilijaona, T.M. Monographie de la Commune Rurale d’Ampéfy. 2017. [Google Scholar]
- UNICEF Madagascar Country Office Annual Report 2022. Available online: https://www.unicef.org/media/136156/file/Madagascar-2022-COAR.pdf (accessed on 6 October 2023).
- Dostie, B.; Haggblade, S.; Randriamamonjy, J. Seasonal poverty in Madagascar: Magnitude and solutions. Food Policy 2002, 27, 493–518. [Google Scholar] [CrossRef]
- Rotella, R.; Soriano, J.M.; Peraita-Costa, I.; Llopis-González, A.; Morales-Suarez-Varela, M. Evaluation of nutritional status using the minimum dietary diversity for women of reproductive age (MDD-W) tool in breastfeeding mothers in Madagascar. Trop. Med. Int. Health 2024, 29, 622–632. [Google Scholar] [CrossRef]
- WHO Multicentre Growth Reference Study Group; de Onis, M. WHO Child Growth Standards based on length/height, weight and age. Acta Paediatr. 2006, 95, 76–85. [Google Scholar]
- World Health Organization. WHO Housing and Health Guidelines. 2018. Available online: https://iris.who.int/bitstream/handle/10665/276001/9789241550376-eng.pdf (accessed on 14 May 2024).
- Assessment of Overcrowding in a Household. Available online: https://ihatepsm.com/blog/assessment-overcrowding-household#:~:text=The%20number%20of%20persons%20in,living%20area%20are%20as%20follows%3A&text=An%20infant%20(a%20child%20under,of%20age)%20is%20not%20counted (accessed on 14 May 2024).
- Joint Child Malnutrition Estimates Expanded Database: Stunting (Survey Estimates, National and Disaggregated). Available online: https://data.unicef.org/resources/dataset/malnutrition-data/ (accessed on 14 May 2024).
- Rafique, S.; Afzal, S.; Amin, H.; Malik, R.; Iqbal, J.; Mushtaq, N. Prevalence and predictors of stunting in children under five years of age. J. Coll. Physicians Surg. Pak. 2023, 33, 449–456. [Google Scholar] [PubMed]
- Addo, O.Y.; Stein, A.D.; Fall, C.H.; Gigante, D.P.; Guntupalli, A.M.; Horta, B.L.; Kuzawa, C.W.; Lee, N.; Norris, S.A.; Prabhakaran, P. Maternal height and child growth patterns. J. Pediatr. 2013, 163, 549–554.e1. [Google Scholar] [CrossRef]
- Nyamasege, C.K.; Kimani-Murage, E.W.; Wanjohi, M.; Kaindi, D.; Wagatsuma, Y. Effect of maternal nutritional education and counselling on children’s stunting prevalence in urban informal settlements in Nairobi, Kenya. Public Health Nutr. 2021, 24, 3740–3752. [Google Scholar] [CrossRef]
- Emamian, M.H.; Fateh, M.; Gorgani, N.; Fotouhi, A. Mother’s education is the most important factor in socio-economic inequality of child stunting in Iran. Public Health Nutr. 2014, 17, 2010–2015. [Google Scholar] [CrossRef]
- Laksono, A.D.; Wulandari, R.D.; Amaliah, N.; Wisnuwardani, R.W. Stunting among children under two years in Indonesia: Does maternal education matter? PLoS ONE 2022, 17, e0271509. [Google Scholar] [CrossRef] [PubMed]
- Prado, E.L.; Dewey, K.G. Nutrition and brain development in early life. Nutr.Rev. 2014, 72, 267–284. [Google Scholar] [CrossRef]
- McCuskee, S.; Garchitorena, A.; Miller, A.C.; Hall, L.; Ouenzar, M.A.; Rabeza, V.R.; Ramananjato, R.H.; Razanadrakato, H.R.; Randriamanambintsoa, M.; Barry, M. Child malnutrition in Ifanadiana district, Madagascar: Associated factors and timing of growth faltering ahead of a health system strengthening intervention. Global Health Action 2018, 11, 1452357. [Google Scholar] [CrossRef]
- Grantham-McGregor, S. A review of studies of the effect of severe malnutrition on mental development. J. Nutr. 1995, 125, 2233S–2238S. [Google Scholar] [CrossRef]
- Ekholuenetale, M.; Okonji, O.C.; Nzoputam, C.I.; Barrow, A. Inequalities in the prevalence of stunting, anemia and exclusive breastfeeding among African children. BMC Pediatr. 2022, 22, 333. [Google Scholar] [CrossRef]
- Tanner, S.; Leonard, W.R.; Reyes-García, V.; TAPS Bolivia Study Team. The consequences of linear growth stunting: Influence on body composition among youth in the Bolivian Amazon. Am. J. Phys. Anthropol. 2014, 153, 92–102. [Google Scholar] [CrossRef] [PubMed]
- Walker, S.P.; Grantham-McGregor, S.; Powell, C.; Fletcher, P.; Himes, J.H. Bioelectrical impedance, anthropometry and body composition in stunted and non-stunted children. Eur. J. Clin. Nutr. 1990, 44, 763–768. [Google Scholar] [PubMed]
- Popkin, B.M.; Richards, M.K.; Montiero, C.A. Stunting is associated with overweight in children of four nations that are undergoing the nutrition transition. J. Nutr. 1996, 126, 3009–3016. [Google Scholar] [CrossRef]
- Jamaiyah, H.; Geeta, A.; Safiza, M.N.; Khor, G.L.; Wong, N.F.; Kee, C.C.; Rahmah, R.; Ahmad, A.Z.; Suzana, S.; Chen, W.S. Reliability, technical error of measurements and validity of length and weight measurements for children under two years old in Malaysia. Med. J. Malaysia 2010, 65, 131–137. [Google Scholar]
- Sicotte, M.; Ledoux, M.; Zunzunegui, M.; Ag Aboubacrine, S.; Nguyen, V.; ATARAO group. Reliability of anthropometric measures in a longitudinal cohort of patients initiating ART in West Africa. BMC Med. Res. Methodol. 2010, 10, 1–9. [Google Scholar] [CrossRef]
- Bilukha, O.; Couture, A.; McCain, K.; Leidman, E. Comparison of anthropometric data quality in children aged 6–3 and 24–59 months: Lessons from population-representative surveys from humanitarian settings. BMC Nutr. 2020, 6, 1–12. [Google Scholar] [CrossRef]
- Santana dos Santos, I.K.; Borges dos Santos Pereira, D.; Cumpian Silva, J.; de Oliveira Gallo, C.; de Oliveira, M.H.; Pereira de Vasconcelos, L.C.; Conde, W.L. Frequency of anthropometric implausible values estimated from different methodologies: A systematic review and meta-analysis. Nutr. Rev. 2024, 82, 1514–1523. [Google Scholar] [CrossRef]
- Isanaka, S.; Andersen, C.T.; Cousens, S.; Myatt, M.; Briend, A.; Krasevec, J.; Hayashi, C.; Mayberry, A.; Mwirigi, L.; Guerrero, S. Improving estimates of the burden of severe wasting: Analysis of secondary prevalence and incidence data from 352 sites. BMJ Glob. Health 2021, 6, e004342. [Google Scholar] [CrossRef]
- Kabir, M.J.; Keshtkar, A.A.; Lashkar, B.F. Prevalence of malnutrition in children under 2 years old and its relationship with mothers background variables in Golestan province. J. Gorgan Univ. Med. Sci. 2006, 8, 32–39. [Google Scholar]
- World Health Organization. Reducing Stunting in Children: Equity Considerations for Achieving the Global Nutrition Targets; WHO: Geneva, Switzerland, 2025. [Google Scholar]
- Zarocostas, J. Malnutrition programmes are most effective before age of 2. BMJ 2006, 332, 569. [Google Scholar] [CrossRef] [PubMed]
- Sotiraki, M.; Malliou, A.; Tachirai, N.; Kellari, N.; Grammatikopoulou, M.G.; Sergentanis, T.N.; Vassilakou, T. Burden of childhood malnutrition: A roadmap of global and European policies promoting healthy nutrition for infants and young children. Children 2022, 9, 1179. [Google Scholar] [CrossRef]
- Ramanujam, N.; Richardson, S.B. Ending Child Malnutrition Under SDG 2: The moral imperative for global solidarity and local action. Soc. Altern. 2018, 37, 18–24. [Google Scholar]
- De Onis, M.; Blössner, M. The World Health Organization global database on child growth and malnutrition: Methodology and applications. Int. J. Epidemiol. 2003, 32, 518–526. [Google Scholar] [CrossRef] [PubMed]
- Brewster, D.R. Critical appraisal of the management of severe malnutrition: 1. Epidemiology and treatment guidelines. J. Paediatr. Child Health 2006, 42, 568–574. [Google Scholar] [CrossRef]
- Deconinck, H.; Hallarou, M.E.; Pesonen, A.; Gerard, J.C.; Criel, B.; Donnen, P.; Macq, J. Understanding factors that influence the integration of acute malnutrition interventions into the national health system in Niger. Health Policy Plan. 2016, 31, 1364–1373. [Google Scholar] [CrossRef]
- Ford, K.L.; Basualdo-Hammond, C.; Nasser, R.; Avdagovska, M.; Keller, H.; Malone, A.; Bauer, J.D.; Correia, M.I.T.; Cardenas, D.; Gramlich, L. Health policy to address disease-related malnutrition: A scoping review. BMJ Nutr. Prev. Health 2024, 7, e000975. [Google Scholar] [CrossRef] [PubMed]
- World Health Organization. WHO Guideline on the Prevention and Management of Wasting and Nutritional Oedema (Acute Malnutrition) in Infants and Children Under 5 Years; World Health Organization: Geneva, Switzerland, 2023. [Google Scholar]
- Garza, C.; Borghi, E.; Onyango, A.W.; de Onis, M.; WHO Multicentre Growth Reference Study Group. Parental height and child growth from birth to 2 years in the WHO Multicentre Growth Reference Study. Matern. Child Nutr. 2013, 9, 58–68. [Google Scholar] [CrossRef]
- Ashworth, A.; Millward, D.J. Catch-up growth in children. Nutr. Rev. 1986, 44, 157–163. [Google Scholar] [CrossRef] [PubMed]
- De Onis, M.; Branca, F. Childhood stunting: A global perspective. Matern. Child Nutr. 2016, 12, 12–26. [Google Scholar] [CrossRef]
- Rabaoarisoa, C.R.; Rakotoarison, R.; Rakotonirainy, N.H.; Mangahasimbola, R.T.; Randrianarisoa, A.B.; Jambou, R.; Vigan-Womas, I.; Piola, P.; Randremanana, R.V. The importance of public health, poverty reduction programs and women’s empowerment in the reduction of child stunting in rural areas of Moramanga and Morondava, Madagascar. PLoS ONE 2017, 12, e0186493. [Google Scholar] [CrossRef]
- Sadler, K.; James, P.T.; Bhutta, Z.A.; Briend, A.; Isanaka, S.; Mertens, A.; Myatt, M.; O’Brien, K.S.; Webb, P.; Khara, T. How can nutrition research better reflect the relationship between wasting and stunting in children? Learnings from the Wasting and Stunting project. J. Nutr. 2022, 152, 2645–2651. [Google Scholar]
- Keats, E.C.; Das, J.K.; Salam, R.A.; Lassi, Z.S.; Imdad, A.; Black, R.E.; Bhutta, Z.A. Effective interventions to address maternal and child malnutrition: An update of the evidence. Lancet Child Adolesc. Health 2021, 5, 367–384. [Google Scholar] [CrossRef]
- Vaivada, T.; Akseer, N.; Akseer, S.; Somaskandan, A.; Stefopulos, M.; Bhutta, Z.A. Stunting in childhood: An overview of global burden, trends, determinants, and drivers of decline. Am. J. Clin. Nutr. 2020, 112, 777S–791S. [Google Scholar] [CrossRef] [PubMed]
- Golden, M. Protein-energy interactions in the management of severemalnutrition. Clin. Nutr. 1997, 16, 19–23. [Google Scholar] [CrossRef]
- Seretew, W.S.; Tesema, G.A.; Yirsaw, B.G.; Argaw, G.S. Prevalence of stunting and associated factors among under-five children in sub-Saharan Africa: Multilevel ordinal logistic regression analysis modeling. PLoS ONE 2024, 19, e0299310. [Google Scholar] [CrossRef]
- Asebe, H.A.; Asmare, Z.A.; Mare, K.U.; Kase, B.F.; Tebeje, T.M.; Asgedom, Y.S.; Shibeshi, A.H.; Lombebo, A.A.; Sabo, K.G.; Fente, B.M. The level of wasting and associated factors among children aged 6–59 months in sub-Saharan African countries: Multilevel ordinal logistic regression analysis. Front. Nutr. 2024, 11, 1336864. [Google Scholar] [CrossRef] [PubMed]

| Total (n = 437) Frequency (%) Mean ± SD | Stunted (n = 251) Frequency (%) Mean ± SD | Not Stunted (n = 186) Frequency (%) Mean ± SD | p-Value 1 | PR | 95% CI | aPR 2 | a95% CI 2 | |
|---|---|---|---|---|---|---|---|---|
| Age | 25.8 ± 6.2 | 25.7 ± 6.4 | 25.89 ± 5.8 | 0.769 | ||||
| <18 | 31 (7.1%) | 20 (7.9%) | 11 (5.9%) | 0.524 | 0.90 | 0.67–3.14 | 1.74 | 0.29–10.40 |
| 18–29 | 297 (68%) | 165 (65.5%) | 132 (71.4%) | 1 Reference | 1 Reference | |||
| 30–39 | 90 (20.6%) | 54 (21.4%) | 36 (19.5%) | 0.55 | 0.44–1.94 | 1.64 | 0.90–2.99 | |
| 40–49 | 19 (4.3%) | 13 (5.2%) | 6 (3.2%) | 0.50 | 0.44–4.68 | 1.50 | 0.52–4.38 | |
| Weight (kg) | 48.6 ± 8.0 | 46.9 ± 6.8 | 50.9 ± 9.0 | <0.001 | ||||
| Height (cm) | 152.7 ± 5.7 | 151.7 ± 5.4 | 153.9 ± 5.8 | <0.001 | ||||
| BMI (kg/m2) | 20.8 ± 3.0 | 20.3 ± 2.7 | 21.4 ± 3.4 | <0.001 | ||||
| <18.5 | 108 (24.7%) | 63 (25%) | 45 (24.3%) | 0.015 | 0.91 | 0.58–1.43 | 0.37 | 0.16–0.86 |
| 18.5–24.9 | 289 (66.1%) | 175 (69.4%) | 114 (61.6%) | 1 Reference | 1 Reference | |||
| 25.0–29.9 | 34 (7.8%) | 13 (5.2%) | 21 (11.4%) | 0.40 | 0.19–0.84 | 3.18 | 0.90–11.17 | |
| >30 | 6 (1.4%) | 1 (0.4%) | 5 (2.7%) | 0.13 | 0.02–1.13 | 4.97 | 0.31–79.71 | |
| Pathologies (no) | 420 (96.1%) | 239 (95.2%) | 181 (97.3%) | 0.263 | ||||
| Health status | 0.273 | |||||||
| Healthy | 420 (96.1%) | 239 (95.2%) | 181 (97.3%) | 1 Reference | 1 Reference | |||
| Any illness | 17 (3.9%) | 12 (4.8%) | 5 (2.7%) | 1.82 | 0.63–5.25 | 1.19 | 0.36–3.99 | |
| Acute | 1 (0.2%) | 1 (33.3%) | 0 (0.0%) | - | - | - | - | |
| Chronic | 5 (1.1%) | 2 (66.7%) | 3 (100%) | - | - | - | - | |
| Parity | 0.721 | |||||||
| Primiparous | 161 (36.8%) | 95 (37.7%) | 66 (35.7%) | 1 Reference | 1 Reference | |||
| 2–3 | 203 (46.5%) | 113 (44.8%) | 90 (48.6%) | 0.87 | 0.57–1.33 | 0.36 | 0.10–1.46 | |
| ≥4 | 73 (16.7%) | 44 (17.5%) | 29 (15.7%) | 1.05 | 0.60–1.85 | 0.33 | 0.08–1.34 | |
| Twin pregnancy 3 | 13 (3.0%) | 9 (3.6%) | 4 (2.2%) | 0.392 | 1.67 | 0.51–5.53 | 0.72 | 0.43–1.20 |
| Birth spacing < 24 months | 26 (5.9%) | 20 (7.9%) | 6 (3.2%) | 0.040 | 2.57 | 1.01–6.53 | ||
| Education | 0.025 | |||||||
| Illiterate | 17 (3.9%) | 12 (4.8%) | 5 (2.7%) | 2.86 | 0.87–9.43 | 0.51 | 0.12–2.24 | |
| Primary | 181 (41.4%) | 117 (46.4%) | 64 (34.6%) | 2.17 | 1.13–4.19 | 0.37 | 0.10–1.32 | |
| Secondary 1st cycle | 193 (44.2%) | 102 (40.5%) | 91 (49.2%) | 1.33 | 0.7–2.54 | 0.60 | 0.17–2.19 | |
| Secondary 2nd cycle | 46 (10.5%) | 21 (8.3%) | 25 (13.5%) | 1 Reference | 1 Reference | |||
| Education level | 0.004 | |||||||
| Primary or below | 198 (45.3%) | 129 (51.2%) | 69 (37.3%) | 1.76 | 1.20–2.60 | |||
| Secondary or above | 239 (54.7%) | 123 (48.8%) | 116 (62.7%) | 1 Reference | 1 Reference | |||
| Occupation | 0.165 | |||||||
| Farmer | 335 (76.7%) | 203 (80.6%) | 132 (71.4%) | 1 Reference | 1 Reference | |||
| Seller | 41 (9.4%) | 19 (7.5%) | 22 (11.9%) | 0.56 | 0.29–1.08 | 1.18 | 0.46–3.04 | |
| Fisher | 26 (5.9%) | 15 (6.0%) | 11 (5.9%) | 0.89 | 0.39–1.99 | 0.17 | 0.02–1.76 | |
| Housewife | 5 (1.1%) | 2 (0.8%) | 3 (1.6%) | 0.43 | 0.07–2.62 | 0.24 | 0.20–2.91 | |
| Other | 30 (6.9%) | 13 (5.2%) | 17 (9.2%) | 0.50 | 0.23–1.05 | 1.87 | 0.50–6.93 |
| Total (n = 437) Frequency (%) Mean ± SD | Stunted (n = 251) Frequency (%) Mean ± SD | Not Stunted (n = 186) Frequency (%) Mean ± SD | p-Value 1 | PR | 95% CI | aPR 2 | a95% CI 2 | |
|---|---|---|---|---|---|---|---|---|
| Age | 10.5 ± 6.5 | 11.6 ± 6.3 | 9.2 ± 6.4 | <0.001 | ||||
| 0–6 months | 137 (31.4%) | 61 (24.2%) | 76 (41.1%) | <0.001 | 1 Reference | 1 Reference | ||
| 7–13 months | 148 (33.9%) | 85 (33.7%) | 63 (34.1%) | 1.68 | 1.05–2.68 | 1.35 | 0.63–2.90 | |
| 14–24 months | 152 (34.8%) | 106 (42.1%) | 46 (24.9%) | 1.87 | 1.77–4.65 | 2.40 | 1.10–5.20 | |
| Sex | ||||||||
| Female | 217 (49.7%) | 119 (47.2%) | 98 (53.0%) | 0.235 | 0.79 | 0.54–1.16 | 0.92 | 0.55–1.52 |
| Male | 220 (50.3%) | 133 (52.8%) | 87 (47.0%) | 1 Reference | 1 Reference | |||
| Low birth weight 3 | ||||||||
| Yes | 348 (79.6%) | 185 (73.7%) | 163 (87.6%) | <0.001 | 0.39 | 0.23–0.66 | 1.57 | 0.80–3.08 |
| No | 89 (20.4) | 66 (26.3%) | 23 (12.4%) | 1 Reference | 1 Reference | |||
| Weight (kg) | 7.3 ± 1.7 | 7.2 ± 1.6 | 7.5 ± 1.9 | 0.033 | ||||
| Height (cm) | 66.2 ± 8.5 | 65.2 ± 7.9 | 67.6 ± 9.1 | 0.003 | ||||
| MUAC (mm) (n = 346) | 135.9 ± 11.7 | 133.0 ± 11.8 | 140.4 ± 11.3 | <0.001 | ||||
| ≤114 mm Severe wasting | 9 (2.6%) | 9 (4.3%) | 0 (0%) | <0.001 | - | - | - | - |
| ≥115 mm–≤124 mm Moderate wasting | 67 (19.4%) | 55 (26.1%) | 12 (8.9%) | 3.83 | 2.96–7.48 | 1.0 | 0.43–2.34 | |
| ≥125 mm Normal | 270 (78.0%) | 147 (69.7%) | 123 (91.1%) | 1 Reference | 1 Reference | |||
| Weight-for-height (WFH) | −0.01 ± 1.85 | −0.09 ± 2.01 | −0.16 ± 1.60 | 0.157 | ||||
| <−3 SD Severe wasting | 13 (3.0%) | 8 (3.2%) | 5 (2.7%) | 0.135 | 1.28 | 0.41–4.02 | 0.05 | 0.1–0.19 |
| ≥−3 to ≤−2 SD Moderate wasting | 41 (9.4%) | 24 (9.5%) | 17 (9.2%) | 1.13 | 0.58–2.20 | 0.006 | 0.01–0.05 | |
| >−2 to ≤+1 SD Normal | 283 (64.8%) | 157 (62.3%) | 126 (68.1%) | 1 Reference | 1 Reference | |||
| >+1 to ≤+2 SD Overweight risk | 42 (9.6%) | 22 (8.7%) | 20 (10.8%) | 0.88 | 0.46–1.69 | 2.5 | 1.01–5.94 | |
| ≥+2–≤+3 SD Overweight | 26 (5.9%) | 15 (6.0%) | 11 (5.9%) | 1.09 | 0.48–2.46 | 4.51 | 1.07–18.92 | |
| >+3 SD Obesity | 32 (7.3%) | 26 (10.3%) | 6 (3.2%) | 2.86 | 1.20–6.84 | - | - | |
| Weight-for-age (WFA) | −1.5 ± 1.4 | −2.1 ± 1.3 | −0.7 ± 1.1 | <0.001 | ||||
| <−3 SD Severe underweight | 60 (13.7%) | 57 (22.6%) | 3 (1.6%) | <0.001 | 6.56 | 3.69–11.67 | 18.58 | 4.82–71.58 |
| ≥−3 to ≤−2 SD Moderate underweight | 95 (21.7%) | 78 (31.0%) | 17 (9.2%) | 27.19 | 8.31–88.92 | 6.51 | 3.27–12.94 | |
| ≥−1 SD Normal | 282 (64.5%) | 117 (46.4%) | 165 (89.2%) | 1 Reference | 1 Reference | |||
| Height-for-age (HFA) | −2.2 ± 1.8 | −3.3 ± 1.1 | −0.6 ± 1.3 | <0.001 | ||||
| <−3 SD Severe stunting | 129 (29.5%) | 129 (100%) | 0 (0%) | <0.001 | - | - | - | - |
| ≥−3 to ≤−2 SD Moderate stunting | 122 (27.9%) | 122 (48.6%) | 0 (0%) | - | - | - | - | |
| ≥−1 SD Normal | 186 (42.6%) | 0(0%) | 186 (100%) | - | - | - | - | |
| BMI for Age (BAZ) | −0.2 ± 1.7 | −0.1 ± 1.8 | −0.4 ± 1.5 | 0.064 | ||||
| <−3 SD Severe wasting | 20 (4.6%) | 10 (4.0%) | 10 (5.4%) | 0.034 | 0.77 | 0.31–1.90 | 2.81 | 0.84–9.40 |
| ≥−3 to ≤−2 SD Moderate wasting | 33 (7.6%) | 19 (7.5%) | 14 (7.6%) | 1.04 | 0.54–2.16 | 1.19 | 0.55–2.60 | |
| ≥−2 to ≤+1 SD Normal | 299 (68.4%) | 169 (67.1%) | 130 (70.3%) | 1 Reference | 1 Reference | |||
| >+1 to ≤+2 SD Overweight risk | 49 (11.2%) | 28 (11.1%) | 21 (11.4%) | 1.02 | 0.55–1.88 | 0.24 | 0.08–0.71 | |
| ≥+2–≤+3 SD Overweight | 31 (8.2%) | 26 (10.3%) | 6 (3.2%) | 1.75 | 0.83–3.68 | 0.09 | 0.2–0.35 | |
| >+3 SD Obesity | 5 (1.1%) | 0 (0%) | 5 (2.7%) | - | - |
| Total (n = 437) Frequency (%) Mean ± SD | Stunted (n = 251) Frequency (%) Mean ± SD | Not Stunted (n = 186) Frequency (%) Mean ± SD | p-Value 1 | PR | 95% CI | aPR 2 | a95% CI 2 | |
|---|---|---|---|---|---|---|---|---|
| ANC 2 | ||||||||
| 0 | 3 (0.7%) | 2 (0.8%) | 1 (0.5%) | 0.529 | 1.55 | 0.14–17.25 | 17.72 | 0.01–177.24 |
| 1 | 7 (1.6%) | 5 (2%) | 2 (1.1%) | 1.94 | 0.37–10.12 | 3.27 | 0.21–51.03 | |
| 2–3 | 31 (7.1%) | 21 (8.4%) | 10 (5.4%) | 1.63 | 0.75–3.50 | 1.72 | 0.28–23.19 | |
| ≥4 | 396 (90.6%) | 223 (88.8%) | 173 (93.0%) | 1 Reference | 1 Reference | |||
| IFA supplementation | ||||||||
| Yes | 366 (83.8%) | 209 (83.3%) | 157 (84.4%) | 0.749 | 1 Reference | 1 Reference | ||
| No | 71 (16.2%) | 42 (16.7%) | 29 (15.6%) | 1.08 | 0.65–1.82 | 0.78 | 0.25–1.43 | |
| Type of delivery | ||||||||
| Vaginal | 402 (92.0%) | 239 (95.2%) | 163 (87.6%) | 0.013 | 1 Reference | 1 Reference | ||
| Operative vaginal birth | 23 (5.3%) | 7 (2.8%) | 16 (8.6%) | 0.30 | 0.12–0.74 | 0.52 | 0.17–1.58 | |
| Caesarean section | 12 (2.7%) | 5 (2.0%) | 7 (3.8%) | 0.49 | 0.15–1.56 | 0.62 | 0.15–2.55 | |
| Place of delivery | ||||||||
| Home | 157 (35.9%) | 97 (38.6%) | 60 (32.3%) | 0.169 | 1.32 | 0.88–1.97 | 0.17 | 1.43–0.86 |
| Health center | 280 (64.1%) | 154 (61.4%) | 126 (67.7%) | 1 Reference | 1 Reference | |||
| Reason in case of home delivery | ||||||||
| Upcoming birth | 72 (45.0%) | 47 (47.5%) | 25 (41.0%) | 0.736 | 1 Reference | 1 Reference | ||
| Personal choice | 60 (37.5%) | 33 (33.3%) | 27 (44.3%) | 0.65 | 0.32–1.31 | 0.1 | 0.01–2.56 | |
| Transport issues | 19 (11.9%) | 12 (12.1%) | 7 (11.5%) | 0.91 | 0.32–2.60 | 1.0 | 0.1–13.25 | |
| Homecare for a matron | 4 (2.5%) | 3 (3.0%) | 1 (1.6%) | 1.60 | 0.16–16.15 | 0.1 | 0.01–45.02 | |
| Lack of money | 4 (2.5%) | 3 (3.0%) | 1 (1.6%) | 1.60 | 0.16–16.15 | 1.0 | 0.01–21.02 | |
| Absence of health staff | 1 (0.6%) | 1 (1.0%) | 0 (0%) | - | - | |||
| Early breastfeeding initiation | ||||||||
| Within the 1st hour after birth | 251 (57.4%) | 140 (55.8%) | 111 (59.7%) | 0.415 | 1 Reference | 1 Reference | ||
| After the 1st hour | 186 (42.6%) | 111 (44.2%) | 75 (40.3%) | 1.17 | 0.80–1.72 | 1.02 | 0.63–1.65 | |
| EBF (n = 385) | ||||||||
| Yes | 170 (44.2%) | 99 (42.9%) | 71 (46.1%) | 0.530 | 1 Reference | 1 Reference | ||
| No | 215 (55.8%) | 132 (57.1%) | 83 (53.9%) | 1.14 | 0.75–1.71 | 1.27 | 0.79–2.07 | |
| Breastfeeding up to 1-year (n = 304) | ||||||||
| Yes | 292 (96.1%) | 186 (94.4%) | 106 (99.1%) | 0.047 | 1 Reference | 1 Reference | ||
| No | 12 (3.9%) | 11 (5.6%) | 1 (0.9%) | 6.27 | 0.80–49.23 | 6.20 | 0.78–49.32 | |
| Weaning age (n = 368) | ||||||||
| Before 6 months | 224 (60.9%) | 142 (63.1%) | 82 (57.3%) | 0.269 | 1.27 | 0.83–1.95 | 6.02 | 0.76–47.47 |
| After 6 months | 144 (39.1%) | 82 (57.3%) | 61 (42.7%) | 1 Reference | 1 Reference | |||
| Improved mother’s diet during pregnancy | ||||||||
| Yes | 235 (53.8%) | 131 (52.2%) | 104 (55.9%) | 0.440 | 1 Reference | 1 Reference | ||
| No | 202 (46.2%) | 120 (47.8%) | 82 (44.1%) | 1.16 | 0.80–1.70 | 0.85 | 0.55–1.31 | |
| Improved mother’s diet during breastfeeding | ||||||||
| Yes | 182 (41.6%) | 102 (40.6%) | 80 (43.0%) | 0.619 | 1 Reference | 1 Reference | ||
| No | 255 (58.4%) | 149 (59.4%) | 106 (57.0%) | 1.10 | 0.75–1.62 | 1.12 | 0.76–1.63 | |
| Use of iodized salt | ||||||||
| Yes | 330 (75.5%) | 190 (75.7%) | 61 (24.3%) | 0.918 | 1 Reference | 1 Reference | ||
| No | 107 (24.5%) | 140 (74.3%) | 46 (24.7%) | 0.97 | 0.63–1.52 | 0.95 | 0.61–1.48 | |
| Total (n = 437) Frequency (%) Mean ± SD | Stunted (n = 251) Frequency (%) Mean ± SD | Not Stunted (n = 186) Frequency (%) Mean ± SD | p-Value 1 | PR | 95% CI | aPR 2 | a95% CI 2 | |
|---|---|---|---|---|---|---|---|---|
| Family size | 4.6 ± 1.7 | 4.6 ± 1.8 | 4.6 ± 1.6 | 0.985 | ||||
| <4 persons | 256 (58.6%) | 152 (60.6%) | 104 (55.9%) | 0.330 | 1 Reference | 1 Reference | ||
| >4 persons | 181 (41.4%) | 99 (39.4%) | 82 (44.1%) | 0.83 | 0.56–1.21 | 0.99 | 0.88–1.12 | |
| Dimension of the house | 28.8 ± 24.1 | 25.6 ± 23.0 | 30.4 ± 25.6 | 0.243 | ||||
| <24 | 224 (51.3%) | 140 (55.8%) | 84 (45.2%) | 0.028 | 1.53 | 1.04–2.24 | 1.0 | 1.01–1.05 |
| >24 | 213 (48.7%) | 111 (44.2%) | 102 (54.8%) | 1 Reference | 1 Reference | |||
| Overcrowding 3 (m2/person) | 6.8 ± 6.5 | 6.5 ± 5.8 | 7.2 ± 7.40 | 0.260 | ||||
| <5 | 211 (48.3%) | 129 (51.4%) | 82 (44.1%) | 0.131 | 1.34 | 0.92–1.96 | 0.99 | 0.88–1.12 |
| >5 | 226 (51.7%) | 122 (48.6%) | 104 (55.9%) | 1 Reference | 1 Reference | |||
| Middle income 4 | ||||||||
| <200,000 MGA Ariary | 328 (75.1%) | 197 (78.5%) | 131 (70.4%) | 0.054 | 1.53 | 0.99–2.37 | 0.69 | 0.45–1.07 |
| ≥200,000 MGA Ariary | 109 (24.9%) | 54 (21.5%) | 55 (29.6%) | 1 Reference | 1 Reference | |||
| Source of drinking water | ||||||||
| Public standpipe | 149 (34.1%) | 93 (37.1%) | 56 (30.1%) | 0.291 | 1 Reference | 1 Reference | ||
| Protected well | 285 (65.2%) | 156 (62.2%) | 129 (69.4%) | 0.73 | 0.49–1.09 | 1.47 | 0.97–2.23 | |
| Unprotected spring | 3 (0.7%) | 2 (0.8%) | 1 (0.5%) | 1.20 | 0.11–13.59 | 1.28 | 0.11–15.01 | |
| Rice availability | ||||||||
| <6 months | 140 (32.0%) | 87 (34.7%) | 53 (28.5%) | 0.172 | 1.33 | 0.88–2.00 | 0.99 | 0.88–1.11 |
| ≥6 months | 297 (68.0%) | 164 (65.3%) | 133 (71.5%) | 1 Reference | 1 Reference | |||
| Toilet facility | ||||||||
| Yes | 398 (91.1%) | 222 (88.4%) | 94.6%) | 0.025 | 1 Reference | 1 Reference | ||
| No | 39 (8.9%) | 29 (11.6%) | 10 (5.4%) | 2.30 | 1.09–4.84 | 2.015 | 1.01–4.58 | |
| Distance walking from water (min) | 9.3 ± 11.3 | 10.1 ± 12.2 | 8.3 ± 9.7 | 0.098 | ||||
| <5 | 270 (61.8%) | 151 (60.2%) | 119 (64.0%) | 0.816 | 1 Reference | 1 Reference | ||
| >5 | 167 (38.2%) | 100 (39.8%) | 67 (36.0%) | 1.18 | 0.80–1.74 | 0.99 | 0.88–1.11 | |
| Distance walking from health center (min) | ||||||||
| <45 | 233 (53.3%) | 128 (51.0%) | 105 (56.5%) | 0.258 | 1 Reference | 1 Reference | ||
| >45 | 204 (46.7%) | 123 (49.0%) | 81 (43.5%) | 1.25 | 0.85–1.82 | 1.03 | 0.99–1.09 | |
| Land ownership | ||||||||
| Yes | 226 (51.7%) | 132 (52.6%) | 94 (50.5%) | 0.671 | 1 Reference | 1 Reference | ||
| No | 211 (48.3%) | 119 (47.4%) | 92 (49.5%) | 0.92 | 0.63–1.35 | 0.85 | 0.57–1.25 | |
| Transport availability | ||||||||
| Yes | 113 (25.9%) | 57 (22.7%) | 56 (30.1%) | 1.46 | 1 Reference | 1 Reference | ||
| No | 324 (74.1%) | 56 (30.1%) | 130 (69.9%) | 1.46 | 0.95–2.25 | 1.34 | 0.86–2.07 | |
| Severe Stunting <−3 SD (n = 129, 29.5%) Frequency (%) | Moderate Stunting ≥−3 to ≤−2 SD (n = 122, 27.9%) Frequency (%) | Not Stunted ≥−1 SD (n = 186, 42.6%) Frequency (%) | p-Value 1 | |
|---|---|---|---|---|
| Weight-for-height (WFH) | 0.054 | |||
| <−3 SD Severe wasting | 18 (14.0%) | 4 (3.3%) | 5 (2.7%) | |
| ≥−3 to ≤−2 SD Moderate wasting | 14 (10.9%) | 10 (8.2%) | 17 (9.1%) | |
| >−2 to ≤+1 SD Normal | 71 (55.0%) | 86 (70.5%) | 126 (67.7%) | |
| >+1 to ≤+2 SD Overweight risk | 4 (3.1%) | 11 (9.0%) | 20 (10.8%) | |
| ≥+2–≤+ 3 SD Overweight | 11 (8.5%) | 4 (3.3%) | 11 (5.9%) | |
| >+3 SD Obesity | 18 (14.0%) | 7 (5.7%) | 7 (3.8%) | |
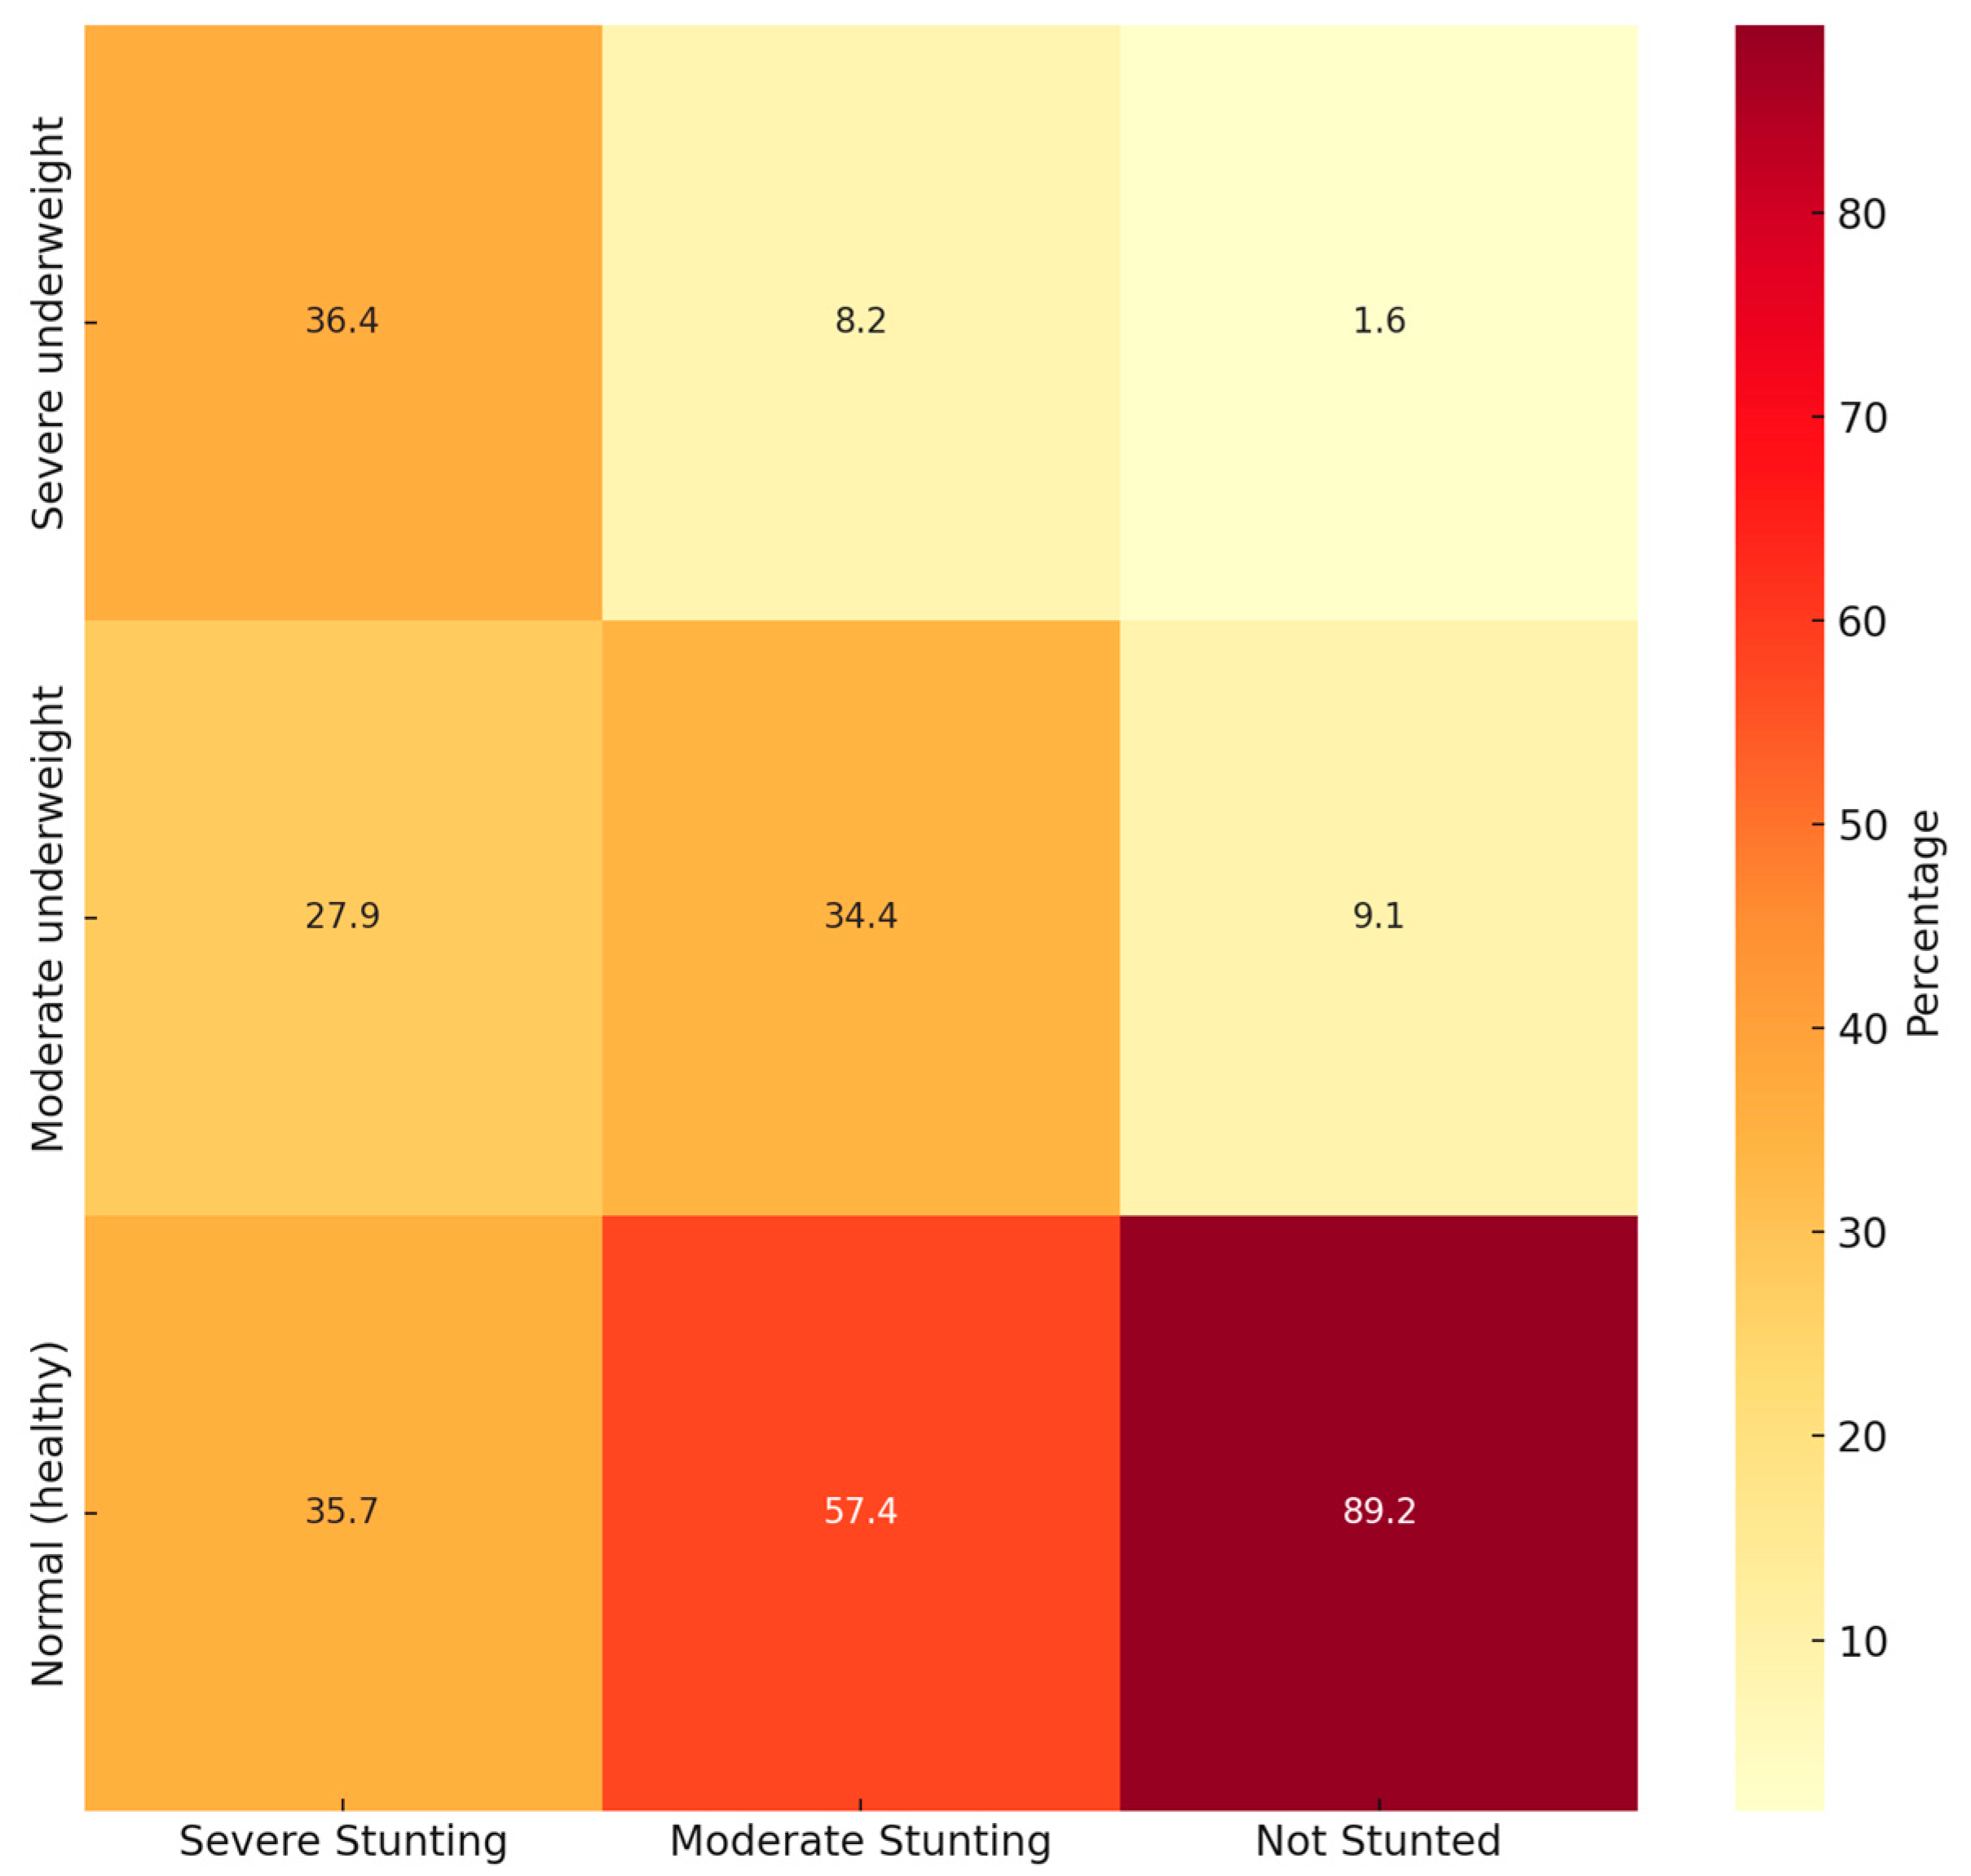
| Weight-for-age (WFA) | 0.001 | |||
| <−3 SD Severe underweight | 47 (36.4%) | 10 (8.2%) | 3 (1.6%) | |
| ≥−3 to ≤−2 SD Moderate underweight | 36 (27.9%) | 42 (34.4%) | 17 (9.1%) | |
| ≥−1 SD Normal (healthy) | 46 (35.7%) | 70 (57.4%) | 166 (89.2%) | |
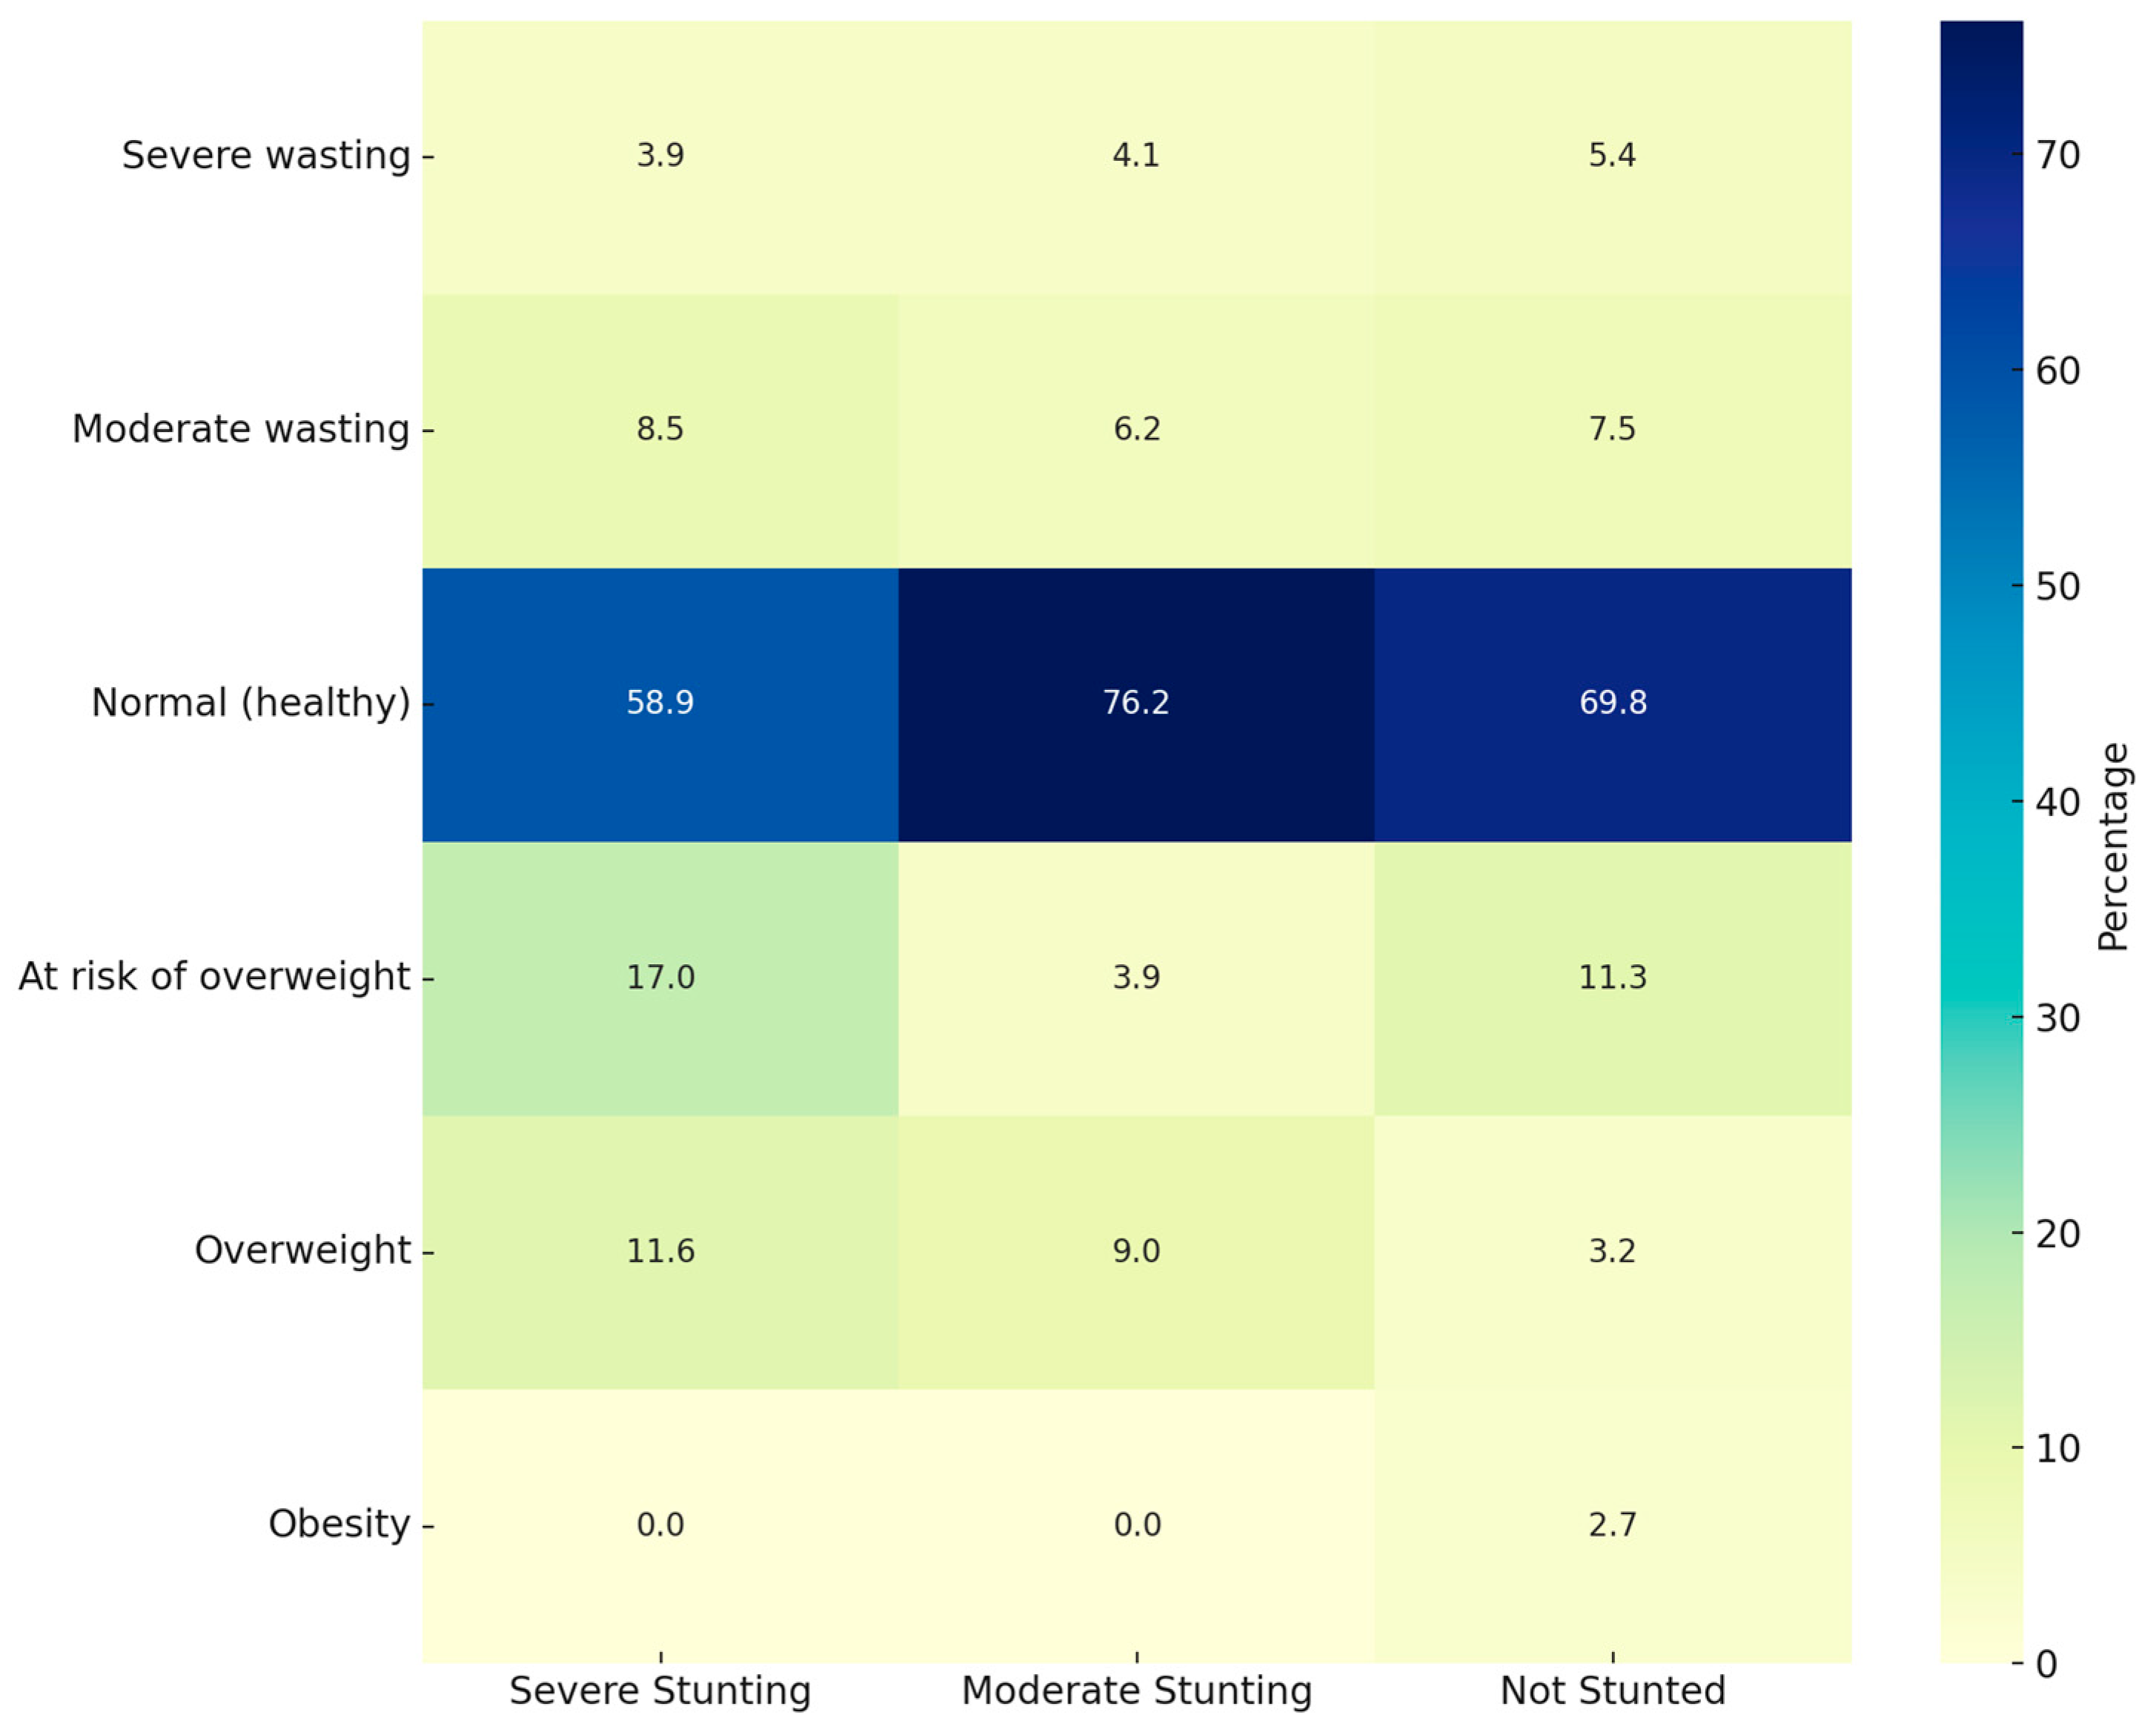
| BMI for age (BAZ) | 0.034 | |||
| <−3 SD Severe wasting | 5 (3.9%) | 5 (4.1%) | 10 (5.4%) | |
| ≥−3 to ≤−2 SD Moderate wasting | 11 (8.5%) | 8 (6.2%) | 14 (7.5%) | |
| >−2 to ≤+1 SD Normal (healthy) | 76 (58.9%) | 93 (76.2%) | 130 (69.8%) | |
| >+1 to ≤+2 SD At risk of overweight | 22 (17.0%) | 5 (3.9%) | 21 (11.3%) | |
| ≥+2–≤+3 SD Overweight | 15 (11.6%) | 11 (9.0%) | 6 (3.2%) | |
| >+3 SD Obesity | 0 (0.0%) | 0 (0.0%) | 5 (2.7%) |
| (a) | ||||||
|---|---|---|---|---|---|---|
| Real Child Height | ||||||
| Total (n = 437) Frequency (%) Mean ± SD | Stunted (n = 251) Frequency (%) Mean ± SD | Not Stunted (n = 186) Frequency (%) Mean ± SD | p-Value 1 | PR | 95% CI | |
| Weight (kg) | 7.3 ± 1.7 | 7.2 ± 1.6 | 7.5 ± 1.9 | 0.033 | ||
| Height (cm) | 66.2 ± 8.5 | 65.2 ± 7.9 | 67.6 ± 9.1 | 0.003 | ||
| Difference | −5.2 ± 5.5 | −7.7 ± 3.2 | −1.6 ± 3.3 | <0.001 | ||
| Weight-for-height (WFH) | −0.01 ± 1.85 | −0.09 ± 2.01 | −0.16 ± 1.60 | 0.157 | ||
| <−3 SD Severe wasting | 13 (3.0%) | 8 (3.2%) | 5 (2.7%) | 0.135 | 1.28 | 0.41–4.02 |
| ≥−3 to - ≤−2 SD Moderate wasting | 41 (9.4%) | 24 (9.5%) | 17 (9.2%) | 1.13 | 0.58–2.20 | |
| >−2 to ≤+1 SD Normal | 283 (64.8%) | 157 (62.3%) | 126 (68.1%) | 1 Reference | - | |
| >+1 to ≤+2 SD Overweight risk | 42 (9.6%) | 22 (8.7%) | 20 (10.8%) | 0.88 | 0.46–1.69 | |
| ≥+2–≤+3 SD Overweight | 26 (5.9%) | 15 (6.0%) | 11 (5.9%) | 1.09 | 0.48–2.46 | |
| >+3 SD Obesity | 32 (7.3%) | 26 (10.3%) | 6 (3.2%) | 2.86 | 1.20–6.84 | |
| (b) | ||||||
| Adjusted to Who Height-for-Age | ||||||
| Total (n = 437) Frequency (%) Mean ± SD | Stunted (n = 251) Frequency (%) Mean ± SD | Not Stunted (n = 186) Frequency (%) Mean ± SD | p-Value 1 | PR | 95% CI | |
| Weight (kg) | - | - | - | |||
| Height (cm) | 71.4 ± 9.6 | 73.1 ± 8.9 | 69.1 ± 9.9 | <0.001 | ||
| Difference | - | - | - | |||
| Weight-for-height (WFH) | −1.7 ± 2.3 | −2.5 ± 2.2 | −0.5 ± 1.8 | <0.001 | ||
| <−3 SD Severe wasting | 119 (27.2%) | 107 (42.6%) | 12 (6.5%) | <0.001 | 13.11 | 6.80–25.30 |
| ≥−3 to - ≤−2 SD Moderate wasting | 66 (15.1%) | 44 (17.5%) | 22 (11.8%) | 2.94 | 1.64–5.26 | |
| >−2 to ≤+1 SD Normal | 210 (48.1%) | 85 (33.9%) | 125 (67.2%) | 1 Reference | - | |
| >+1 to ≤+2 SD Overweight risk | 23 (5.3%) | 7 (2.8%) | 16 (8.6%) | 0.64 | 0.25–1.63 | |
| ≥+2–≤+3 SD Overweight | 8 (1.8%) | 4 (1.6%) | 4 (2.2%) | 1.47 | 0.36–6.04 | |
| >+3 SD Obesity | 11 (2.5%) | 4 (1.6%) | 7 (3.8%) | 0.84 | 0.24–2.96 | |
| Real Height | Adjusted to WHO Height-for-Age | ||||||
|---|---|---|---|---|---|---|---|
| <−3 SD Severe Wasting | ≥−3 to ≤−2 SD Moderate Wasting | >−2 to ≤+1 SD Normal | >+1 to ≤+2 SD Overweight Risk | ≥+2–≤+3 SD Overweight | >+3 SD Obesity | p-Value 1 | |
| Frequency (%) Mean ± SD | Frequency (%) Mean ± SD | Frequency (%) Mean ± SD | Frequency (%) Mean ± SD | Frequency (%) Mean ± SD | Frequency (%) Mean ± SD | ||
| Theoretical WFH classification | 119 (27.2%) | 66 (15.1%) | 210 (48.1%) | 23 (5.3%) | 8 (1.8%) | 11 (2.5%) | |
| Real WFH classification | 13 (3.0%) | 41 (9.4%) | 283 (64.8%) | 42 (9.6%) | 26 (5.9%) | 32 (7.3%) | |
| <−3 SD Severe wasting | 10 (2.3%) | 2 (0.5%) | 1 (0.2%) | 0 (0%) | 0 (0%) | 0 (0%) | <0.001 |
| ≥−3 to ≤−2 SD Moderate wasting | 25 (5.7%) | 7 (1.6%) | 9 (2.1%) | 0 (0%) | 0 (0%) | 0 (0%) | |
| >−2 to ≤+1 SD Normal | 78 (17.8%) | 55 (12.6%) | 141 (32.3%) | 5 (1.1%) | 2 (0.5%) | 2 (0.5%) | |
| >+1 to ≤+2 SD Overweight risk | 3 (0.7%) | 1 (0.2%) | 29 (6.6%) | 7 (1.6%) | 1 (0.2%) | 1 (0.2%) | |
| ≥+2–≤+3 SD Overweight | 3 (0.7%) | 1 (0.2%) | 17 (3.9%) | 1 (0.2%) | 1 (0.2%) | 3 (0.7%) | |
| >+3 SD Obesity | 0 (0%) | 0 (0%) | 13 (3.0%) | 10 (2.3%) | 4 (0.9%) | 5 (1.1%) | |
Disclaimer/Publisher’s Note: The statements, opinions and data contained in all publications are solely those of the individual author(s) and contributor(s) and not of MDPI and/or the editor(s). MDPI and/or the editor(s) disclaim responsibility for any injury to people or property resulting from any ideas, methods, instructions or products referred to in the content. |
© 2025 by the authors. Licensee MDPI, Basel, Switzerland. This article is an open access article distributed under the terms and conditions of the Creative Commons Attribution (CC BY) license (https://creativecommons.org/licenses/by/4.0/).
Share and Cite
Rotella, R.; Morales-Suarez-Varela, M.; Llopis-Gonzalez, A.; Soriano, J.M. Assessment of Stunting and Its Effect on Wasting in Children Under Two in Rural Madagascar. Children 2025, 12, 686. https://doi.org/10.3390/children12060686
Rotella R, Morales-Suarez-Varela M, Llopis-Gonzalez A, Soriano JM. Assessment of Stunting and Its Effect on Wasting in Children Under Two in Rural Madagascar. Children. 2025; 12(6):686. https://doi.org/10.3390/children12060686
Chicago/Turabian StyleRotella, Rosita, María Morales-Suarez-Varela, Agustín Llopis-Gonzalez, and José M. Soriano. 2025. "Assessment of Stunting and Its Effect on Wasting in Children Under Two in Rural Madagascar" Children 12, no. 6: 686. https://doi.org/10.3390/children12060686
APA StyleRotella, R., Morales-Suarez-Varela, M., Llopis-Gonzalez, A., & Soriano, J. M. (2025). Assessment of Stunting and Its Effect on Wasting in Children Under Two in Rural Madagascar. Children, 12(6), 686. https://doi.org/10.3390/children12060686