
The Hemodynamic Changes Induced by Lung Recruitment Maneuver to Predict Fluid Responsiveness in Children during One Lung Ventilation—A Prospective Observational Study

Abstract
1. Introduction
2. Methods
2.1. Study Population
2.2. Anesthesia and Establishment of OLV
2.3. Hemodynamic Monitoring
2.4. Lung Recruitment Maneuver (LRM) and Volume Expansion (VE)
2.5. Statistical Analysis
3. Results
4. Discussion
5. Conclusions
Author Contributions
Funding
Institutional Review Board Statement
Informed Consent Statement
Data Availability Statement
Acknowledgments
Conflicts of Interest
Abbreviations
References
- Lazar, A.; Chatterjee, D.; Templeton, T.W. Error traps in pediatric one-lung ventilation. Pediatr. Anesth. 2022, 32, 346–353. [Google Scholar] [CrossRef] [PubMed]
- Xie, S.; Han, D.; Chen, G.; Pan, S. Prediction of fluid responsiveness by dynamic preload parameters in children undergoing thoracoscopic surgery with one-lung ventilation—A prospective observational study. Medicine 2022, 101, e31795. [Google Scholar] [CrossRef] [PubMed]
- Byon, H.J.; Lim, C.W.; Lee, J.H.; Park, Y.H.; Kim, H.S.; Kim, C.S.; Kim, J.T. Prediction of fluid responsiveness in mechanically ventilated children undergoing neurosurgery. Br. J. Anaesth. 2013, 110, 586–591. [Google Scholar] [CrossRef] [PubMed]
- Song, L.-L.; Geng, Z.-Y.; Ma, W.; Liu, Y.-F.; Wang, D.-X. Dynamic variables predict fluid responsiveness in pre-school and school children undergoing neurosurgery: A prospective observational study. Transl. Pediatr. 2021, 10, 2972–2984. [Google Scholar] [CrossRef] [PubMed]
- Kim, E.H.; Lee, J.H.; Jang, Y.E.; Ji, S.H.; Kim, H.S.; Cho, S.A.; Kim, J.T. Prediction of fluid responsiveness using lung recruitment manoeuvre in paediatric patients receiving lung-protective ventilation: A prospective observational study. Eur. J. Anaesthesiol. 2021, 38, 452–458. [Google Scholar] [CrossRef] [PubMed]
- Brower, R.G.; Rubenfeld, G.D. Lung-protective ventilation strategies in acute lung injury. Crit. Care Med. 2003, 31, S312–S316. [Google Scholar] [CrossRef]
- Rose, L. Clinical application of ventilator modes: Ventilatory strategies for lung protection. Aust. Crit. Care 2010, 23, 71–80. [Google Scholar] [CrossRef]
- Zhou, X.-L.; Wei, X.-J.; Li, S.-P.; Ma, H.-L.; Zhao, Y. Lung-protective ventilation worsens ventilator-induced diaphragm atrophy and weakness. Respir. Res. 2020, 21, 16. [Google Scholar] [CrossRef]
- De Broca, B.; Garnier, J.; Fischer, M.-O.M.; Archange, T.; Marc, J.; Abou-Arab, O.; Dupont, H.; Lorne, E.; Guinot, P.-G. Stroke volume changes induced by a recruitment maneuver predict fluid responsiveness in patients with protective ventilation in the operating theater. Medicine 2016, 95, e4259. [Google Scholar] [CrossRef] [PubMed]
- Kimura, A.; Suehiro, K.; Juri, T.; Fujimoto, Y.; Yoshida, H.; Tanaka, K.; Mori, T.; Nishikawa, K. Hemodynamic Changes via the Lung Recruitment Maneuver Can Predict Fluid Responsiveness in Stroke Volume and Arterial Pressure during One-Lung Ventilation. Anesth. Analg. 2021, 133, 44–52. [Google Scholar] [CrossRef]
- Biais, M.; Lanchon, R.; Sesay, M.; Le Gall, L.; Pereira, B.; Futier, E.; Nouette-Gaulain, K. Changes in Stroke Volume Induced by Lung Recruitment Maneuver Predict Fluid Responsiveness in Mechanically Ventilated Patients in the Operating Room. Anesthesiology 2017, 126, 260–267. [Google Scholar] [CrossRef] [PubMed]
- Jeong, D.M.; Ahn, H.J.; Park, H.W.; Yang, M.; Kim, J.A.; Park, J. Stroke Volume Variation and Pulse Pressure Variation Are Not Useful for Predicting Fluid Responsiveness in Thoracic Surgery. Anesth. Analg. 2017, 125, 1158–1165. [Google Scholar] [CrossRef] [PubMed]
- Morakul, S.; Prachanpanich, N.; Permsakmesub, P.; Pinsem, P.; Mongkolpun, W.; Trongtrakul, K. Prediction of Fluid Responsiveness by the Effect of the Lung Recruitment Maneuver on the Perfusion Index in Mechanically Ventilated Patients during Surgery. Front. Med. 2022, 9, 881267. [Google Scholar] [CrossRef] [PubMed]
- DeLong, E.R.; DeLong, D.M.; Clarke-Pearson, D.L. Comparing the areas under two or more correlated receiver operating characteristic curves: A nonparametric approach. Biometrics 1988, 44, 837–845. [Google Scholar] [CrossRef] [PubMed]
- Suehiro, K.; Okutani, R. Influence of tidal volume for stroke volume variation to predict fluid responsiveness in patients undergoing one-lung ventilation. J. Anesth. 2011, 25, 777–780. [Google Scholar] [CrossRef] [PubMed]
- Celebi, S.; Köner, O.; Menda, F.; Korkut, K.; Suzer, K.; Cakar, N. The pulmonary and hemodynamic effects of two different recruitment maneuvers after cardiac surgery. Obstet. Anesth. Dig. 2007, 104, 384–390. [Google Scholar] [CrossRef]
- Cecconi, M.; Monge García, M.I.; Gracia Romero, M.; Mellinghoff, J.; Caliandro, F.; Grounds, R.M.; Rhodes, A. The use of pulse pressure variation and stroke volume variation in spontaneously breathing patients to assess dynamic arterial elastance and to predict arterial pressure response to fluid administration. Anesth. Analg. 2015, 120, 76–84. [Google Scholar] [CrossRef] [PubMed]
- Watanabe, R.; Suehiro, K.; Mukai, A.; Tanaka, K.; Yamada, T.; Mori, T.; Nishikawa, K. Changes in stroke volume induced by lung recruitment maneuver can predict fluid responsiveness during intraoperative lung-protective ventilation in prone position. BMC Anesthesiol. 2021, 21, 303. [Google Scholar] [CrossRef] [PubMed]
- Renner, J.; Broch, O.; Duetschke, P.; Scheewe, J.; Höcker, J.; Moseby, M.; Jung, O.; Bein, B. Prediction of fluid responsiveness in infants and neonates undergoing congenital heart surgery. Br. J. Anaesth. 2012, 108, 108–115. [Google Scholar] [CrossRef]
- Han, D.; Pan, S.; Wang, X.; Jia, Q.; Luo, Y.; Li, J.; Ou-Yang, C. Different predictivity of fluid responsiveness by pulse pressure variation in children after surgical repair of ventricular septal defect or tetralogy of Fallot. Pediatr. Anesth. 2017, 27, 1056–1063. [Google Scholar] [CrossRef]
- Fischer, M.-O.; Pelissier, A.; Bohadana, D.; Gérard, J.-L.; Hanouz, J.-L.; Fellahi, J.-L. Prediction of responsiveness to an intravenous fluid challenge in patients after cardiac surgery with cardiopulmonary bypass: A comparison between arterial pulse pressure variation and digital plethysmographic variability index. J. Cardiothorac. Vasc. Anesth. 2013, 27, 1087–1093. [Google Scholar] [CrossRef] [PubMed]

| Variables | Overall Population (n = 34) | SV | p-Value | MAP | p-Value | ||
|---|---|---|---|---|---|---|---|
| Responders (n = 16) | Non-Responders (n = 18) | Responders (n = 12) | Non-Responders (n = 22) | ||||
| Age (yr.) | 3.3 (2.3–4.3) | 2.6 (2.3–4.9) | 3.5 (2.1–4.3) | 0.746 | 2.8 (2.1–4.1) | 3.4 (2.3–4.4) | 0.631 |
| Gender (M/F) | 16/18 | 7/9 | 9/9 | 0.492 | 5/7 | 11/11 | 0.459 |
| Weight (kg) | 15.1 (12.7–17) | 14.5 (12.5–16.0) | 15.8 (13.0–17.3) | 0.365 | 14.5 (12.5–16.8) | 15.3 (13–17) | 0.683 |
| Height (cm) | 97.5 (90–104) | 94 (90.3–103.5) | 101 (89.8–106.0) | 0.484 | 96 (87–104.3) | 98 (91–106) | 0.736 |
| Type of surgery, n (%) | |||||||
| ASD | 15 (44.1) | 7 (44) | 8 (44) | 0.620 | 6 (50) | 9 (41) | 0.439 |
| VSD | 17 (50) | 8 (50) | 9 (50) | 0.634 | 5 (42) | 12 (55) | 0.360 |
| ASD and VSD | 2 (5.9) | 1 (6) | 1 (6) | 0.727 | 1 (8) | 1 (4) | 0.588 |
| Variables | T1 | T2 | p a | T3 | T4 | p b |
|---|---|---|---|---|---|---|
| HR (bpm) | 94.1 ± 12.6 | 85.6 ± 12.0 | <0.001 * | 94.4 ± 12.6 | 85.7 ± 13.0 | <0.001 * |
| SAP (mmHg) | 93.3 ± 11.9 | 85.9 ± 11.6 | <0.001 * | 88.8 ± 11.2 | 94.5 ± 13.4 | <0.001 * |
| DAP (mmHg) | 50.9 ± 7.7 | 45.8 ± 5.8 | <0.001 * | 48.3 ± 5.0 | 49.0 ± 7.0 | 0.433 |
| MAP (mmHg) | 67.7 ± 8.8 | 60.3 ± 7.0 | <0.001 * | 64.0 ± 6.6 | 64.2 ± 8.8 | 0.852 |
| SV (ml) | 12.0 ± 2.9 | 7.3 ± 2.7 | <0.001 * | 10.7 ± 2.7 | 14.0 ± 2.9 | <0.001 * |
| SVV (%) | 5.7 ± 2.0 | 8.2 ± 2.5 | 3.6 ± 1.3 | <0.001 * | ||
| PPV (%) | 8.1 ± 2.4 | 6.6 ± 2.1 | 6.9 ± 2.1 | 0.451 | ||
| ΔSVLRM (%) | −7.6 ± 12.3 | |||||
| ΔMAPLRM (%) | −4.0 ± 7.0 | |||||
| ΔSVVE (%) | 6.3 ± 8.5 | |||||
| ΔMAPVE (%) | 0.1 ± 10.6 |
| Variables | AUC | Standard Error a | 95% CI | p |
|---|---|---|---|---|
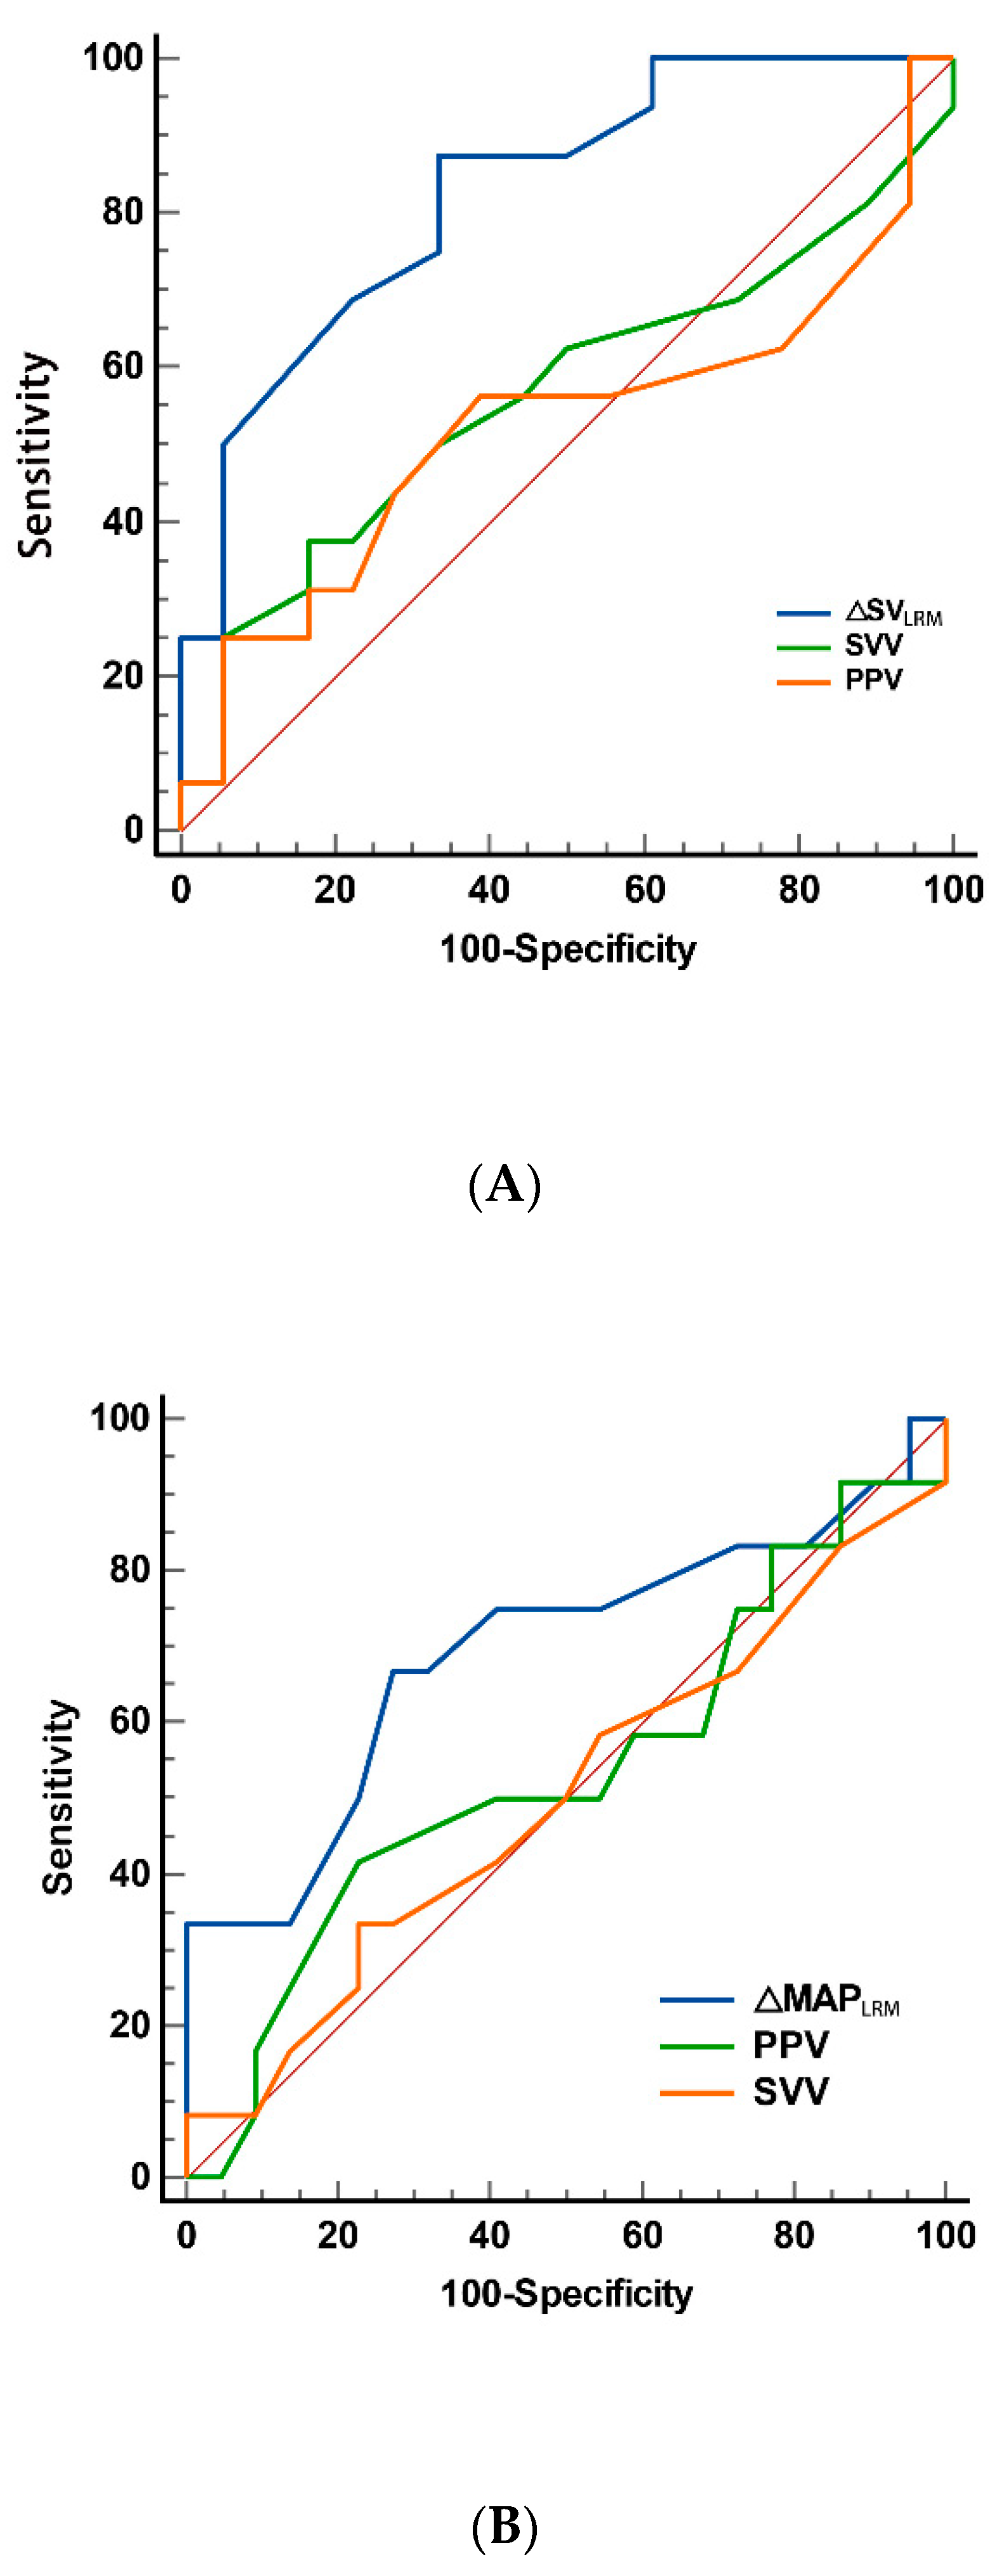
| ΔSVLRM (%) | 0.828 | 0.070 | 0.660 to 0.935 | <0.001 |
| SVV1 | 0.611 | 0.100 | 0.429 to 0.773 | 0.268 |
| SVV3 | 0.546 | 0.105 | 0.384 to 0.733 | 0.540 |
| PPV1 | 0.655 | 0.099 | 0.472 to 0.809 | 0.118 |
| PPV3 | 0.526 | 0.107 | 0.348 to 0.699 | 0.808 |
| Variables | AUC | Standard Error a | 95% CI | p |
|---|---|---|---|---|
| ΔMAPLRM (%) | 0.693 | 0.107 | 0.512 to 0.839 | 0.070 |
| SVV1 | 0.545 | 0.111 | 0.366 to 0.716 | 0.682 |
| SVV3 | 0.500 | 0.111 | 0.324 to 0.676 | 0.989 |
| PPV1 | 0.585 | 0.104 | 0.404 to 0.751 | 0.414 |
| PPV3 | 0.500 | 0.105 | 0.324 to 0.676 | 0.989 |
Disclaimer/Publisher’s Note: The statements, opinions and data contained in all publications are solely those of the individual author(s) and contributor(s) and not of MDPI and/or the editor(s). MDPI and/or the editor(s) disclaim responsibility for any injury to people or property resulting from any ideas, methods, instructions or products referred to in the content. |
© 2024 by the authors. Licensee MDPI, Basel, Switzerland. This article is an open access article distributed under the terms and conditions of the Creative Commons Attribution (CC BY) license (https://creativecommons.org/licenses/by/4.0/).
Share and Cite
Liu, T.; He, P.; Hu, J.; Wang, Y.; Shen, Y.; Peng, Z.; Sun, Y. The Hemodynamic Changes Induced by Lung Recruitment Maneuver to Predict Fluid Responsiveness in Children during One Lung Ventilation—A Prospective Observational Study. Children 2024, 11, 649. https://doi.org/10.3390/children11060649
Liu T, He P, Hu J, Wang Y, Shen Y, Peng Z, Sun Y. The Hemodynamic Changes Induced by Lung Recruitment Maneuver to Predict Fluid Responsiveness in Children during One Lung Ventilation—A Prospective Observational Study. Children. 2024; 11(6):649. https://doi.org/10.3390/children11060649
Chicago/Turabian StyleLiu, Ting, Pan He, Jie Hu, Yanting Wang, Yang Shen, Zhezhe Peng, and Ying Sun. 2024. "The Hemodynamic Changes Induced by Lung Recruitment Maneuver to Predict Fluid Responsiveness in Children during One Lung Ventilation—A Prospective Observational Study" Children 11, no. 6: 649. https://doi.org/10.3390/children11060649
APA StyleLiu, T., He, P., Hu, J., Wang, Y., Shen, Y., Peng, Z., & Sun, Y. (2024). The Hemodynamic Changes Induced by Lung Recruitment Maneuver to Predict Fluid Responsiveness in Children during One Lung Ventilation—A Prospective Observational Study. Children, 11(6), 649. https://doi.org/10.3390/children11060649