Abstract
General linear modeling (GLM) has been widely employed to estimate the hemodynamic changes observed by functional near infrared spectroscopy (fNIRS) technology, which are found to be nonlinear rather than linear, however. Therefore, GLM might not be appropriate for modeling the hemodynamic changes evoked by cognitive processing in developmental neurocognitive studies. There is an urgent need to identify a better statistical model to fit into the nonlinear fNIRS data. This study addressed this need by developing a quadratic equation model to reanalyze the existing fNIRS data (N = 38, Mage = 5.0 years, SD = 0.69 years, 17 girls) collected from the mixed-order design Dimensional Change Card Sort (DCCS) task and verified the model with a new set of data with the Habit-DisHabit design. First, comparing the quadratic and cubic modeling results of the mixed-order design data indicated that the proposed quadratic equation was better than GLM and cubic regression to model the oxygenated hemoglobin (HbO) changes in this task. Second, applying this quadratic model with the Habit-DisHabit design data verified its suitability and indicated that the new design was more effective in identifying the neural correlates of cognitive shifting than the mixed-order design. These findings jointly indicate that Habit-DisHabit Design with a quadratic equation might better model the hemodynamic changes in preschoolers during the DCCS task.
1. Introduction
Near-infrared spectroscopy (NIRS) technology is a portable and comfortable way to measure the hemodynamic changes in targeted brain areas [1,2,3]. It can generate time-sensitive data that can be analyzed using general linear modeling (GLM) to estimate the changes in oxygenated hemoglobin (HbO) and deoxyhemoglobin (HbR) between the task and baseline. For instance, Li et al. examined the effect of heavy tablet use on preschoolers’ executive function during the Dimensional Change Card Sort (DCCS) task using functional NIRS (fNIRS) [4]. They conducted t-tests and GLM to compare the hemodynamic changes in the non-user and the heavy user groups. They found a significant between-group difference in activating the prefrontal cortex (Brodmann Area 9, BA 9). The ‘Non-user’ activation pattern was ‘normal and healthy’, whereas the ‘Heavy-user’ pattern was ‘not normal and thus needs further exploration’ [4]. However, they presented no further statistical evidence to demonstrate how ‘abnormal’ the ‘Heavy-user’ pattern was, as the GLM results provided no details about the local maximum of HbO changes and their estimated time, making exact comparisons of the two ways impossible. In addition, the hemodynamic changes over time in brain areas are a nonlinear rather than linear relationship; thus, the GLM analysis conducted by Li et al. [4] might be inappropriate or even inaccurate. To solve this problem, Li et al. [5] proposed a quadratic function to better model the hemodynamic changes of the DCCS task, demonstrating a nonlinear U-shape paradigm. Still, they did not compare the quadratic results against the GLM and the cubic equation analyses. Thus, they could not conclude whether the quadratic equation would be better than GLM and cubic equation results. To fill this gap, this study aimed to re-analyze the same data with a quadratic and cubic equation to identify a better way to model the hemodynamic responses in the DCCS task. Furthermore, the proposed quadratic equation was also applied to analyze a set of DCCS data with a new design to verify its suitability and appropriateness.
1.1. Modeling Hemodynamic Changes with GLM
fNIRS technology allows us to monitor brain activation by measuring hemodynamic changes, such as the concentration of HbO and HbR in targeted brain areas. The HbO and HbR data are dynamic and changing over time; thus, advanced statistical analyses are needed to examine this type of time-sensitive data [1,2,3]. However, no systematic and standardized approaches were established in the first decade of this millennium; thus, NIRS scientists had the liberty to choose the statistical methods they believed to be appropriate and adequate. Schroeter et al. [6] initially proposed employing general linear modeling (GLM) as the standard statistical approach to analyzing fNIRS data. Accordingly, Pouliot et al. [7] concluded that GLM could be used as a legal analysis to examine fNIRS data for spikes and seizures. In 2014, Tak and Ye [8] systematically reviewed the commonly used statistics such as principal component analysis, independent component analysis, false discovery rate, and inference statistics such as the standard t-test, F-test, analysis of variance, and statistical parameter mapping framework. Eventually, they proposed adopting the GLM mixed-effect model with restricted maximum likelihood variance estimation to model hemodynamic changes [8].
Since then, employing GLM to estimate hemodynamic changes has become the standard inference statistic for fNIRS data. GLM empowers scientists to assess the subject, channel, and task-specific evoked hemodynamic responses and to robustly separate the evoked brain activity from systemic physiological interference using independent measures of nuisance regressors [1,2,3]. In addition, GLM can significantly enhance the contrast-to-noise ratio of the brain signal, improve feature separability, and ultimately lead to better classification accuracy. In 2015, for example, Bonomini et al. [9] proposed and confirmed a GLM-based new algorithm to statistically estimate the hemodynamic activations, with a K-means method to cluster channels as activated or not activated. Later, Pinti et al. [10] presented a novel analysis method based on the GLM least-squares fit analysis and verified its accuracy and feasibility in modeling fNIRS data in naturalistic environments. Recently, von Lühmann et al. [11] found that GLM could provide better single-trial estimates of brain activity and a new feature type, such as the weight of the individual and channel-specific hemodynamic response function regressor. However, the hemodynamic changes recorded by fNIRS are nonlinear rather than linear; thus, GLM might not be an appropriate statistical method. This study endeavored to identify a better statistical way by comparing quadratic and cubic modeling results of the same DCCS fNIRS data.
1.2. Modeling Hemodynamic Changes in the DCCS Task
The DCCS task asks children to sort a set of two-dimensional (i.e., color and shape) test cards (3.5 × 7.0 cm) according to the two target cards that match the former in one dimension but not the other. Then, the children are asked to sort the test cards according to one extent matching the target card (red/blue; shape: boat/rabbit). And the rule for matching is changed according to the experimenter’s instruction (See Figure 1). Initially, Morriguchi and his colleagues [12] conducted fNIRS studies on the DCCS task. They conducted t-tests and correlation analyses to compare HbO changes between the task and baseline conditions. Recently, Moriguchi and Lertladaluck [13] and Xie et al. [14] conducted the exact t-tests and correlation analyses of the HbO changes during the same DCCS task. However, the results were contradictory: Moriguchi and Lertladaluck [13] found no significant relationship between prefrontal activations and English proficiency, whereas Xie et al. [14] found a significant correlation. This inconsistency indicated that either the data analysis or the DCCS task paradigm employed by the two teams might need to be revised in identifying the specific neural correlates responsible for cognitive shifting of the DCCS task.
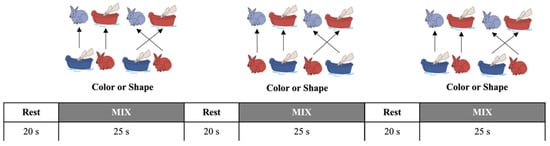
Figure 1.
The mixed-order design DCCS tasks [4,12,14]. It was a block design with a mixed order of switching rules. The children performed three consecutive test sessions, each consisting of three rest phases (20 s) and three testing phases (25 s). This mixed-order design prevented the children from accurately predicting the switching rules and, thus, could not generate habituation.
Therefore, first, Li et al. [15] developed the “habituation–dishabituation paradigm of DCCS task” (“Habit-Dishabit Design” hereafter) and proposed a more direct and critical indicator—the “V shape by GLM” to identify cognitive shifting. As shown in Figure 2, this paradigm has improved the arrangement of testing items to maximize the chances of habituation and dishabituation in the participating children. In the pre-switch period (20′), the children were asked to sort six or more cards using the same rule and thus tended to be habituated. Then, they were asked to use the other rule to sort another set of cards (6 or more) in the post-switch period (20′). The three sessions followed the same sorting rule as the second period of the previous session: Session 1: color (6 cards) → shape (6 cards); Session 2: shape (6 cards) → color (6 cards); and Session 3: color (6 cards) → shape (6 cards). The children tended to be habituated when they anticipated that the second round of sorting cards should follow the same rule. In other words, this paradigm helped to trigger the occurrence of habituation and dishabituation. Second, they [15] proposed a pair of GLMs to estimate HbO changes (∆HbO) for the pre- and post-switch periods, using the same regression formula:
YΔHbO = a pre-switch or post-switch X time + b + ε.
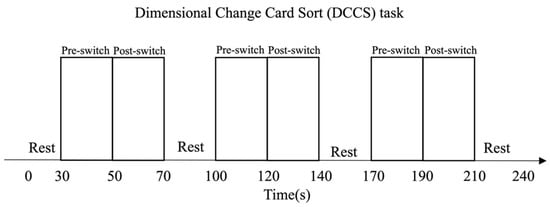
Figure 2.
The Habit-DisHabit Design DCCS Task [15]. It was a block design with a fixed order of switching rules. The children performed three consecutive test sessions, each consisting of three rest phases (30 s) and three testing phases (40 s). This fixed-order design promoted the children to predict the switching rules accurately and thus habituate their responses.
In this GLM equation, X time refers to the response time and Y predicts each channel’s hemodynamic changes (∆HbO). A perfect V-shape could be verified if the a pre-switch is negative (−a), whereas the a post-switch is positive (+a), and both models are significant. The corresponding channel was identified as the neural correlate of ‘cognitive shifting’ [15]. Using this new paradigm, they found a V-shape in BA 6, BA 8, BA 9, BA 10, BA 40, and BA 44, which should be regarded as the neural correlations of cognitive shifting during the DCCS task [15].
1.3. The Context of This Study
Recently, Li et al. [4] adopted the mixed-order design DCCS and GLM by Moriguchi and Lertladaluck [12] and Xie et al. [13] to examine the impact of tablet use on preschoolers’ executive function. Using the V-shape by GLM (Equation (1)), they found that the non-users outperformed the heavy users with a significantly higher correct rate in the DCCS task. And the two groups differed significantly in the activation of BA 9 (ch 16), indicating that the Non-user pattern was ‘normal and healthy’ [4]. In contrast, the heavy user pattern was ‘not normal and needs further exploration’. However, the hemodynamic changes in each channel should be a kind of nonlinear relationship [1,2,3]. In addition, the V-shape by GLM was analyzed and confirmed using a pair of GLMs (Equation (1)): one for the pre-switch period and the other for the post-switch period. This might not be appropriate for modeling the continuous HbO changes evoked by cognitive processing during the DCCS task. The children’s hemodynamic responses are continuous and indivisible during the two periods. Therefore, Li et al. [5] proposed a quadratic function (Equation (2)) to better model the hemodynamic changes of the DCCS task:
In particular, ∆HbO refers to the HbO changes between the task and baseline, is randomly distributed with a mean of zero, and Xtime refers to the experiment time [14]. Thus, if a > 0, the curve is a typical U-shape; if a = 0, the quadratic function does not exist, indicating a linear relationship that GLM could model; and if a < 0, the curve is a reversed U-shape.
However, Li et al. [5] did not compare the quadratic results against GLM and the cubic equation analyses, thus failing to identify the best model. Therefore, in this study, we hypothesized that this U-shaped curve by the quadratic function might be more statistically appropriate for modeling hemodynamic changes in the DCCS task than the V-shape by GLM [14]. In addition, we also hypothesized that the “Habit-DisHabit Design” might be more appropriate for identifying the neural correlates of cognitive shifting. Accordingly, this study is dedicated to addressing the following questions:
- Is a quadratic equation better than GLM and cubic equations to model the hemodynamic changes caused by cognitive shifting in the DCCS task?
- Is mixed-order design better than Habit-DisHabit design to identify cognitive shifting in the DCCS task?
2. Materials and Methods
2.1. Participants
This study first re-analyzed the fNIRS data from Li et al. [4], which recruited 38 children (ages 4 to 6.3 years, Mage = 5.0 years, SD = 0.69 years, 17 girls, 21 boys). Please refer to Li et al. [4] for sample details. Then, we applied the quadratic equation to analyze fNIRS data collected from the same sample with a new experiment design: the Habit-DisHabit Design DCCS Task. According to Li et al. [4], their parents consented and completed the survey to help identify the heavy users or non-users of tablets at home. Eight children never used tablets; thus, they were included in the ‘Non-user’ group (two girls and six boys). About 16 (12 girls and 4 boys) children were classified into the ‘Heavy-user’ group” because (1) their daily screen time was more than the mean level (M = 17.98 min, SD = 14.29); (2) their tablet use was neither regulated nor limited; and (3) they carried out multiple activities with tablets. In particular, all the participating children were recruited from one public kindergarten in a middle-class Shenzhen community. Their parents and class teachers reported no problems in the children’s neurological or general physical and mental health status. They conducted a post hoc power analysis on G*Power 3.1, using a two-tailed test, a medium effect size (d = 0.50), and an alpha of 0.05 and found that the results could achieve a power of 0.32 [4].
2.2. Experimental Paradigm and Instructions
2.2.1. The Mixed-Order Design DCCS Task
This task included 2 target cards and 24 test cards, each different in shape and color. One pair of target trays was used for the three consecutive test sessions, and each session consisted of a rest (20 s) phase and a mix (25 s) phase. During the rest phase, the children were asked to be still, doing nothing. As shown in Figure 1, the children were asked to sort the cards according to the instructed rule (color or shape) during the mix phase. The children were given the rule before each trial. Then, in each block, the rule-changing order was fixed and mixed: shape, shape, color, shape, shape, color, shape, shape (a total of 8 cards per block). This fixed order was applied to all the participants to overcome habituation, resulting in more color-to-shape switches in total [4]. For details about this mixed-order design’s experimental paradigm and instructions, please refer to Li et al. [4].
2.2.2. The Habit-DisHabit Design DCCS Task
This task is different from the mixed-order design. As shown in Figure 2, the children were asked to sort eight to twelve cards using the same rule within the pre-switch period (20 s). Then, they were asked to use the other rules to sort another eight to twelve cards within the post-switch period (20 s). The three sessions followed the same sorting rule as the second period of the previous session: Session 1: color (20 s) → shape (20 s); Session 2: shape (20 s) → color (20 s); and Session 3: color (20 s) → shape (20 s). This design was inductive to cognitive habituation and dishabituation by repeating the changing rules in the pre-switch period [15]. For details about this design’s experimental paradigm and instructions, please refer to Li et al. (2021) [15].
2.3. System and Acquisition
2.3.1. The fNIRS System
In Li et al.’s studies [4,15] and this study, the same multiple-channel fNIRS system (Oxymon Mk III, Artinis, The Netherlands) and child caps were used to simultaneously measure the concentration changes in HbO, HbR, and total hemoglobin (HbT) in the participants. In particular, both studies employed child caps accompanied by the NIRS instrument, which digitized the optode positions, corresponding to Brodmann areas, as shown in Figure 3. An experienced NIRS technician conducted cap placement, hair manipulation and tossing, and optode installation (based on the 10/20 system). This process usually took 10 min, during which the participant was engaged in storybook reading with an experienced preschool teacher. For details, please refer to Li et al. [4].
2.3.2. Data Acquisition
Two wavelengths in the near-infrared range (i.e., 760 nm and 850 nm) were used to measure the changes in optical density and were then converted into changes in the concentration of HbO and HbR using the modified Beer–Lambert law [4,14]. The 17 channels were located following the international 10/20 system for EEG, as shown in Figure 1 of Li et al. (2021) [4], with a 2.5 cm distance between each paired emitter and detector. In particular, the region of interest (ROI) was located at Brodmann areas (BAs) 6/8/9/10/40/44 [4]. In particular, as shown in Figure 3, channels 1 and 9 were located in BA 6, channels 13, 15, and 17 were located in BA 10, channel 10 was located in BA 8, channels 11, 12, 14, and 16 were located in BA 9, channel 4 was located in BA 40, and channels 2, 3, 5, 6, and 7 and 8 were located in the right inferior frontal gyrus (BA 44).
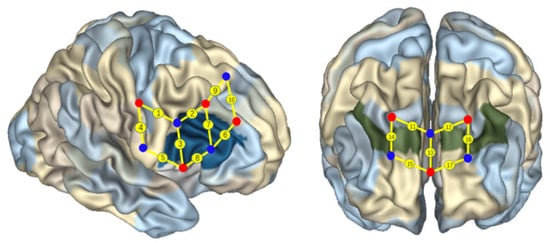
Figure 3.
Localization of regions of interest [4,6,14]. The red and blue solid circles present the light sources and the probes, respectively. The numbers on the small spheres on the brain map indicate the 17 channels (ch). Channel localization was based on the upper central probe, anchored at Fz according to the international 10–20 system and located at the midpoint between channels 11 (ch 11) and 12 (ch 12). Ch 1 and ch 9 were located in Broadmann area (BA) 6, ch 10 was located in BA 8, ch 11, ch 12, ch 14, and ch 16 were located in BA 9, ch 13, ch 15, and ch 17 were located in BA 10, ch 4 was located in BA 40, and ch 2, ch 3, ch 5, ch 6, ch 7, and ch8 were located in the right IFC (BA 44).
2.3.3. Data Analysis
In Li et al. [4,15] and this study, the mean of the z-scores (HbO and HbR) was calculated for each DCCS task block separately for each participant. Then, the mean of the z-scores (HbO and HbR) was calculated by averaging across the three task blocks for each participant. Finally, the means of the z-scores (HbO and HbR) across all channels were compared using t-tests between the ‘Non-user’ and the ‘Heavy-user’ groups using SPSS. Li et al. [4] conducted GLM analysis predicting z-scores (HbO and HbR) in channel 16 in R () [Equation (1)]. This study explored two sets of polynomial regression to better fit the nonlinear relationship between the hemodynamic changes and the experiment time. The first set was a quadratic equation using R [] [Equation (2)]. If a > 0, the curve is a typical U-shape; if a = 0, the quadratic function does not exist, indicating a GLM linear relationship; and if a < 0, the curve is a reversed U-shape. The second set was a cubic equation analysis using the following equation:
If a = 0, the cubic function does not exist, indicating that a quadratic equation or GLM (if b = 0) should be considered. This study would compare the statistical results of the three equations (Equations (1)–(3)) and identify the best-fit model.
3. Results
3.1. Comparison of the Quadratic and Cubic Modeling Results
First, as shown in Table 1 and Figure 4, the quadratic analysis results for the non-user group indicated that: (1) a U-shaped curve (a > 0) was observed in nine channels (ch 1, 2, 5, 6, 7, 8, 9, 11, and 14), and the quadratic model could significantly explain 7.5% to 94.3% of the variance in HbO, R2s > 0.075, Fs > 5.94, ps < 0.001; (2) the quadratic model did not exist in channels 3 and 4 (a = 0), R2s > 0.66, Fs = 145.65, ps < 0.001, whereas GLM applied; and (3) a reversed U-shaped curve (a < 0) was observed in channels 10, 12, 13, 15, 16, and 17, R2s > 0.27, Fs > 27.27, ps < 0.001. The significant R2s, F-values and p-values jointly indicated that the U-shaped curve was found for BA 6 (ch 1 and 9), BA 9 (ch 11 and 14), and BA 44 (ch 2, 5, 6, 7, and 8), which were involved in cognitive shifting. Only two channels (ch 3 and 4) could not be estimated by this quadratic equation modeling. Next, a set of cubic equation analyses was conducted for the non-user group, with X3 as the cubic term in addition to X2 as the quadratic term and X as the linear term. However, as shown in Table 2, the results for the non-user group indicated that only two channels (ch 11 and 13) could apply to the cubic regression (a ≠ 0). All other channels should be modeled with a quadratic equation (a = 0). These results indicated that the proposed quadratic equation might be more appropriate than the cubic equation to analyze the DCCS data collected in this study.

Table 1.
The quadratic modeling results for the non-user group.
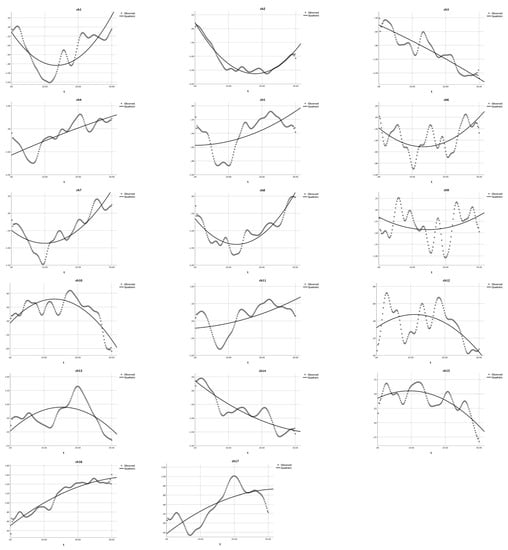
Figure 4.
Quadratic modeling the HbO changes in the non-user group. The dotted lines present the observed HbO changes, and the solid lines demonstrate the quadratic curves. The X-axis represents the time (t) and the Y-axis presents the z-scores of HbO changes.
Table 2.
The cubic modeling results for the non-user group.
Second, as shown in Table 3 and Figure 5, the quadratic analysis results for the heavy user group indicated that: (1) a U-shaped curve (a > 0) was observed in channels 2–5, 8, 12, 16, and 17; the quadratic model could significantly explain 37.1% to 92.3% of the HbO changes, R2s > 0.037, Fs > 43.25, ps < 0.001; (2) the quadratic model did not exist in channels 1, 6, 7, and 13 (a = 0), R2s > 0.059, Fs > 4.68, ps < 0.011, whereas the cubic model applied; and (3) a reversed U-shaped curve (a < 0) was observed in channels 9–11 and 14–5, R2s > 0.117, Fs > 9.87, ps < 0.001. The significant R2s, F-values, and p-values jointly indicated that the U-shaped curve was found in BA 9 (12 and 16), BA 10 (17), BA 40 (ch 4), and BA 44 (ch 2, 3, 5, and 8). Four channels (ch 1, 6, 7, and 13) could not be estimated by this quadratic equation (see Table 3). In contrast, a set of cubic equation analyses was conducted for the heavy user group, with X3 as the cubic term in addition to X2 as the quadratic term and X as the linear term. As shown in Table 4, the results for the heavy user group indicated that no channels could be estimated by the cubic regression as a = 0. Therefore, all these results jointly indicated that the proposed quadratic equation might be more appropriate than the cubic equation to analyze the DCCS data collected in this study.
Table 3.
The quadratic modeling results for the heavy user group.
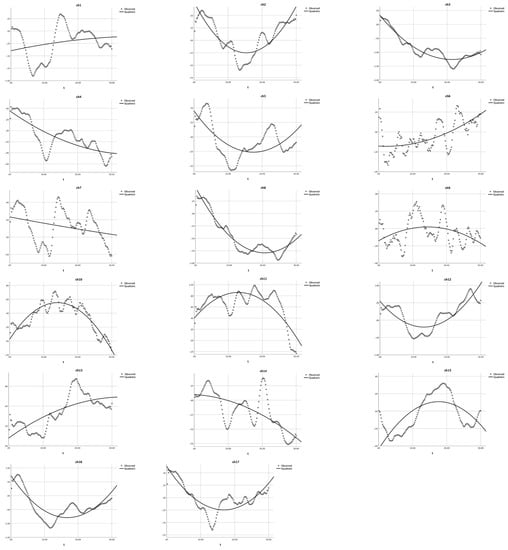
Figure 5.
Quadratic equation modeling the HbO changes in the heavy user group during the mixed-order design DCCS tasks [15]. The dotted lines present the observed HbO changes and the solid lines demonstrate the quadratic curves. The X-axis represents the time (t) and the Y-axis presents the z-scores of HbO changes.
Table 4.
The cubic modeling results for the heavy user group.
3.2. Verification of Quadratic Modeling with New DCCS Data
We applied quadratic modeling with the Habit-DisHabit design DCCS data to verify its suitability. As shown in Table 5 and Figure 6, the quadratic regression results for the non-user group indicated that: (1) a U-shaped curve (a > 0) was observed in 14 channels (ch 1, 2, 4, 5,7, 8, 9, and 11–17), and the quadratic predictor (experiment time) could explain 48.1% to 96.3% of the variance (HbO), R2s > 0.48, Fs > 91.16, ps < 0.001; (2) the quadratic function does not exist in channels 3 and 6 (a = 0), R2s > 0.050, Fs = 5.39, ps < 0.005; and (3) a reversed U-shaped curve (a < 0) was observed in channels 10, R2 = 0.570, F = 130.73, p < 0.001. The significant R2s, F-values, and p-values jointly indicated that the U-shaped curve was found for BA 6 (ch 1 and 9), BA 9 (ch 11, 12, 14, and 16), BA 40 (ch 4), and BA 44 (ch 5, 7, and 8), which were involved in cognitive shifting. Only two channels (ch 3 and 6) could not be estimated by this quadratic equation.
Table 5.
Quadratic regression predicting HbO changes for the non-user group in the DCCS Habit-DisHabit design task.
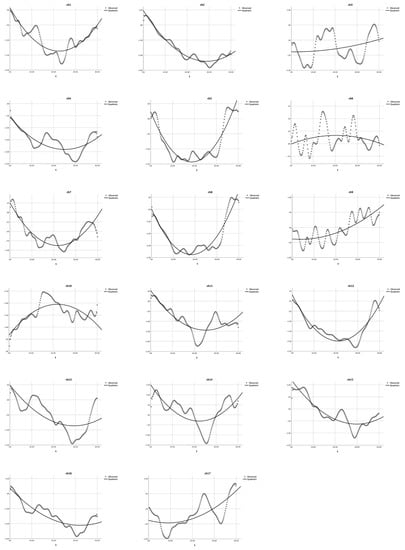
Figure 6.
Quadratic equation modeling the HbO changes in the non-user group during the Habit-DisHabit DCCS Task. The dotted lines present the observed HbO changes, and the solid lines demonstrate the quadratic curves. The X-axis represents the time (t) and the Y-axis presents the z-scores of HbO changes.
Next, as shown in Table 6 and Figure 7, the quadratic modeling results for the heavy user group indicated that: (1) a U-shaped curve (a > 0) was observed in channels 1, 2, 4, 8, 9, 11, 12, 14, and 16, and the quadratic predictor (experiment time) could significantly explain 23.3% to 80.3% of HbO changes, R2s > 0.233, Fs > 29.95, ps < 0.001; (2) the quadratic function does not exist in channels 3, 5–7, 10, 13, 15, and 17 (a = 0), R2s > 0.028, Fs > 2.92, ps < 0.05; and (3) no reversed U-shaped curve (a < 0) was observed. The significant R2s, F-values, and p-values jointly indicated that the U-shaped curve was found in BA 6 (ch 1 and 9), BA 9 (11, 12, 14 and 16), BA 40 (ch 4), and BA 44 (ch 2 and 8). Eight channels (ch 3, 5, 6, 7, 10, 13, 15, and 17) could not be estimated by this quadratic equation.
Table 6.
Quadratic regression predicting HbO changes for the heavy user group in the DCCS Habit-DisHabit design task.
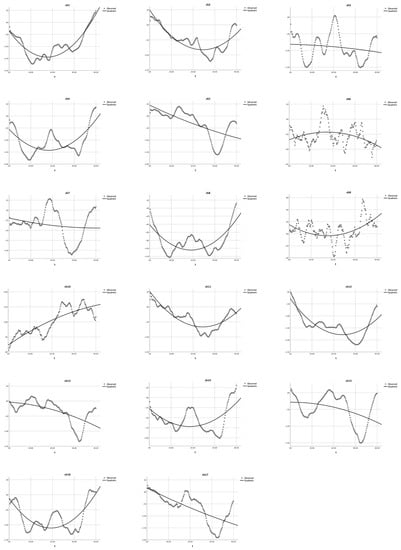
Figure 7.
Quadratic equation modeling the HbO changes in the heavy user group during the Habit-DisHabit DCCS task. The dotted lines present the observed HbO changes, and the solid lines demonstrate the quadratic curves. The X-axis represents the time (t), and the Y-axis presents the z-scores of HbO changes.
In summary, the above modeling results for the mixed-order and Habit-DisHabit design tasks jointly indicated that Equation (2) might be the most suitable model for estimating the hemodynamic changes caused by cognitive shifting. As shown in the summary of Table 7, this model can help identify the most pronounced U-shape in all of the channels observed in the DCCS studies.
Table 7.
Observed U-shape by quadratic modeling in the HbO changes for the non-user and heavy user groups.
4. Discussion
4.1. Quadratic: More Appropriate Modeling
Previous studies that investigated the HbO changes during the DCCS task [12,13,14] employed t-tests and correlation analyses, which are descriptive and correlational methods that depend on the sample size and may produce inconsistent results. For example, Moriguchi and Lertladaluck [13] found no significant effects, while Xie et al. [14] reported a significant correlation. Moreover, these methods could not establish the causal relationship between behavioral and hemodynamic changes in the DCCS task. Thus, Li et al. [15] introduced the “V shape by GLM” (Equation (1)) to model the hemodynamic changes of cognitive shifting, which is an improvement over the previous analytical approaches. However, this linear model does not adequately capture the hemodynamic changes in each channel, as the HbO changes are continuous and wave-like rather than discrete and linear. Therefore, it is not suitable to use GLM to simulate the hemodynamic changes, and a more appropriate statistical model is needed.
Accordingly, this study first reanalyzed the data in Li et al. [4], using both quadratic and cubic equations to model the continuous HbO changes in the DCCS tasks with the mixed-order design. In particular, as shown in Table 2 (the non-user group), only two channels (ch 11 and 13) could be modeled by Equation (3); the other 15 channels were quadratic models. Furthermore, for the heavy user group (Table 4), all channels could not be modeled by Equation (3) (cubic modeling); instead, only quadratic modeling could fit the HbO changes in the 17 channels. As shown in Figure 4 and Figure 5, a comparison of the modeling results indicated that quadratic modeling (Equation (2)) was more effective and appropriate than cubic modeling (Equation (3)).
Next, comparing the quadratic modeling results with the GLM results in Li et al. [4] indicated that nonlinear modeling might be a more sensitive and better fit than linear modeling. In particular, the GLM results in Li et al. [4] demonstrated that BA 9 was significantly activated only in the non-user group during the DCCS task. In contrast, a significant decrease was found for the heavy user group, demonstrating a substantial increase after the twelfth second [4]. Thus, they concluded that BA 9 was significantly activated only in the non-user group during the DCCS task. However, this study reanalyzed the same data using the quadratic equation and found a significant U-shape in this channel (BA 9) for both non-user and heavy user groups, indicating that BA 9 was an essential neural correlate of cognitive shifting. Why could the GLM results not identify the nuance changes in the heavy user group? This is because GLM could only generate a line to demonstrate the general trend. Thus, it could not model the second half of the quadratic curves of the mixed-order DCCS task, especially when there was a U-shape. Therefore, this comparison indicated that the U-shape by a quadratic equation might be more powerful and efficient in identifying the neural correlates of cognitive shifting.
Last, this study also applied Equation (2) with the new Habit-DisHabit design data and found a U shape in 14 channels; only one channel (ch 10) had a reversed U shape. This finding indicated that quadratic equations rather than GLM could help identify the neural correlations of cognitive shifting in the DCCS task. Therefore, the quadratic equation (Equation (2)) might be a better model of the hemodynamics of cognitive shifting and should be widely promoted to analyze the DCCS fNIRS data.
4.2. Habit-DisHabit Design: More Effective for Identifying Cognitive Shifting
This study first re-analyzed Li et al. [4] data with a quadratic equation and identified the U-shape in 9 channels for the non-user group. Then, an analysis of the new Hab-it-DisHabit design data found a U-shape in 14 channels. Similarly, the re-analysis identified a U-shape in 8 channels within the heavy user group, whereas the new design data demonstrated it in 9 channels. The within-group increases in U shape indicated that the Habit-DisHabit design could help identify more correlated channels of cognitive shifting in the DCCS task. In addition, within the non-user group, the mixed-order design data indicated that six channels had a reversed U-shape, indicating that the corresponding channels’ HbO changes increased over time.
In contrast, the Habit-DisHabit design data indicated only one channel (ch 10) had a reversed U-shape. Therefore, this accumulative increase cannot reflect the rise and fall of HbO over time corresponding to cognitive shifting. For the heavy user group, the mixed-order design data indicated that five channels had a reversed U-shape, indicating that the HbO changes increased over time. In contrast, the Habit-DisHabit design data indicated no channel had a reversed U-shape, indicating a tendency of decreasing HbO in all the channels. This tendency might reflect the unique brain activation pattern of the Heavy user, which will be further explored in future studies.
Most of the fNIRS studies on the DCCS task analyzed the changes in HbO between the task and baseline conditions and, accordingly, could not identify the specific neural correlates responsible for cognitive shifting (CS). There is an urgent need to identify the direct and critical indicator of CS, and the key to this search is ‘habituation’, the fundamental mechanisms underlying human being’s cognition and behavior [15]. When the same stimulus (switching rule) is repeated repeatedly, there will be a reduced response from the exact neural correlates and a decrease in HbO in the blood [16]. Unfortunately, the widely used mixed-order DCCS design [12,13,14] kept changing the switching rules, thus preventing children from habituating their responses. Therefore, this design could not generate the habituation–dehabituation process, which could be an observable marker of the CS. Instead, the Habit-DisHabit design prompted habituation and dishabituation in the children’s responses; the ‘U-shape’ with quadratic modeling could exactly demonstrate the occurring moment of cognitive shifting for each channel, which is more powerful in identifying the neural correlates of CS. In summary, this comparison indicated that the Habit-DisHabit design might be more effective in identifying the neural correlates of and should be widely promoted in the DCCS tasks and should be widely promoted. Nevertheless, further studies with more samples could help verify and improve this new design.
5. Conclusions, Limitations, and Implications
First, this study found that quadratic equations [Equation (2)] might be more appropriate for modeling the HbO changes in the DCCS tasks by re-analyzing Li et al. [4] and analyzing the new data. Second, this study proved that the Habit-DisHabit design DCCS, in conjunction with the quadratic equation, could effectively identify the neural correlates of cognitive shifting.
However, these results must be interpreted cautiously, as the sample size was tiny. The previous studies by Li et al. [4,15] were stopped by the unexpected COVID-19 lockdown in China in late January 2020. Thus, only 38 complete cases were included in this study. In the future, more samples with more age ranges should be involved to further verify this quadratic modeling method and the Habit-DisHabit design.
Nevertheless, the findings have some implications for future study and practical improvement. First, the quadratic equation should be considered a standard nonlinear model to estimate hemodynamic changes in the DCCS tasks. Second, the Habit-DisHabit design DCCS could be widely used and further developed to identify the neural correlates of cognitive shifting better. Third, the finding that non-users and heavy users had different brain activation patterns implies that further studies should be conducted to examine the impact of pad use on executive function, and we should consider limiting and regulating children’s digital use in the early years. Recently, Eng et al. [17], Kerr-German and Buss [18], Li et al. [19], and the pioneer Moriguchi and his colleagues [20,21] have conducted fNIRS studies on executive function development in young children using traditional GLMs. Even though these studies have advanced our understanding of the neural correlates of executive function, reanalyzing their data using the quadratic modeling method (Equation (2)) will generate some unexpected results that could go deeper into the underlying neuropsychological mechanisms.
Author Contributions
Conceptualization, H.L. and D.W.; methodology, C.C., J.Y. and D.W.; formal analysis, J.Y. and H.L.; investigation, D.W., J.Y., J.L. and S.X.; resources, C.C. and S.X.; data curation, J.Y.; writing—original draft preparation, J.Y. and D.W.; writing—review and editing, H.L., D.W. and S.X.; visualization, J.Y.; supervision, H.L.; project administration, D.W.; funding acquisition, C.C. All authors have read and agreed to the published version of the manuscript.
Funding
This work was supported by the National Natural Science Foundation of China (61971289), Medical-Engineering Interdisciplinary Research Foundation of Shenzhen University, the Seed Funding Grant from the Education University of Hong Kong (RG38/2021-2022R), and the Shenzhen-Hong Kong Institute of Brain Science-Shenzhen Fundamental Research Institutions (No. 2023SHIBS0003). The Education University of Hong Kong funded the APC.
Institutional Review Board Statement
The study was conducted according to the guidelines of the Declaration of Helsinki and approved by the Ethics Committee of Shenzhen University (No. 2018005; 31 January 2018).
Informed Consent Statement
Informed consent was obtained from all of the participating parents involved in the study.
Data Availability Statement
All the data for this study will be made available upon request.
Acknowledgments
The authors are incredibly grateful to Wang Weili and Wang Xiuhong and all the teachers, parents, and children of Shenzhen No. 8 Kindergarten, China.
Conflicts of Interest
The authors declare no conflict of interest.
References
- Herold, F.; Behrendt, T.; Törpel, A.; Hamacher, D.; Müller, N.G.; Schega, L. Cortical hemodynamics as a function of handgrip strength and cognitive performance: A cross-sectional fNIRS study in younger adults. BMC Neurosci. 2021, 22, 1–16. [Google Scholar] [CrossRef]
- Hoshi, Y. Hemodynamic signals in fNIRS. Prog. Brain Res. 2016, 225, 153–179. [Google Scholar] [CrossRef]
- Scholkmann, F.; Kleiser, S.; Metz, A.J.; Zimmermann, R.; Pavia, J.M.; Wolf, U.; Wolf, M. A review on continuous wave functional near-infrared spectroscopy and imaging instrumentation and methodology. Neuroimage 2014, 85, 6–27. [Google Scholar] [CrossRef]
- Li, H.; Wu, D.; Yang, J.; Luo, J.; Xie, S.; Chang, C. Tablet Use Affects Preschoolers’ Executive Function: fNIRS Evidence from the Dimensional Change Card Sort Task. Brain Sci. 2021, 11, 567. [Google Scholar] [CrossRef]
- Li, H.; Wu, D.; Yang, J.; Xie, S.; Chang, C.; Luo, J. Bilinguals have more effective executive function: Evidence from an fNIRS study of the neural correlates of cognitive shifting. Int. J. Bilingualism. 2022, 27, 22–38. [Google Scholar] [CrossRef]
- Schroeter, M.L.; Bücheler, M.M.; Müller, K.; Uludağ, K.; Obrig, H.; Lohmann, G.; von Cramon, D.Y. Towards a standard analysis for functional near-infrared imaging. Neuro Image 2004, 21, 283–290. [Google Scholar] [CrossRef]
- Pouliot, P.; Tran TP, Y.; Birca, V.; Vannasing, P.; Tremblay, J.; Lassonde, M.; Nguyen, D.K. Hemodynamic changes during posterior epilepsies: An EEG-fNIRS study. Epilepsy Res. 2014, 108, 883–890. [Google Scholar] [CrossRef]
- Tak, S.; Ye, J.C. Statistical analysis of fNIRS data: A comprehensive review. Neuroimage 2014, 85, 72–91. [Google Scholar] [CrossRef]
- Bonomini, V.; Zucchelli, L.; Re, R.; Ieva, F.; Spinelli, L.; Contini, D.; Torricelli, A. Linear regression models and k-means clustering for statistical analysis of fNIRS data. Biomed. Opt. Express 2015, 6, 615–630. [Google Scholar] [CrossRef]
- Pinti, P.; Merla, A.; Aichelburg, C.; Lind, F.; Power, S.; Swingler, E.; Tachtsidis, I. A novel GLM-based method for the Automatic Identification of functional Events (AIDE) in fNIRS data recorded in naturalistic environments. Neuroimage 2017, 155, 291–304. [Google Scholar] [CrossRef]
- Von Lühmann, A.; Ortega-Martinez, A.; Boas, D.A.; Yücel, M.A. Using the general linear model to improve performance in fNIRS single-trial analysis and classification: A perspective. Front. Hum. Neurosci. 2020, 14, 30. [Google Scholar] [CrossRef]
- Moriguchi, Y.; Hiraki, K. Neural origin of cognitive shifting in young children. Proc. Natl. Acad. Sci. USA 2009, 106, 6017–6021. [Google Scholar] [CrossRef] [PubMed]
- Moriguchi, Y.; Lertladaluck, K. Bilingual effects on cognitive shifting and prefrontal activations in young children. Int. J. Biling. 2020, 24, 729–739. [Google Scholar] [CrossRef]
- Xie, S.; Wu, D.; Yang, J.; Luo, J.; Chang, C.; Li, H. An fNIRS examination of executive function in bilingual young children. Int. J. Biling. 2020, 25, 516–530. [Google Scholar] [CrossRef]
- Li, H.; Wu, D.; Yang, J.; Xie, S.; Luo, J.; Chang, C. A Functional Near-Infrared Spectroscopy Examination of the Neural Correlates of Cognitive Shifting in Dimensional Change Card Sort Task. Front. Hum. Neurosci. 2021, 14, 561223. [Google Scholar] [CrossRef] [PubMed]
- Purves, D.; Cabeza, R.; Huettel, S.A.; LaBar, K.S.; Platt, M.L.; Woldorff, M.G. Principles of Cognitive Neuroscience; Oxford University Press: New York, NY, USA, 2018. [Google Scholar]
- Eng, C.M.; Pocsai, M.; Fulton, V.E.; Moron, S.P.; Thiessen, E.D.; Fisher, A.V. Longitudinal investigation of executive function development employing task-based, teacher reports, and fNIRS multimethodology in 4- to 5-year-old children. Dev. Sci. 2022, 25, e13328. [Google Scholar] [CrossRef]
- Kerr-German, A.N.; Buss, A.T. Exploring the neural basis of selective and flexible dimensional attention: An fNIRS study. J. Cogn. Dev. 2020, 21, 313–325. [Google Scholar] [CrossRef] [PubMed]
- Li, Y.; Grabell, A.S.; Wakschlag, L.S.; Huppert, T.J.; Perlman, S.B. The neural substrates of cognitive flexibility are related to individual differences in preschool irritability: A fNIRS investigation. Dev. Cogn. Neurosci. 2017, 25, 138–144. [Google Scholar] [CrossRef] [PubMed]
- Moriguchi, Y.; Sakata, C. Development of cognitive shifting from others’ behavior in young children: A near-infrared spectroscopy study. Dev. Neuropsychol. 2020, 45, 39–47. [Google Scholar] [CrossRef] [PubMed]
- Moriguchi, Y. Relationship between cool and hot executive function in young children: A near-infrared spectroscopy study. Dev. Sci. 2022, 25, e13165. [Google Scholar] [CrossRef] [PubMed]
Disclaimer/Publisher’s Note: The statements, opinions and data contained in all publications are solely those of the individual author(s) and contributor(s) and not of MDPI and/or the editor(s). MDPI and/or the editor(s) disclaim responsibility for any injury to people or property resulting from any ideas, methods, instructions or products referred to in the content. |
© 2023 by the authors. Licensee MDPI, Basel, Switzerland. This article is an open access article distributed under the terms and conditions of the Creative Commons Attribution (CC BY) license (https://creativecommons.org/licenses/by/4.0/).