
Expression and Change of miRs 145, 221 and 222 in Hypertensive Subjects Treated with Enalapril, Losartan or Olmesartan

 ,
,  ,
,  ,
,  ,
, 

Abstract
:1. Introduction
2. Materials and Methods
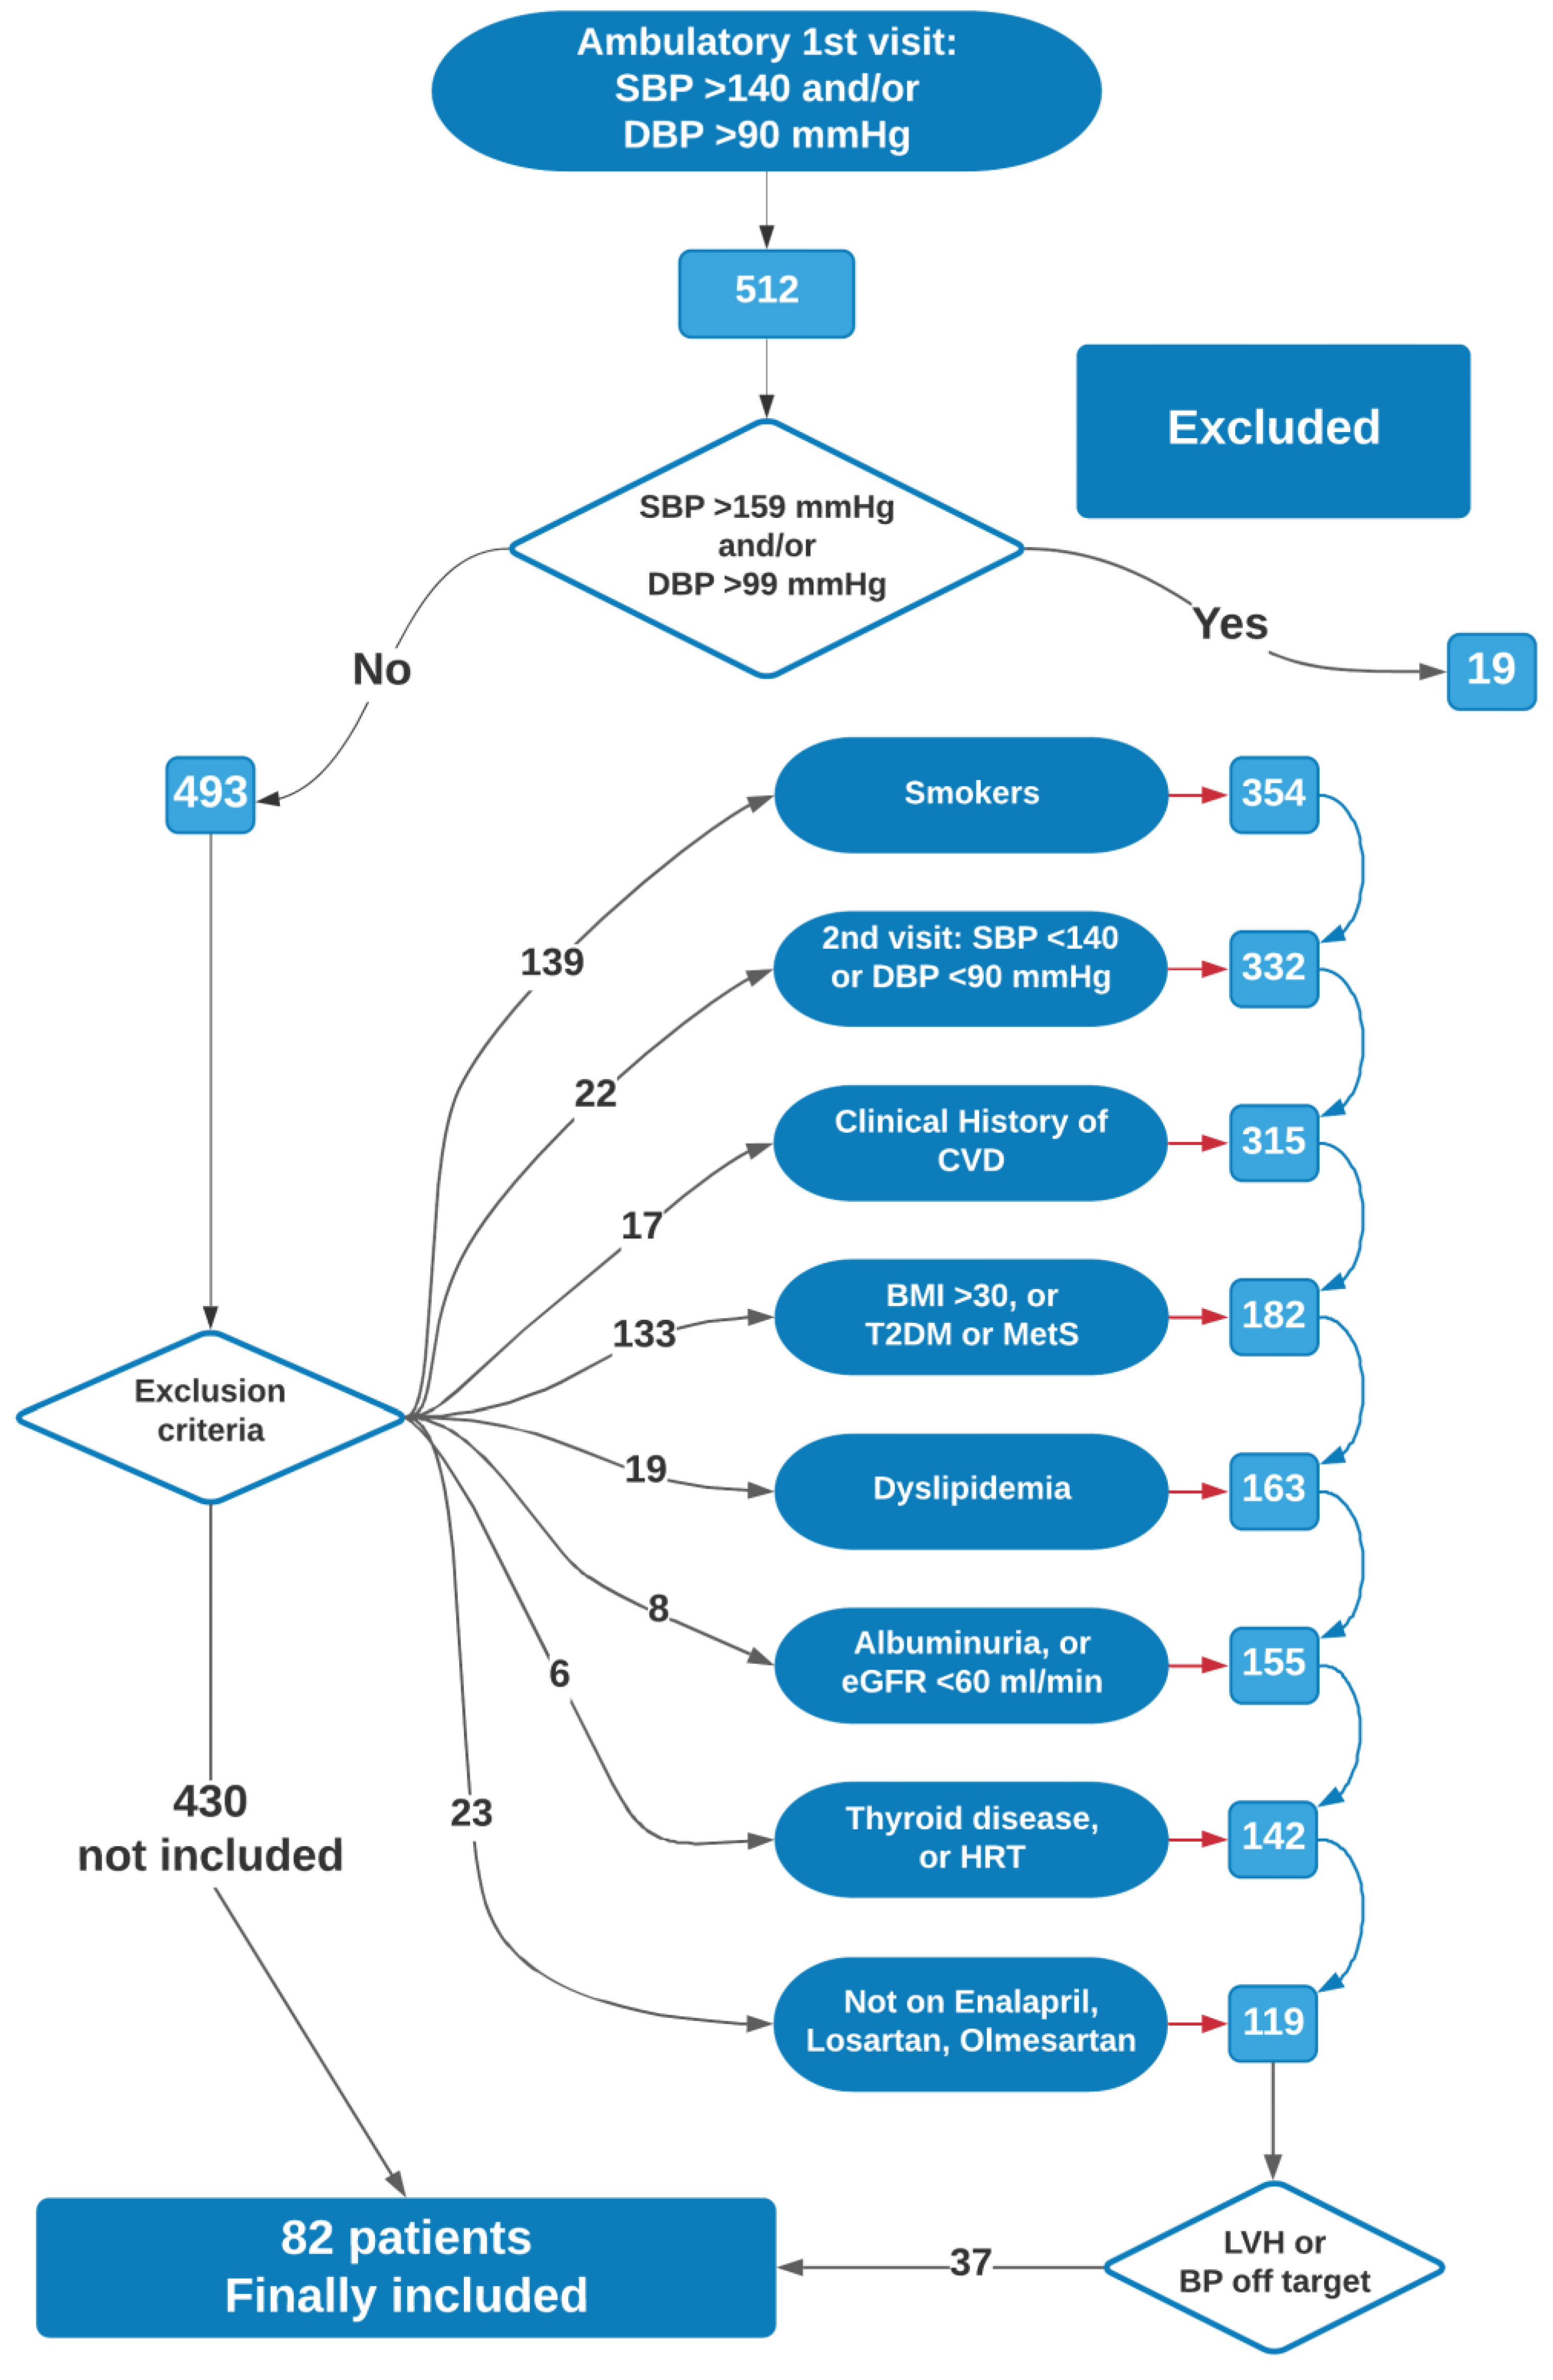
2.1. Subjects
2.2. Measurement of cIMT, Arterial Stiffness and LV Parameters
2.3. CD14+ Cell Identification and Separation, miR Expression
2.4. Ethics Statement
2.5. Statistical Methods
3. Results
4. Discussion
5. Conclusions
Author Contributions
Funding
Institutional Review Board Statement
Informed Consent Statement
Data Availability Statement
Acknowledgments
Conflicts of Interest
Abbreviations
| Aix | augmentation index |
| AS | arterial stiffening |
| ATR1 | angiotensinII-type1 receptor |
| ARB | angiotensinII-type1 receptor blocker |
| BMI | body mass index |
| BNP | B-type natriuretic peptide |
| BSA | body surface area |
| c-IMT | carotid intima media thickness |
| CPCs | circulating progenitor cells |
| CRP | C-reactive protein |
| CV | cardiovascular |
| CVD | cardiovascular disease |
| CVE | cardiovascular events |
| DBP | diastolic blood pressure |
| ECs | endothelial cells |
| EF | ejection fraction |
| ESR | erythrocyte sedimentation rate |
| HDL | high-density lipoprotein |
| HF | heart failure |
| HR | heart rate |
| HRT | hormone-based therapy |
| IQR | interquartile range |
| KW | Kruskal-Wallis |
| LDL-C | low-density-lipoprotein-cholesterol |
| LVH | left ventricular hypertrophy |
| LVMI | left ventricular mass index |
| MWW | Mann-Whitney/Wilcoxon test |
| Mirs | microRNAs |
| ncRNA | non-coding RNA |
| PWV | pulse-wave velocity |
| ROS | reactive oxygen species |
| SBP | systolic blood pressure |
| TC | Total cholesterol |
| US | ultra-sonography |
| VSMCs | vascular smooth cells |
References
- Birney, E.; Stamatoyannopoulos, J.A.; Dutta, A.; Guigo, R.; Gingeras, T.R.; Margulies, E.H.; Weng, Z.; Snyder, M.; Dermitzakis, E.T.; Thurman, R.E.; et al. Identification and analysis of functional elements in 1% of the human genome by the ENCODE pilot project. Nature 2007, 447, 799–816. [Google Scholar] [CrossRef] [PubMed] [Green Version]
- Esteller, M. Non-coding RNAs in human disease. Nat. Rev. Genet. 2011, 12, 861–874. [Google Scholar] [CrossRef] [PubMed]
- Sayed, D.; Abdellatif, M. MicroRNAs in development and disease. Physiol. Rev. 2011, 91, 827–887. [Google Scholar] [CrossRef] [PubMed]
- Fernandez-Hernando, C.; Ramirez, C.M.; Goedeke, L.; Suarez, Y. MicroRNAs in metabolic disease. Arter. Thromb. Vasc. Biol. 2013, 33, 178–185. [Google Scholar] [CrossRef] [Green Version]
- Campo, S.; Allegra, A.; D’Ascola, A.; Alonci, A.; Scuruchi, M.; Russo, S.; Avenoso, A.; Gerace, D.; Campo, G.M.; Musolino, C. MiRNome expression is deregulated in the peripheral lymphoid compartment of multiple myeloma. Br. J. Haematol. 2014, 165, 801–813. [Google Scholar] [CrossRef]
- Quiat, D.; Olson, E.N. MicroRNAs in cardiovascular disease: From pathogenesis to prevention and treatment. J. Clin. Investig. 2013, 123, 11–18. [Google Scholar] [CrossRef] [Green Version]
- Minami, Y.; Satoh, M.; Maesawa, C.; Takahashi, Y.; Tabuchi, T.; Itoh, T.; Nakamura, M. Effect of atorvastatin on microRNA 221/222 expression in endothelial progenitor cells obtained from patients with coronary artery disease. Eur. J. Clin. Investig. 2009, 39, 359–367. [Google Scholar] [CrossRef]
- Mandraffino, G.; Imbalzano, E.; Sardo, M.A.; D’Ascola, A.; Mamone, F.; Lo Gullo, A.; Alibrandi, A.; Loddo, S.; Mormina, E.; David, A.; et al. Circulating progenitor cells in hypertensive patients with different degrees of cardiovascular involvement. J. Hum. Hypertens 2014, 28, 543–550. [Google Scholar] [CrossRef]
- Mandraffino, G.; Aragona, C.O.; Cairo, V.; Scuruchi, M.; Lo Gullo, A.; D’Ascola, A.; Alibrandi, A.; Loddo, S.; Quartuccio, S.; Morace, C.; et al. Circulating progenitor cells in hypertensive subjects: Effectiveness of a treatment with olmesartan in improving cell number and miR profile in addition to expected pharmacological effects. PLoS ONE 2017, 12, e0173030. [Google Scholar] [CrossRef]
- Jayaseelan, V.P.; Arumugam, P. Exosomal microRNAs as a promising theragnostic tool for essential hypertension. Hypertens Res. 2020, 43, 74–75. [Google Scholar] [CrossRef]
- Tan, P.P.S.; Hall, D.; Chilian, W.M.; Chia, Y.C.; Mohd Zain, S.; Lim, H.M.; Kumar, D.N.; Ching, S.M.; Low, T.Y.; Md Noh, M.F.; et al. Exosomal microRNAs in the development of essential hypertension and its potential as biomarkers. Am. J. Physiol. Heart Circ. Physiol. 2021, 320, H1486–H1497. [Google Scholar] [CrossRef]
- D’Onofrio, N.; Sardu, C.; Paolisso, P.; Minicucci, F.; Gragnano, F.; Ferraraccio, F.; Panarese, I.; Scisciola, L.; Mauro, C.; Rizzo, M.R.; et al. MicroRNA-33 and SIRT1 influence the coronary thrombus burden in hyperglycemic STEMI patients. J. Cell Physiol. 2020, 235, 1438–1452. [Google Scholar] [CrossRef]
- Sardu, C.; Modugno, P.; Castellano, G.; Scisciola, L.; Barbieri, M.; Petrella, L.; Fanelli, M.; Macchia, G.; Caradonna, E.; Massetti, M.; et al. Atherosclerotic Plaque Fissuration and Clinical Outcomes in Pre-Diabetics vs. Normoglycemics Patients Affected by Asymptomatic Significant Carotid Artery Stenosis at 2 Years of Follow-Up: Role of microRNAs Modulation: The ATIMIR Study. Biomedicines 2021, 9, 401. [Google Scholar] [CrossRef]
- Poliseno, L.; Tuccoli, A.; Mariani, L.; Evangelista, M.; Citti, L.; Woods, K.; Mercatanti, A.; Hammond, S.; Rainaldi, G. MicroRNAs modulate the angiogenic properties of HUVECs. Blood 2006, 108, 3068–3071. [Google Scholar] [CrossRef]
- Davis, B.N.; Hilyard, A.C.; Nguyen, P.H.; Lagna, G.; Hata, A. Induction of microRNA-221 by platelet-derived growth factor signaling is critical for modulation of vascular smooth muscle phenotype. J. Biol. Chem. 2009, 284, 3728–3738. [Google Scholar] [CrossRef] [Green Version]
- Kuehbacher, A.; Urbich, C.; Dimmeler, S. Targeting microRNA expression to regulate angiogenesis. Trends Pharmacol. Sci. 2008, 29, 12–15. [Google Scholar] [CrossRef]
- Song, Z.; Li, G. Role of specific microRNAs in regulation of vascular smooth muscle cell differentiation and the response to injury. J. Cardiovasc. Transl. Res. 2010, 3, 246–250. [Google Scholar] [CrossRef] [Green Version]
- Rippe, C.; Blimline, M.; Magerko, K.A.; Lawson, B.R.; LaRocca, T.J.; Donato, A.J.; Seals, D.R. MicroRNA changes in human arterial endothelial cells with senescence: Relation to apoptosis, eNOS and inflammation. Exp. Gerontol. 2012, 47, 45–51. [Google Scholar] [CrossRef] [Green Version]
- Santhekadur, P.K.; Das, S.K.; Gredler, R.; Chen, D.; Srivastava, J.; Robertson, C.; Baldwin, A.S., Jr.; Fisher, P.B.; Sarkar, D. Multifunction protein staphylococcal nuclease domain containing 1 (SND1) promotes tumor angiogenesis in human hepatocellular carcinoma through novel pathway that involves nuclear factor kappaB and miR-221. J. Biol. Chem. 2012, 287, 13952–13958. [Google Scholar] [CrossRef] [Green Version]
- Zhu, N.; Zhang, D.; Chen, S.; Liu, X.; Lin, L.; Huang, X.; Guo, Z.; Liu, J.; Wang, Y.; Yuan, W.; et al. Endothelial enriched microRNAs regulate angiotensin II-induced endothelial inflammation and migration. Atherosclerosis 2011, 215, 286–293. [Google Scholar] [CrossRef]
- Ogawa, T.; Enomoto, M.; Fujii, H.; Sekiya, Y.; Yoshizato, K.; Ikeda, K.; Kawada, N. MicroRNA-221/222 upregulation indicates the activation of stellate cells and the progression of liver fibrosis. Gut 2012, 61, 1600–1609. [Google Scholar] [CrossRef] [PubMed]
- Mackenzie, N.C.; Staines, K.A.; Zhu, D.; Genever, P.; Macrae, V.E. miRNA-221 and miRNA-222 synergistically function to promote vascular calcification. Cell Biochem. Funct. 2014, 32, 209–216. [Google Scholar] [CrossRef] [PubMed]
- Wang, C.; Wang, S.; Zhao, P.; Wang, X.; Wang, J.; Wang, Y.; Song, L.; Zou, Y.; Hui, R. MiR-221 promotes cardiac hypertrophy in vitro through the modulation of p27 expression. J. Cell Biochem. 2012, 113, 2040–2046. [Google Scholar] [CrossRef] [PubMed]
- Jin, W.; Reddy, M.A.; Chen, Z.; Putta, S.; Lanting, L.; Kato, M.; Park, J.T.; Chandra, M.; Wang, C.; Tangirala, R.K.; et al. Small RNA sequencing reveals microRNAs that modulate angiotensin II effects in vascular smooth muscle cells. J. Biol. Chem. 2012, 287, 15672–15683. [Google Scholar] [CrossRef] [Green Version]
- Li, Y.; Song, Y.H.; Li, F.; Yang, T.; Lu, Y.W.; Geng, Y.J. MicroRNA-221 regulates high glucose-induced endothelial dysfunction. Biochem. Biophys. Res. Commun. 2009, 381, 81–83. [Google Scholar] [CrossRef] [Green Version]
- Cordes, K.R.; Sheehy, N.T.; White, M.P.; Berry, E.C.; Morton, S.U.; Muth, A.N.; Lee, T.H.; Miano, J.M.; Ivey, K.N.; Srivastava, D. miR-145 and miR-143 regulate smooth muscle cell fate and plasticity. Nature 2009, 460, 705–710. [Google Scholar] [CrossRef] [Green Version]
- Elia, L.; Quintavalle, M.; Zhang, J.; Contu, R.; Cossu, L.; Latronico, M.V.; Peterson, K.L.; Indolfi, C.; Catalucci, D.; Chen, J.; et al. The knockout of miR-143 and -145 alters smooth muscle cell maintenance and vascular homeostasis in mice: Correlates with human disease. Cell Death Differ. 2009, 16, 1590–1598. [Google Scholar] [CrossRef]
- Turczynska, K.M.; Sadegh, M.K.; Hellstrand, P.; Sward, K.; Albinsson, S. MicroRNAs are essential for stretch-induced vascular smooth muscle contractile differentiation via microRNA (miR)-145-dependent expression of L-type calcium channels. J. Biol. Chem. 2012, 287, 19199–19206. [Google Scholar] [CrossRef] [Green Version]
- Yamaguchi, S.; Yamahara, K.; Homma, K.; Suzuki, S.; Fujii, S.; Morizane, R.; Monkawa, T.; Matsuzaki, Y.; Kangawa, K.; Itoh, H. The role of microRNA-145 in human embryonic stem cell differentiation into vascular cells. Atherosclerosis 2011, 219, 468–474. [Google Scholar] [CrossRef]
- Quintavalle, M.; Elia, L.; Condorelli, G.; Courtneidge, S.A. MicroRNA control of podosome formation in vascular smooth muscle cells in vivo and in vitro. J. Cell Biol. 2010, 189, 13–22. [Google Scholar] [CrossRef] [Green Version]
- Climent, M.; Quintavalle, M.; Miragoli, M.; Chen, J.; Condorelli, G.; Elia, L. TGFbeta Triggers miR-143/145 Transfer From Smooth Muscle Cells to Endothelial Cells, Thereby Modulating Vessel Stabilization. Circ. Res. 2015, 116, 1753–1764. [Google Scholar] [CrossRef] [Green Version]
- Zhang, C. MicroRNA-145 in vascular smooth muscle cell biology: A new therapeutic target for vascular disease. Cell Cycle 2009, 8, 3469–3473. [Google Scholar] [CrossRef] [Green Version]
- Lang, R.M.; Bierig, M.; Devereux, R.B.; Flachskampf, F.A.; Foster, E.; Pellikka, P.A.; Picard, M.H.; Roman, M.J.; Seward, J.; Shanewise, J.S.; et al. Recommendations for chamber quantification: A report from the American Society of Echocardiography’s Guidelines and Standards Committee and the Chamber Quantification Writing Group, developed in conjunction with the European Association of Echocardiography, a branch of the European Society of Cardiology. J. Am. Soc. Echocardiogr. 2005, 18, 1440–1463. [Google Scholar] [CrossRef]
- Sardo, M.A.; Mandraffino, G.; Riggio, S.; D’Ascola, A.; Alibrandi, A.; Saitta, C.; Imbalzano, E.; Castaldo, M.; Cinquegrani, M.; Saitta, A. Effects of the angiotensin II receptor blocker losartan on the monocyte expression of biglycan in hypertensive patients. Clin. Exp. Pharmacol. Physiol. 2010, 37, 933–938. [Google Scholar] [CrossRef]
- Hodgson, T.A.; Cai, L. Medical care expenditures for hypertension, its complications, and its comorbidities. Med. Care 2001, 39, 599–615. [Google Scholar] [CrossRef]
- Rizzoni, D.; Agabiti-Rosei, E. Structural abnormalities of small resistance arteries in essential hypertension. Intern. Emerg. Med. 2012, 7, 205–212. [Google Scholar] [CrossRef]
- Bali, A.; Jaggi, A.S. Angiotensin II-triggered kinase signaling cascade in the central nervous system. Rev. Neurosci. 2016, 27, 301–315. [Google Scholar] [CrossRef]
- Xing, H.J.; Li, Y.J.; Ma, Q.M.; Wang, A.M.; Wang, J.L.; Sun, M.; Jian, Q.; Hu, J.H.; Li, D.; Wang, L. Identification of microRNAs present in congenital heart disease associated copy number variants. Eur. Rev. Med. Pharmacol. Sci. 2013, 17, 2114–2120. [Google Scholar]
- Alexy, T.; James, A.M.; Searles, C.D. Shear sensitive microRNAs and atherosclerosis. Biorheology 2014, 51, 147–158. [Google Scholar] [CrossRef]
- Zimmerman, M.C.; Lazartigues, E.; Lang, J.A.; Sinnayah, P.; Ahmad, I.M.; Spitz, D.R.; Davisson, R.L. Superoxide mediates the actions of angiotensin II in the central nervous system. Circ. Res. 2002, 91, 1038–1045. [Google Scholar] [CrossRef]
- Messerli, F.H.; Bangalore, S. Angiotensin Receptor Blockers Reduce Cardiovascular Events, Including the Risk of Myocardial Infarction. Circulation 2017, 135, 2085–2087. [Google Scholar] [CrossRef] [PubMed]
- Chistiakov, D.A.; Sobenin, I.A.; Orekhov, A.N.; Bobryshev, Y.V. Human miR-221/222 in Physiological and Atherosclerotic Vascular Remodeling. Biomed. Res. Int. 2015, 2015, 354517. [Google Scholar] [CrossRef] [PubMed]
- Suarez, Y.; Fernandez-Hernando, C.; Pober, J.S.; Sessa, W.C. Dicer dependent microRNAs regulate gene expression and functions in human endothelial cells. Circ. Res. 2007, 100, 1164–1173. [Google Scholar] [CrossRef] [PubMed] [Green Version]
- Alexandru, N.; Constantin, A.; Nemecz, M.; Comarita, I.K.; Vilcu, A.; Procopciuc, A.; Tanko, G.; Georgescu, A. Hypertension Associated with Hyperlipidemia Induced Different MicroRNA Expression Profiles in Plasma, Platelets, and Platelet-Derived Microvesicles; Effects of Endothelial Progenitor Cell Therapy. Front. Med. 2019, 6, 280. [Google Scholar] [CrossRef] [Green Version]
- Li, S.; Zhu, J.; Zhang, W.; Chen, Y.; Zhang, K.; Popescu, L.M.; Ma, X.; Lau, W.B.; Rong, R.; Yu, X.; et al. Signature microRNA expression profile of essential hypertension and its novel link to human cytomegalovirus infection. Circulation 2011, 124, 175–184. [Google Scholar] [CrossRef] [Green Version]
- Liu, X.; Cheng, Y.; Yang, J.; Xu, L.; Zhang, C. Cell-specific effects of miR-221/222 in vessels: Molecular mechanism and therapeutic application. J. Mol. Cell Cardiol. 2012, 52, 245–255. [Google Scholar] [CrossRef] [Green Version]
- Vacante, F.; Denby, L.; Sluimer, J.C.; Baker, A.H. The function of miR-143, miR-145 and the MiR-143 host gene in cardiovascular development and disease. Vascul. Pharmacol. 2019, 112, 24–30. [Google Scholar] [CrossRef]
- Cheng, Y.; Liu, X.; Yang, J.; Lin, Y.; Xu, D.-Z.; Lu, Q.; Deitch, E.A.; Huo, Y.; Delphin, E.S.; Zhang, C. MicroRNA-145, a novel smooth muscle cell phenotypic marker and modulator, controls vascular neointimal lesion formation. Circ. Res. 2009, 105, 158–166. [Google Scholar] [CrossRef]
- Han, Z.; Hu, H.; Yin, M.; Li, X.; Li, J.; Liu, L.; Liu, B. miR-145 is critical for modulation of vascular smooth muscle cell proliferation in human carotid artery stenosis. J. Biol. Regul. Homeost. Agents 2018, 32, 506–516. [Google Scholar]
- Wu, S.; Sun, H.; Sun, B. MicroRNA-145 is involved in endothelial cell dysfunction and acts as a promising biomarker of acute coronary syndrome. Eur. J. Med. Res. 2020, 25, 2. [Google Scholar] [CrossRef] [Green Version]
- Churov, A.; Summerhill, V.; Grechko, A.; Orekhova, V.; Orekhov, A. MicroRNAs as Potential Biomarkers in Atherosclerosis. Int. J. Mol. Sci. 2019, 20, 5547. [Google Scholar] [CrossRef] [Green Version]


| Controls | Hypertensives (T0) | MW | |
|---|---|---|---|
| Number | 49 | 82 | |
| Gender (m/f) | 28/21 | 47/35 | |
| Median (IQR) | p | ||
| Age (years) | 40 (13) | 38 (31) | 0.330 |
| BMI (kg/m2) | 24.7 (5.2) | 25 (2.2) | 0.424 |
| SBP (mmHg) | 120 (20) | 155 (10) | <0.001 |
| DBP (mmHg) | 70 (10) | 80 (10) | <0.001 |
| TC (mg/dL) | 178 (33) | 175 (40) | 0.892 |
| HDL-C (mg/dL) | 49 (11) | 47 (6) | 0.005 |
| TG (mg/dL) | 109 (22) | 120 (31) | 0.008 |
| LDL-C (mg/dL) | 107.2 (35.6) | 104.6 (32.8) | 0.643 |
| Glucose (mg/dL) | 88 (11) | 88 (10.5) | 0.802 |
| HsCRP (mg/dL) | 0.46 (0.29) | 0.8 (0.15) | <0.001 |
| Fibrinogen (mg/dL) | 254.8 (84) | 311 (55) | <0.001 |
| AIx (%) | −3.9 (3.5) | 13.3 (9.2) | <0.001 |
| PWV (m/s) | 4.9 (0.75) | 8.12 (2.5) | <0.001 |
| cIMT (mm) | 0.77 (0.3) | 0.91 (0.23) | <0.001 |
| LVMi | 71 (17.9) | 74 (19) | 0.358 |
| miR-221 (n-fold) | 0.97 (0.17) | 1.9 (0.45) | <0.001 |
| miR-222 (n-fold) | 0.93 (0.13) | 1.89 (0.27) | <0.001 |
| miR-145 (n-fold) | 1.04 (0.32) | 0.61 (0.17) | <0.001 |
| Hypertensives (T0) | Hypertensives (T1) | Delta% | MWW T1 vs. T0 | Controls | MWW T1 vs. C | |
|---|---|---|---|---|---|---|
| Number | 82 | 49 | ||||
| Gender (m/f) | 47/35 | 28/21 | ||||
| Median (IQR) | p | p | ||||
| BMI (kg/m2) | 25 (2.2) | 24.17 (1.19) | −3.23 | <0.001 | 24.7 (5.2) | 0.573 |
| SBP (mmHg) | 155 (10) | 125 (10) | −18.5 | <0.001 | 120 (20) | 0.001 |
| DBP (mmHg) | 80 (10) | 70 (10) | −18.0 | <0.001 | 70 (10) | 0.314 |
| TC (mg/dL) | 175 (40) | 170 (35) | −2.43 | <0.001 | 178 (33) | 0.310 |
| HDL-C (mg/dL) | 47 (6) | 49 (4) | 3.0 | <0.001 | 49 (11) | 0.132 |
| TG (mg/dL) | 120 (31) | 120 (20) | −1.73 | 0.367 | 109 (22) | 0.001 |
| LDL-C (mg/dL) | 104.6 (32.8) | 99.5 (31.6) | −5.42 | <0.001 | 107.2 (35.6) | 0.200 |
| Glucose (mg/dL) | 88 (11) | 87.5 (10) | −2.15 | <0.001 | 88 (10.5) | 0.196 |
| HsCRP (mg/dL) | 0.8 (0.15) | 0.65 (0.19) | −17.5 | <0.001 | 0.46 (0.29) | <0.001 |
| Fibrinogen (mg/dL) | 311 (55) | 276 (63) | −11 | <0.001 | 254.8 (84) | 0.369 |
| AIx (%) | 13.3 (9.2) | 6.8 (6.4) | −49.1 | <0.001 | −3.9 (3.5) | <0.001 |
| PWV (m/s) | 8.12 (2.5) | 5.46 (2.1) | −32.2 | <0.001 | 4.9 (0.75) | 0.283 |
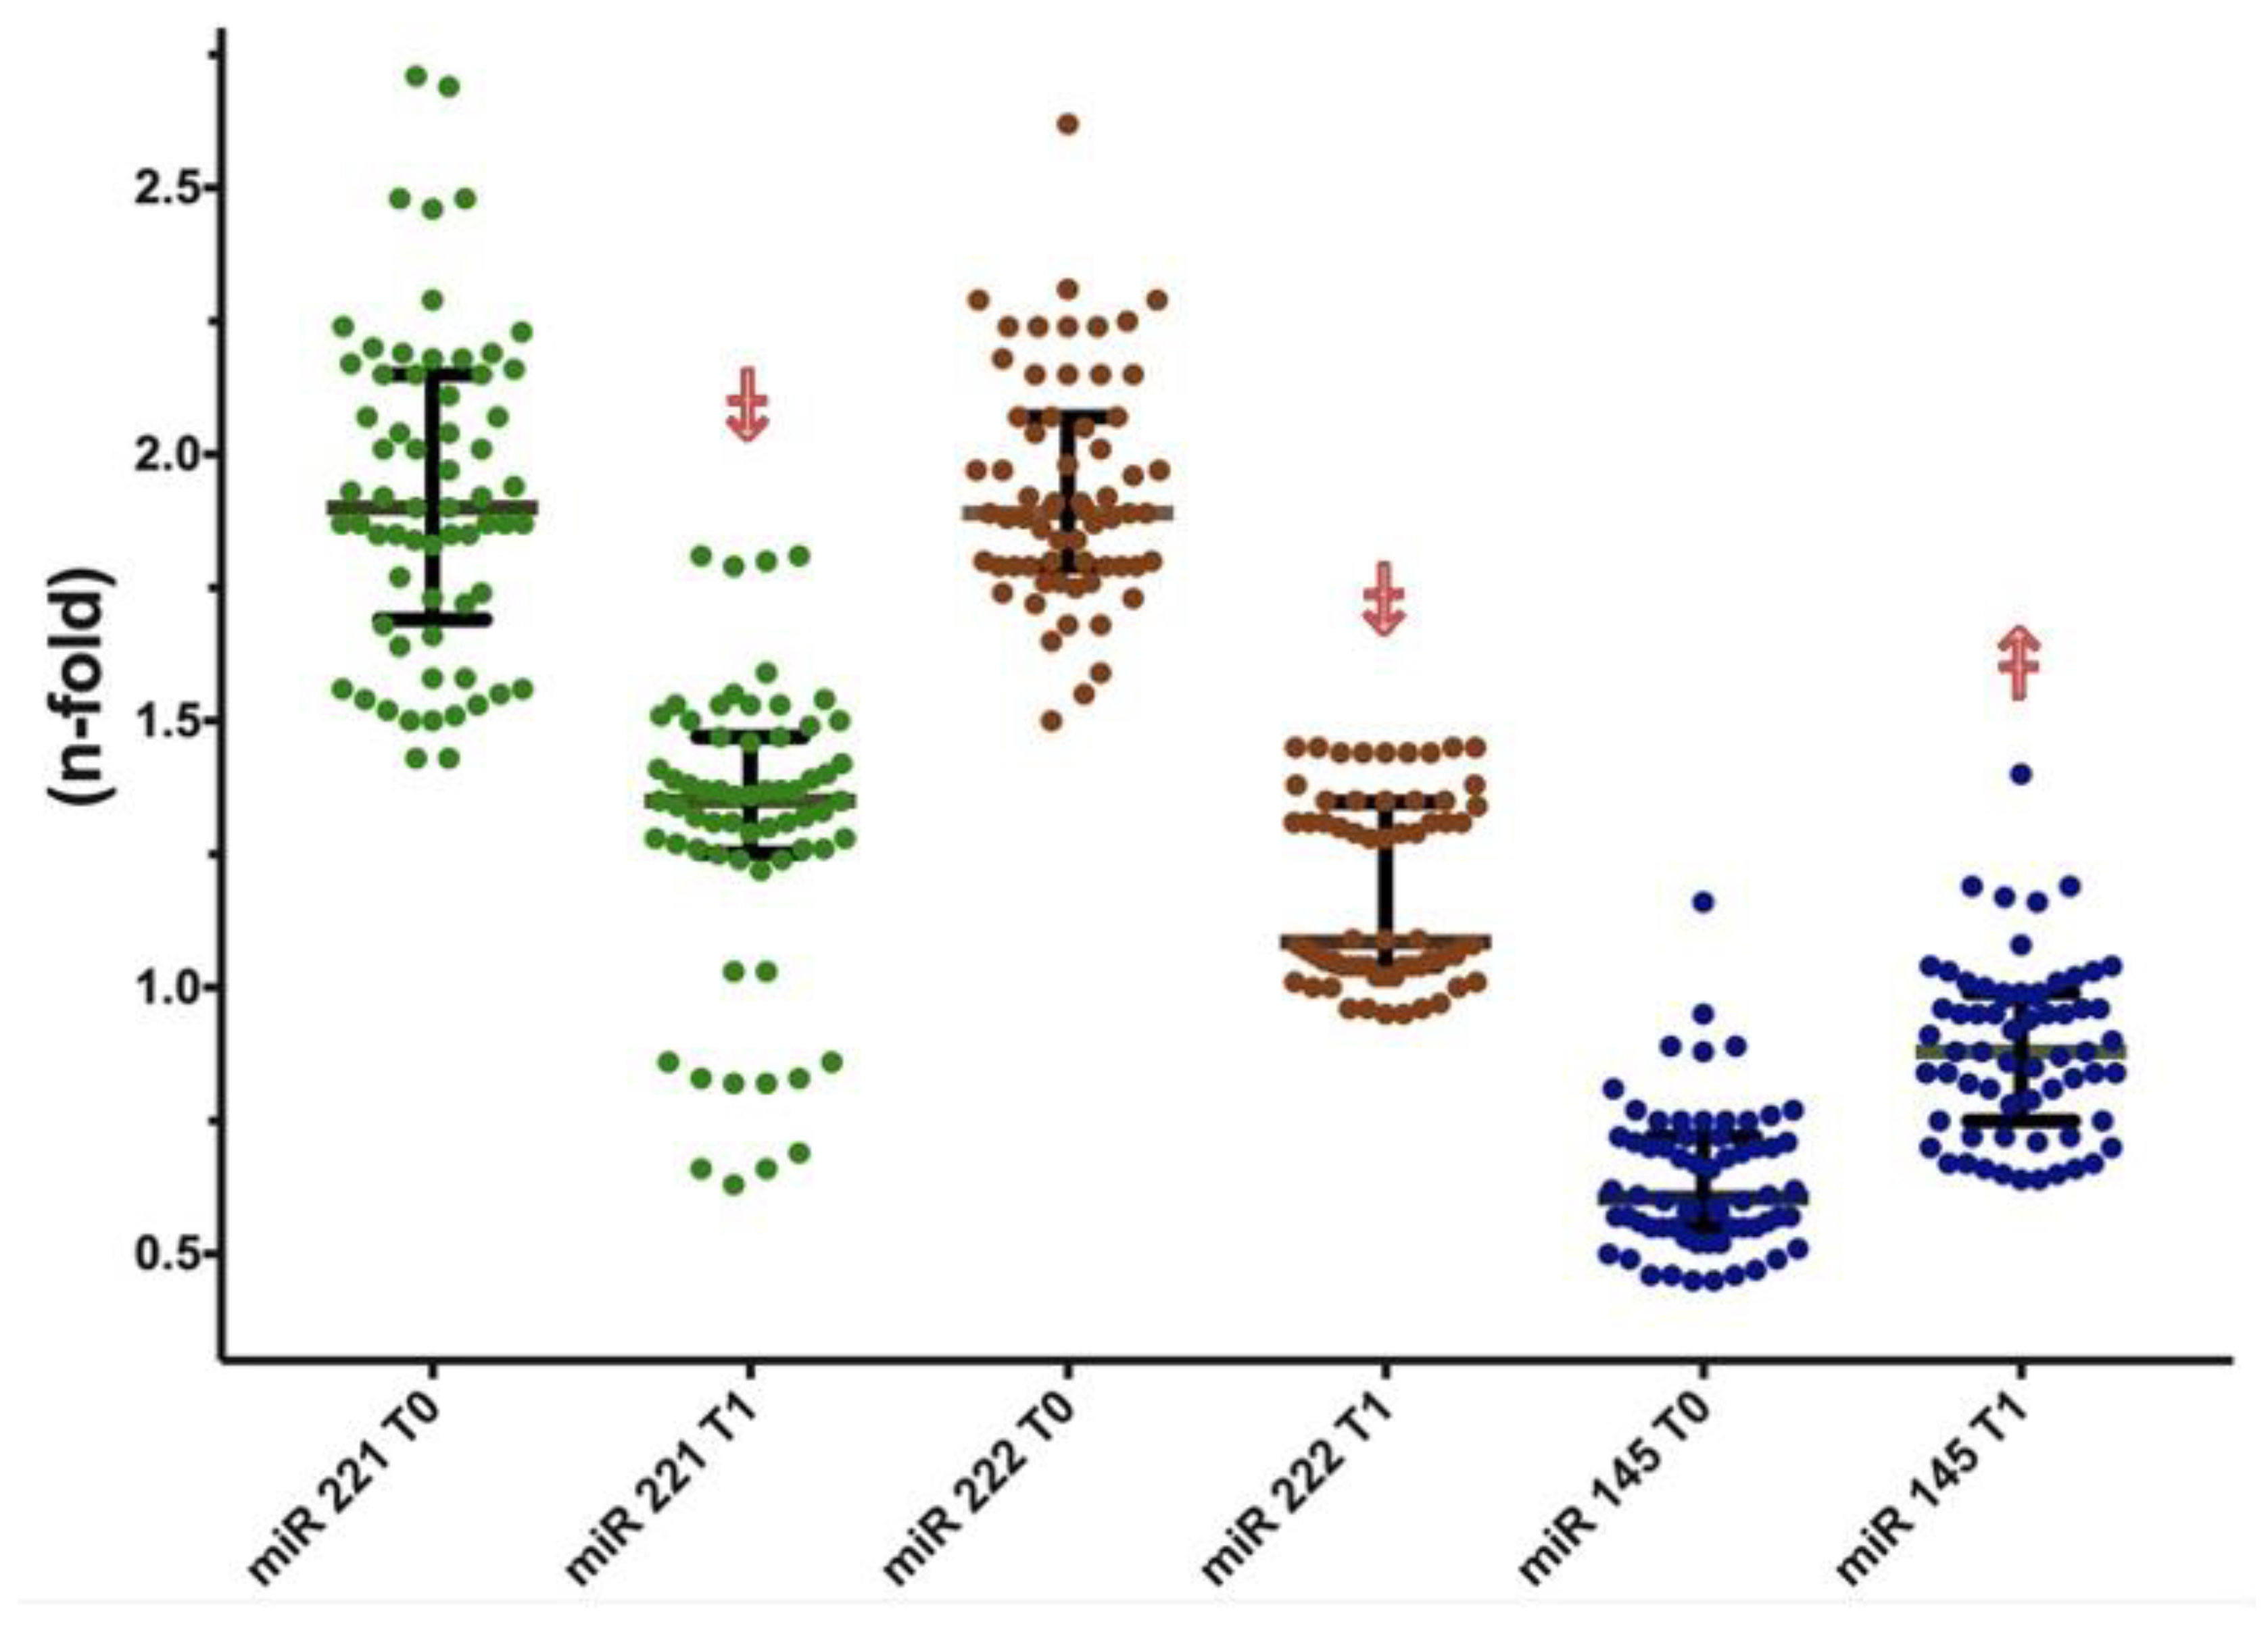
| miR-221 (n-fold) | 1.9 (0.45) | 1.38 (0.23) | −28.4 | <0.001 | 0.97 (0.17) | <0.001 |
| miR-222 (n-fold) | 1.89 (0.27) | 1.20 (0.25) | −36.0 | <0.001 | 0.93 (0.13) | <0.001 |
| miR-145 (n-fold) | 0.61 (0.17) | 0.89 (0.22) | 41.7 | <0.001 | 1.04 (0.32) | <0.001 |
| Enalapril (T0) | Enalapril (T1) | Δ% p (MWW) | Losartan (T0) | Losartan (T1) | Δ% p (MWW) | Olmesartan (T0) | Olmesartan (T1) | Δ% p (MWW) | KW * | |
|---|---|---|---|---|---|---|---|---|---|---|
| Number | 27 | 29 | 26 | |||||||
| Gender (m/f) | 20/7 | 21/8 | 20/6 | |||||||
| BMI (kg/m2) | 24.4 (1.2) | 24 (2) | −3.11 p < 0.001 | 25 (6) | 25 (4) | −2.83 p = 0.001 | 25.3 (3.4) | 25 (2.27) | −3.78 p < 0.001 | p = 0.740 |
| SBP (mmHg) | 155 (10) | 120 (10) | −18.9 p < 0.001 | 160 (15) | 130 (18) | −17.2 p < 0.001 | 150 (11) | 120 (5) | −19.3 p < 0.001 | p = 0.089 |
| DBP (mmHg) | 80 (5) | 70 (0) | −16.3 p < 0.001 | 85 (10) | 70 (10) | −14.3 p < 0.001 | 80 (10) | 60 (10) | −24 p < 0.001 | p < 0.001 |
| TC (mg/dL) | 169 (22) | 170 (30) | −2.36 p = 0.007 | 180 (40) | 180 (35) | −2.63 p < 0.001 | 165 (44) | 160 (33) | −2.3 p = 0.01 | p = 0.974 |
| HDL-C (mg/dL) | 46 (6) | 48 (4) | 3.9 p < 0.001 | 45 (9) | 47 (5) | 2.14 p = 0.009 | 48 (2) | 49 (1) | 3.32 p = 0.02 | p = 0.316 |
| TG (mg/dL) | 120 (31) | 120 (19) | 4.1 p = 0.273 | 120 (18) | 113 (10) | 0.51 p = 0.927 | 120 (37) | 120 (29) | 0.66 p = 0.821 | p = 0.352 |
| LDL-C (mg/dL) | 101 (29.4) | 93 (33.8) | −6.6 p < 0.001 | 113 (40.3) | 108 (32) | −4.7 p < 0.001 | 93.1(41.3) | 84 (31.5) | −4.9 p = 0.007 | p = 0.542 |
| Glucose (mg/dL) | 85 (11) | 90 (10) | 0.31 p = 0.876 | 86 (12) | 80 (10) | −3.6 p = 0.002 | 89 (11) | 88 (10) | −3.1 p = 0.008 | p = 0.008 |
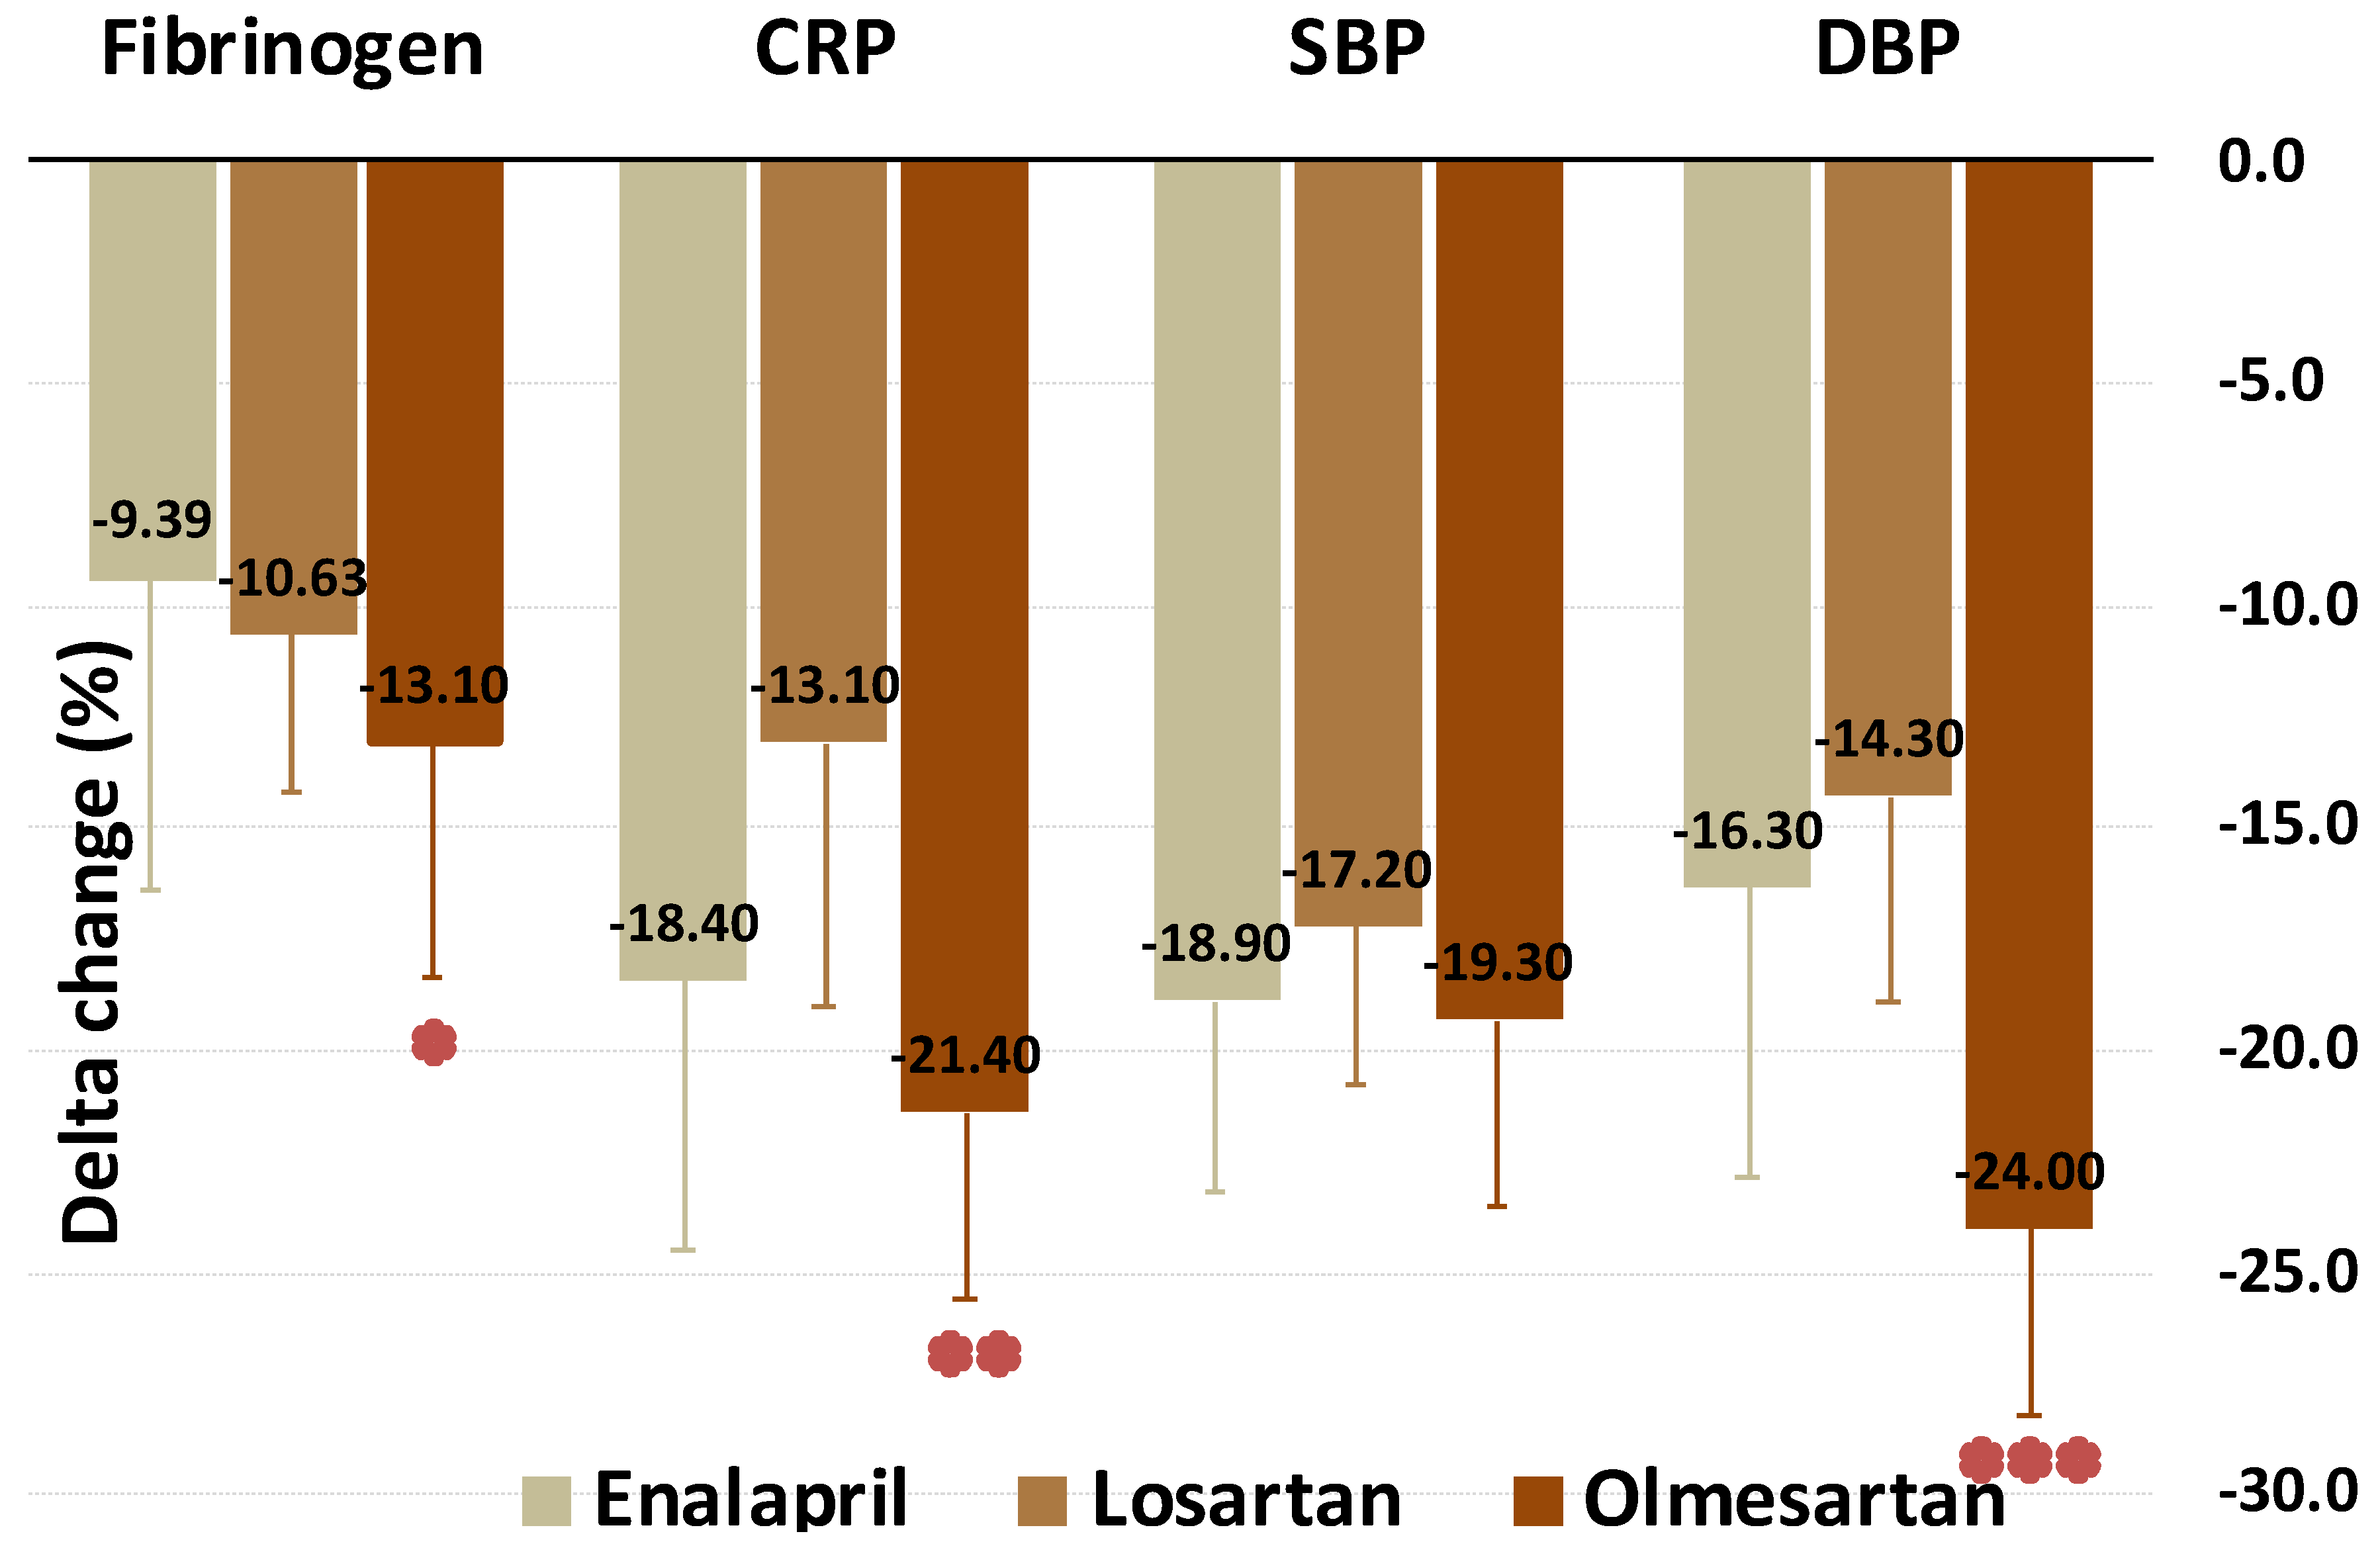
| HsCRP (mg/dL) | 0.82 (0.11) | 0.69 (0.18) | −18.4 p < 0.001 | 0.82 (0.12) | 0.73 (0.15) | −13.1 p < 0.001 | 0.7 (0.23) | 0.54 (0.21) | −21.4 p < 0.001 | p = 0.002 |
| Fibrinogen (mg/dL) | 302.8 (41.2) | 295 (62) | −9.39 p < 0.001 | 324 (33.4) | 290 (37) | −10.63 p < 0.001 | 287.2 (72.3) | 242.4 (45) | −13.1 p < 0.001 | p = 0.018 |
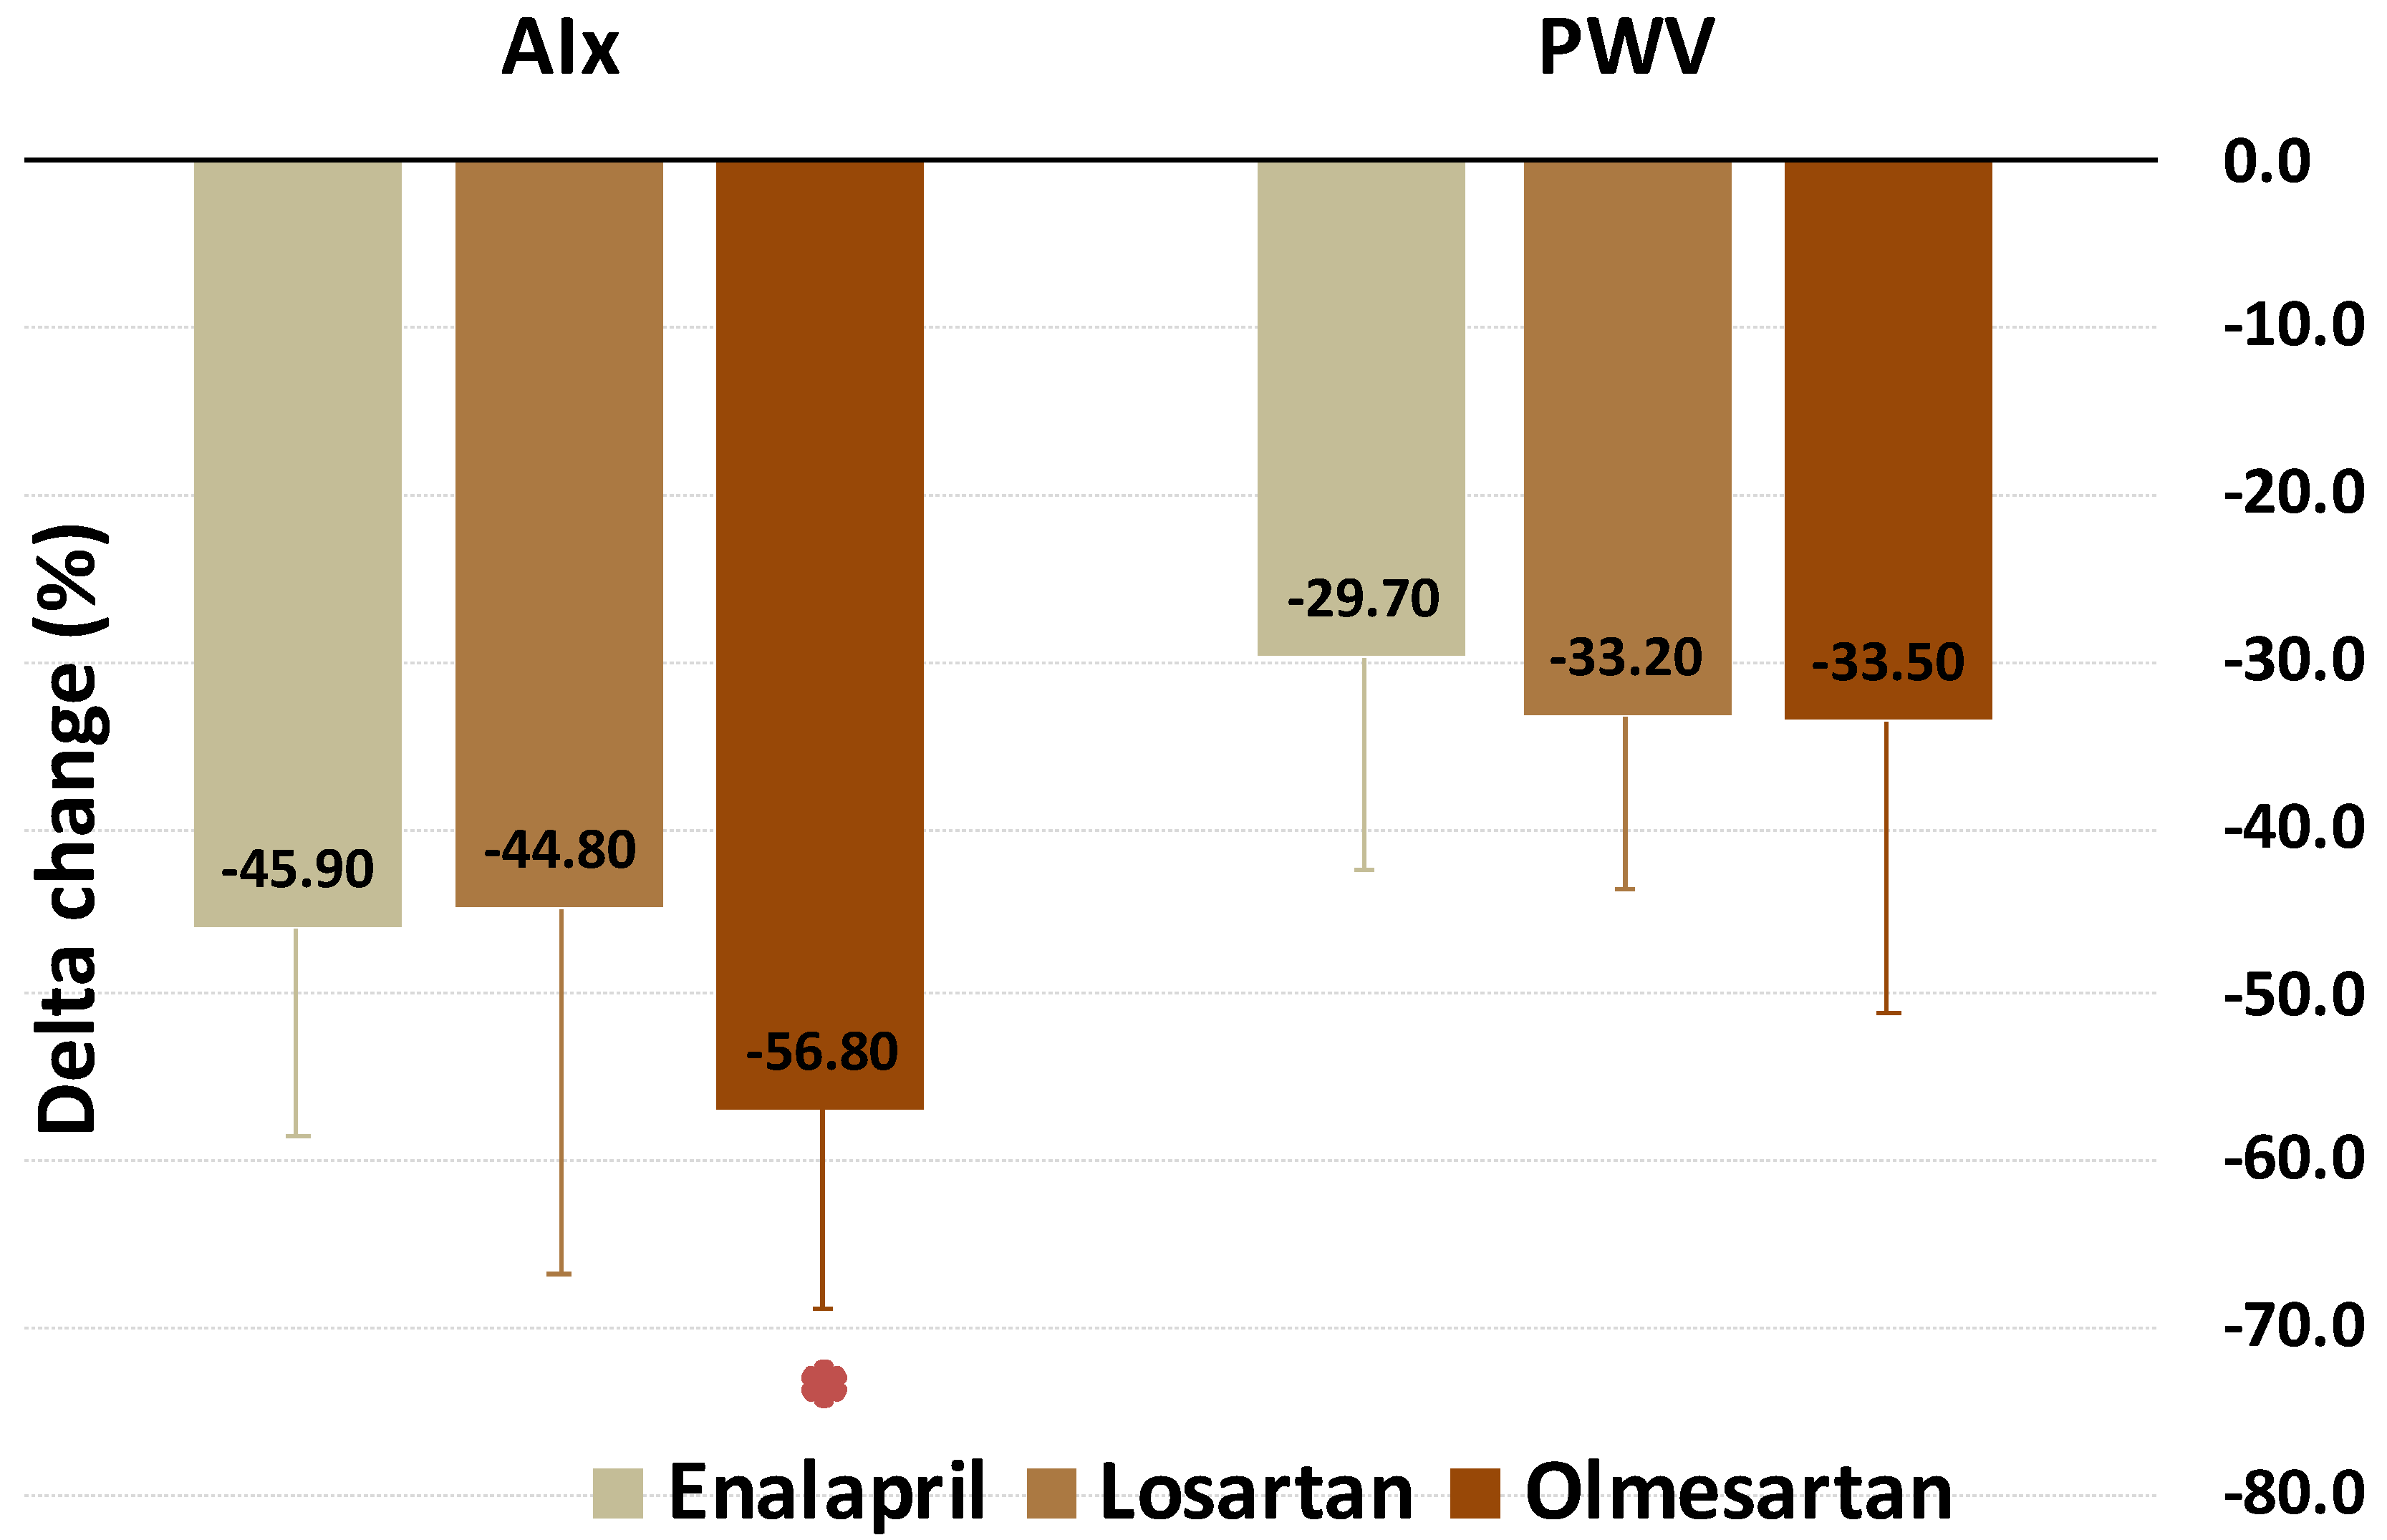
| AIx (%) | 12.8 (5.3) | 7 (3.3) | −45.9 p < 0.001 | 16.2 (9.2) | 7 (7.8) | −44.8 p < 0.001 | 11.1 (7.1) | 4 (4.8) | −56.8 p < 0.001 | p = 0.007 |
| PWV (m/s) | 8 (2.3) | 5.6 (2.2) | −29.7 p < 0.001 | 8.6 (1.6) | 5.4 (2.1) | −33.2 p < 0.001 | 7.4 (2.1) | 4.4 (1.0) | −33.5 p < 0.001 | p = 0.491 |
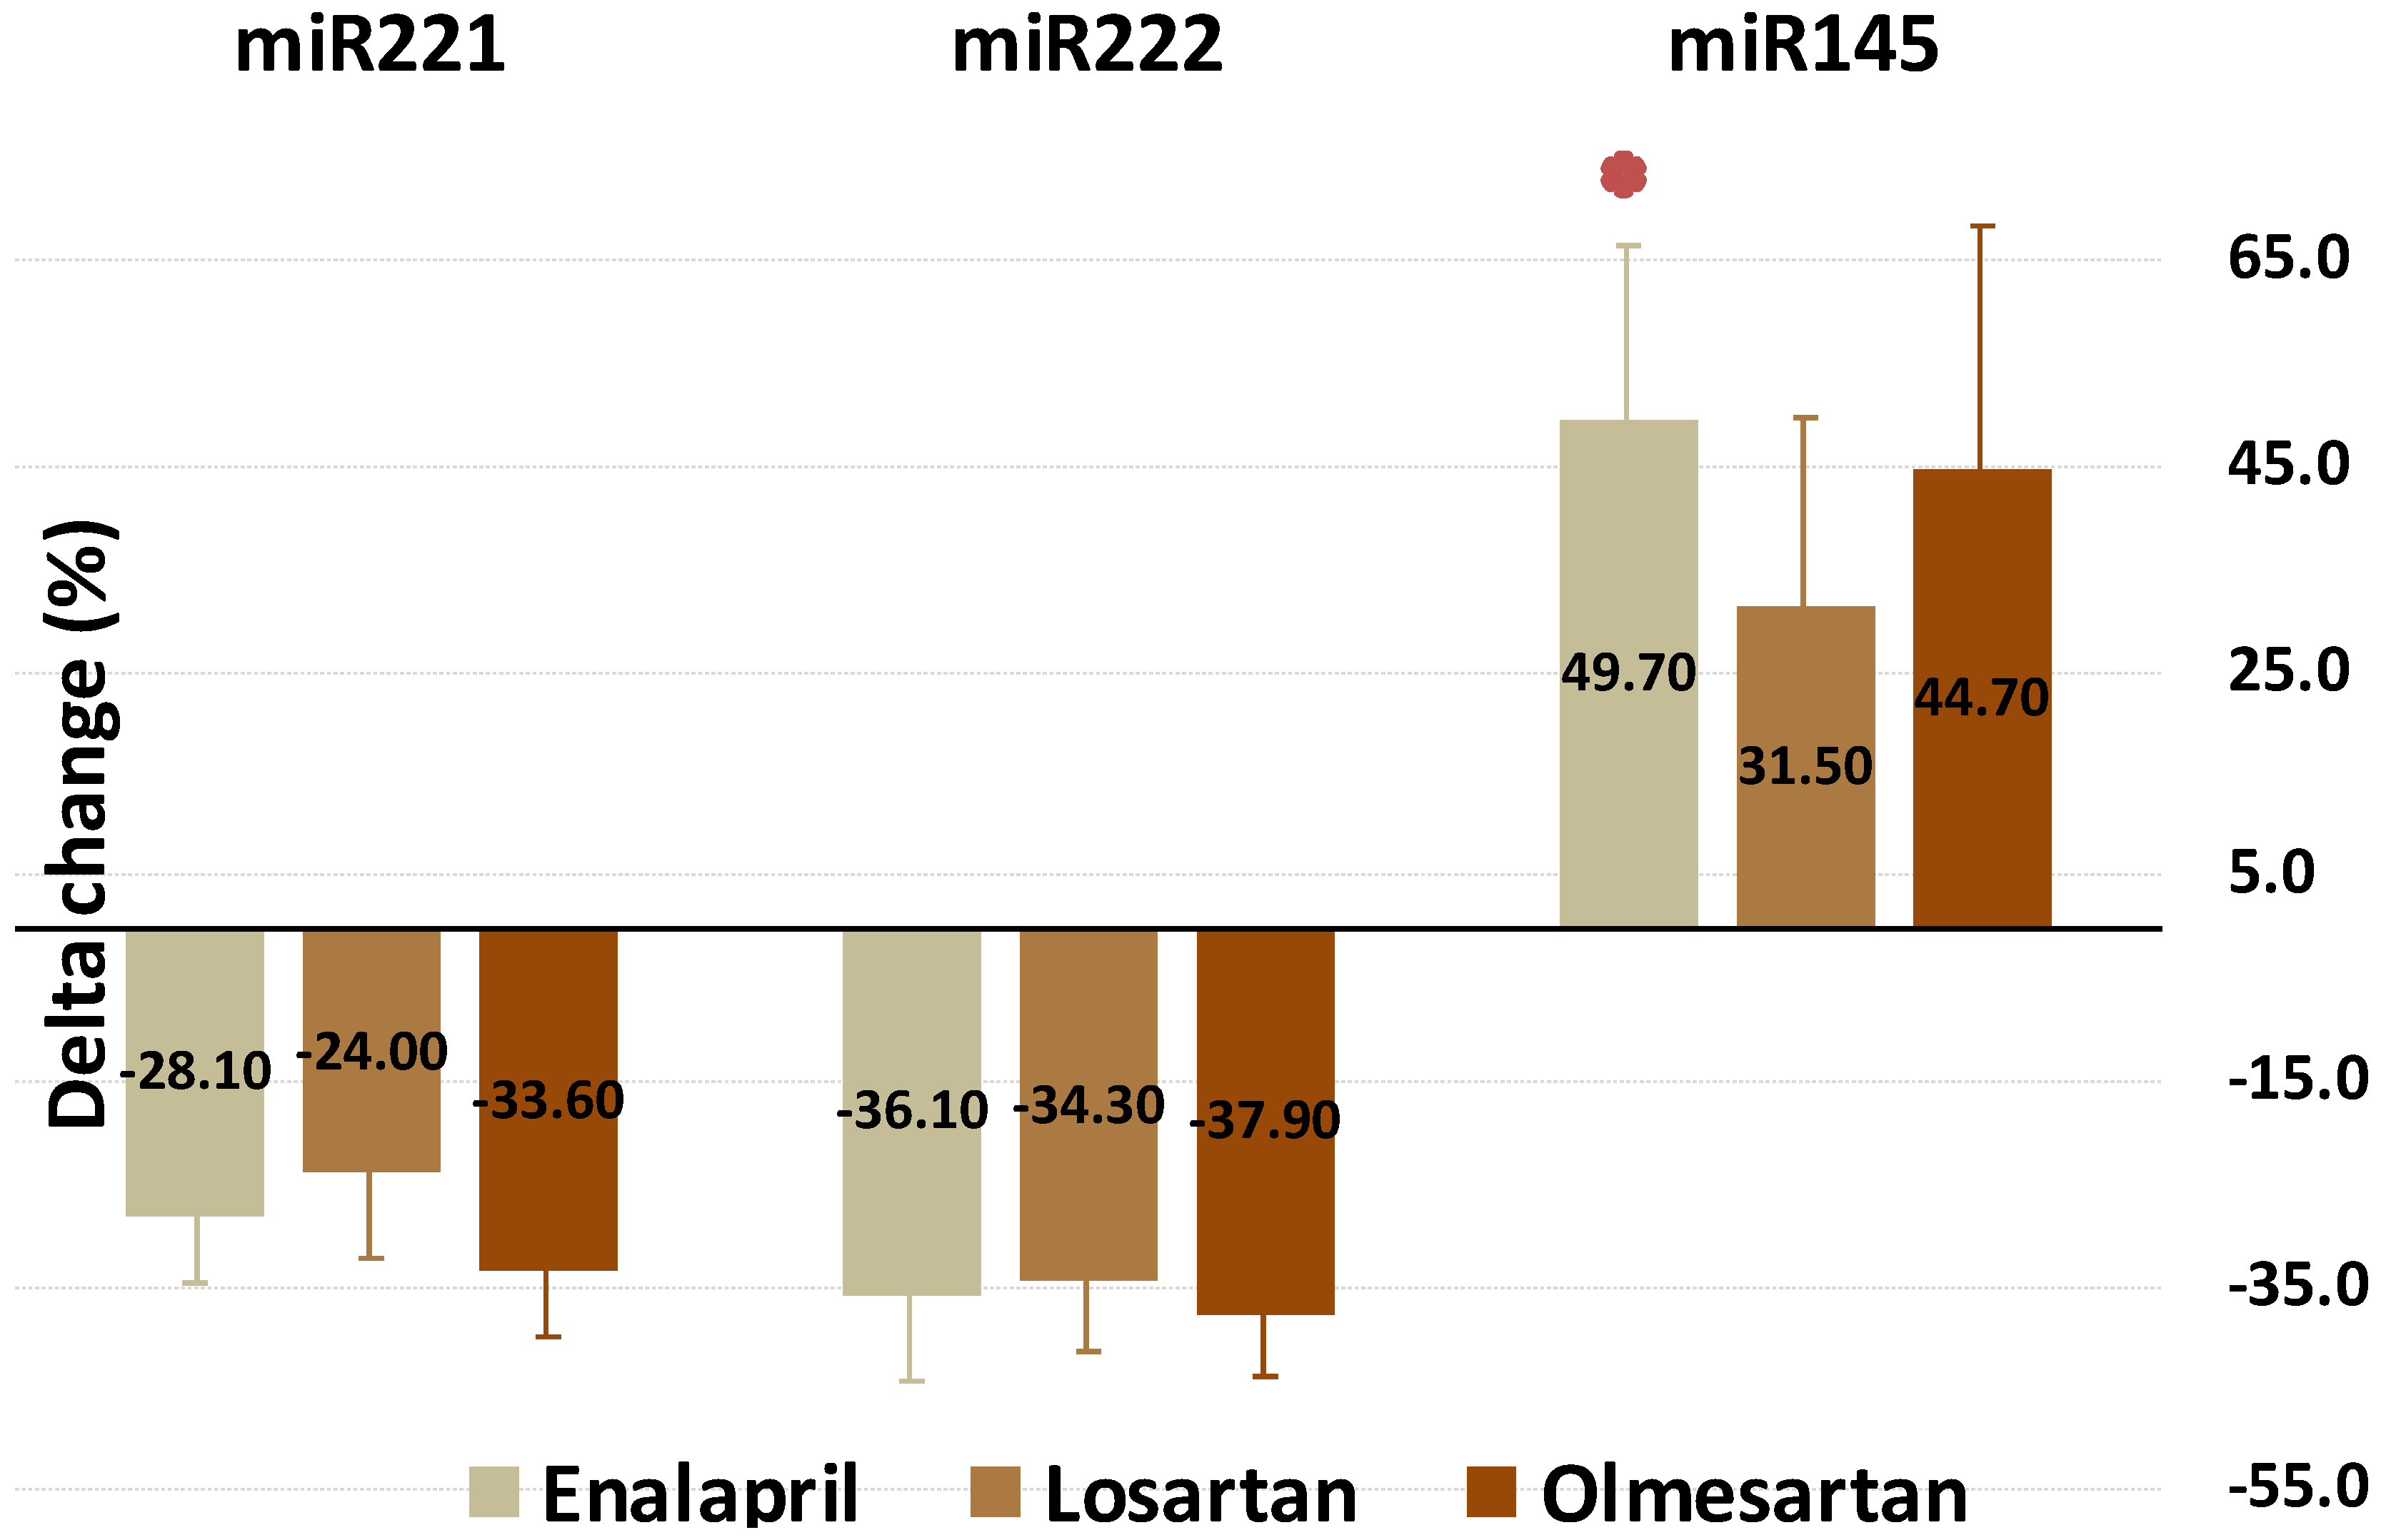
| miR-221 (n-fold) | 1.87 (0.74) | 1.35 (0.06) | −28.1 p < 0.001 | 2.05 (0.32) | 1.5 (0.17) | −24 p < 0.001 | 1.64 (0.7) | 1.11 (0.76) | −33.6 p < 0.001 | p = 0.055 |
| miR-222 (n-fold) | 1.89 (0.08) | 1.27 (0.29) | −36.1 p < 0.001 | 2.06 (0.42) | 1.33 (0.35) | −34.3 p < 0.001 | 1.8 (0.19) | 1.18 (0.05) | −37.9 p < 0.001 | p < 0.634 |
| miR-145 (n-fold) | 0.62 (0.15) | 0.98 (0.15) | 49.7 p < 0.001 | 0.57(0.1) | 0.75 (0.17) | 31.5 p < 0.001 | 0.68(0.22) | 0.95 (0.11) | 44.7 p < 0.001 | p = 0.001 |
| Enalapril | Losartan | Olmesartan | p | |
|---|---|---|---|---|
| Fibrinogen | Worst | - | Best | =0.015 |
| CRP | - | Worst | Best | <0.001 |
| DBP | Worst | Worst | Best | <0.001 |
| miR-145 | Best | Worst | - | <0.001 |
| AIx | Worst | Worst | Best | <0.05 |
Publisher’s Note: MDPI stays neutral with regard to jurisdictional claims in published maps and institutional affiliations. |
© 2021 by the authors. Licensee MDPI, Basel, Switzerland. This article is an open access article distributed under the terms and conditions of the Creative Commons Attribution (CC BY) license (https://creativecommons.org/licenses/by/4.0/).
Share and Cite
Mandraffino, G.; Lo Gullo, A.; Cinquegrani, M.; D’Ascola, A.; Sinicropi, D.; Imbalzano, E.; Blando, G.; Campo, G.M.; Morace, C.; Giuffrida, C.; et al. Expression and Change of miRs 145, 221 and 222 in Hypertensive Subjects Treated with Enalapril, Losartan or Olmesartan. Biomedicines 2021, 9, 860. https://doi.org/10.3390/biomedicines9080860
Mandraffino G, Lo Gullo A, Cinquegrani M, D’Ascola A, Sinicropi D, Imbalzano E, Blando G, Campo GM, Morace C, Giuffrida C, et al. Expression and Change of miRs 145, 221 and 222 in Hypertensive Subjects Treated with Enalapril, Losartan or Olmesartan. Biomedicines. 2021; 9(8):860. https://doi.org/10.3390/biomedicines9080860
Chicago/Turabian StyleMandraffino, Giuseppe, Alberto Lo Gullo, Maria Cinquegrani, Angela D’Ascola, Davide Sinicropi, Egidio Imbalzano, Giuseppe Blando, Giuseppe Maurizio Campo, Carmela Morace, Clemente Giuffrida, and et al. 2021. "Expression and Change of miRs 145, 221 and 222 in Hypertensive Subjects Treated with Enalapril, Losartan or Olmesartan" Biomedicines 9, no. 8: 860. https://doi.org/10.3390/biomedicines9080860
APA StyleMandraffino, G., Lo Gullo, A., Cinquegrani, M., D’Ascola, A., Sinicropi, D., Imbalzano, E., Blando, G., Campo, G. M., Morace, C., Giuffrida, C., Campo, S., Squadrito, G., & Scuruchi, M. (2021). Expression and Change of miRs 145, 221 and 222 in Hypertensive Subjects Treated with Enalapril, Losartan or Olmesartan. Biomedicines, 9(8), 860. https://doi.org/10.3390/biomedicines9080860