
Development of Vancomycin Delivery Systems Based on Autologous 3D Platelet-Rich Fibrin Matrices for Bone Tissue Engineering

 , ,
, , 
Abstract
1. Introduction
2. Materials and Methods
2.1. Materials
2.2. Blood Collection and Separation of PRF
2.3. Preparation of VANKA Carriers
2.3.1. Preparation of Liposomes
2.3.2. Preparation of Microcapsules
2.4. Incorporation of VANKA Carriers in PRF
2.5. Characterization of VANKA Carriers and PRF Scaffold
2.5.1. Drug Load and Encapsulation Efficiency
2.5.2. Particle Size
2.5.3. Morphology
2.5.4. Chemical Structure and Phase Composition
2.5.5. Micro-Computed Tomography Analysis
2.6. Assessment of VANKA Release Kinetics
2.7. Preparation of Bacterial Suspension and Inoculum for Antibacterial Tests
2.8. Determination of VANKA Loaded PRF Antibacterial Properties
2.9. Determination of Antibacterial Properties of Sample Incubation Medium
2.10. Statistical Evaluation
3. Results
3.1. Evaluation of VANKA Carriers
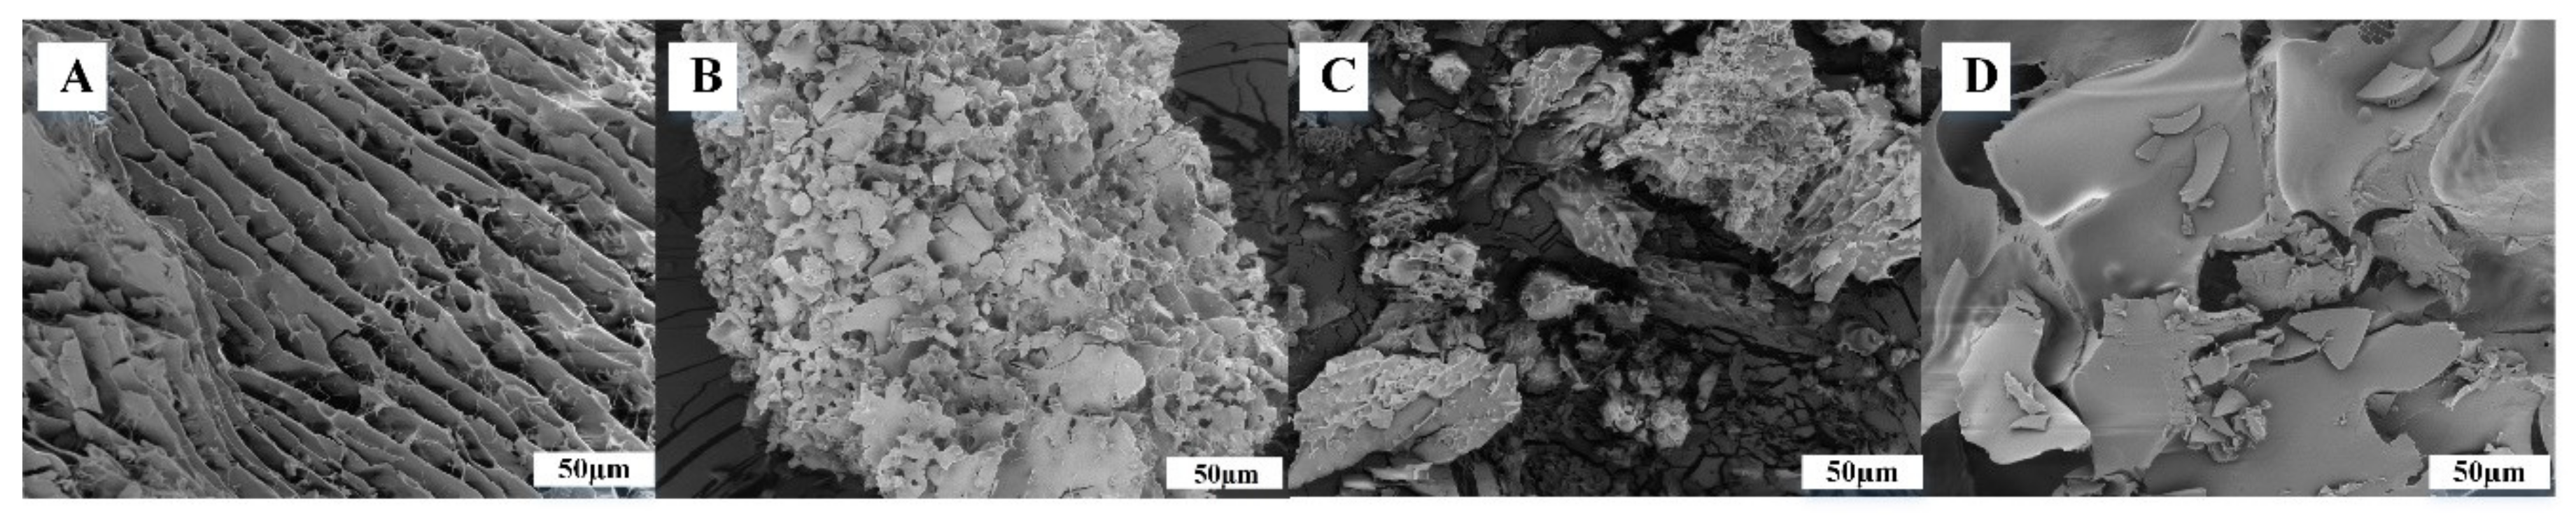
3.1.1. Particle Size Distribution and Morphology
3.1.2. Drug Load and Encapsulation Efficiency
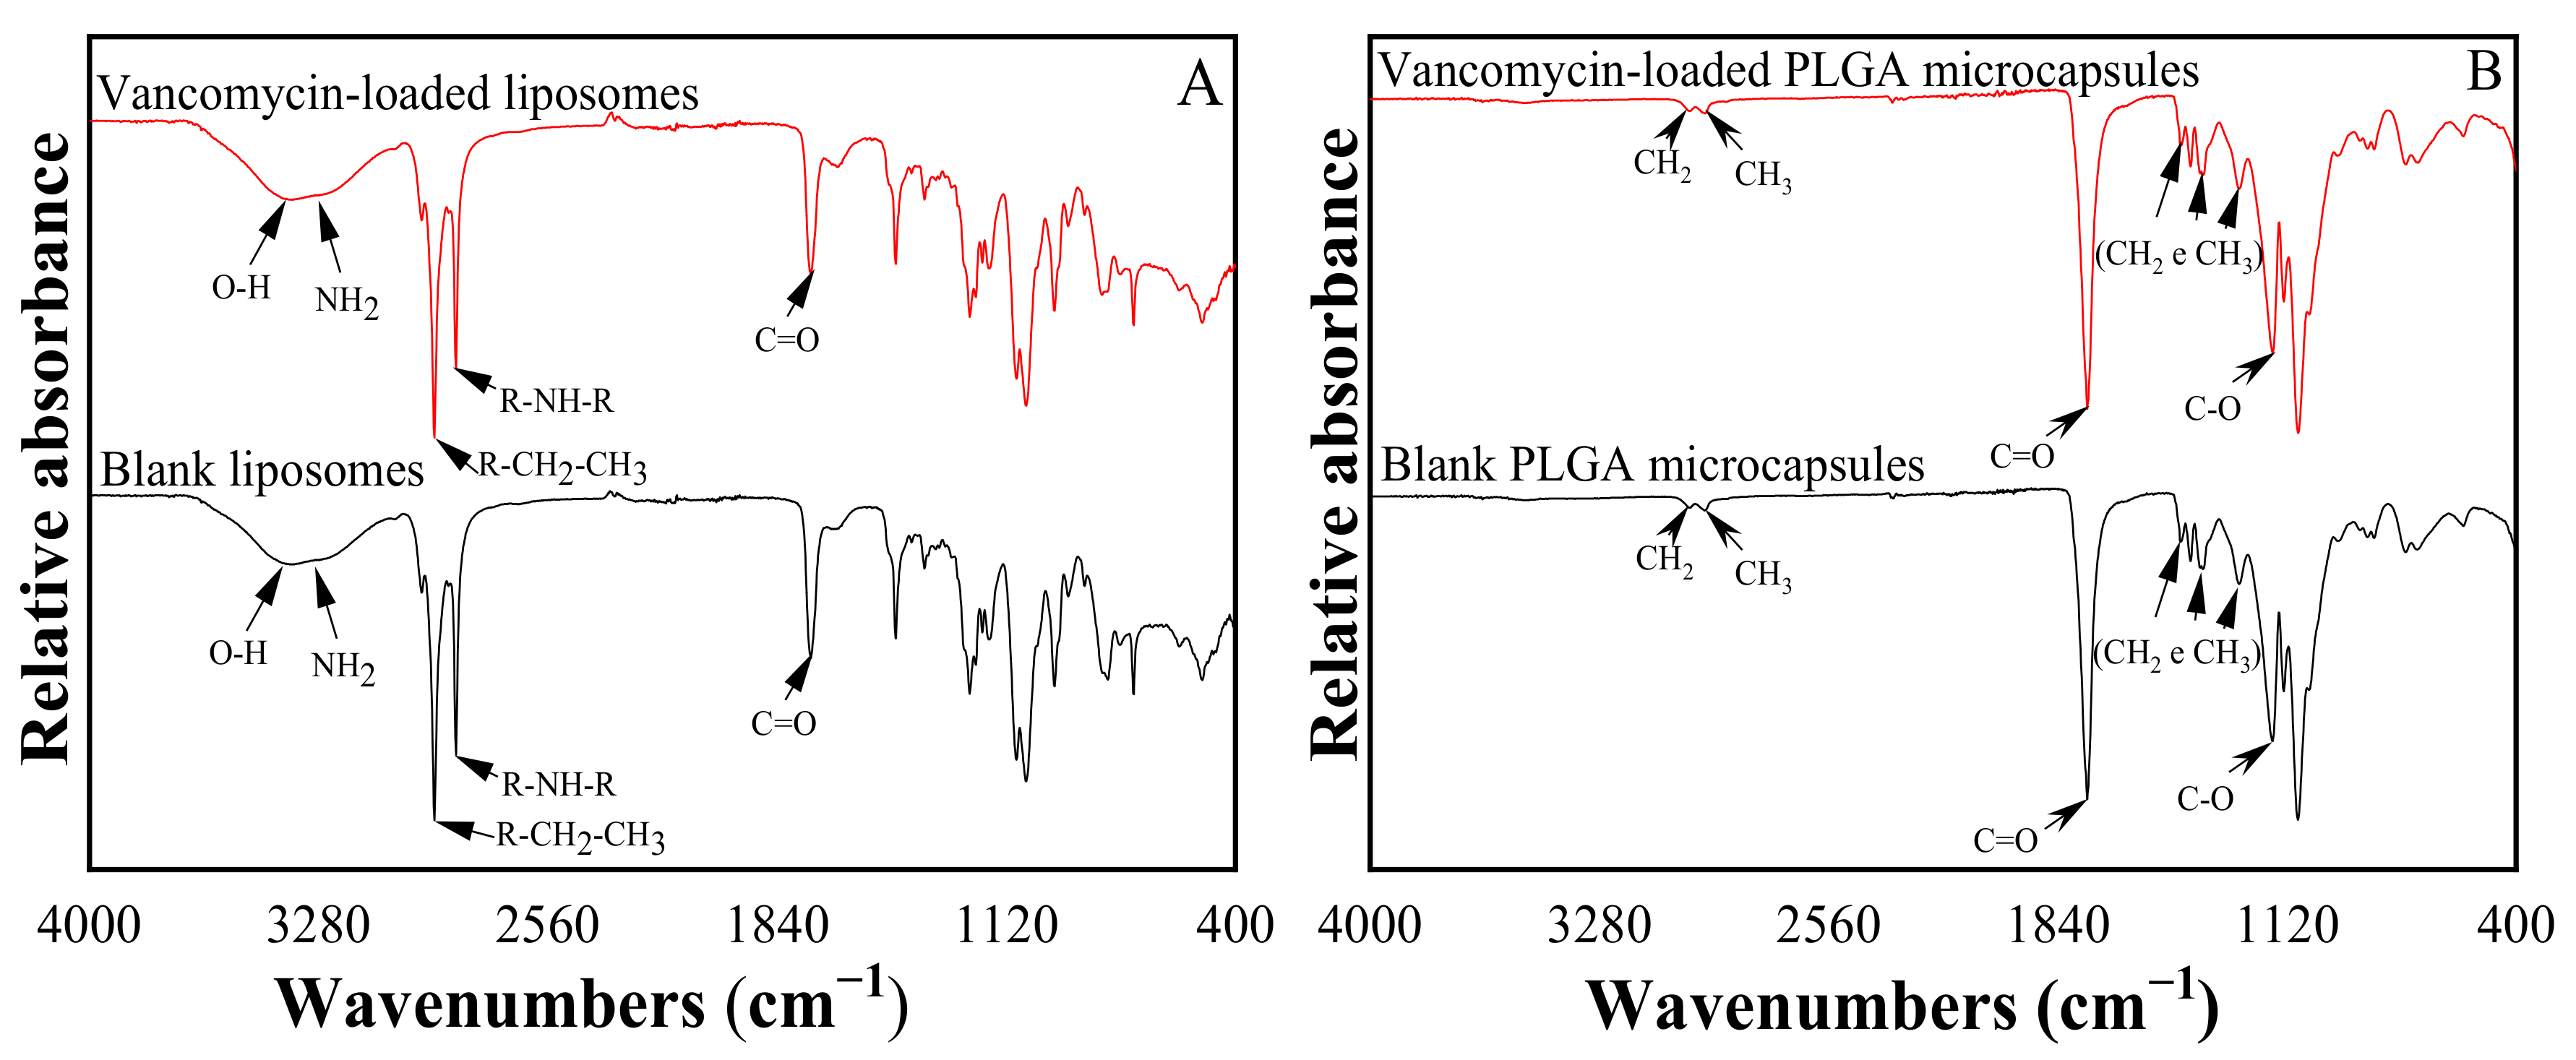
3.1.3. Chemical Structure of VANKA Carriers
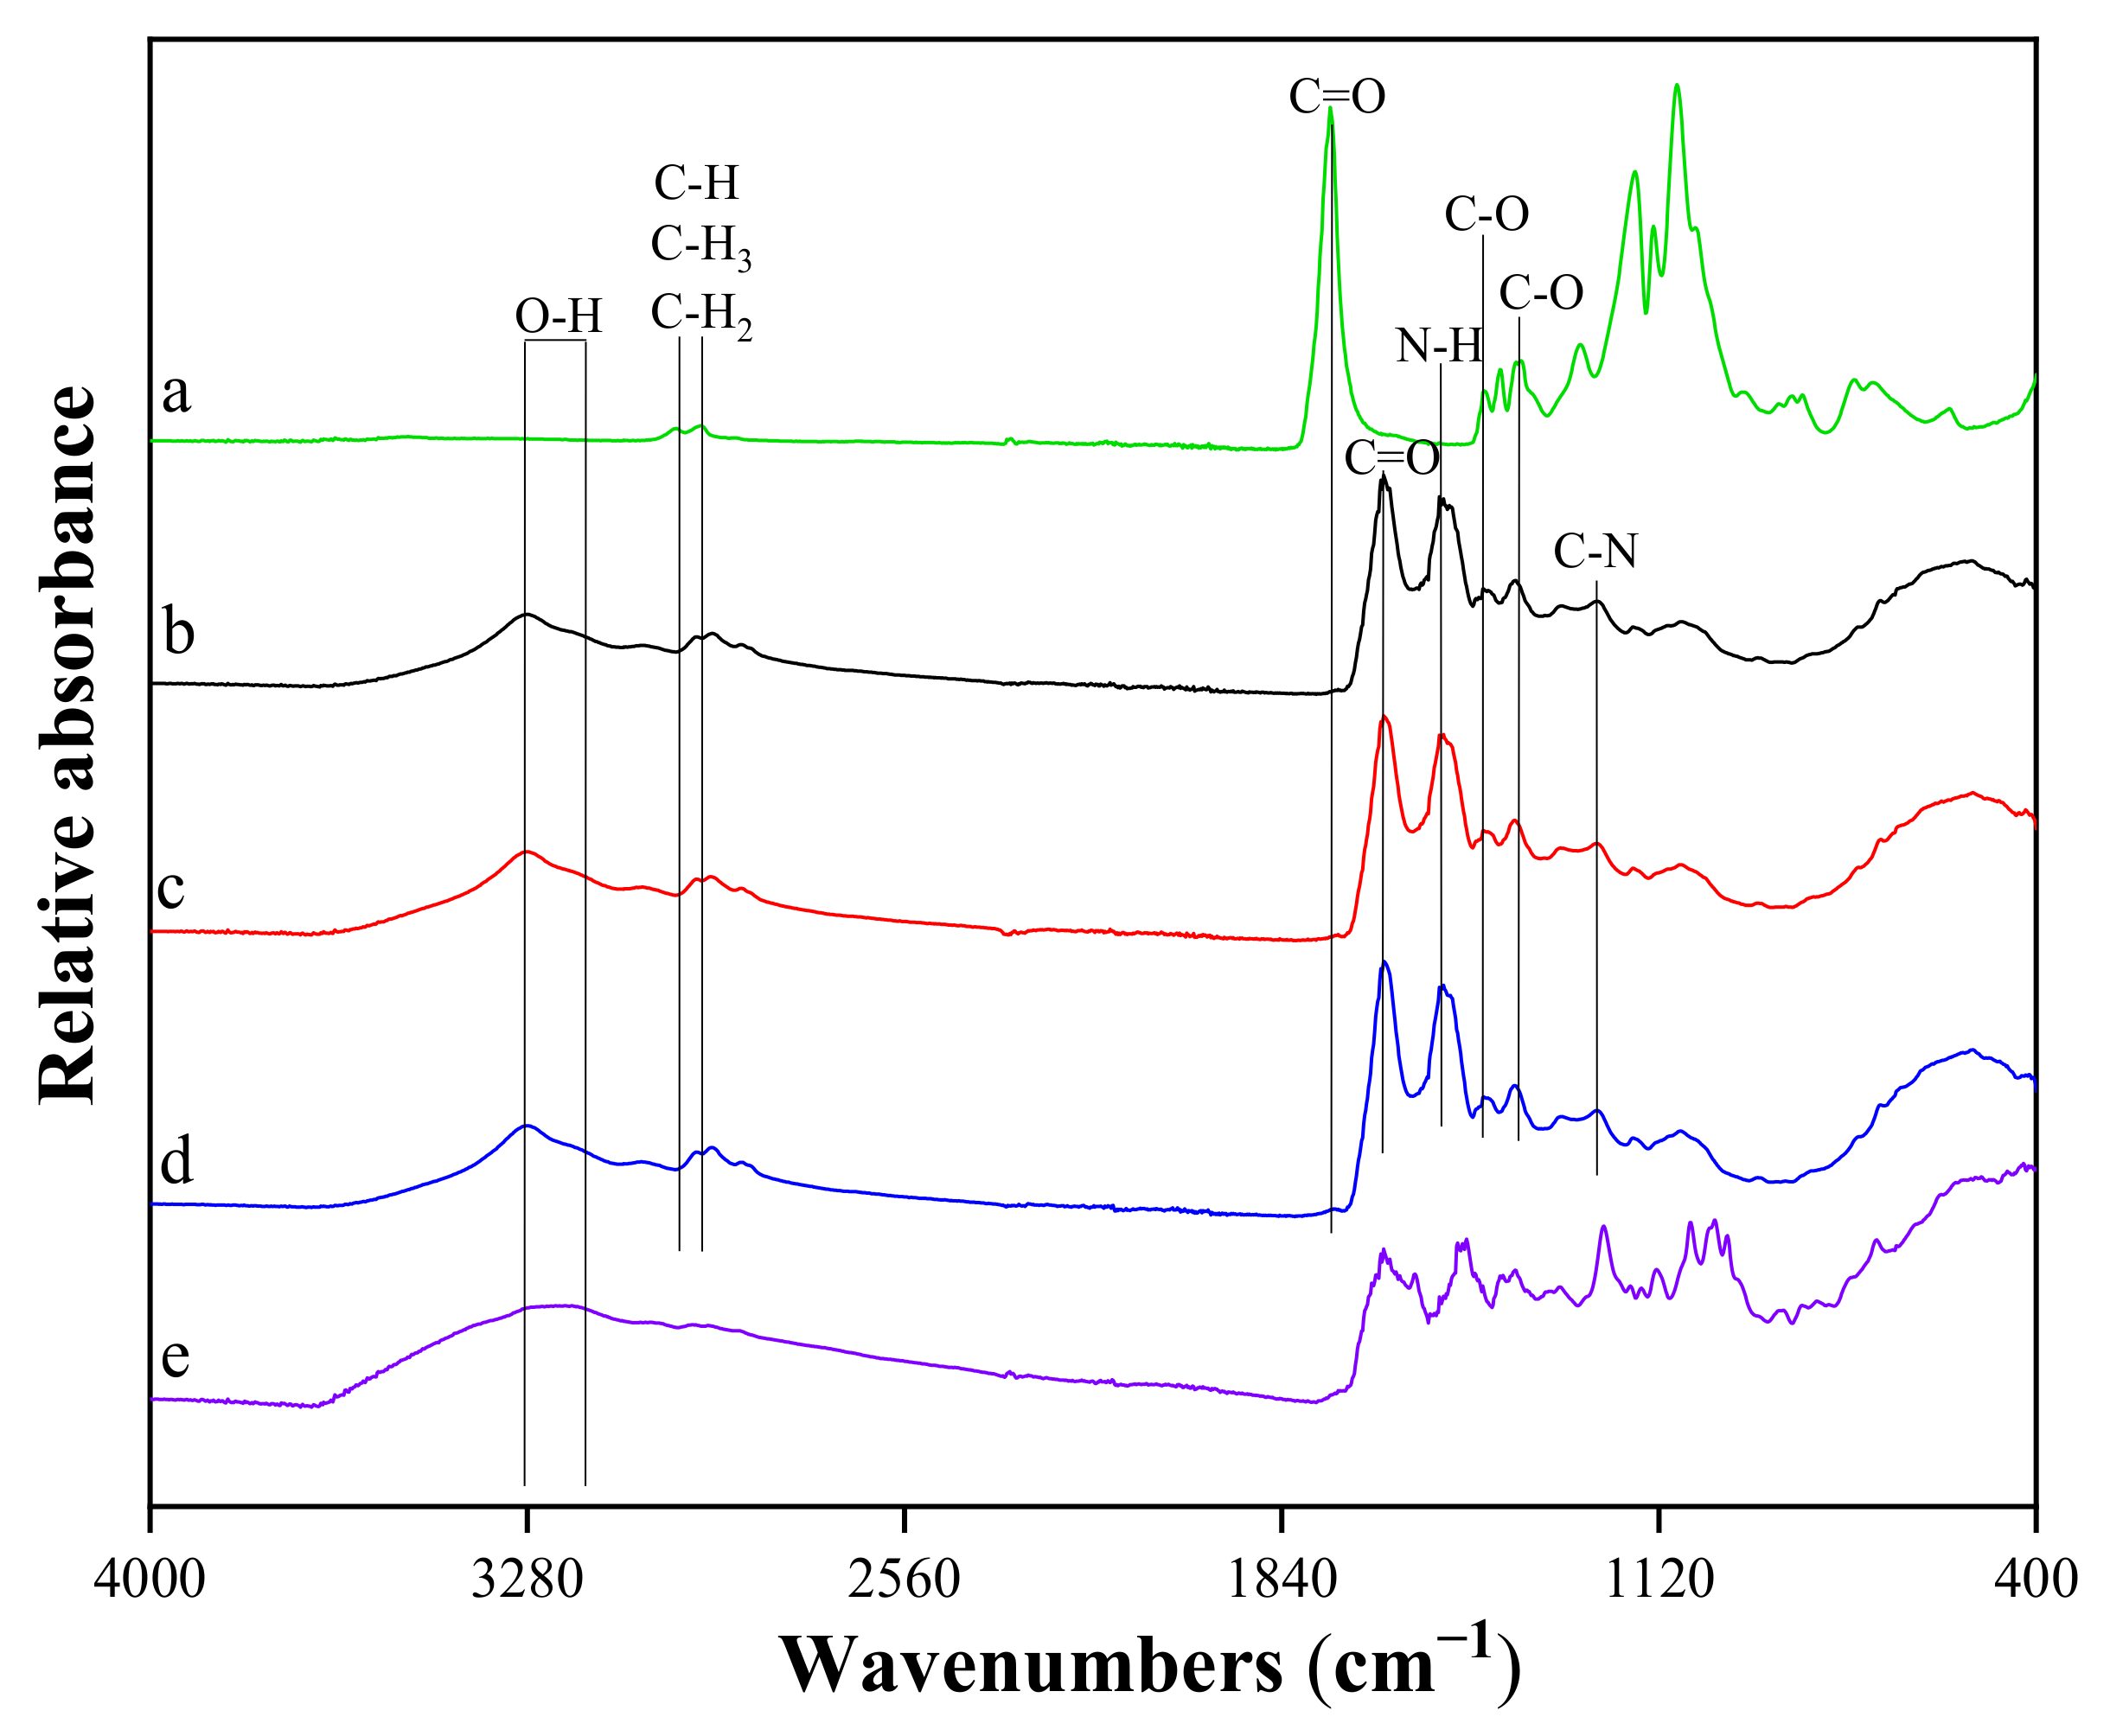
3.2. Characterization of Modified PRF Scaffold
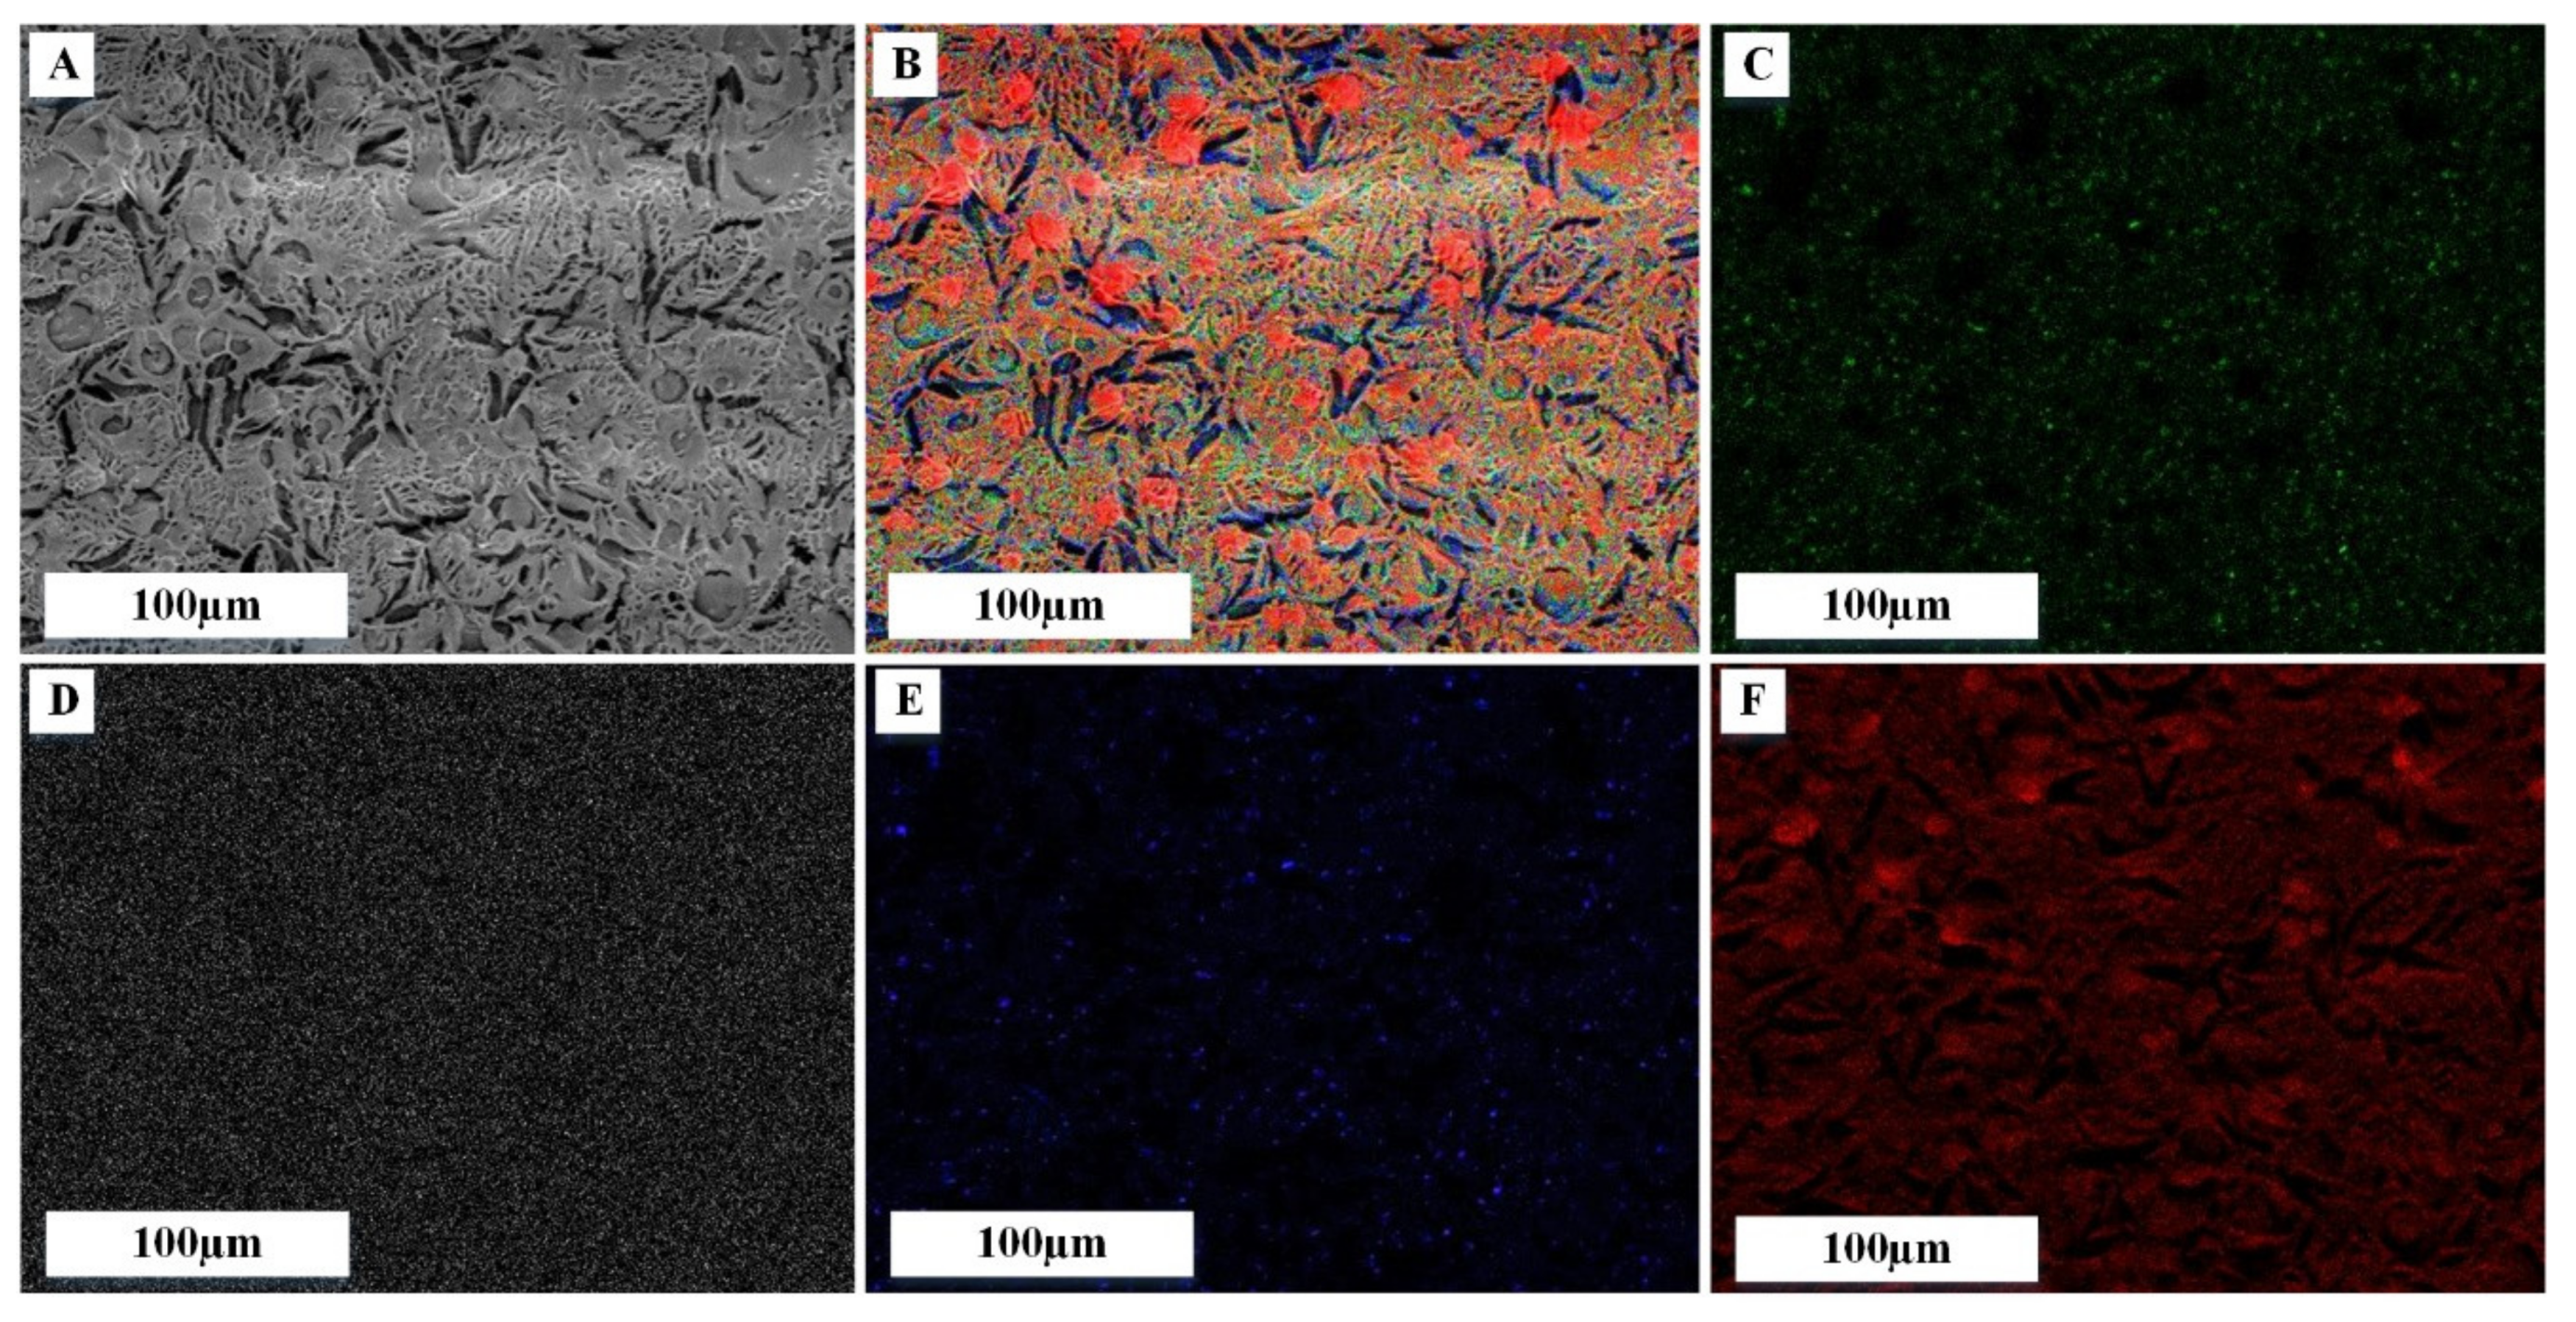
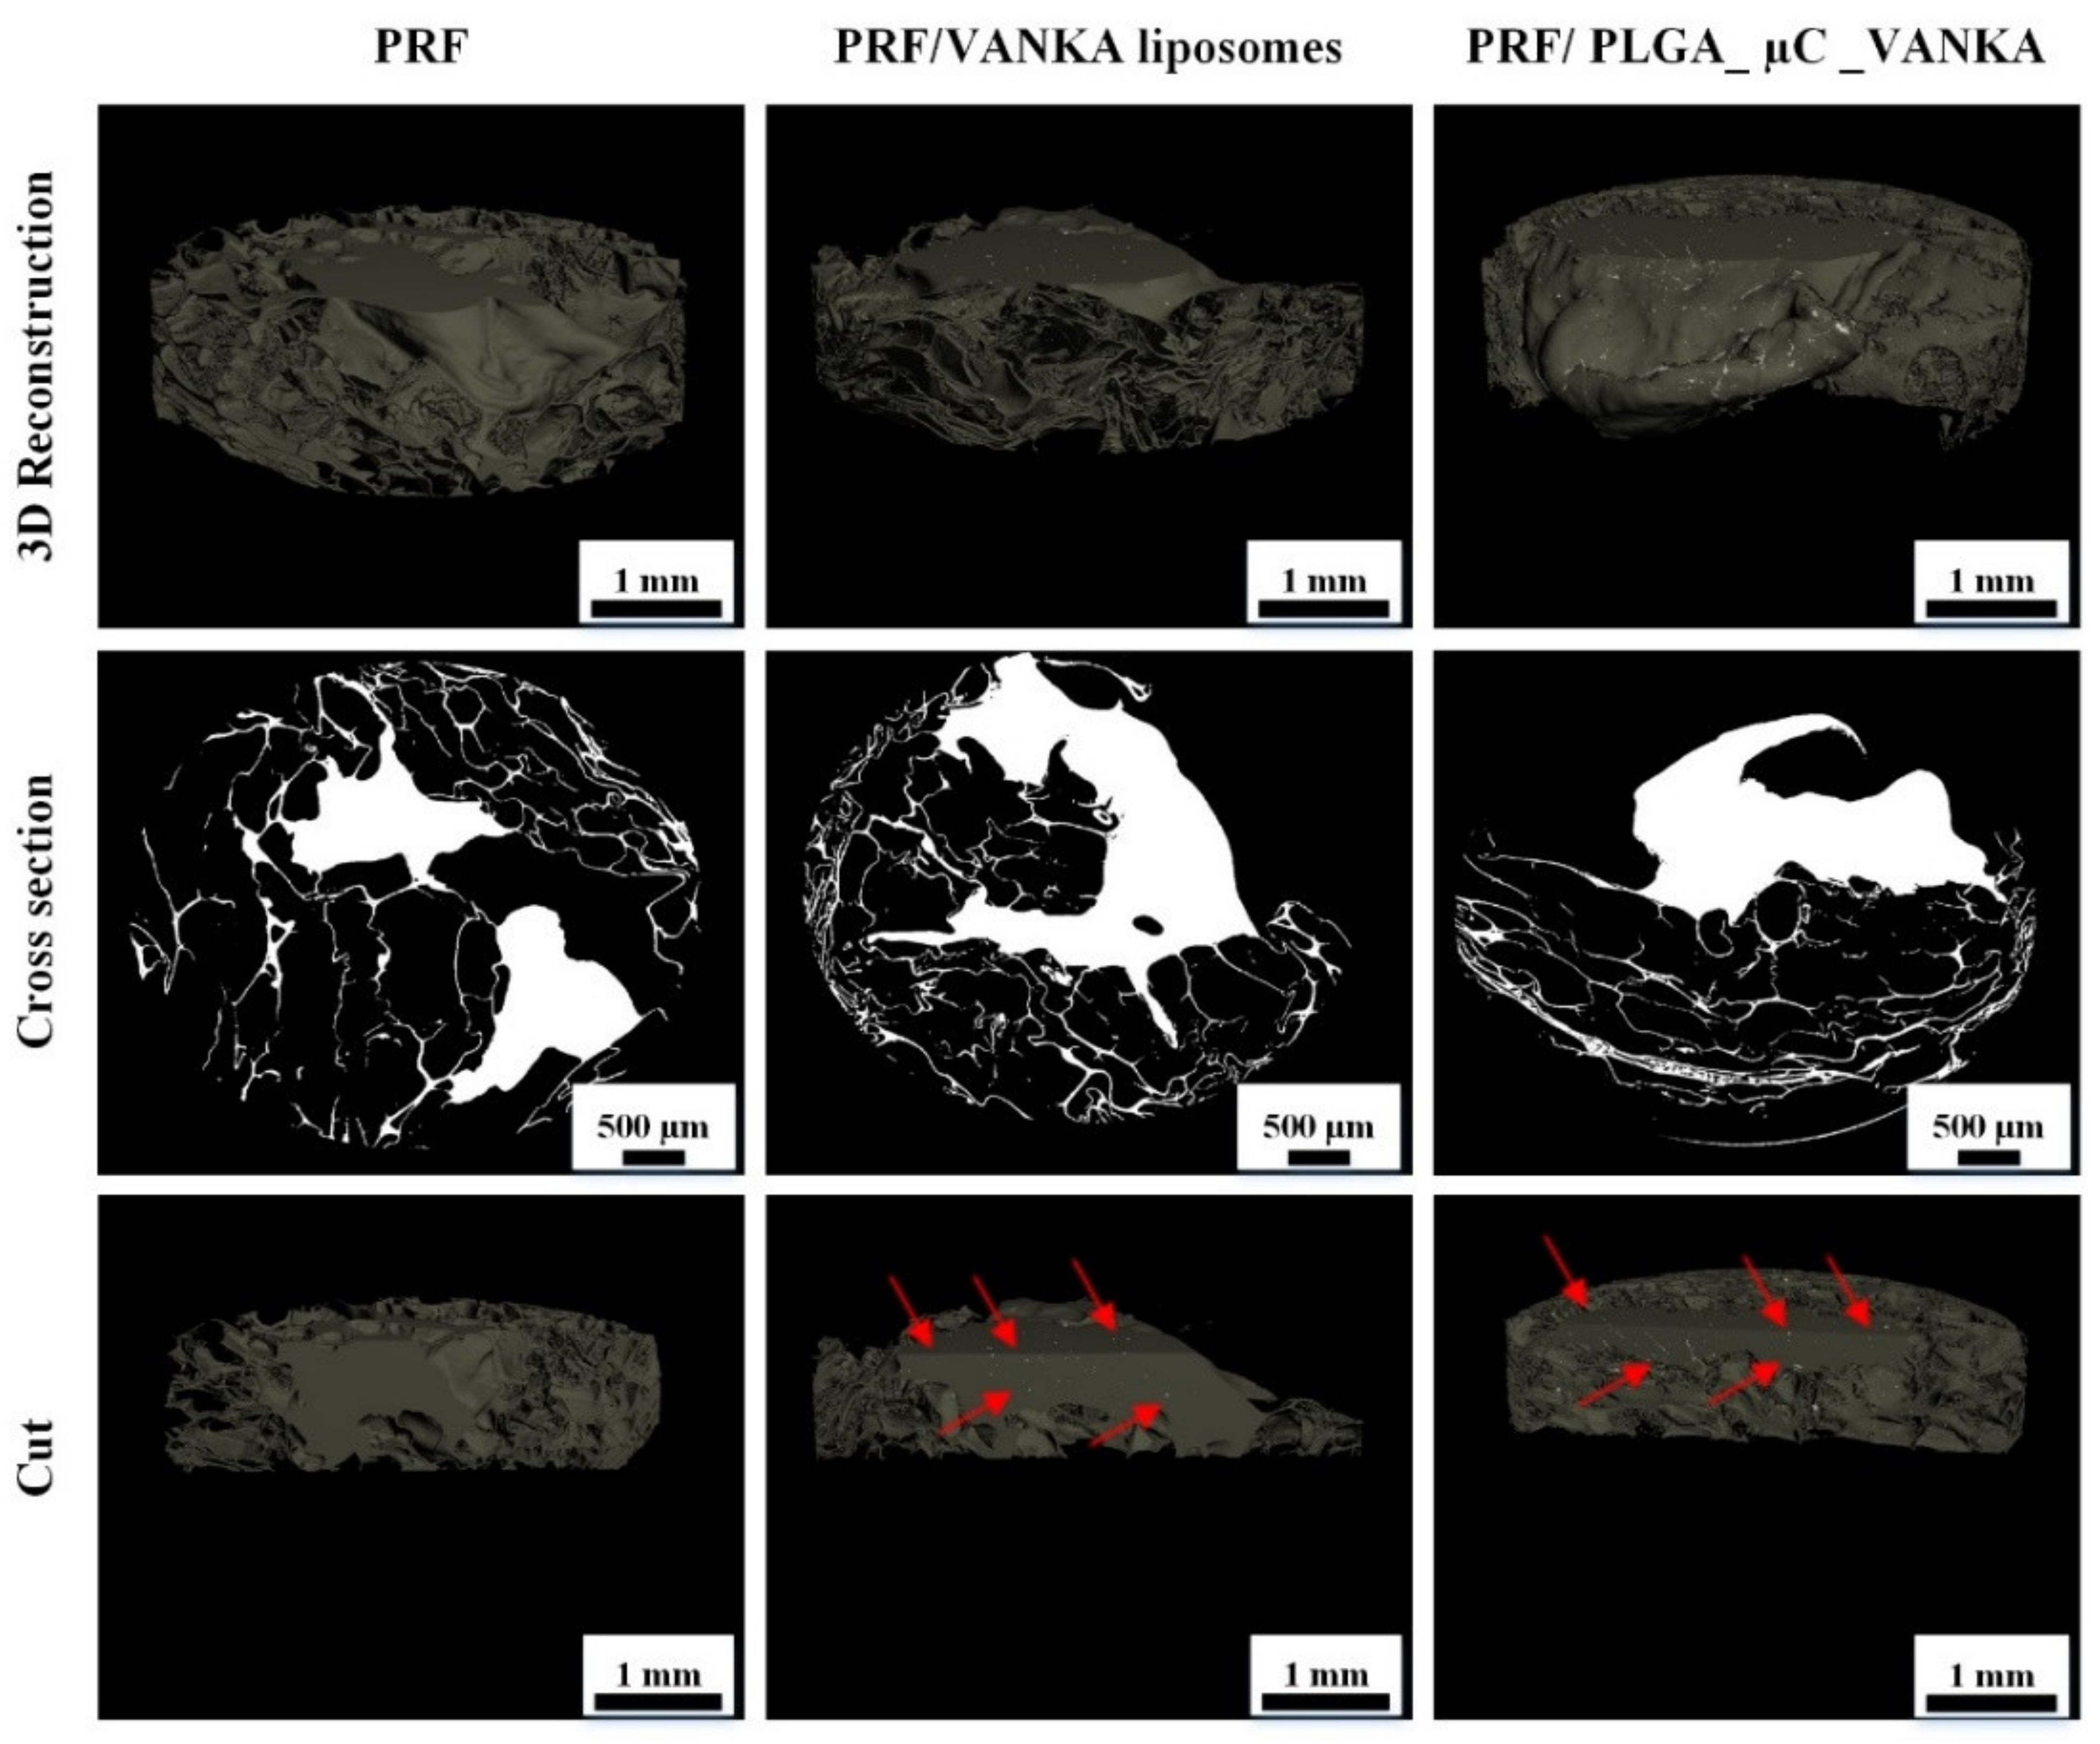
3.3. 3D Structure of Modified PRF Scaffolds
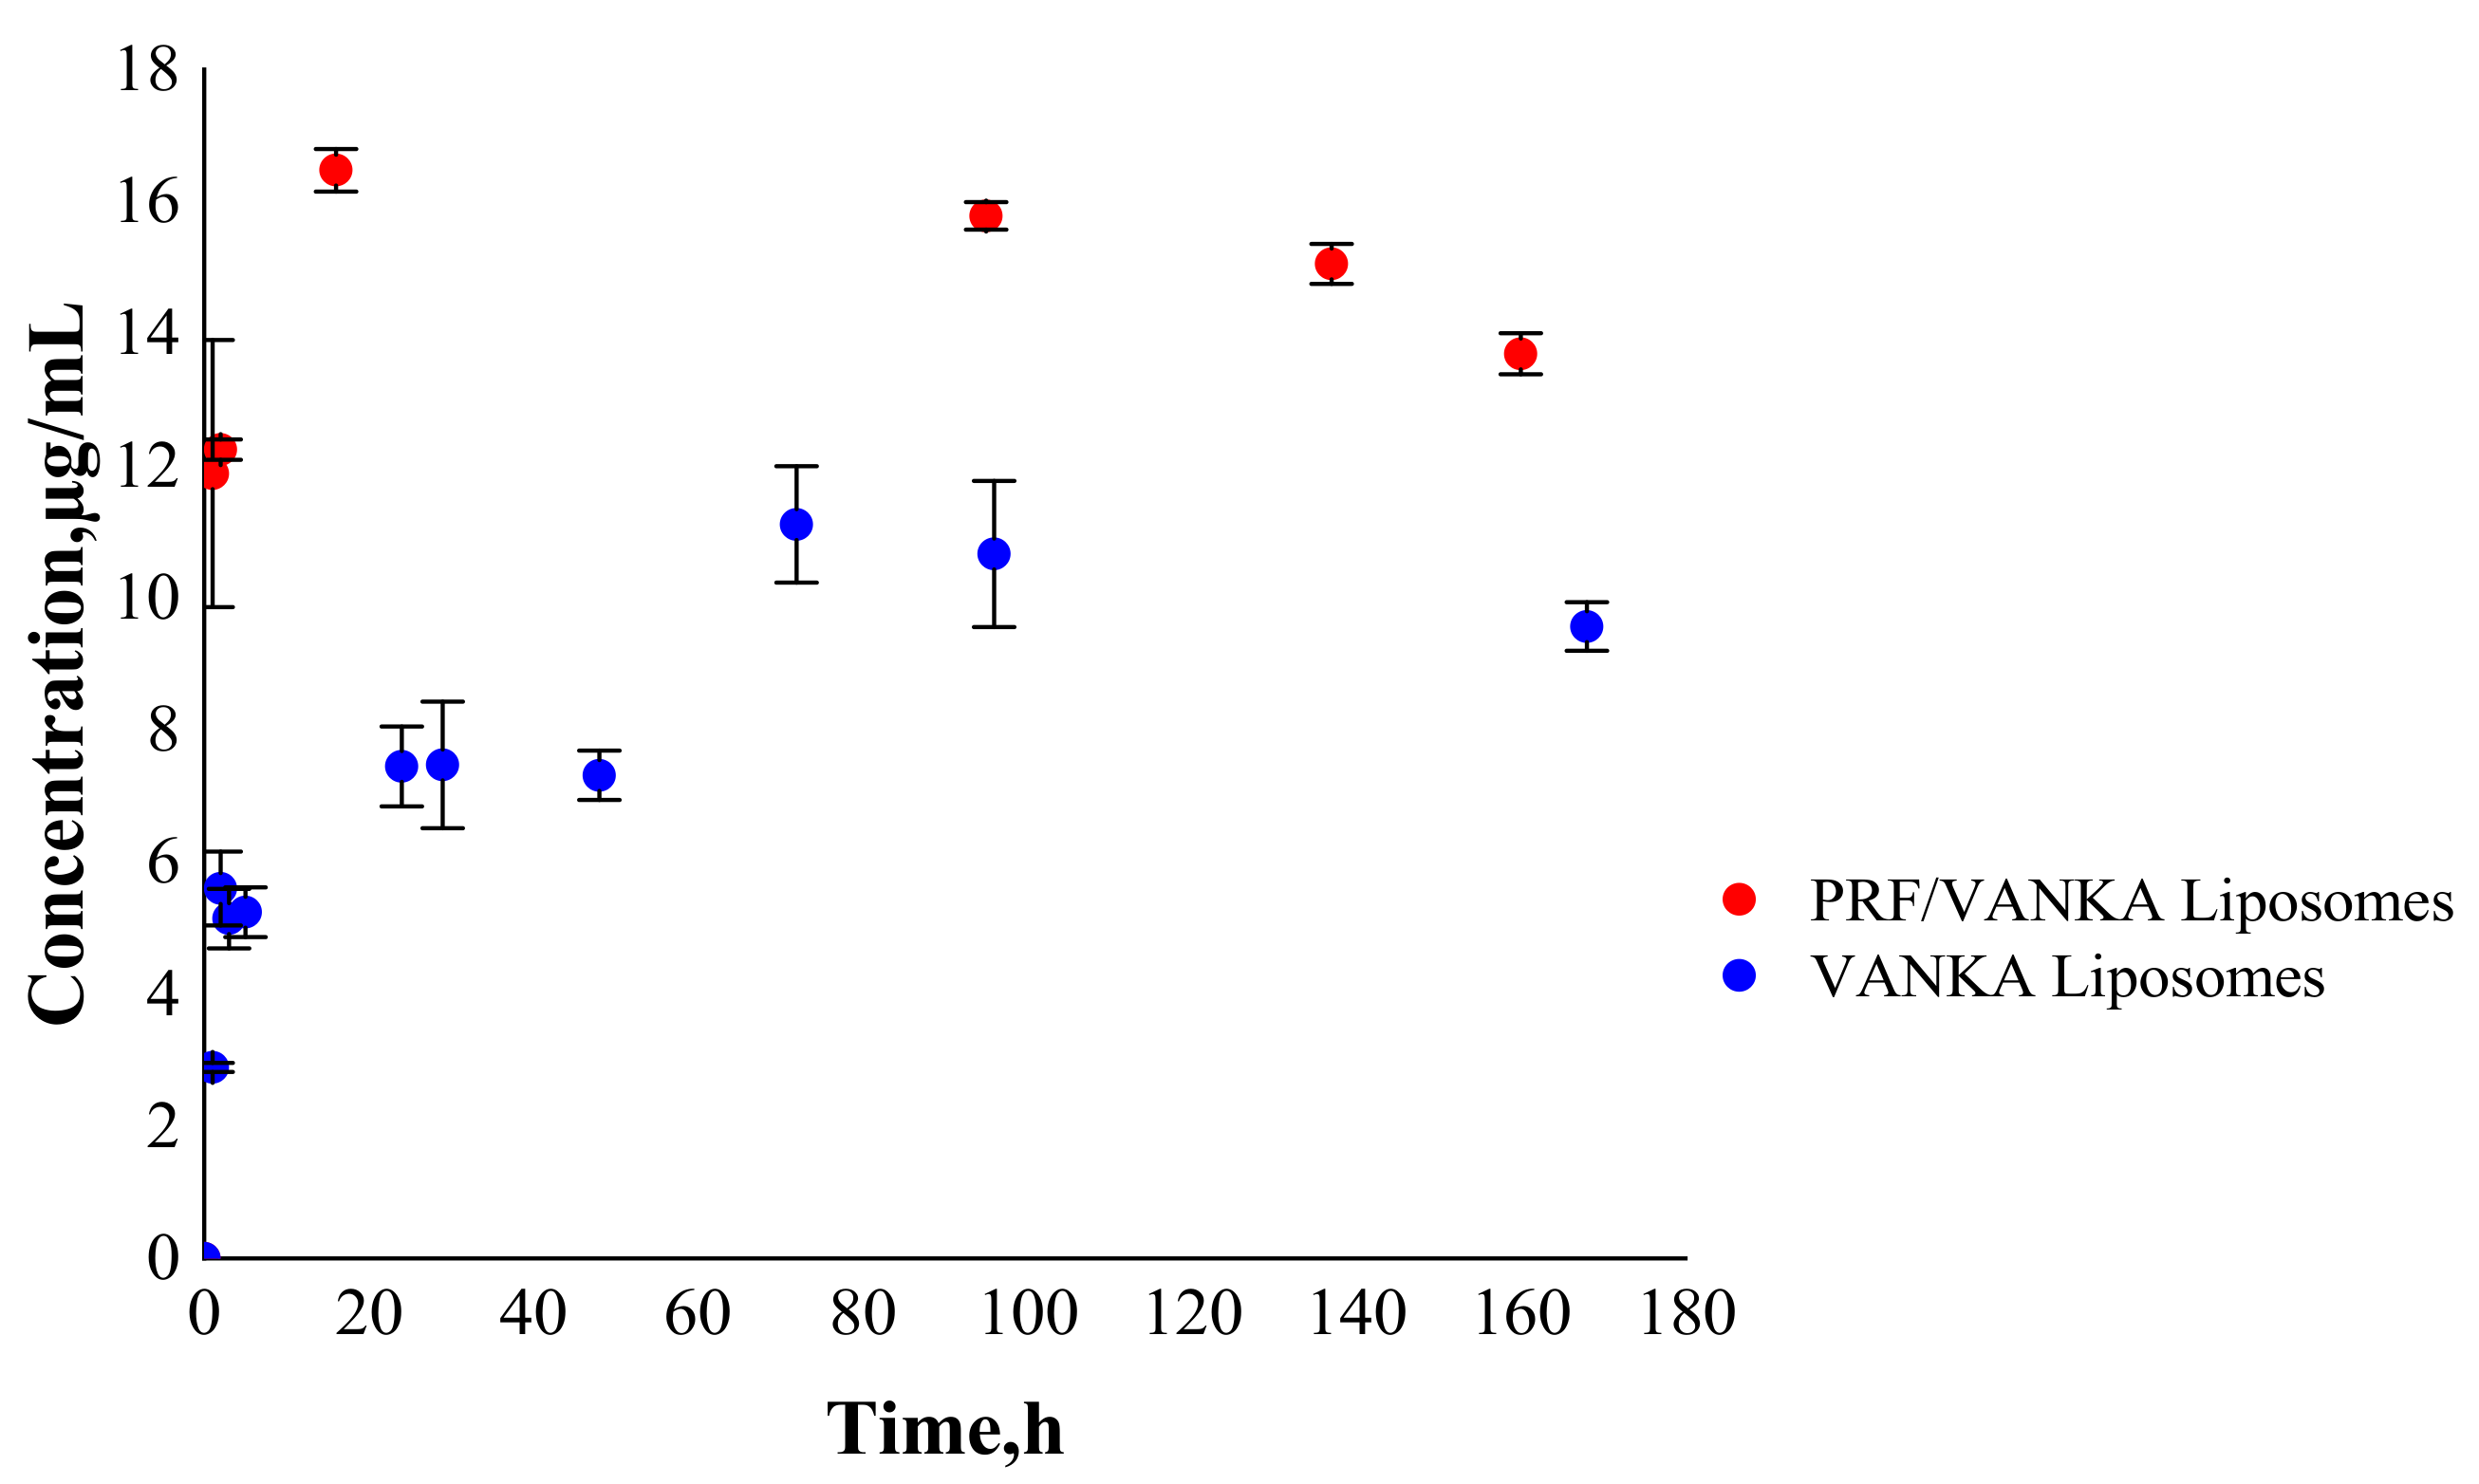
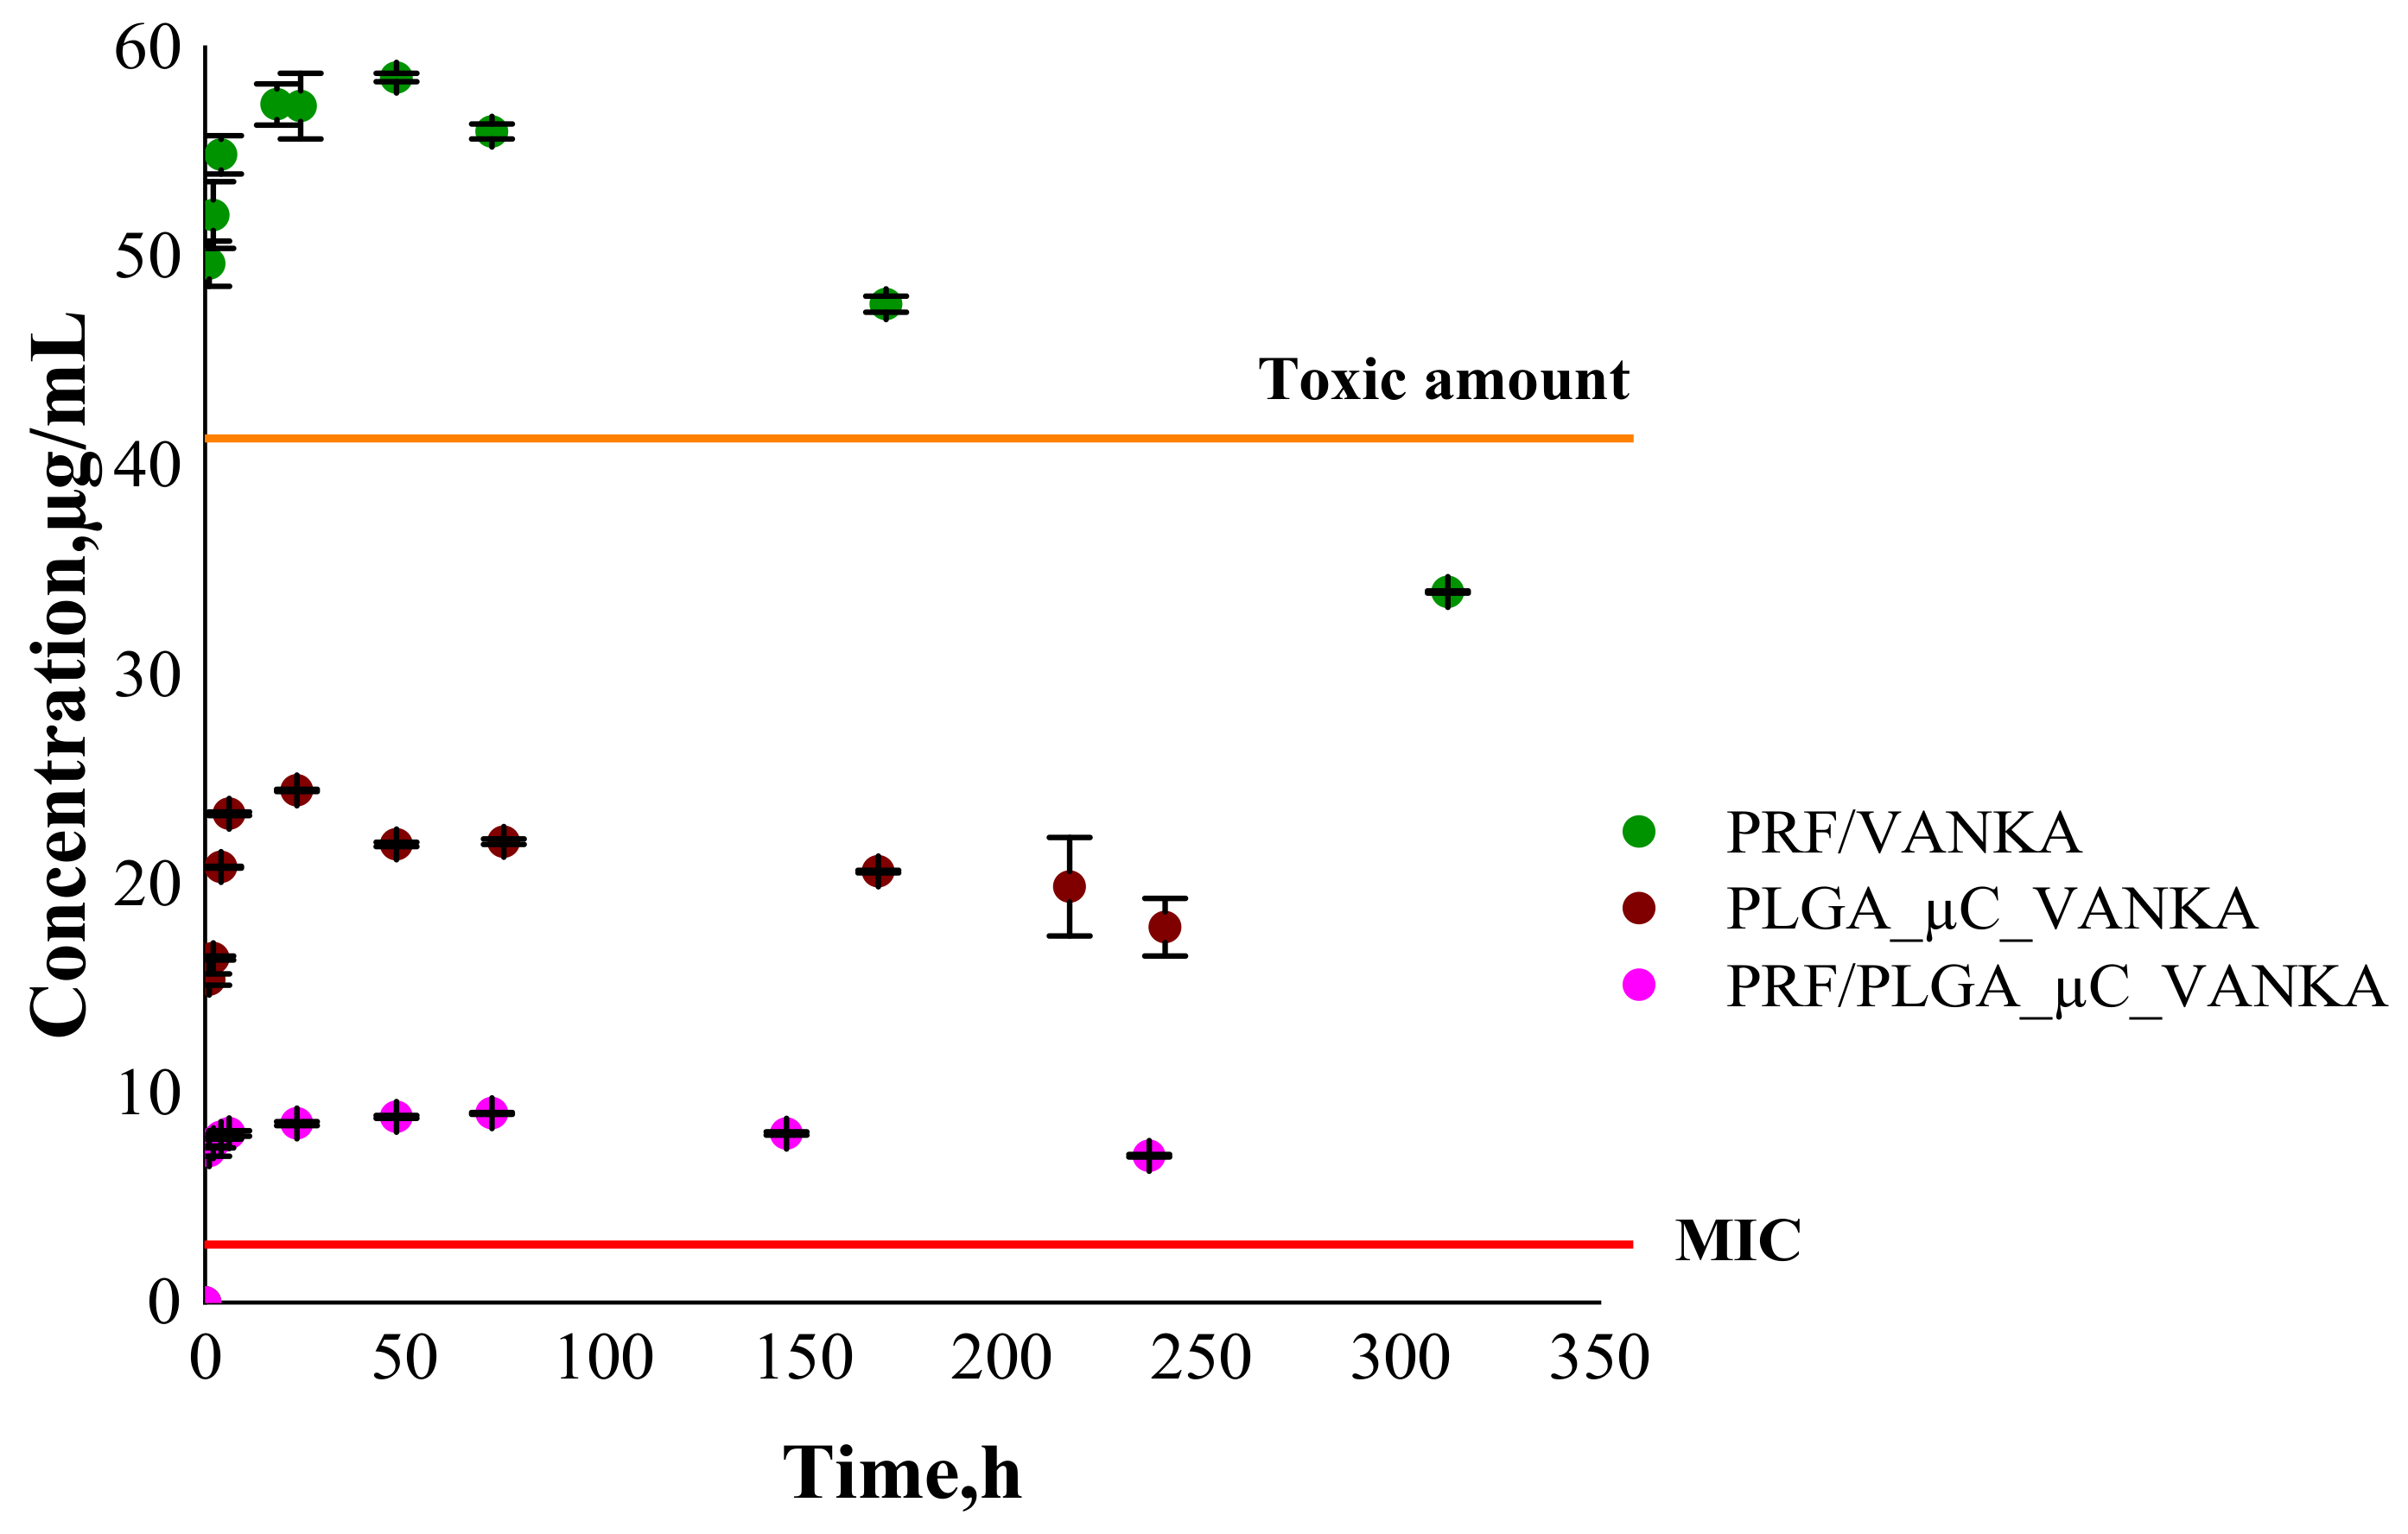
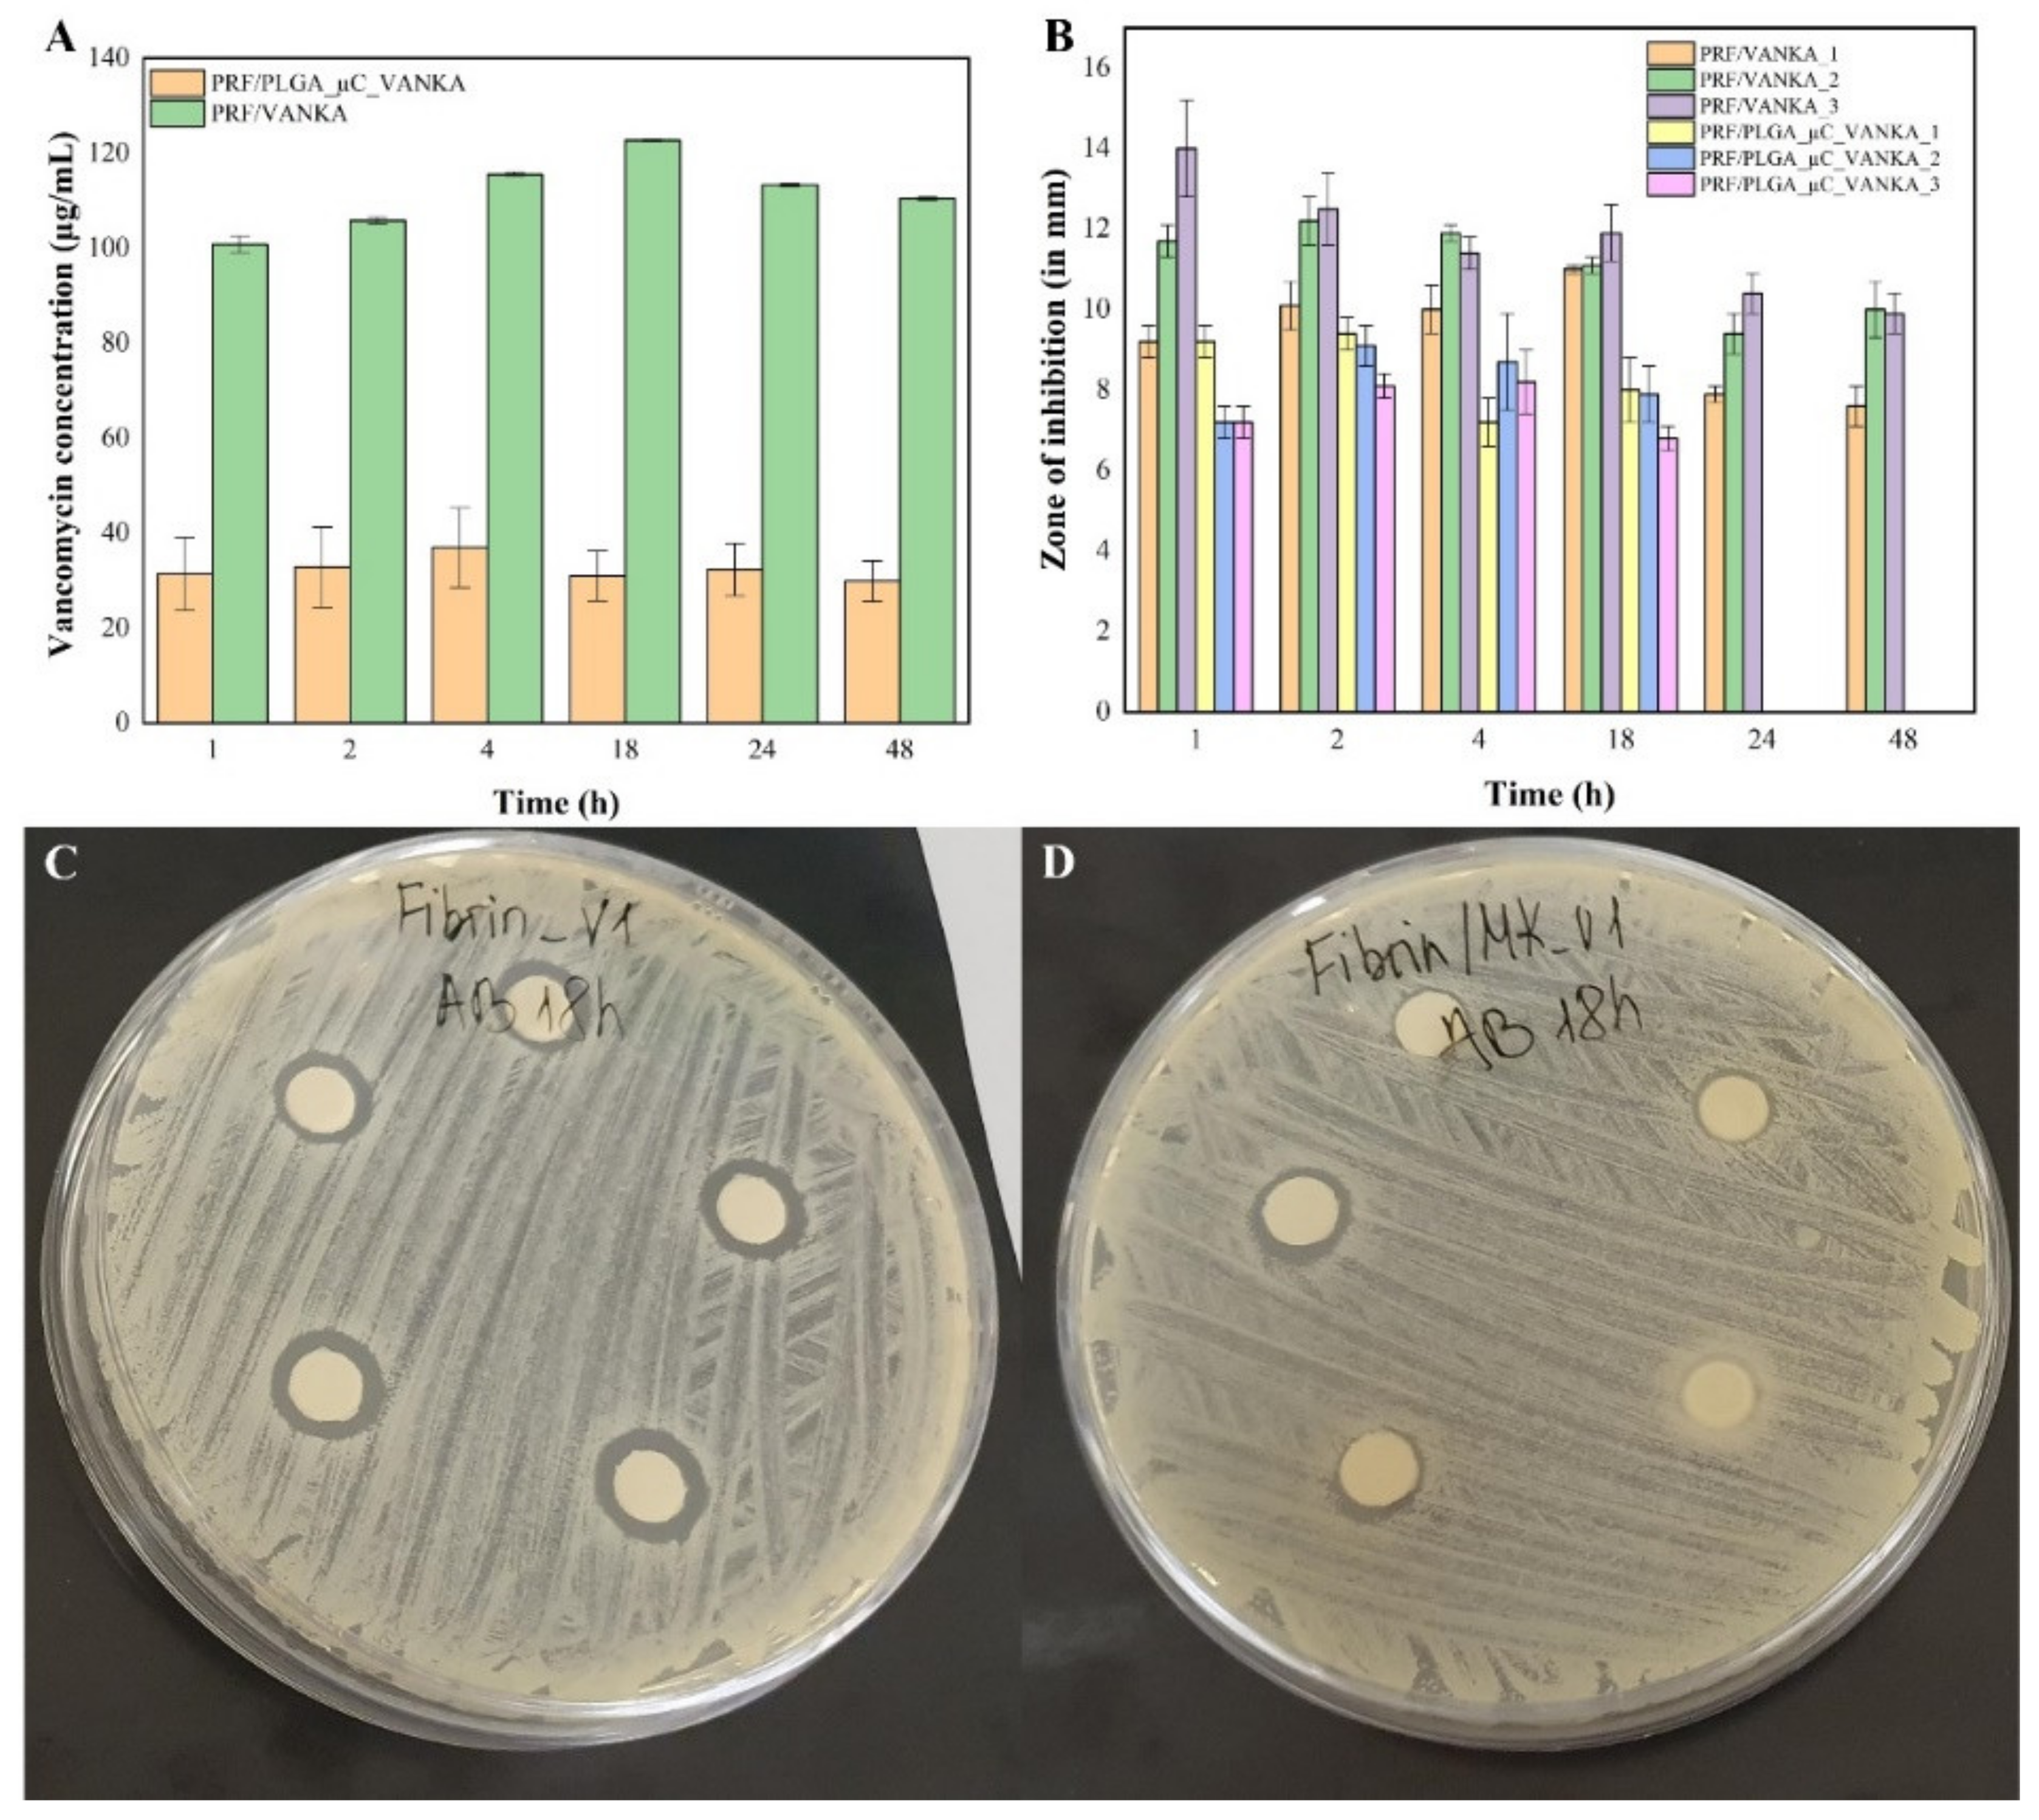
3.4. VANKA Release Kinetics
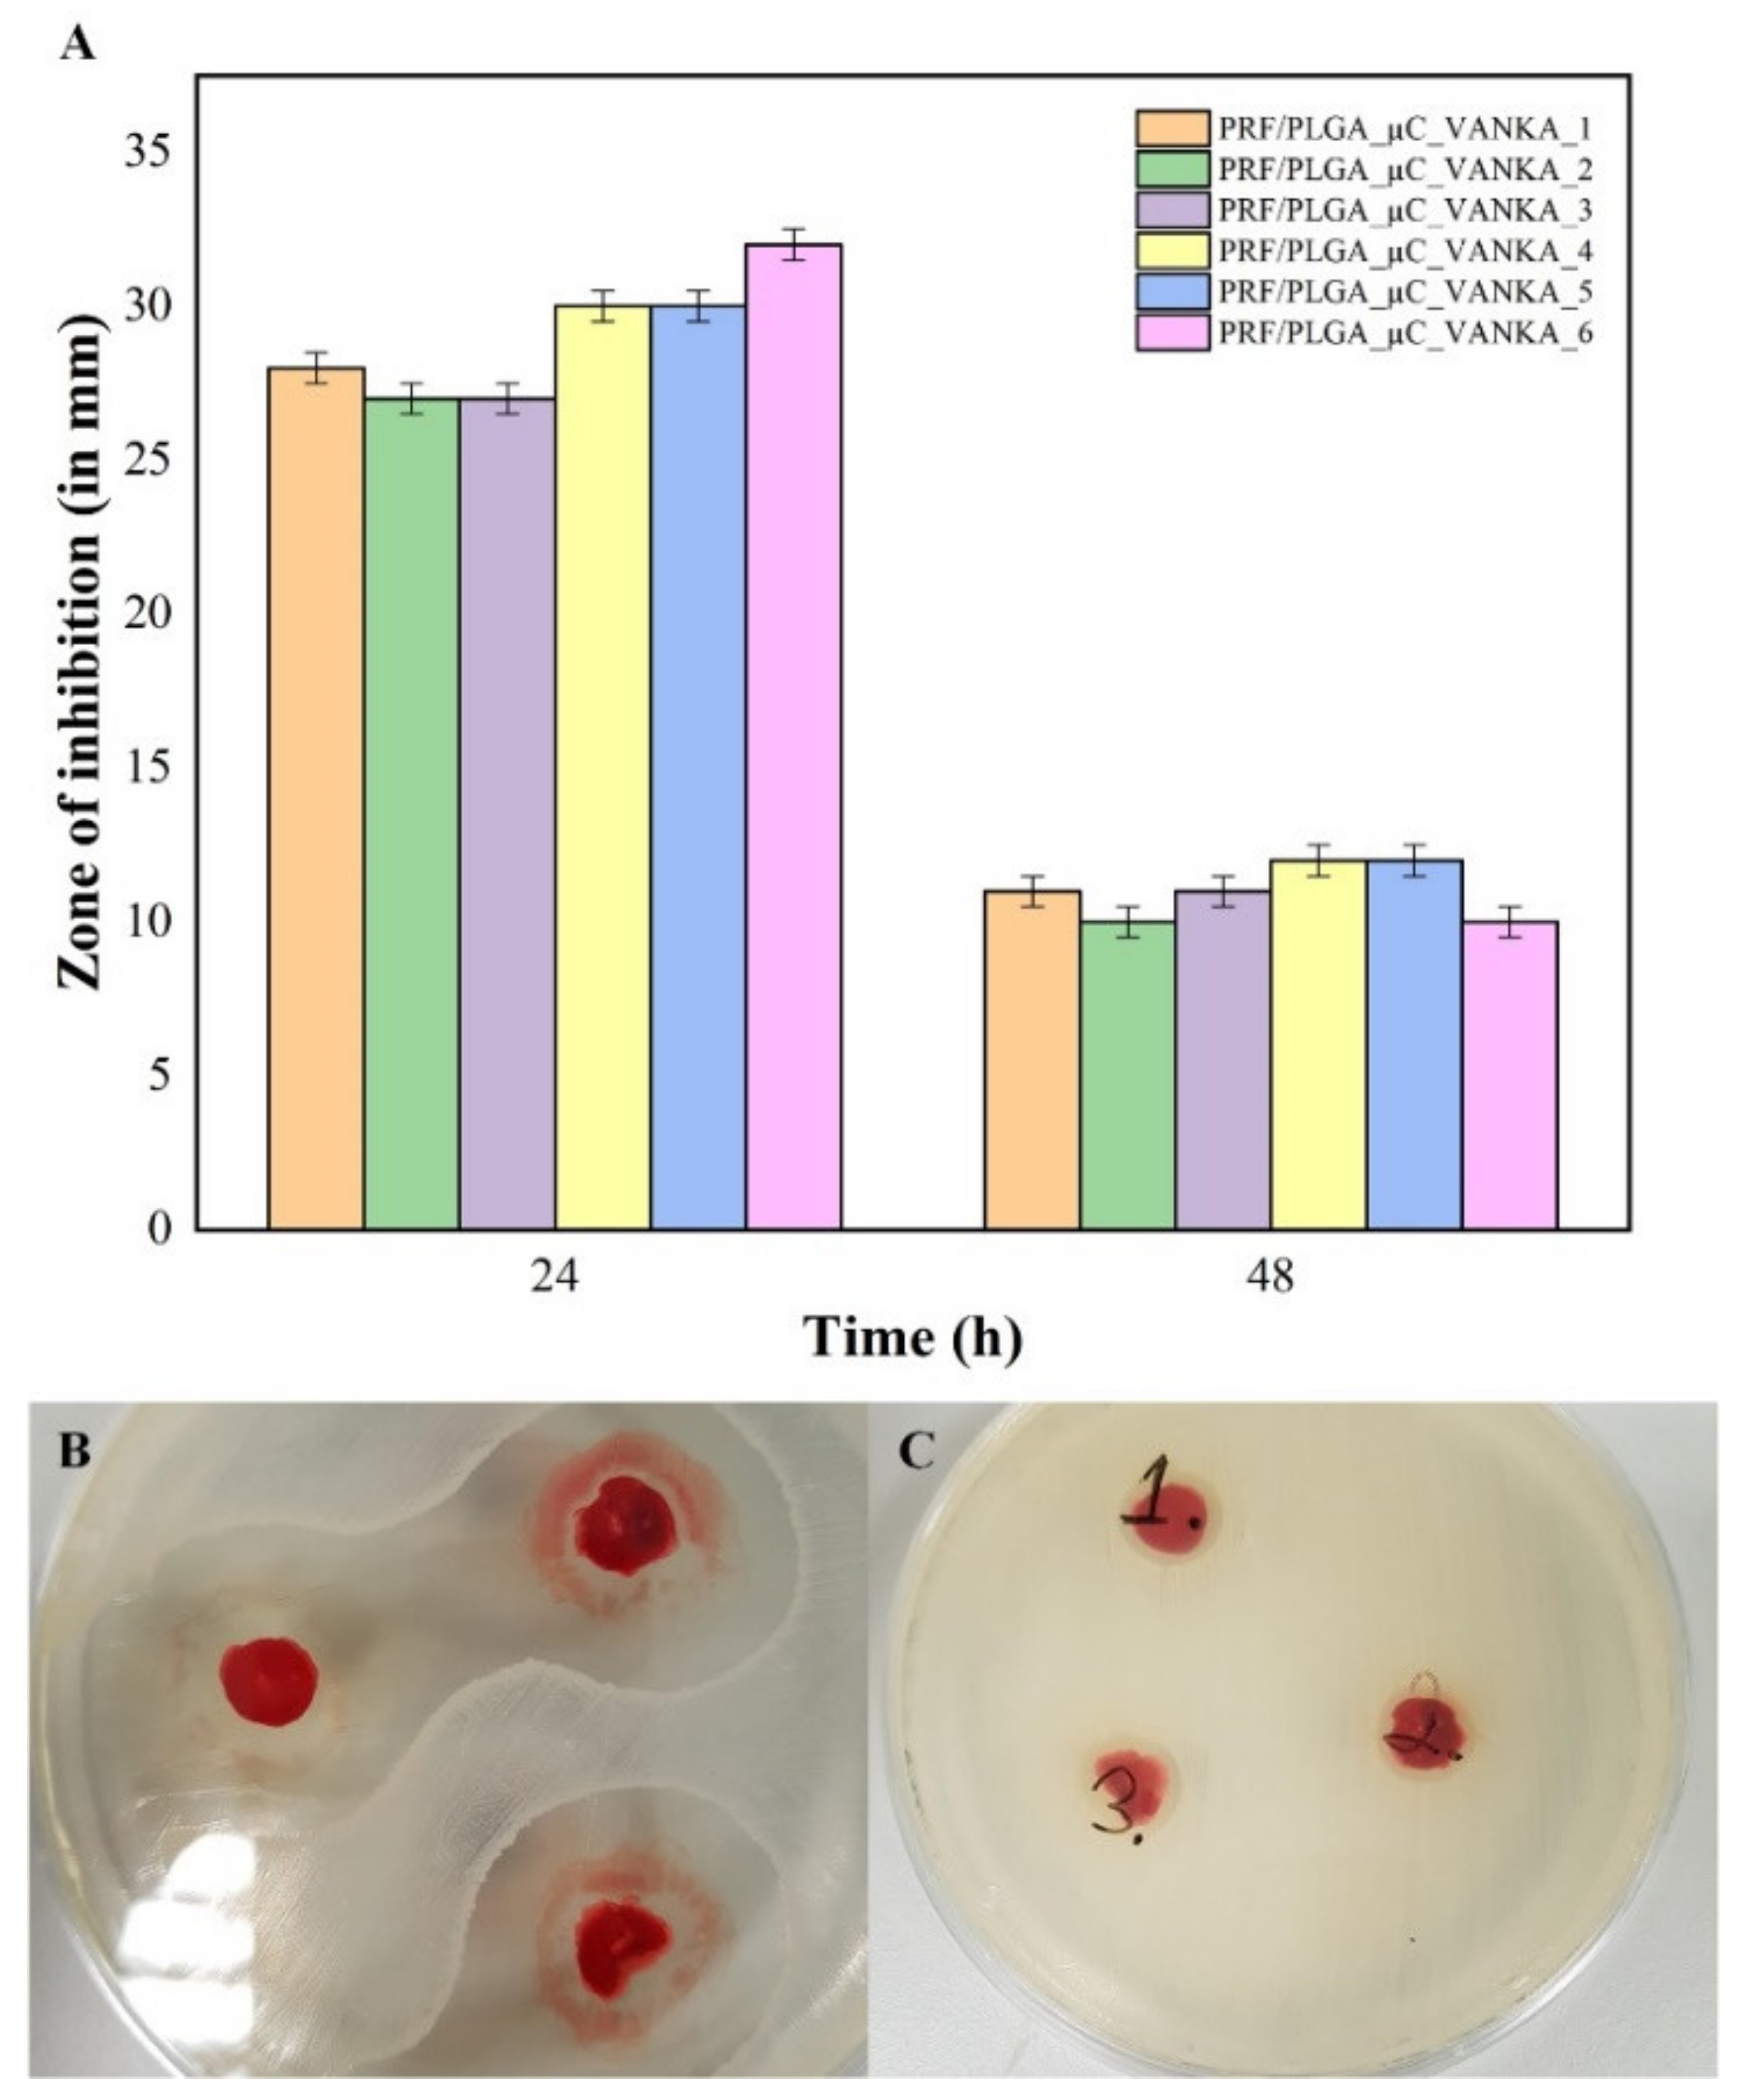
3.5. Antibacterial Properties of VANKA Containing PRF Scaffolds
3.6. Antibacterial Activity of Sample Incubation Medium
4. Conclusions
Author Contributions
Funding
Institutional Review Board Statement
Informed Consent Statement
Data Availability Statement
Acknowledgments
Conflicts of Interest
References
- Miron, R.J.; Zhang, Y. Autologous liquid platelet rich fibrin: A novel drug delivery system. Acta Biomater. 2018, 75, 35–51. [Google Scholar] [CrossRef]
- Anitua, E.; Nurden, P.; Prado, R.; Nurden, A.T.; Padilla, S. Autologous fibrin scaffolds: When platelet- and plasma-derived biomolecules meet fibrin. Biomaterials 2019, 192, 440–460. [Google Scholar] [CrossRef]
- Thorn, J.J.; Sørensen, H.; Weis-Fogh, U.; Andersen, M. Autologous fibrin glue with growth factors in reconstructive maxillofacial surgery. Int. J. Oral Maxillofac. Surg. 2004, 33, 95–100. [Google Scholar] [CrossRef] [PubMed]
- Choukroun, J.; Ghanaati, S. Reduction of relative centrifugation force within injectable platelet-rich-fibrin (PRF) concentrates advances patients’ own inflammatory cells, platelets and growth factors: The first introduction to the low speed centrifugation concept. Eur. J. Trauma Emerg. Surg. 2018, 44, 87–95. [Google Scholar] [CrossRef]
- Bennardo, F.; Liborio, F.; Barone, S.; Antonelli, A.; Buffone, C.; Fortunato, L.; Giudice, A. Efficacy of platelet-rich fibrin compared with triamcinolone acetonide as injective therapy in the treatment of symptomatic oral lichen planus: A pilot study. Clin. Oral Investig. 2021, 25, 3747–3755. [Google Scholar] [CrossRef] [PubMed]
- Giudice, A.; Antonelli, A.; Muraca, D.; Fortunato, L. Usefulness of advanced-platelet rich fibrin (A-PRF) and injectable-platelet rich fibrin (i-PRF) in the management of a massive medication-related osteonecrosis of the jaw (MRONJ): A 5-years follow-up case report. Indian J. Dent. Res. 2020, 31, 813. [Google Scholar] [CrossRef]
- Shah, R.; Gowda, T.M.; Thomas, R.; Kumar, T.; Mehta, D.S. Biological activation of bone grafts using injectable platelet-rich fibrin. J. Prosthet. Dent. 2019, 121, 391–393. [Google Scholar] [CrossRef]
- Kemmochi, M.; Sasaki, S.; Takahashi, M.; Nishimura, T.; Aizawa, C.; Kikuchi, J. The use of platelet-rich fibrin with platelet-rich plasma support meniscal repair surgery. J. Orthop. 2018, 15, 711–720. [Google Scholar] [CrossRef] [PubMed]
- Kapse, S.; Surana, S.; Satish, M.; Hussain, S.E.; Vyas, S.; Thakur, D. Autologous platelet-rich fibrin: Can it secure a better healing? Oral Surg. Oral Med. Oral Pathol. Oral Radiol. 2019, 127, 8–18. [Google Scholar] [CrossRef]
- Brancaccio, Y.; Antonelli, A.; Barone, S.; Bennardo, F.; Fortunato, L.; Giudice, A. Evaluation of local hemostatic efficacy after dental extractions in patients taking antiplatelet drugs: A randomized clinical trial. Clin. Oral Investig. 2021, 25, 1159–1167. [Google Scholar] [CrossRef]
- Safari, J.; Zarnegar, Z. Advanced drug delivery systems: Nanotechnology of health design A review. J. Saudi Chem. Soc. 2014, 18, 85–99. [Google Scholar] [CrossRef]
- Li, J.; Wang, X.; Zhang, T.; Wang, C.; Huang, Z. A review on phospholipids and their main applications in drug delivery systems. Asian J. Pharm. Sci. 2015, 10, 81–98. [Google Scholar] [CrossRef]
- Yang, Z.; Liu, J.; Gao, J.; Chen, S.; Huang, G. Chitosan coated vancomycin hydrochloride liposomes: Characterizations and evaluation. Int. J. Pharm. 2015, 495, 508–515. [Google Scholar] [CrossRef] [PubMed]
- Pumerantz, A.; Muppidi, K.; Agnihotri, S.; Guerra, C.; Venketaraman, V.; Wang, J.; Betageri, G. Preparation of liposomal vancomycin and intracellular killing of meticillin-resistant Staphylococcus aureus (MRSA). Int. J. Antimicrob. Agents 2011, 37, 140–144. [Google Scholar] [CrossRef] [PubMed]
- Liu, J.; Wang, Z.; Li, F.; Gao, J.; Wang, L.; Huang, G. Liposomes for systematic delivery of vancomycin hydrochloride to decrease nephrotoxicity: Characterization and evaluation. Asian J. Pharm. Sci. 2015, 10, 212–222. [Google Scholar] [CrossRef]
- Rybak, M.J. The Pharmacokinetic and Pharmacodynamic Properties of Vancomycin. Clin. Infect. Dis. 2006, 42, S35–S39. [Google Scholar] [CrossRef]
- Lodise, T.P.; Graves, J.; Evans, A.; Graffunder, E.; Helmecke, M.; Lomaestro, B.M.; Stellrecht, K. Relationship between Vancomycin MIC and Failure among Patients with Methicillin-Resistant Staphylococcus aureus Bacteremia Treated with Vancomycin. Antimicrob. Agents Chemother. 2008, 52, 3315–3320. [Google Scholar] [CrossRef]
- Kshetry, A.O.; Pant, N.D.; Bhandari, R.; Khatri, S.; Shrestha, K.L. Minimum inhibitory concentration of vancomycin to methicillin resistant Staphylococcus aureus isolated from different clinical samples at a tertiary care hospital in Nepal. Antimicrob. Resist. Infect. Control. 2016, 4–9. [Google Scholar] [CrossRef]
- Adani, S.; Bhowmick, T.; Weinstein, M.P.; Narayanan, N. Impact of Vancomycin MIC on Clinical Outcomes of Patients with Methicillin-Resistant Staphylococcus aureus Bacteremia Treated with Vancomycin at an Institution with Suppressed MIC Reporting. Antimicrob. Agents Chemother. 2018, 62, 1–6. [Google Scholar] [CrossRef]
- Suchy, T.; Supova, M.; Klapkova, E.; Horny, L.; Ryglova, S.; Zaloudkova, M.; Braun, M.; Sucharda, Z.; Ballay, R.; Vesely, J.; et al. The Sustainable Release of Vancomycin and Its Degradation Products from Nanostructured Collagen / Hydroxyapatite Composite Layers. J. Pharm. Sci. 2016, 105, 1288–1294. [Google Scholar] [CrossRef]
- Melichercik, P.; Klapkova, E.; Landor, I.; Judl, T.; Sibek, M.; Jahoda, D. The effect of Vancomycin degradation products in the topical treatment of osteomyelitis. Bratisl. Med. J. 2014, 115, 796–799. [Google Scholar] [CrossRef]
- Backes, D.W.; Aboleneen, H.I.; Simpson, J.A. Quantitation of vancomycin and its crystalline degradation product (CDP-1) in human serum by high performance liquid chromatography. J. Pharm. Biomed. Anal. 1998, 16, 1281–1287. [Google Scholar] [CrossRef]
- Thassu, D.; Deleers, M.; Pathak, Y. Nanoparticulate drug delivery systems. Chem. Biodivers. 2007, 166, 1829–1841. [Google Scholar] [CrossRef]
- Kavrakovski, Z.; Popovska, O.; Simonovska, J.; Kavrakovski, Z.; Rafajlovska, V. An Overview: Methods for Preparation and Characterization of Liposomes as Drug Delivery Systems. Int. J. Pharm. Phytopharm. Res. 2013, 3, 13–20. [Google Scholar]
- Singh, R.P.; Gangadharappa, H.V.; Mruthunjaya, K. Phospholipids: Unique carriers for drug delivery systems. J. Drug Deliv. Sci. Technol. 2017, 39, 166–179. [Google Scholar] [CrossRef]
- Kohli, A.G.; Kierstead, P.H.; Venditto, V.J.; Walsh, C.L.; Szoka, F.C. Designer lipids for drug delivery: From heads to tails. J. Control. Release 2014, 190, 274–287. [Google Scholar] [CrossRef] [PubMed]
- Pei, Y.; Mohamed, M.F.; Seleem, M.N.; Yeo, Y. Particle engineering for intracellular delivery of vancomycin to methicillin-resistant Staphylococcus aureus (MRSA)-infected macrophages. J. Control. Release 2017, 267, 133–143. [Google Scholar] [CrossRef] [PubMed]
- Gonzalez Gomez, A.; Syed, S.; Marshall, K.; Hosseinidoust, Z. Liposomal nanovesicles for efficient encapsulation of staphylococcal antibiotics. Am. Chem. Soc. Omega 2019, 4, 10866–10876. [Google Scholar] [CrossRef]
- Hirenkumar, M.; Steven, S. Poly Lactic-co-Glycolic Acid (PLGA) as Biodegradable Controlled Drug Delivery Carrier. Polymers 2012, 3, 1–19. [Google Scholar] [CrossRef]
- Wang, S.S.; Yang, M.C.; Chung, T.W. Liposomes/chitosan scaffold/human fibrin gel composite systems for delivering hydrophilic drugs—Release behaviors of Tirofiban In Vitro. Drug Deliv. 2008, 15, 149–157. [Google Scholar] [CrossRef]
- Faizullin, D.; Valiullina, Y.; Salnikov, V.; Zuev, Y. Direct interaction of fibrinogen with lipid microparticles modulates clotting kinetics and clot structure. Nanomed. Nanotechnol. Biol. Med. 2020, 23, 102098. [Google Scholar] [CrossRef] [PubMed]
- Mu, Z.; Chen, K.; Yuan, S.; Li, Y.; Huang, Y.; Wang, C.; Zhang, Y.; Liu, W.; Luo, W.; Liang, P.; et al. Gelatin Nanoparticle-Injectable Platelet-Rich Fibrin Double Network Hydrogels with Local Adaptability and Bioactivity for Enhanced Osteogenesis. Adv. Healthc. Mater. 2020, 9, 1–16. [Google Scholar] [CrossRef] [PubMed]
- Le Nihouannen, D.; Le Guehennec, L.; Rouillon, T.; Pilet, P.; Bilban, M.; Layrolle, P.; Daculsi, G. Micro-architecture of calcium phosphate granules and fibrin glue composites for bone tissue engineering. Biomaterials 2006, 27, 2716–2722. [Google Scholar] [CrossRef] [PubMed]
- Al-Maawi, S.; Herrera-Vizcaíno, C.; Orlowska, A.; Willershausen, I.; Sader, R.; Miron, R.J.; Choukroun, J.; Ghanaati, S. Biologization of collagen-based biomaterials using liquid-platelet-rich fibrin: New insights into clinically applicable tissue engineering. Materials 2019, 12, 3993. [Google Scholar] [CrossRef]
- Juliana, J.M.; Zanette, I.; Noël, P.B.; Cardoso, M.B.; Kimm, M.A.; Pfeiffer, F. Three-dimensional non-destructive soft-tissue visualization with X-ray staining micro-tomography. Sci. Rep. 2015, 5, 1–7. [Google Scholar] [CrossRef]
- Heimel, P.; Swiadek, N.V.; Slezak, P.; Kerbl, M.; Schneider, C.; Nürnberger, S.; Redl, H.; Teuschl, A.H.; Hercher, D. Iodine-Enhanced Micro-CT Imaging of Soft Tissue on the Example of Peripheral Nerve Regeneration. Contrast Media Mol. Imaging 2019, 2019. [Google Scholar] [CrossRef]
- Hu, X.; Tam, K.Y. Association of vancomycin with lipid vesicles. ADMET DMPK 2017, 5, 182–191. [Google Scholar] [CrossRef]
- Jia, Z.; O’Mara, M.L.; Zuegg, J.; Cooper, M.A.; Mark, A.E. The effect of environment on the recognition and binding of vancomycin to native and resistant forms of lipid II. Biophys. J. 2011, 101, 2684–2692. [Google Scholar] [CrossRef]
- Özalp, Y.; Özdemir, N.; Kocagöz, S.; Hasirci, V. Controlled release of vancomycin from biodegradable microcapsules. J. Microencapsul. 2001, 18, 89–110. [Google Scholar] [CrossRef]
- Uchida, T.; Nagareya, N.; Sakakibara, S.; Konishi, Y.; Nakai, A.; Nishikata, M.; Matsuyama, K.; Yoshida, K. Preparation and characterization of polylactic acid microspheres containing bovine insulin by a w/o/w emulsion solvent evaporation method. Chem. Pharm. Bull. 1997, 45, 1539–1543. [Google Scholar] [CrossRef][Green Version]
- Barichello, J.M.; Morishita, M.; Nagai, T. Encapsulation of Hydrophilic and Lipophilic Drugs in PLGA Nanoparticles by the Nanoprecipitation Method. Drug Dev. Ind. Pharm. 1999, 25, 471–476. [Google Scholar] [CrossRef]
- Litvinov, R.I.; Faizullin, D.A.; Zuev, Y.F.; Weisel, J.W. The α-Helix to β-Sheet Transition in Stretched and Compressed Hydrated Fibrin Clots. Biophys. J. 2012, 103, 1020–1027. [Google Scholar] [CrossRef] [PubMed]
- Erbetta, C.D.C.; Alves, R.J.; Resende, J.M.; Freitas, R.F.S.; Sousa, R.G. Synthesis and Characterization of Poly (D,L-lactide-co-glycolide) Copolymer. J. Biomater. Nanobiotechnol. 2012, 3, 208–225. [Google Scholar] [CrossRef]
- Silva, A.; Cardoso, B.; Silva, M.; Freitas, R.; Sousa, R. Synthesis, Characterization, and Study of PLGA Copolymer In Vitro Degradation. J. Biomater. Nanobiotechnol. 2015, 6, 8–19. [Google Scholar] [CrossRef]
- Singh, R.; Kesharwani, P.; Mehra, N.K.; Singh, S.; Banerjee, S.; Jain, N.K. Development and characterization of folate anchored Saquinavir entrapped PLGA nanoparticles for anti-tumor activity. Drug Dev. Ind. Pharm. 2015, 41, 1888–1901. [Google Scholar] [CrossRef] [PubMed]
- Ain, Q.; Munir, H.; Jelani, F.; Anjum, F.; Bilal, M. Antibacterial potential of biomaterial derived nanoparticles for drug delivery application. Mater. Res. Express 2019, 6. [Google Scholar] [CrossRef]
- Hincha, D.K. Effects of calcium-induced aggregation on the physical stability of liposomes containing plant glycolipids. Biochim. Biophys. Acta Biomembr. 2003, 1611, 180–186. [Google Scholar] [CrossRef]
- Melcrová, A.; Pokorna, S.; Pullanchery, S.; Kohagen, M.; Jurkiewicz, P.; Hof, M.; Jungwirth, P.; Cremer, P.S.; Cwiklik, L. The complex nature of calcium cation interactions with phospholipid bilayers. Sci.Rep. 2016, 6, 1–12. [Google Scholar] [CrossRef]


| Abbreviation | Sample |
|---|---|
| Blank liposomes | Liposomes without VANKA |
| VANKA liposomes | Liposomes with encapsulated VANKA |
| PLGA_µC_Blank | PLGA microcapsules without VANKA |
| PLGA_µC_VANKA | VANKA loaded PLGA microcapsules |
| PRF | Platelet-rich fibrin |
| PRF/VANKA liposomes | PRF with VANKA loaded liposomes |
| PRF/VANKA | PRF with VANKA- added as free drug powder, non-encapsulated |
| PRF/PLGA_µC_Blank | PRF without VANKA loaded PLGA microcapsules |
| PRF/PLGA_µC_VANKA | PRF with VANKA loaded PLGA microcapsules |
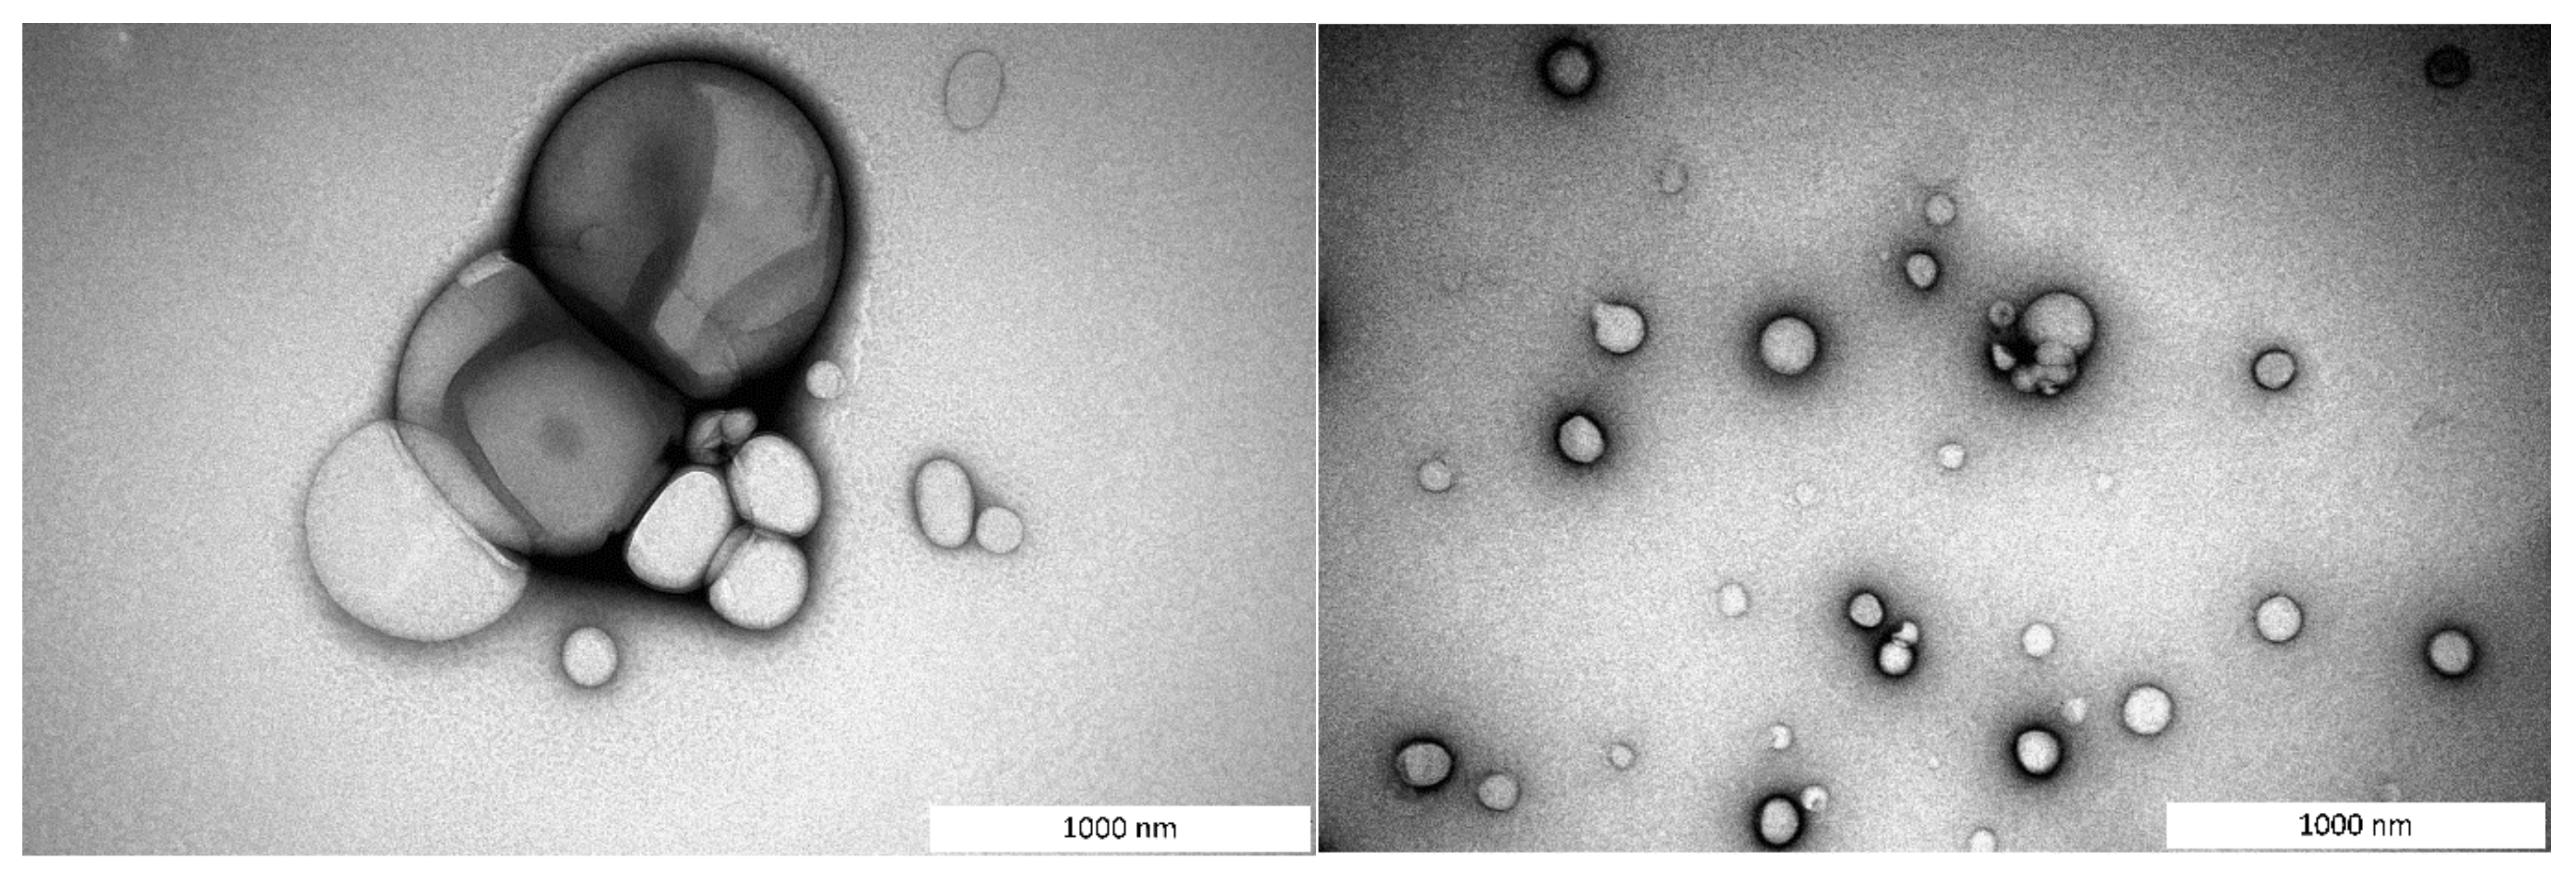
| Blank Liposomes | VANKA Liposomes | |
|---|---|---|
| Average effective diameter, nm | 1354.8 ± 100.6 | 932.7 ± 114.2 |
| Polydispersity index | 0.17 | 0.24 |
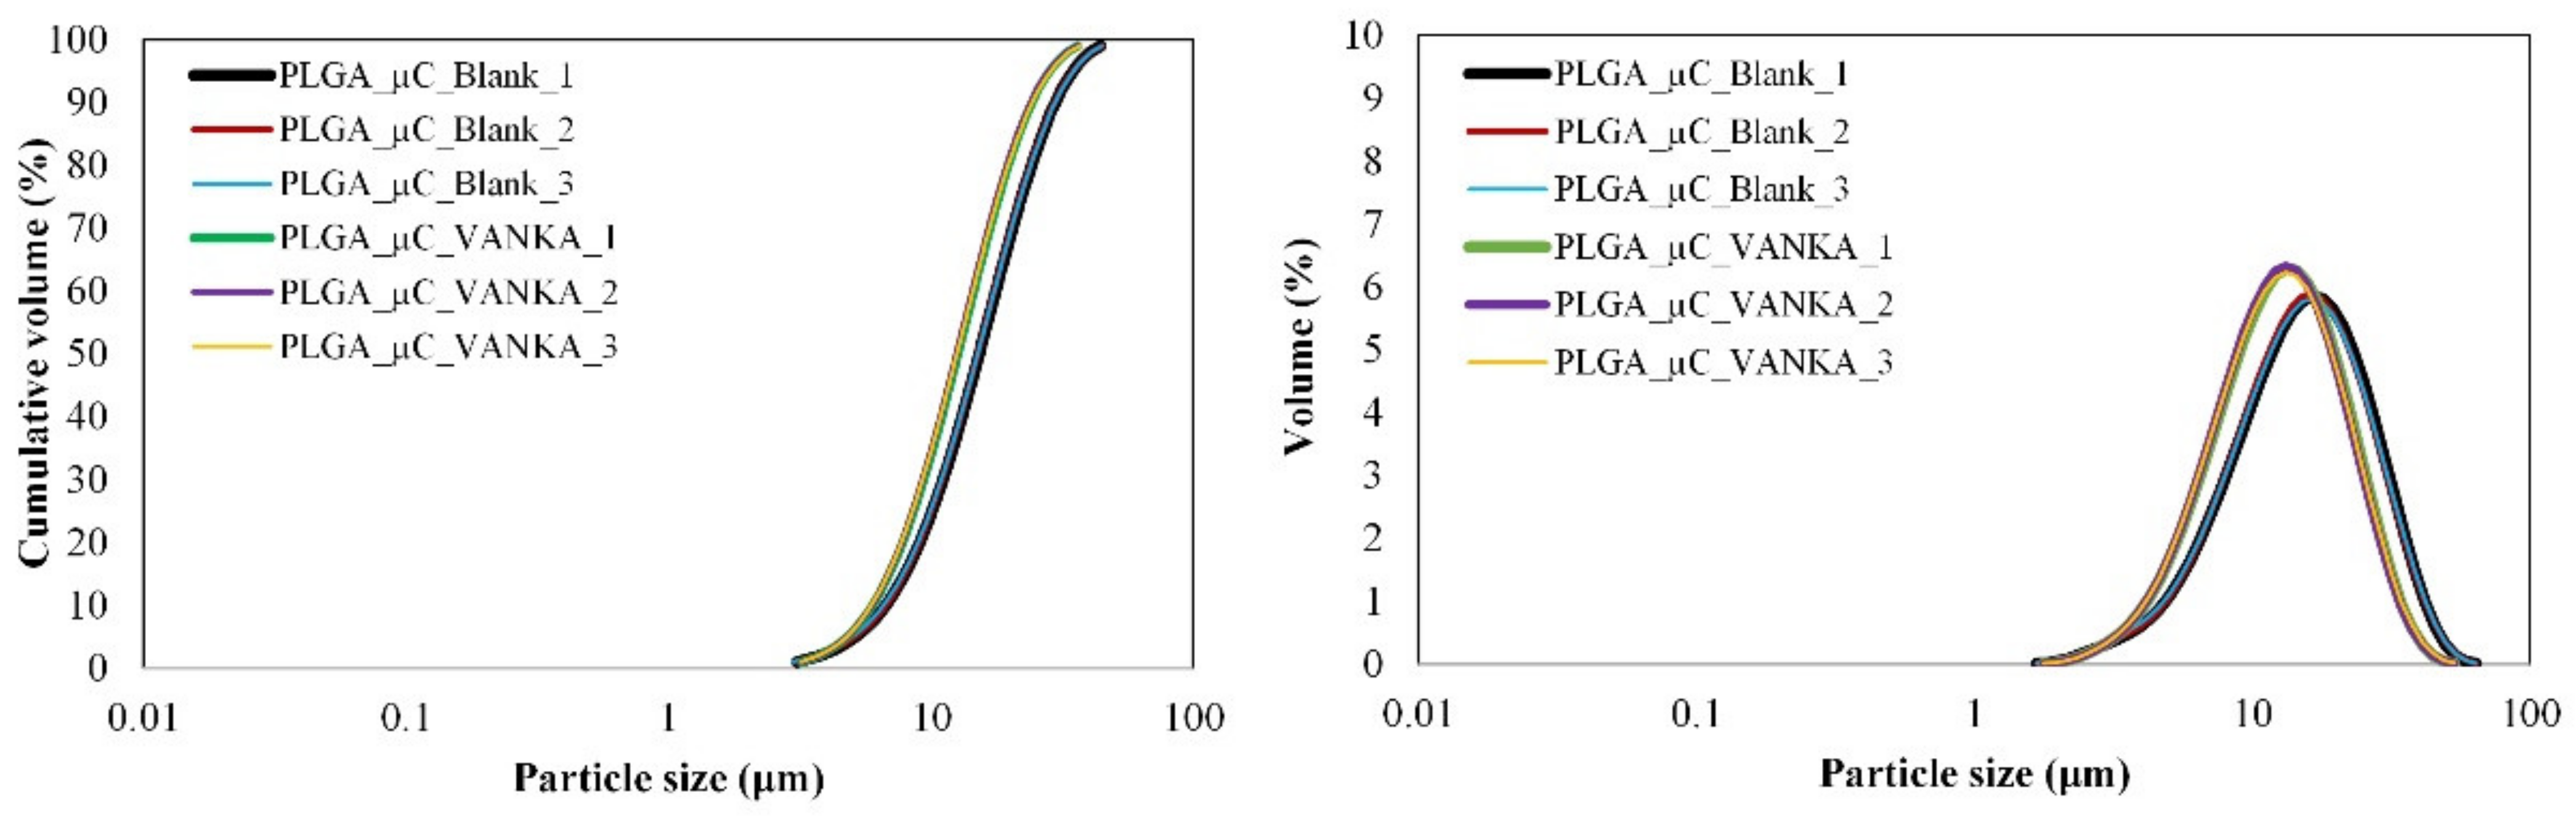
| Microcapsules | Particle Size ± SD, µm | ||
|---|---|---|---|
| d10 | d50 | d90 | |
| PLGA_µC_Blank | 6.69 ± 0.08 | 15.17 ± 0.11 | 29.51 ± 0.44 |
| PLGA_µC_VANKA | 5.96 ± 0.03 | 12.60 ± 0.09 | 24.26 ± 0.18 |
| . | VANKA Liposomes | PLGA_µC_VANKA |
|---|---|---|
| Drug load, % | 2.61 ± 0.01 | 1.77 ± 0.03 |
| Encapsulation efficiency, % | 56.44 ± 0.02 | 12.30 ± 0.05 |
Publisher’s Note: MDPI stays neutral with regard to jurisdictional claims in published maps and institutional affiliations. |
© 2021 by the authors. Licensee MDPI, Basel, Switzerland. This article is an open access article distributed under the terms and conditions of the Creative Commons Attribution (CC BY) license (https://creativecommons.org/licenses/by/4.0/).
Share and Cite
Dubnika, A.; Egle, K.; Skrinda-Melne, M.; Skadins, I.; Rajadas, J.; Salma, I. Development of Vancomycin Delivery Systems Based on Autologous 3D Platelet-Rich Fibrin Matrices for Bone Tissue Engineering. Biomedicines 2021, 9, 814. https://doi.org/10.3390/biomedicines9070814
Dubnika A, Egle K, Skrinda-Melne M, Skadins I, Rajadas J, Salma I. Development of Vancomycin Delivery Systems Based on Autologous 3D Platelet-Rich Fibrin Matrices for Bone Tissue Engineering. Biomedicines. 2021; 9(7):814. https://doi.org/10.3390/biomedicines9070814
Chicago/Turabian StyleDubnika, Arita, Karina Egle, Marite Skrinda-Melne, Ingus Skadins, Jayakumar Rajadas, and Ilze Salma. 2021. "Development of Vancomycin Delivery Systems Based on Autologous 3D Platelet-Rich Fibrin Matrices for Bone Tissue Engineering" Biomedicines 9, no. 7: 814. https://doi.org/10.3390/biomedicines9070814
APA StyleDubnika, A., Egle, K., Skrinda-Melne, M., Skadins, I., Rajadas, J., & Salma, I. (2021). Development of Vancomycin Delivery Systems Based on Autologous 3D Platelet-Rich Fibrin Matrices for Bone Tissue Engineering. Biomedicines, 9(7), 814. https://doi.org/10.3390/biomedicines9070814