
Analysis of Pembrolizumab in Human Plasma by LC-MS/HRMS. Method Validation and Comparison with Elisa

 , ,
, , 
Abstract
1. Introduction
2. Materials and Methods
2.1. LC-MS/HRMS
2.1.1. Chemicals and Reagents
2.1.2. LC-MS/HRMS Analysis
Liquid Chromatography Conditions
Mass Spectrometry Configuration
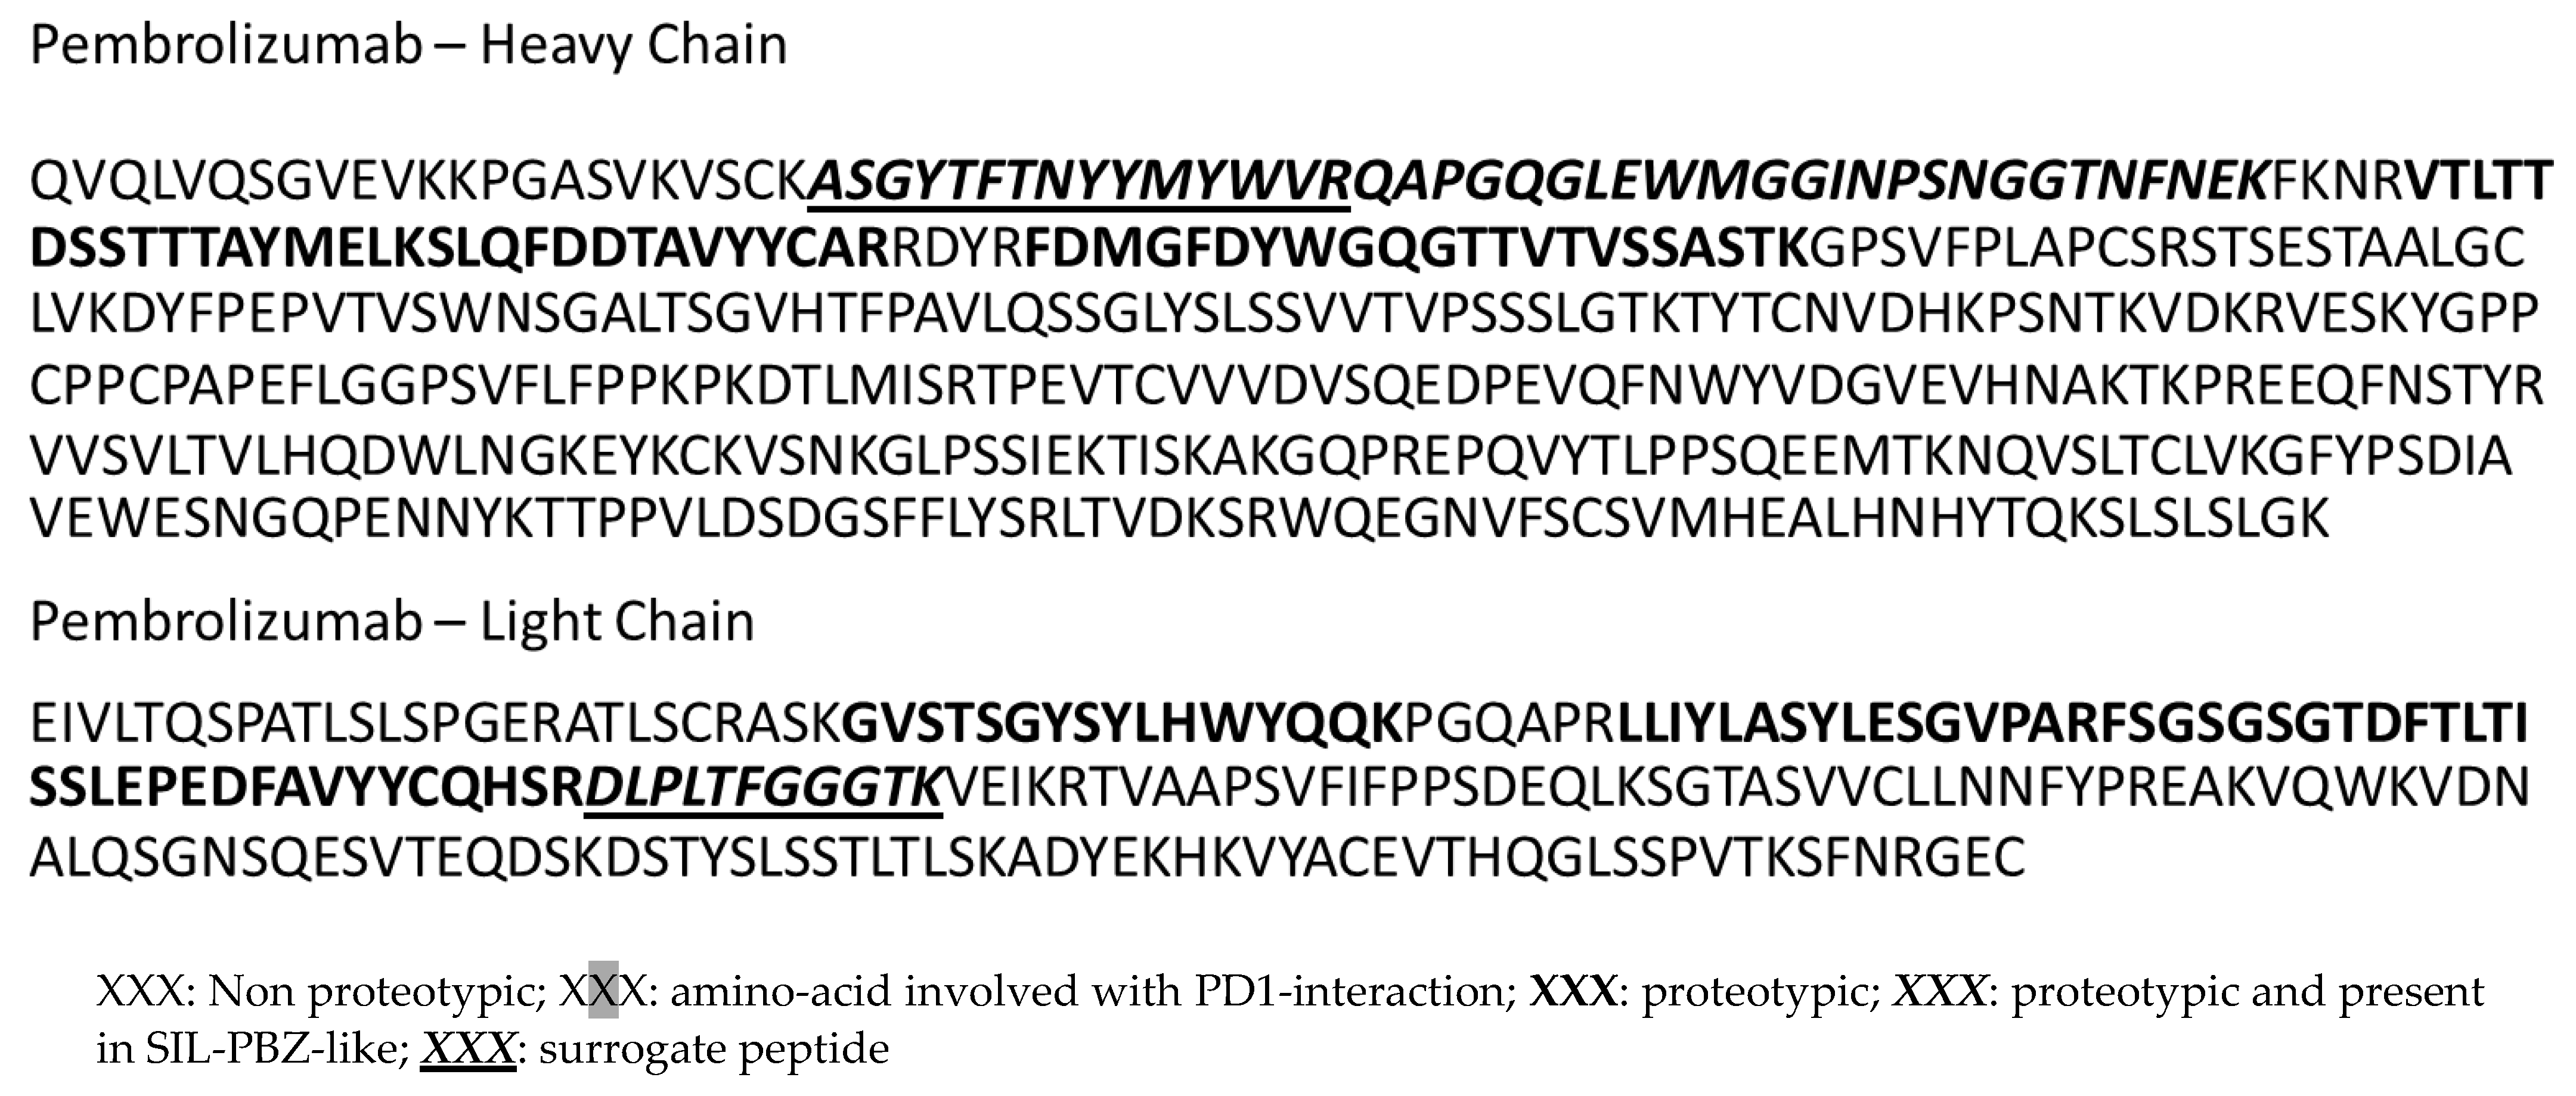
2.1.3. Selection of Peptides for Quantification
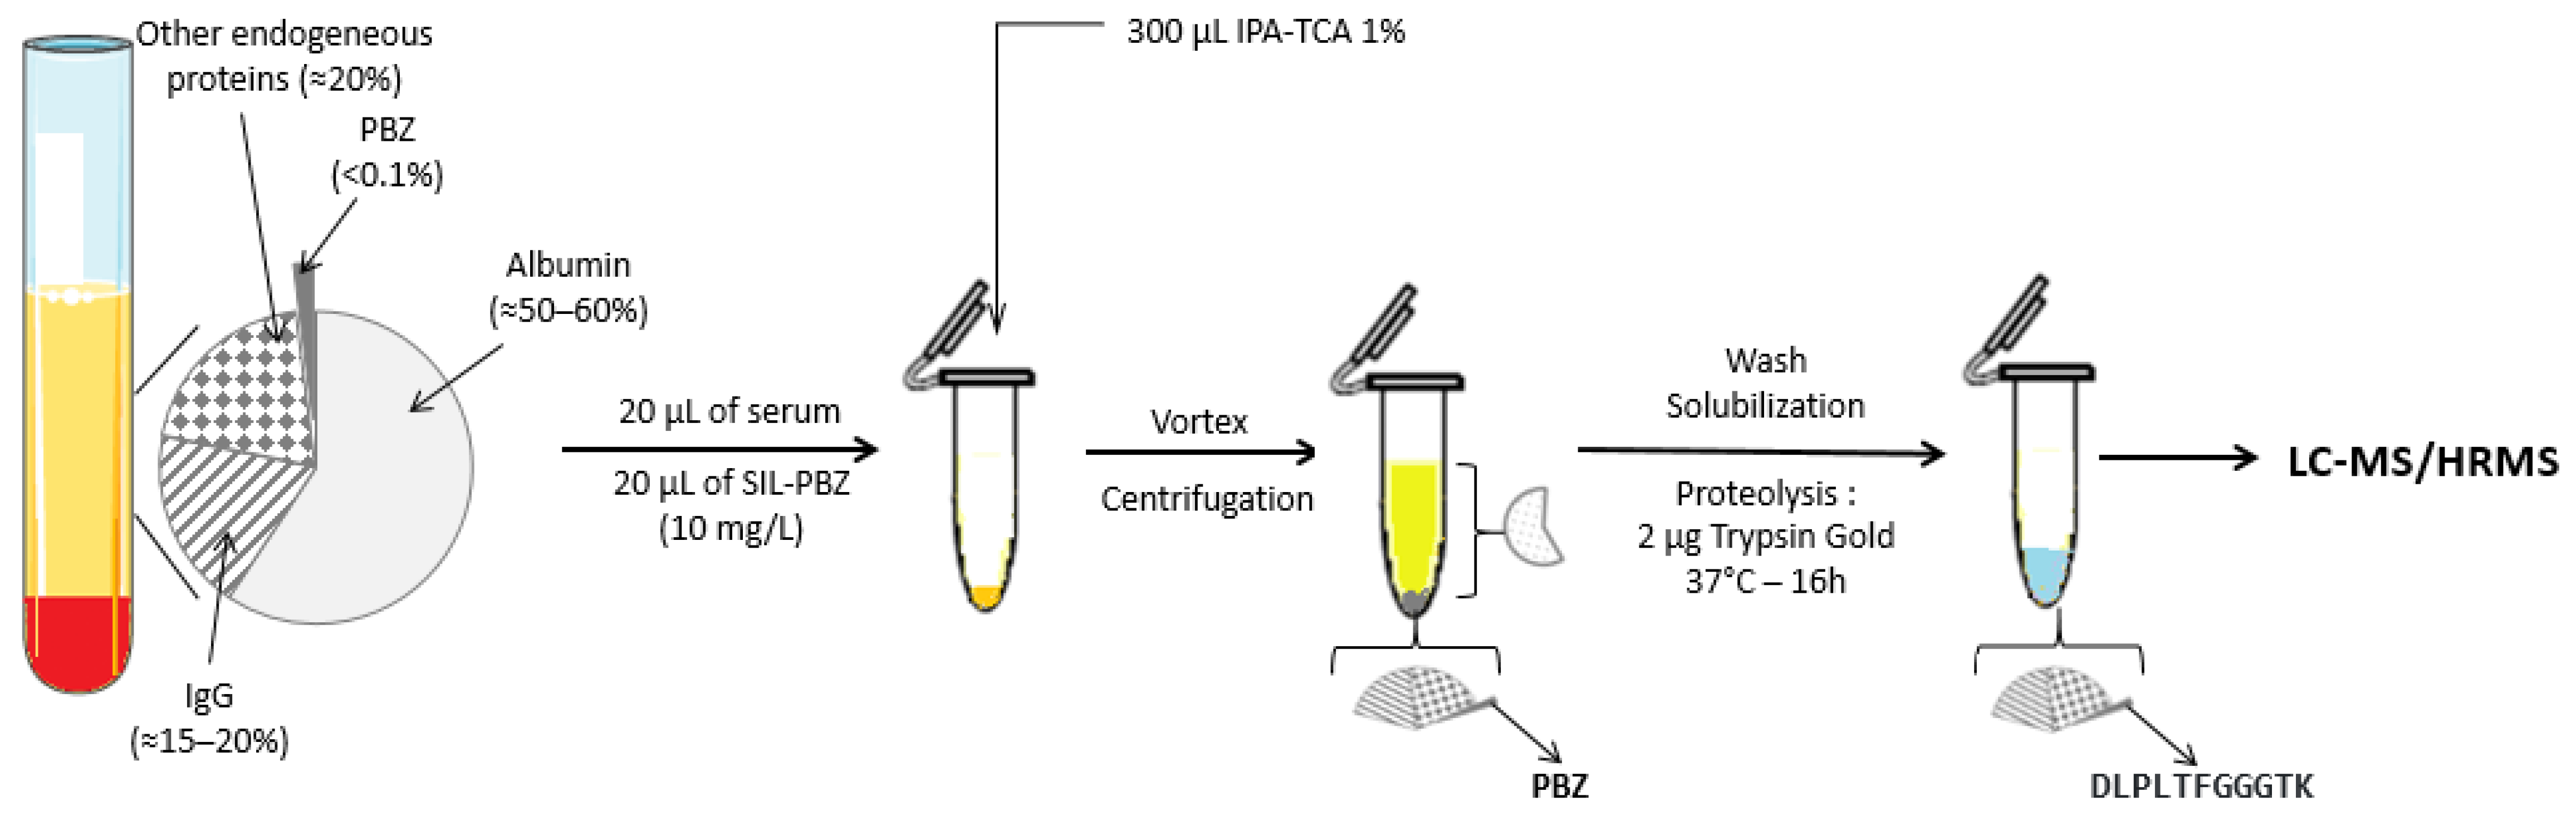
2.1.4. Sample Preparation
2.1.5. Method Validation
Selectivity
Linearity, Accuracy and Precision
Recovery and Matrix Effect
Stability
Carry-Over
2.2. ELISA
2.3. Application
3. Results
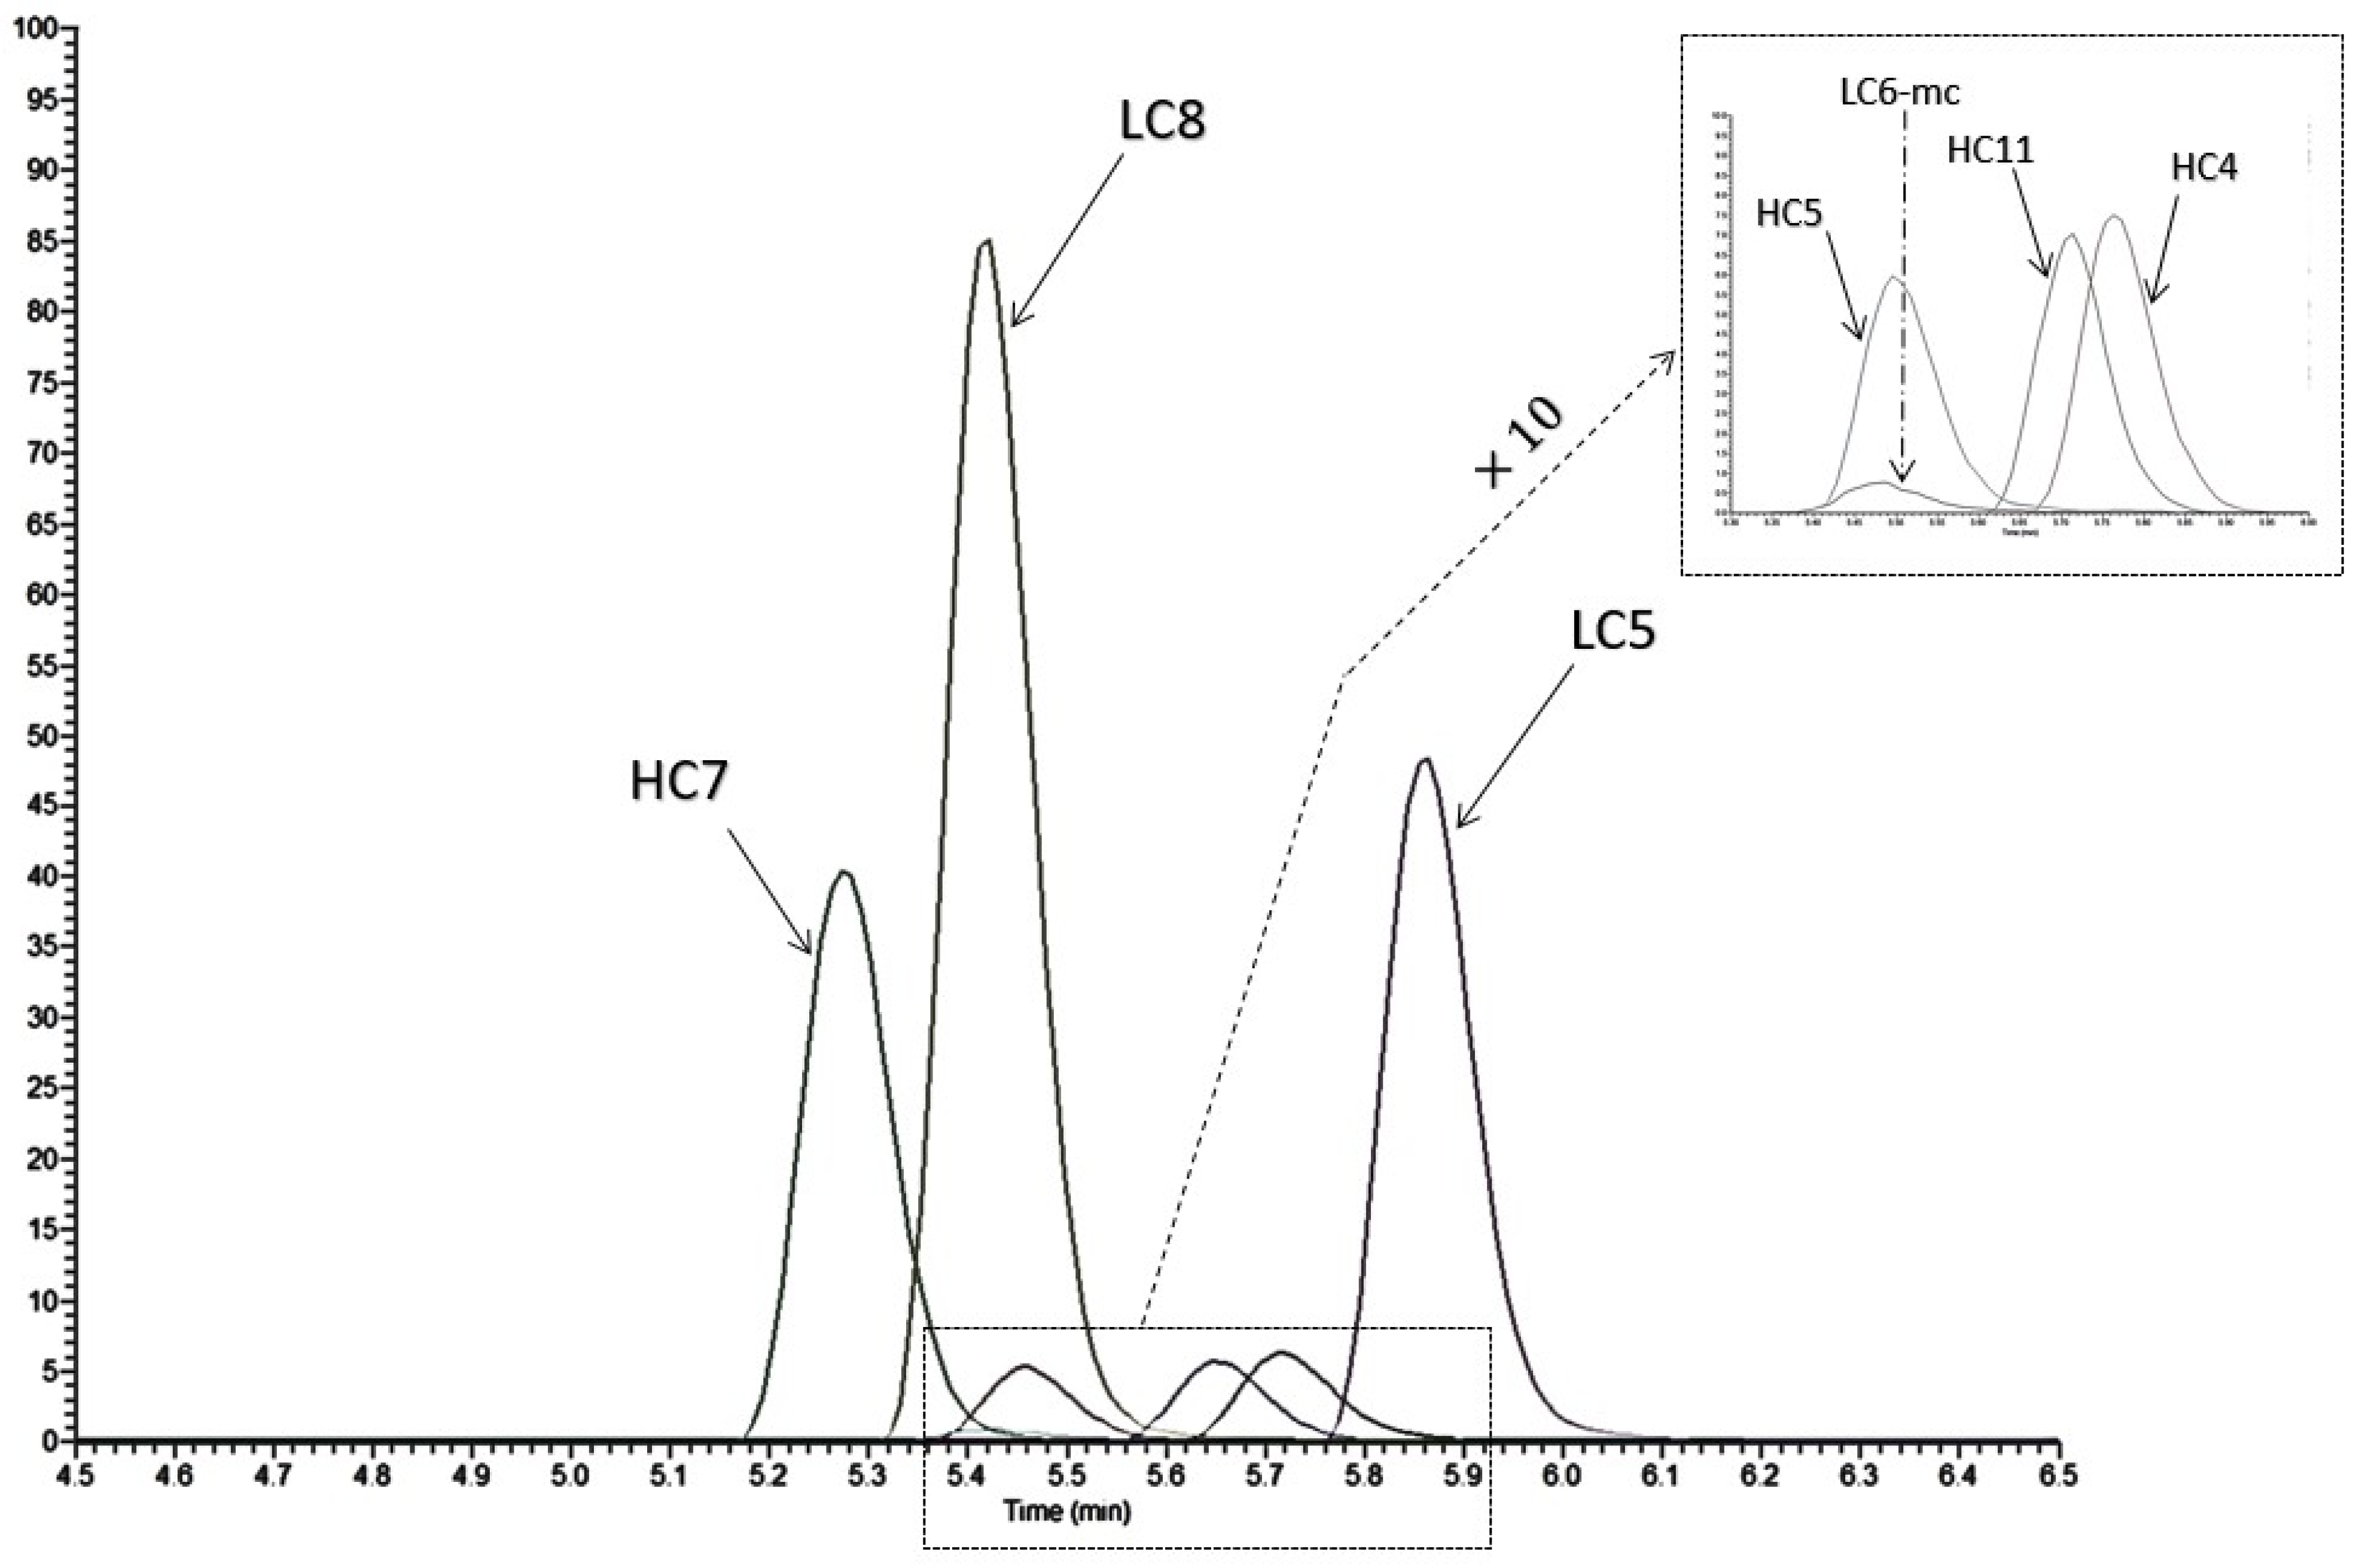
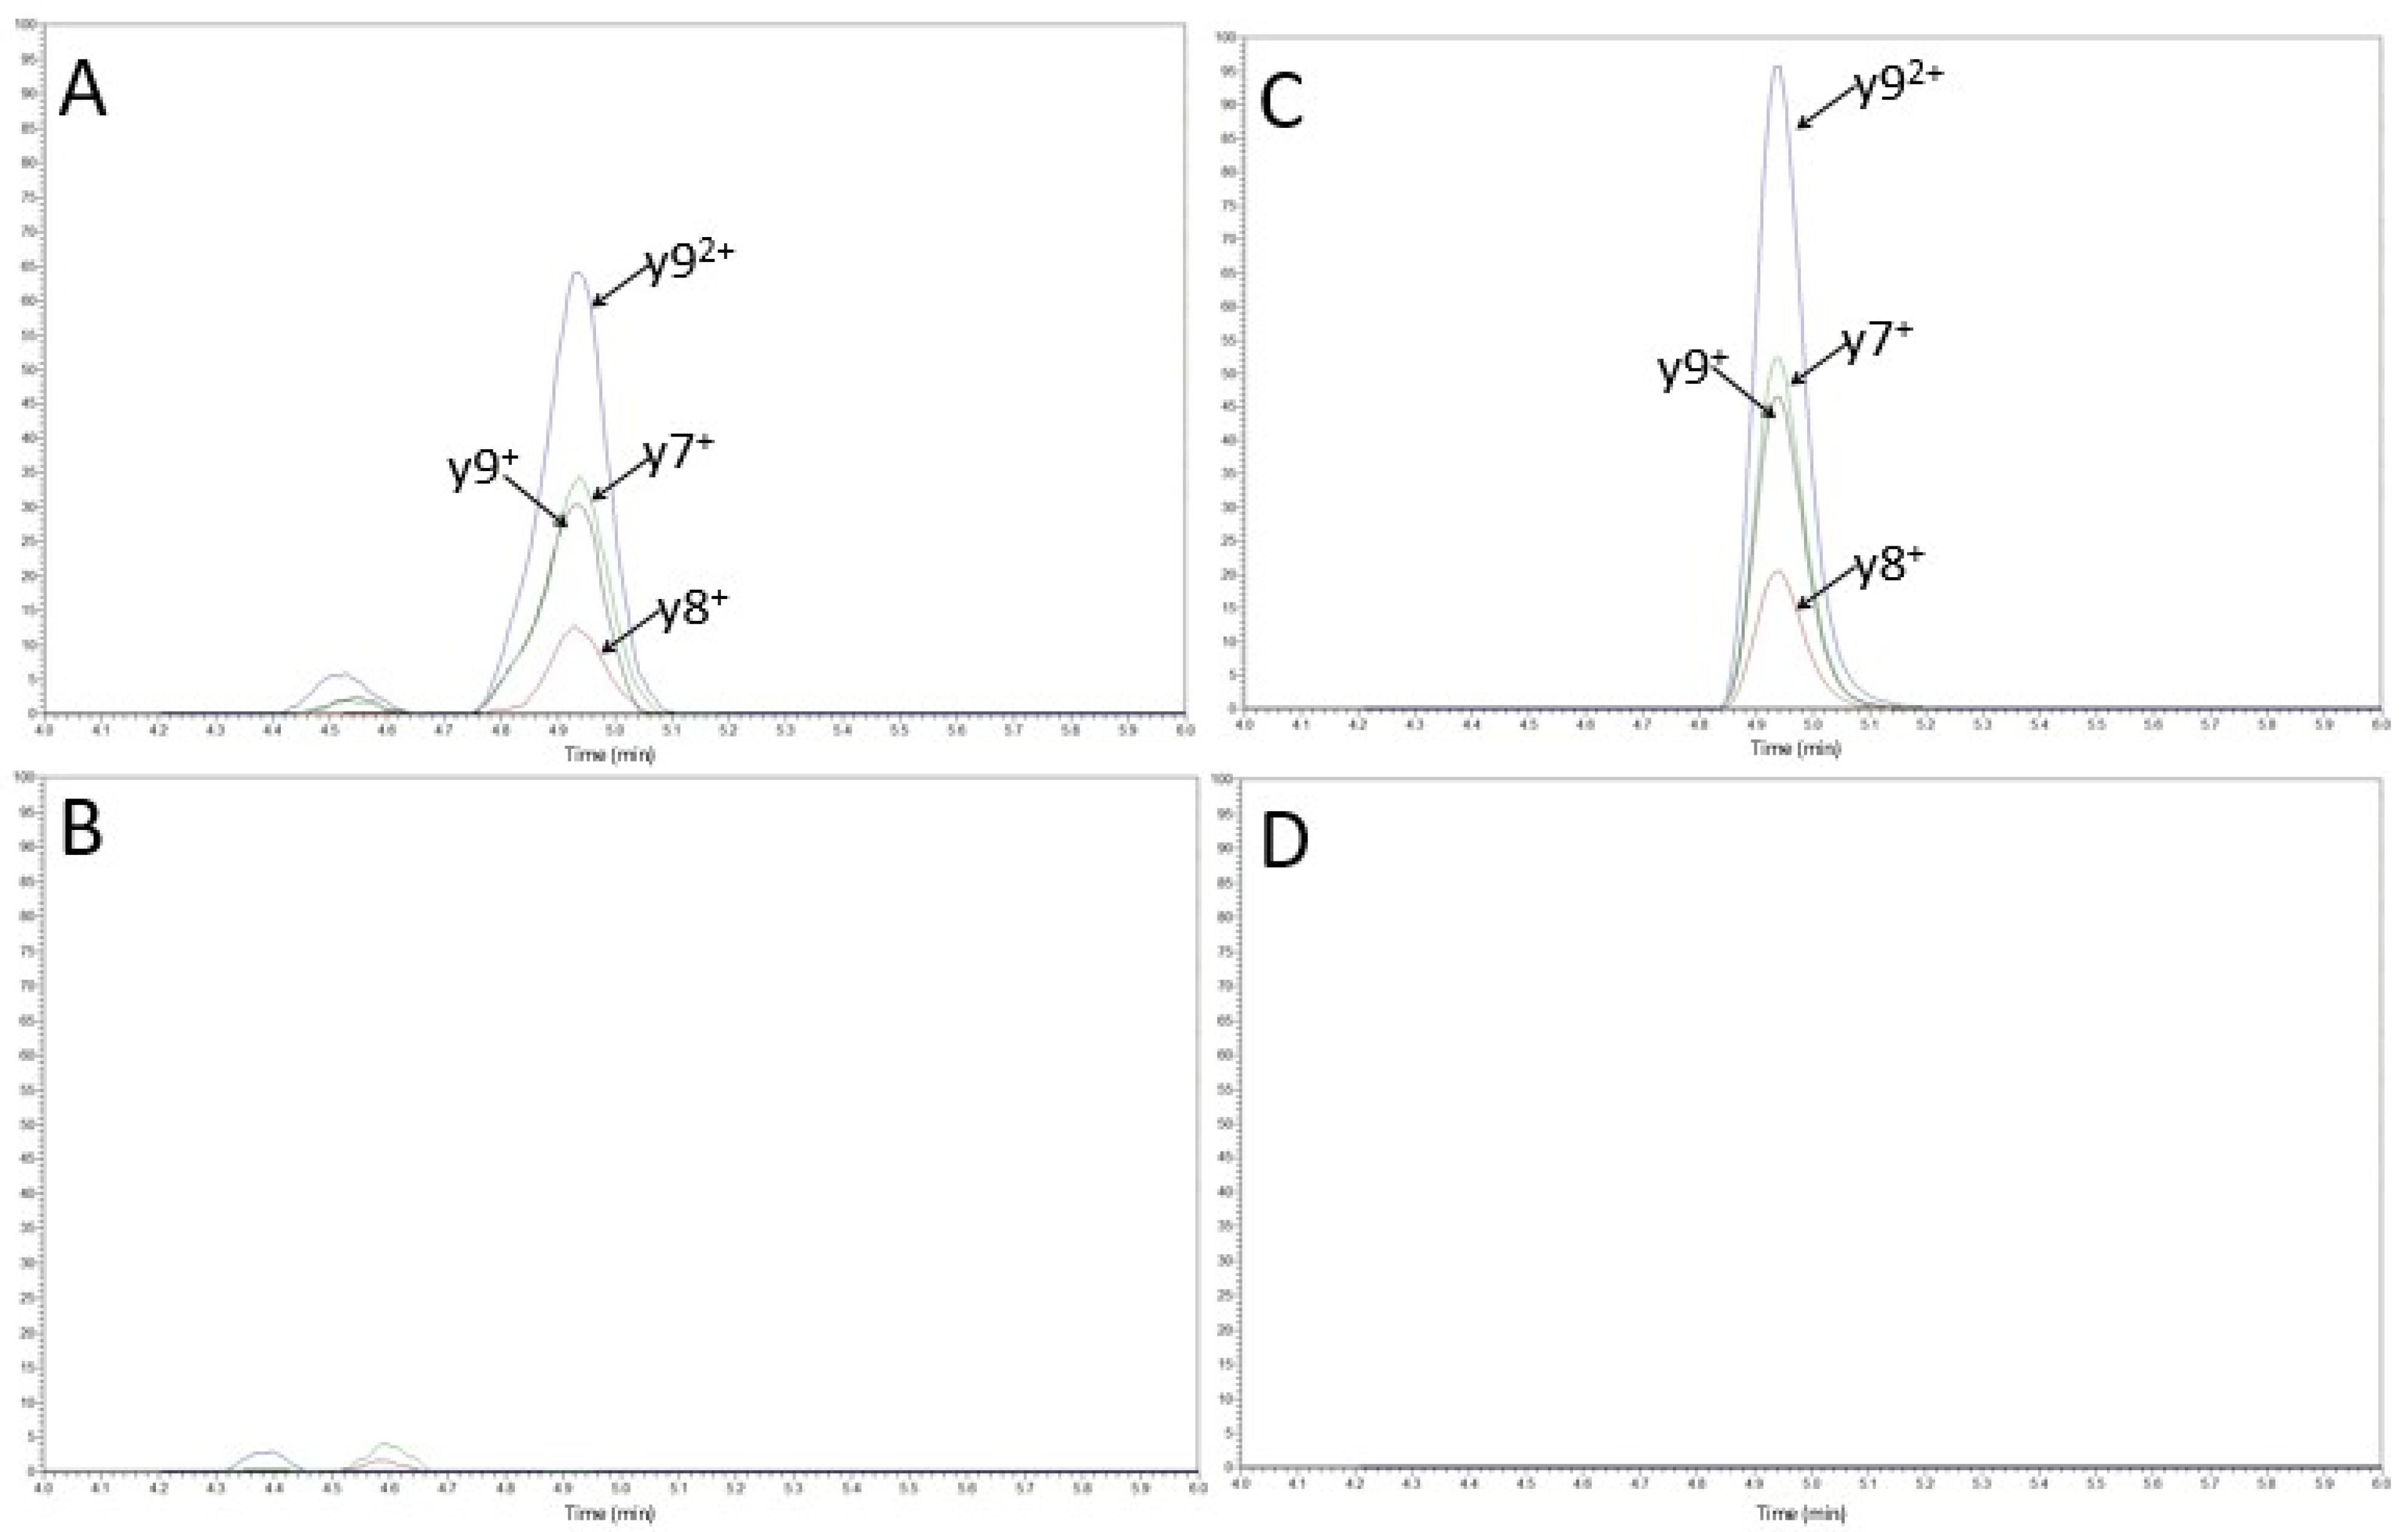
3.1. Selection of Proteotypic Peptides and Selectivity with LC-MS/HRMS
3.2. Validation with LC-MS/HRMS Method
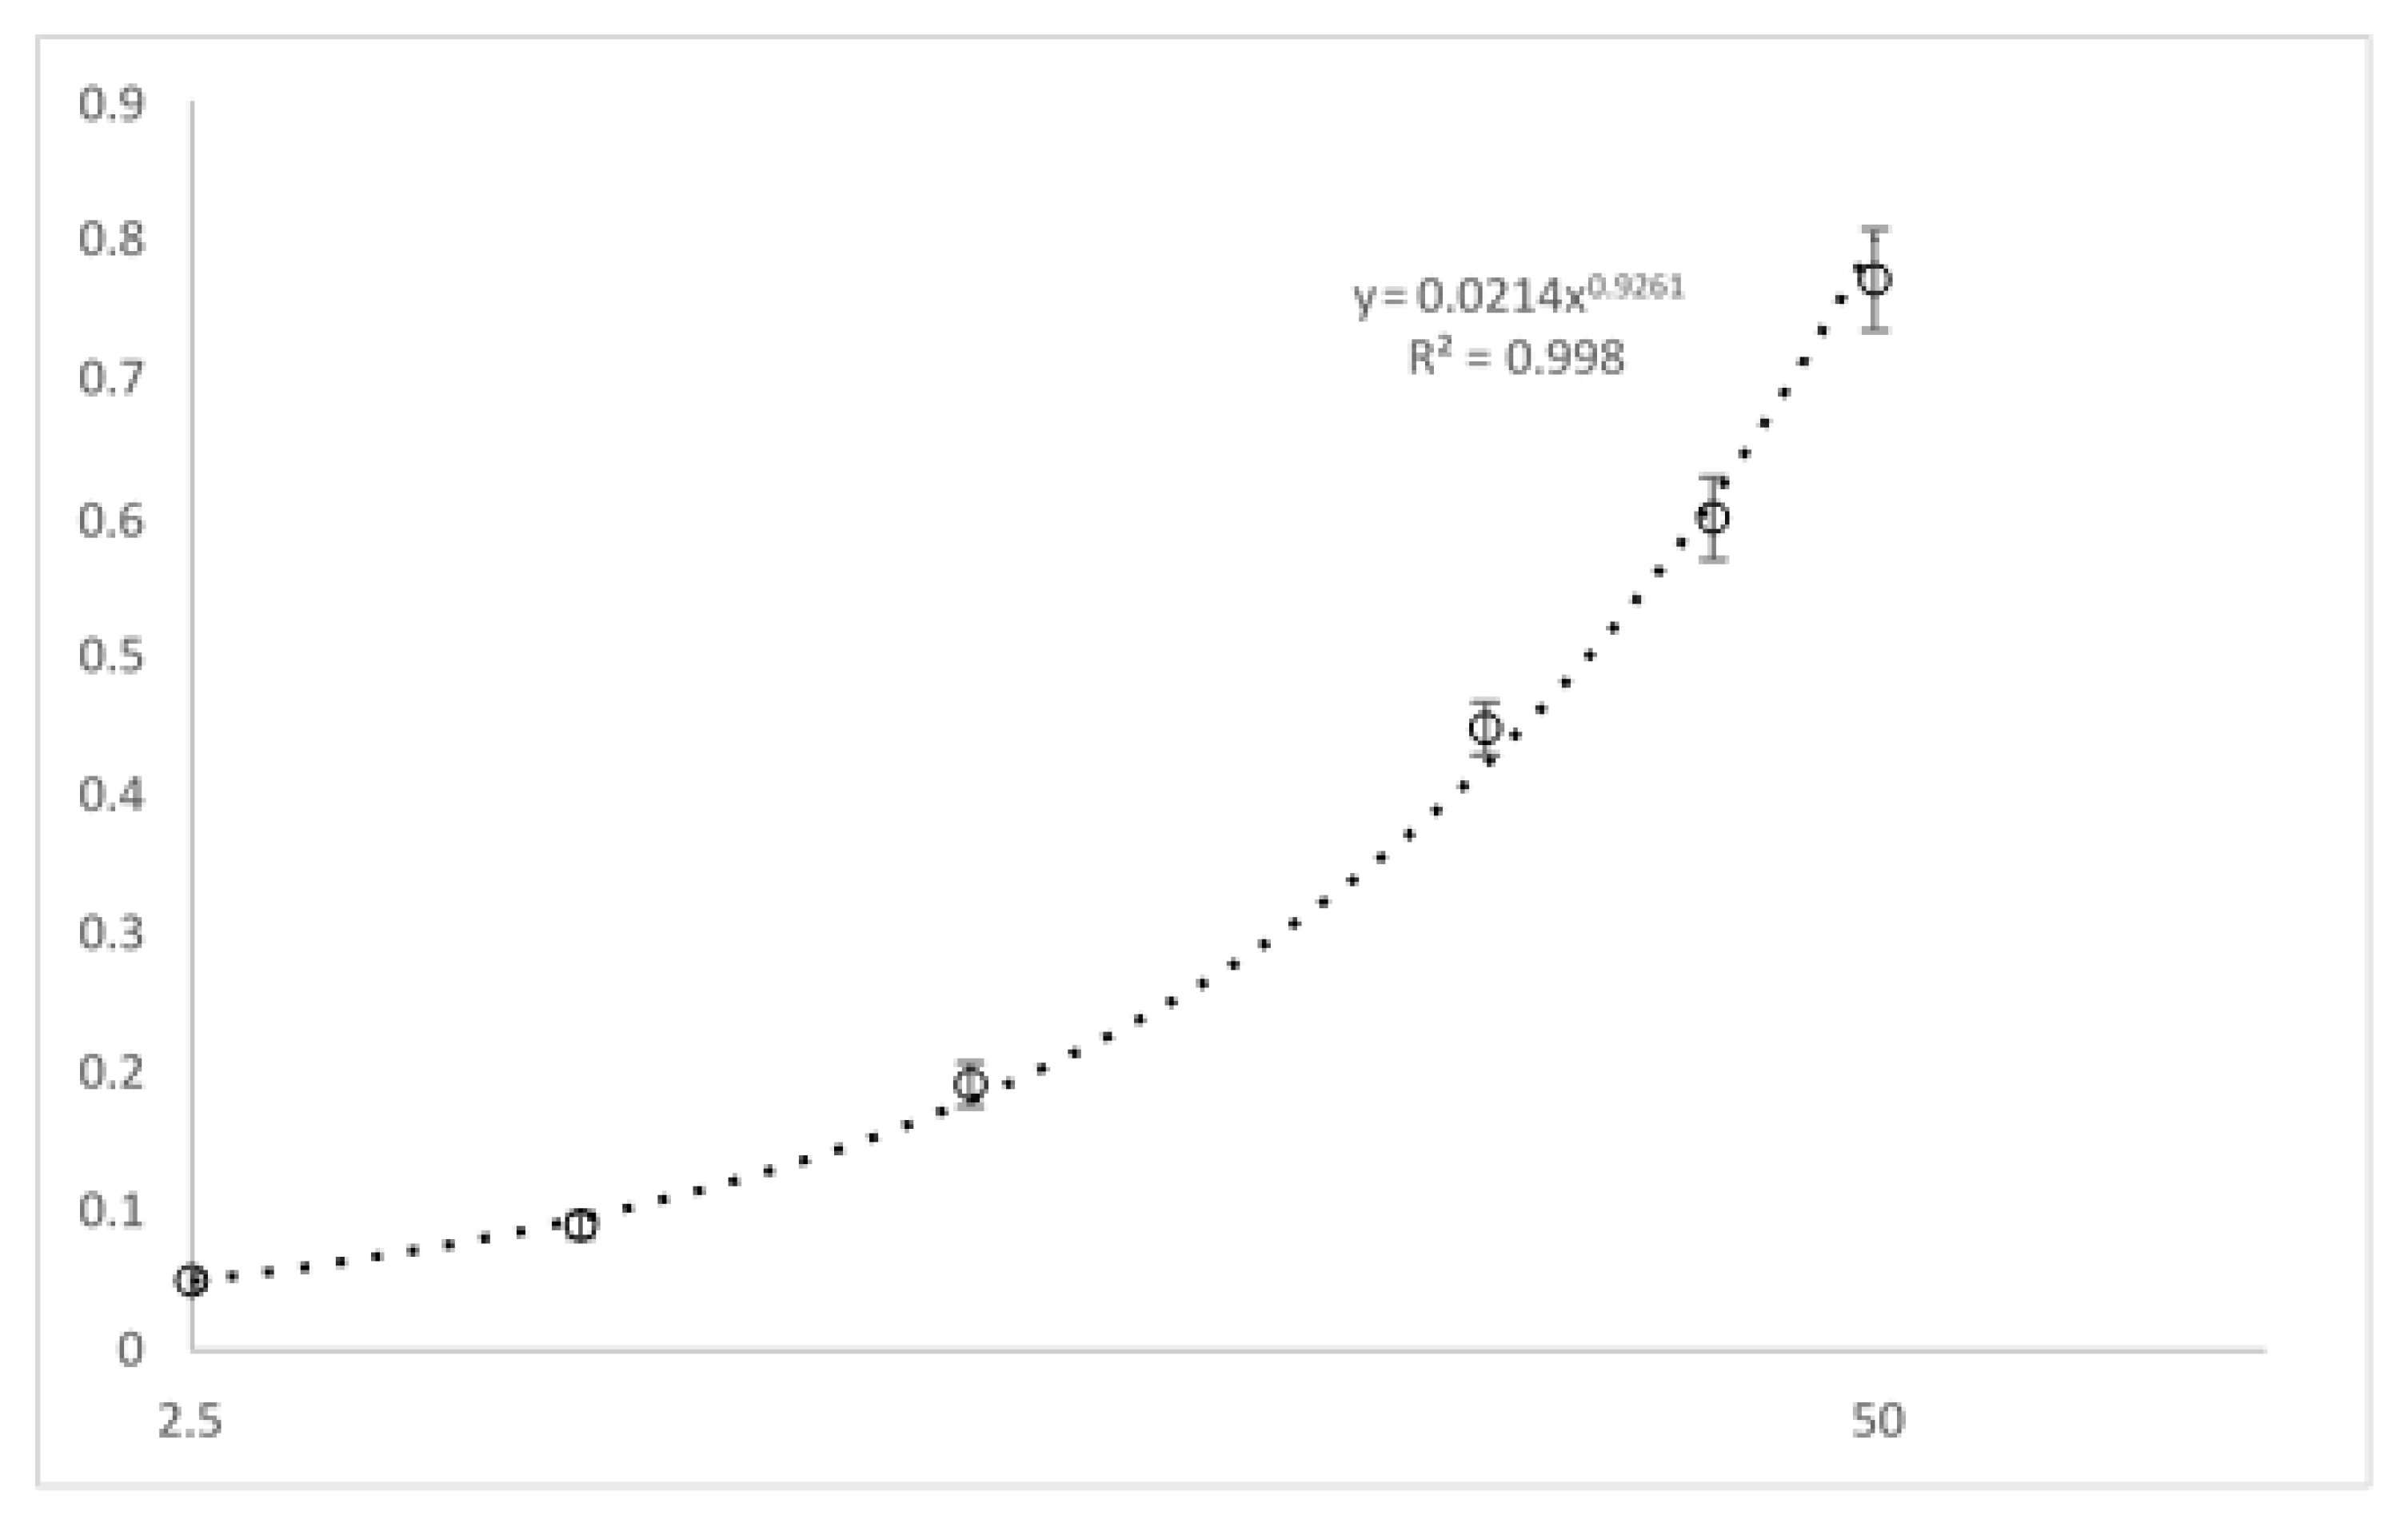
3.2.1. Linearity, Accuracy, Precision and LLOQ
3.2.2. Recovery and Matrix Effects
3.2.3. Carryover and Sample Stability
3.3. Validation with ELISA Assay
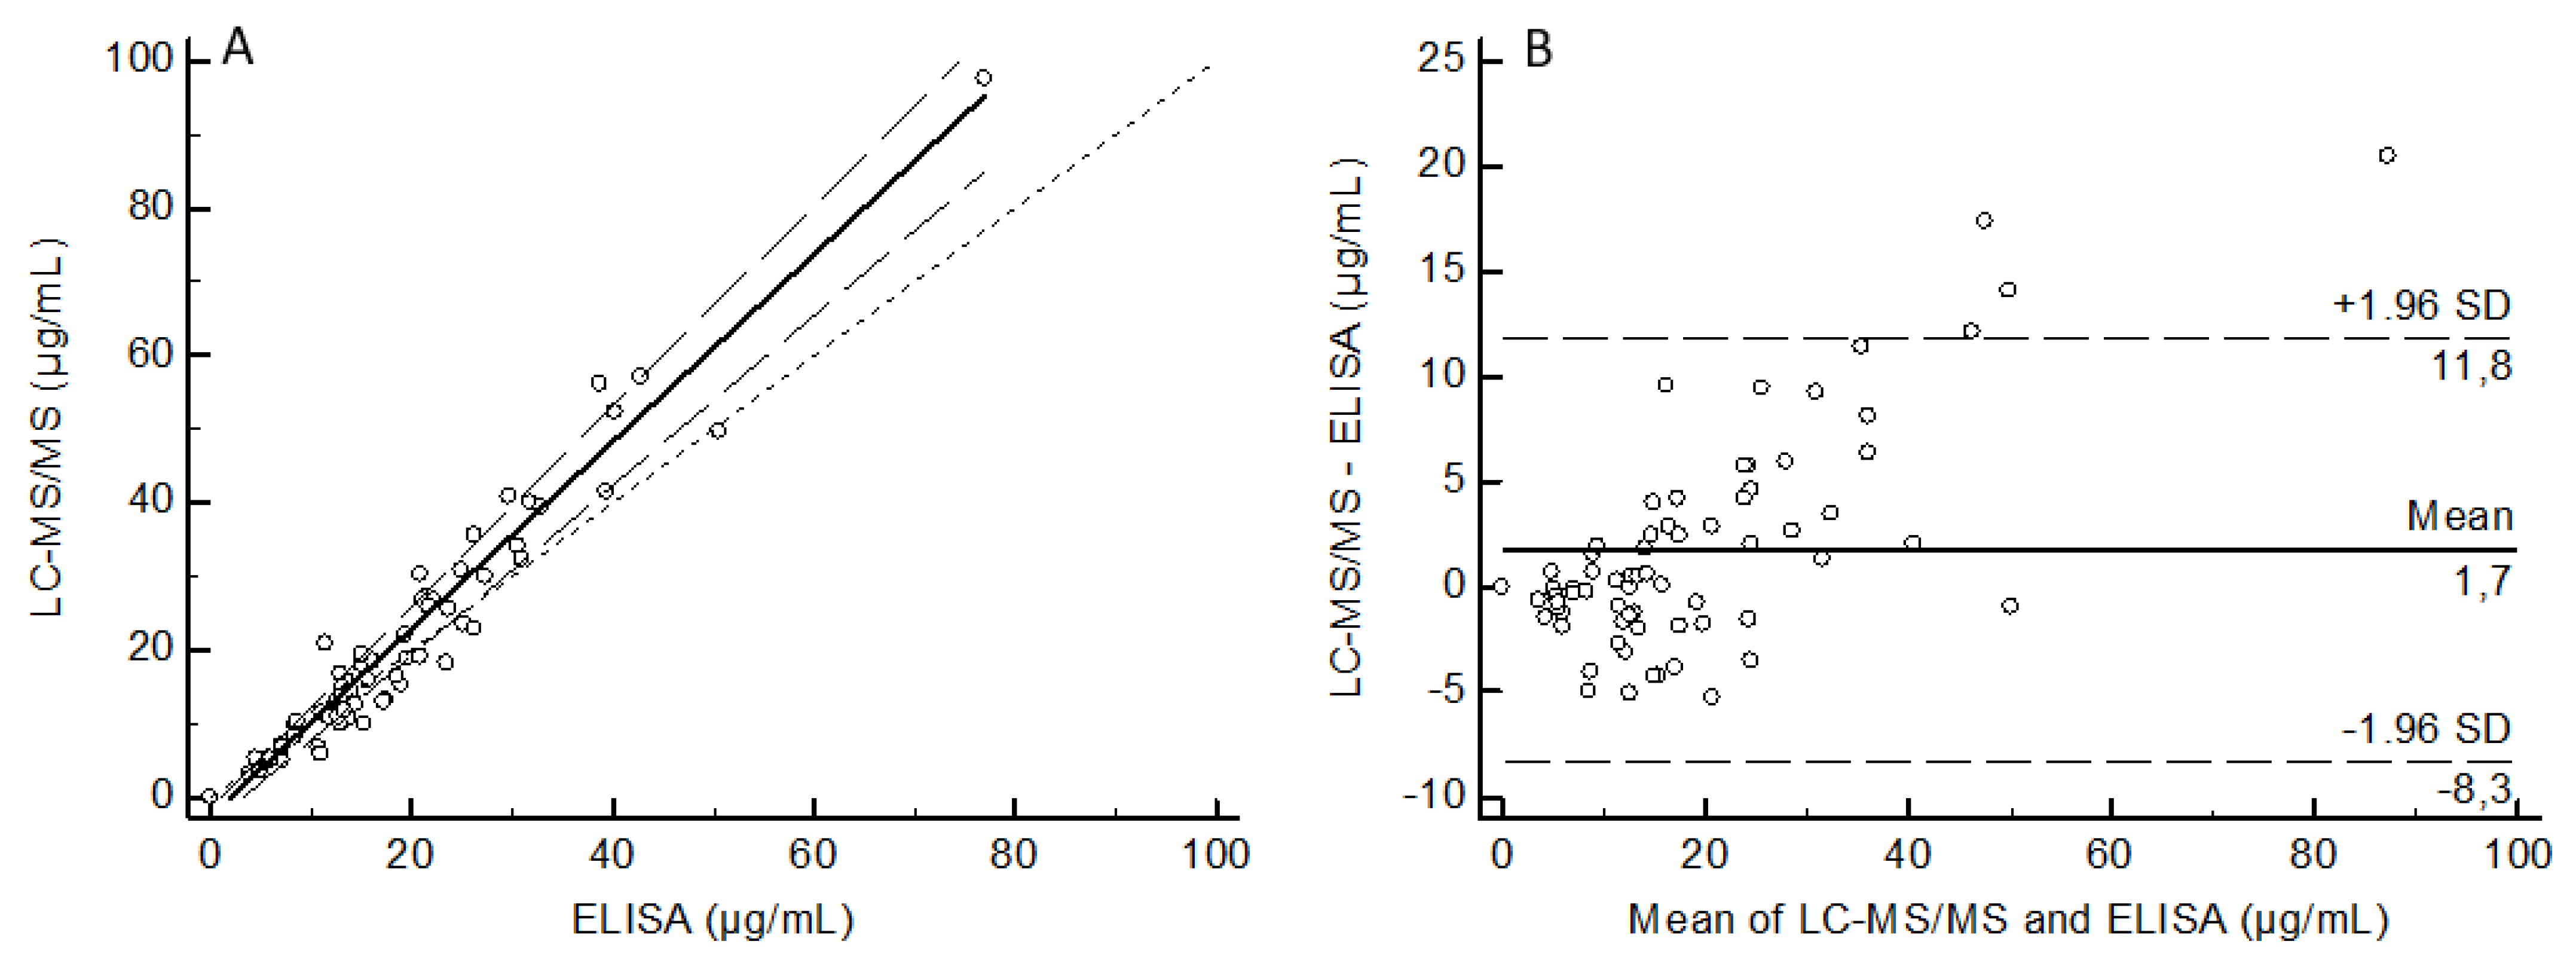
3.4. Comparison of Methods Based on Samples from Treated Patients
4. Discussion
5. Conclusions
Author Contributions
Funding
Institutional Review Board Statement
Informed Consent Statement
Data Availability Statement
Conflicts of Interest
References
- Mansh, M. Ipilimumab and Cancer Immunotherapy: A New Hope for Advanced Stage Melanoma. Yale J. Boil. Med. 2011, 84, 381–389. [Google Scholar]
- Robert, C. A decade of immune-checkpoint inhibitors in cancer therapy. Nat. Commun. 2020, 11, 1–3. [Google Scholar] [CrossRef] [PubMed]
- Singh, S.; Hassan, D.; Aldawsari, H.M.; Molugulu, N.; Shukla, R.; Kesharwani, P. Immune checkpoint inhibitors: A promising anticancer therapy. Drug Discov. Today 2020, 25, 223–229. [Google Scholar] [CrossRef] [PubMed]
- Vaddepally, R.K.; Kharel, P.; Pandey, R.; Garje, R.; Chandra, A.B. Review of Indications of FDA-Approved Immune Checkpoint Inhibitors per NCCN Guidelines with the Level of Evidence. Cancers 2020, 12, 738. [Google Scholar] [CrossRef] [PubMed]
- Desnoyer, A.; Broutin, S.; Delahousse, J.; Maritaz, C.; Blondel, L.; Mir, O.; Chaput, N.; Paci, A. Pharmacokinetic/pharmacodynamic relationship of therapeutic monoclonal antibodies used in oncology: Part 2, immune checkpoint inhibitor antibodies. Eur. J. Cancer 2020, 128, 119–128. [Google Scholar] [CrossRef] [PubMed]
- Freshwater, T.; Kondic, A.; Ahamadi, M.; Li, C.H.; De Greef, R.; De Alwis, D.; Stone, J.A. Evaluation of dosing strategy for pembrolizumab for oncology indications. J. Immunother. Cancer 2017, 5, 43. [Google Scholar] [CrossRef]
- Lala, M.; Li, T.R.; de Alwis, D.P.; Sinha, V.; Mayawala, K.; Yamamoto, N.; Siu, L.L.; Chartash, E.; Aboshady, H.; Jain, L. A six-weekly dosing schedule for pembrolizumab in patients with cancer based on evaluation using modelling and simulation. Eur. J. Cancer 2020, 131, 68–75. [Google Scholar] [CrossRef]
- Patnaik, A.; Kang, S.P.; Rasco, D.; Papadopoulos, K.P.; Elassaiss-Schaap, J.; Beeram, M.; Drengler, R.; Chen, C.; Smith, L.; Espino, G.; et al. Phase I Study of Pembrolizumab (MK-3475; Anti–PD-1 Monoclonal Antibody) in Patients with Advanced Solid Tumors. Clin. Cancer Res. 2015, 21, 4286–4293. [Google Scholar] [CrossRef]
- Peer, C.J.; Goldstein, D.A.; Ratain, M.J.; Figg, W.D. A modeling and simulation study of less frequent dosing of nivolumab 480 mg. J. Clin. Oncol. 2019, 37, 3115. [Google Scholar] [CrossRef]
- Sureda, M.; Calvo, E.; Mata, J.J.; Escudero-Ortiz, V.; Martinez-Navarro, E.; Catalán, A.; Rebollo, J. Dosage of anti-PD-1 monoclonal antibodies: A cardinal open question. Clin. Transl. Oncol. 2021, 1–9. [Google Scholar] [CrossRef]
- Chan, T.S.Y.; Hwang, Y.; Khong, P.; Leung, A.Y.H.; Chim, C.; Tse, E.W.C.; Kwong, Y. Low-dose pembrolizumab and nivolumab were efficacious and safe in relapsed and refractory classical Hodgkin lymphoma: Experience in a resource-constrained setting. Hematol. Oncol. 2020, 38, 726–736. [Google Scholar] [CrossRef]
- Basak, E.A.; Wijkhuijs, A.J.M.; Mathijssen, R.H.J.; Koolen, S.L.W.; Schreurs, M.W.J. Development of an Enzyme-Linked Immune Sorbent Assay to Measure Nivolumab and Pembrolizumab Serum Concentrations. Ther. Drug Monit. 2018, 40, 596–601. [Google Scholar] [CrossRef]
- Pluim, D.; Ros, W.; van Bussel, M.T.; Brandsma, D.; Beijnen, J.H.; Schellens, J.H. Enzyme linked immunosorbent assay for the quantification of nivolumab and pembrolizumab in human serum and cerebrospinal fluid. J. Pharm. Biomed. Anal. 2019, 164, 128–134. [Google Scholar] [CrossRef]
- Ladwig, P.M.; Barnidge, D.R.; Willrich, M.A.V. Mass Spectrometry Approaches for Identification and Quantitation of Therapeutic Monoclonal Antibodies in the Clinical Laboratory. Clin. Vaccine Immunol. 2017, 24, 24. [Google Scholar] [CrossRef]
- Millet, A.; Khoudour, N.; Bros, P.; Lebert, D.; Picard, G.; Machon, C.; Goldwasser, F.; Blanchet, B.; Guitton, J. Quantification of nivolumab in human plasma by LC-MS/HRMS and LC-MS/MS, comparison with ELISA. Talanta 2021, 224, 121889. [Google Scholar] [CrossRef]
- Chiu, H.-H.; Liao, H.-W.; Shao, Y.-Y.; Lu, Y.-S.; Lin, C.-H.; Tsai, I.-L.; Kuo, C.-H. Development of a general method for quantifying IgG-based therapeutic monoclonal antibodies in human plasma using protein G purification coupled with a two internal standard calibration strategy using LC-MS/MS. Anal. Chim. Acta 2018, 1019, 93–102. [Google Scholar] [CrossRef]
- Ezan, E.; Bitsch, F. Critical comparison of MS and immunoassays for the bioanalysis of therapeutic antibodies. Bioanal. 2009, 1, 1375–1388. [Google Scholar] [CrossRef] [PubMed]
- European Medicines Agency (EMA); Committee for Medical Products for Human Use (CHMP). Guidance on Bioanalytical Method Validation; EMA: London, UK, 2011; Available online: https://www.ema.europa.eu/en/bioanalytical-method-validation (accessed on 28 May 2021).
- Puszkiel, A.; Noé, G.; Boudou-Rouquette, P.; Cossec, C.L.-; Arrondeau, J.; Giraud, J.-S.; Thomas-Schoemann, A.; Alexandre, J.; Vidal, M.; Goldwasser, F.; et al. Development and validation of an ELISA method for the quantification of nivolumab in plasma from non-small-cell lung cancer patients. J. Pharm. Biomed. Anal. 2017, 139, 30–36. [Google Scholar] [CrossRef]
- Passing, H.; Bablok, W. Comparison of Several Regression Procedures for Method Comparison Studies and Determination of Sample Sizes Application of linear regression procedures for method comparison studies in Clinical Chemistry, Part II. Clin. Chem. Lab. Med. 1984, 22, 431–445. [Google Scholar] [CrossRef]
- Bland, J.; Altman, D. Regression Analysis. Lancet 1986, 327, 908–909. [Google Scholar] [CrossRef]
- Lee, J.Y.; Lee, H.T.; Shin, W.; Chae, J.; Choi, J.; Kim, S.H.; Lim, H.; Heo, T.W.; Park, K.Y.; Lee, Y.J.; et al. Structural basis of checkpoint blockade by monoclonal antibodies in cancer immunotherapy. Nat. Commun. 2016, 7, 13354. [Google Scholar] [CrossRef]
- Scapin, G.; Yang, X.; Prosise, W.W.; McCoy, M.; Reichert, P.; Johnston, J.M.; Kashi, R.S.; Strickland, C. Structure of full-length human anti-PD1 therapeutic IgG4 antibody pembrolizumab. Nat. Struct. Mol. Biol. 2015, 22, 953–958. [Google Scholar] [CrossRef]
- Andrade, J.M.; Gómez-Carracedo, M.P. Notes on the use of Mandel’s test to check for nonlinearity in laboratory calibrations. Anal. Methods 2013, 5, 1145. [Google Scholar] [CrossRef]
- El Amrani, M.; Bosman, S.M.; Egas, A.C.; Hack, C.E.; Huitema, A.D.R.; Van Maarseveen, E.M. Simultaneous Quantification of Free Adalimumab and Infliximab in Human Plasma Using a Target-Based Sample Purification and Liquid Chromatography–Tandem Mass Spectrometry. Ther. Drug Monit. 2019, 41, 640–647. [Google Scholar] [CrossRef]
- Iwamoto, N.; Shimada, T.; Terakado, H.; Hamada, A. Validated LC–MS/MS analysis of immune checkpoint inhibitor Nivolumab in human plasma using a Fab peptide-selective quantitation method: Nano-surface and molecular-orientation limited (nSMOL) proteolysis. J. Chromatogr. B 2016, 1023–1024, 9–16. [Google Scholar] [CrossRef]
- Ma, Y.; Fang, W.; Zhang, Y.; Yang, Y.; Hong, S.; Zhao, Y.; Xie, S.; Ge, J.; Zhou, H.; Zhao, H.; et al. KEYNOTE-032: A Randomized Phase I Study of Pembrolizumab in Chinese Patients with Advanced Non-Small Cell Lung Cancer. Oncologist 2020, 25, 650. [Google Scholar] [CrossRef] [PubMed]


| Compound. | Selected Peptide | Precursor Ion | Product Ion | |||
|---|---|---|---|---|---|---|
| (m/z) | Charge | Ion | (m/z) | Charge | ||
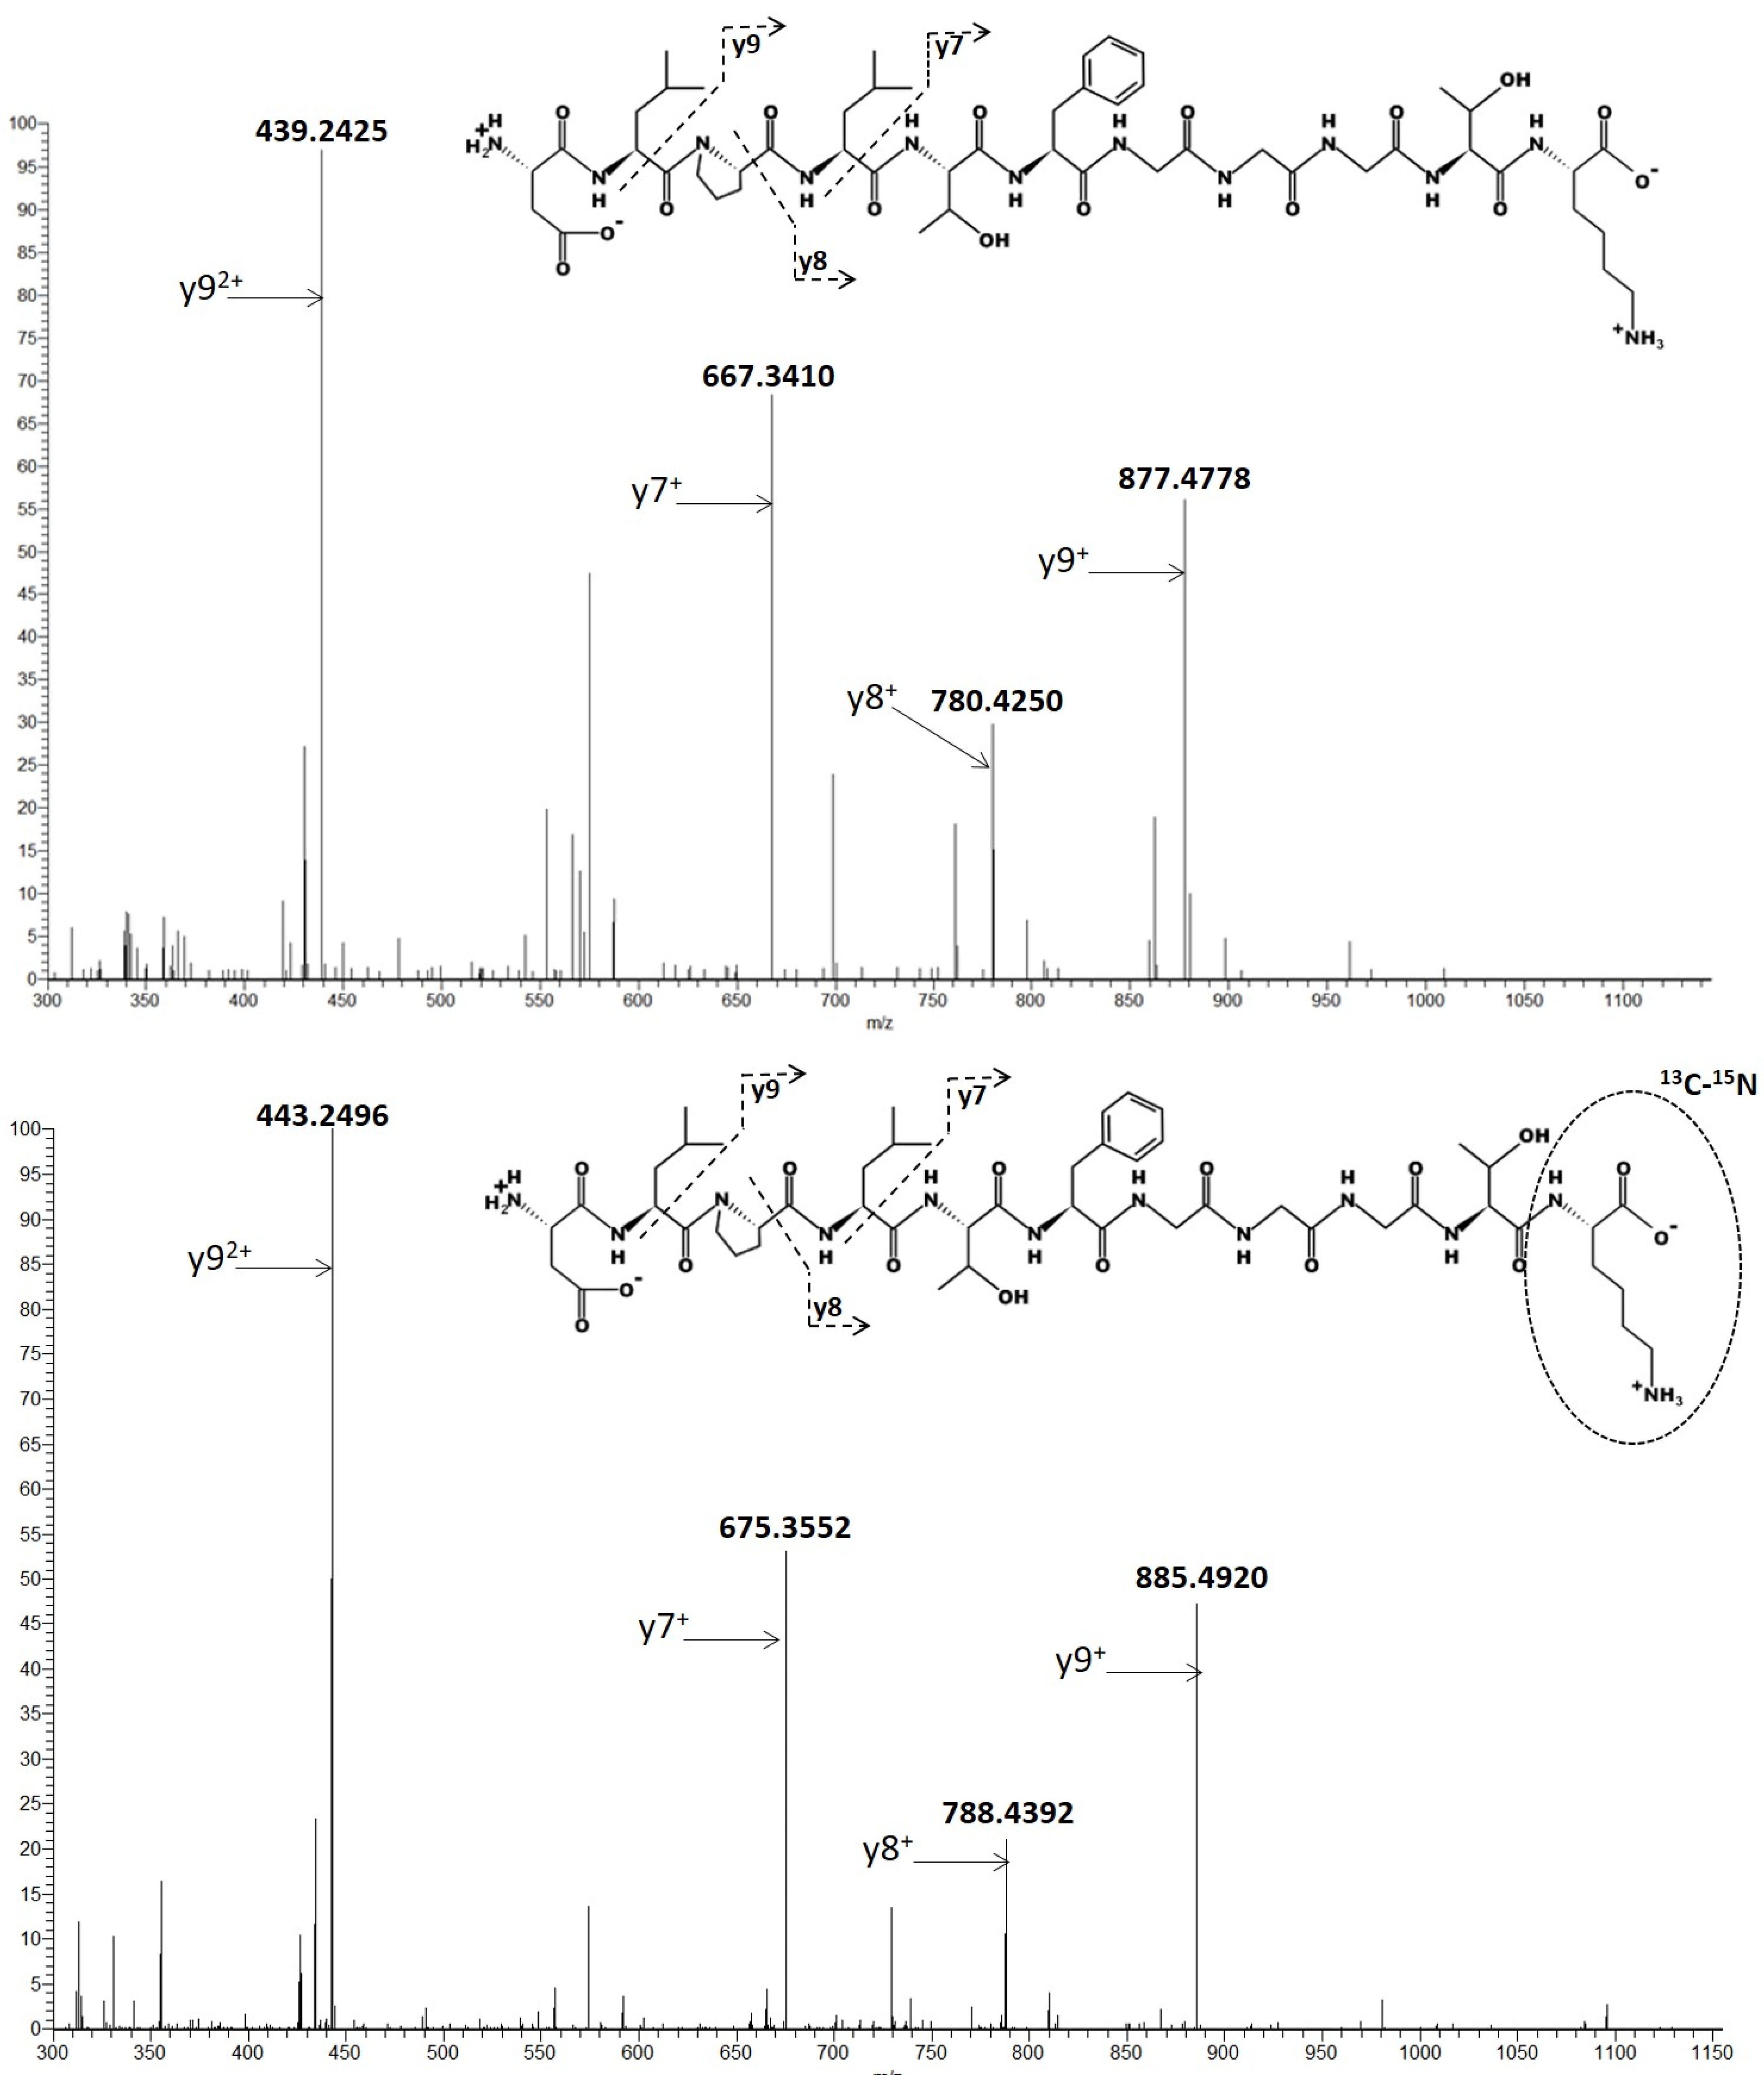
| PBZ | DLPLTFGGGTK | 553.2980 | +2 | y9 y7 y9 y8 | 439.2425 667.3410 877.4778 780.4250 | +2 +1 +1 +1 |
| SIL-PBZ-like (I.S.) | DLPLTFGGGTK | 557.3051 | +2 | y9 y7 y9 y8 | 443.2496 675.3552 885.4920 788.4392 | +2 +1 +1 +1 |
| Quantifying ions (y92+ + y7+) | |||
|---|---|---|---|
| Spiked (µg/mL) | Found (µg/mL) (mean ± s.d.) | Precision (%) | Accuracy (%) |
| 1 | 1.0 ± 0.1 | 9.6 | 95.4 |
| 2.5 | 2.7 ± 0.2 | 7.6 | 108.6 |
| 7.5 | 7.6 ± 0.9 | 12.3 | 98.2 |
| 20 | 21.3 ± 1.4 | 6.5 | 106.3 |
| 50 | 47.9 ± 2.3 | 4.9 | 95.7 |
| 100 | 101.0 ± 1.2 | 1.2 | 101.0 |
| Concentration | Precision (%) | Accuracy (%) | |||
|---|---|---|---|---|---|
| Spiked | Found (mean ± s.d.) | Within-Day | Between-Day | Within-Day | Between-Day |
| 1 (LLOQ) | 1.0 ± 0.2 | 9.8 | 17.6 | 89.7 | 102.2 |
| 5 | 4.9 ± 0.6 | 6.3 | 11.4 | 102.8 | 97.2 |
| 25 | 23.9 ± 3.8 | 11 | 12.2 | 103.7 | 95.6 |
| 80 | 84.1 ± 12.8 | 7.8 | 14.1 | 101.4 | 105.1 |
| Patient | Found (µg/mL) (mean ± s.d.) | Reproducibility (%) | Difference (%) |
|---|---|---|---|
| P1 P2 P3 P4 P5 P7 P9 | 4.6 ± 0.7 4.3 ± 0.7 11.1 ± 1.4 <1 10.9 ± 1.3 34.5 ± 5.7 43.2 ± 4.9 | 14.2 15.8 12.6 - 11.5 16.5 11.3 | −4% −12% −11% - −3% −2% −9% |
| Study | Method | Standard Curve and LLOQ | Precision |
|---|---|---|---|
| Basak et al. [12] | ELISA | 0.80–100 µg/mL | Data not available |
| Pluim et al. [13] | ELISA | 2–100 µg/mL (LLOQ 2 µg/mL) | CV < 6.6% CV < 5.8% |
| Chiu et al. [16] | LC and triple quadrupolar mass spectrometer Two internal standards (tocilizumab and post-infused labelled peptide) | 5–800 µg/mL (LLOQ at 3 µg/mL) | CV < 7.1% Data not available |
| Millet et al. (Present study) | LC and tandem quadrupolar and high resolution (Orbitrap) mass spectrometer SIL-PBZ-like as internal standard ELISA | 1–100 µg/mL (LLOQ at 1 µg/mL) 2.5–50 µg/mL (LLOQ at 2.5 µg/mL) | CV < 14.1% CV < 17.6% CV < 9.9% CV < 14.1% |
Publisher’s Note: MDPI stays neutral with regard to jurisdictional claims in published maps and institutional affiliations. |
© 2021 by the authors. Licensee MDPI, Basel, Switzerland. This article is an open access article distributed under the terms and conditions of the Creative Commons Attribution (CC BY) license (https://creativecommons.org/licenses/by/4.0/).
Share and Cite
Millet, A.; Khoudour, N.; Guitton, J.; Lebert, D.; Goldwasser, F.; Blanchet, B.; Machon, C. Analysis of Pembrolizumab in Human Plasma by LC-MS/HRMS. Method Validation and Comparison with Elisa. Biomedicines 2021, 9, 621. https://doi.org/10.3390/biomedicines9060621
Millet A, Khoudour N, Guitton J, Lebert D, Goldwasser F, Blanchet B, Machon C. Analysis of Pembrolizumab in Human Plasma by LC-MS/HRMS. Method Validation and Comparison with Elisa. Biomedicines. 2021; 9(6):621. https://doi.org/10.3390/biomedicines9060621
Chicago/Turabian StyleMillet, Aurélien, Nihel Khoudour, Jérôme Guitton, Dorothée Lebert, François Goldwasser, Benoit Blanchet, and Christelle Machon. 2021. "Analysis of Pembrolizumab in Human Plasma by LC-MS/HRMS. Method Validation and Comparison with Elisa" Biomedicines 9, no. 6: 621. https://doi.org/10.3390/biomedicines9060621
APA StyleMillet, A., Khoudour, N., Guitton, J., Lebert, D., Goldwasser, F., Blanchet, B., & Machon, C. (2021). Analysis of Pembrolizumab in Human Plasma by LC-MS/HRMS. Method Validation and Comparison with Elisa. Biomedicines, 9(6), 621. https://doi.org/10.3390/biomedicines9060621