Article

Pharmacological Inhibition of WIP1 Sensitizes Acute Myeloid Leukemia Cells to the MDM2 Inhibitor Nutlin-3a

by
Maria Chiara Fontana
1,2,*,†,
Jacopo Nanni
2,3,†,
Andrea Ghelli Luserna di Rorà
1,*,
Elisabetta Petracci
1,
Antonella Padella
1,
Martina Ghetti
1,
Anna Ferrari
1,
Giovanni Marconi
1,
Simona Soverini
2,
Ilaria Iacobucci
4,
Cristina Papayannidis
3,
Antonio Curti
3,
Ernesta Audisio
5,
Maria Benedetta Giannini
1,
Michela Rondoni
6,
Francesco Lanza
6,
Michele Cavo
2,3,
Giovanni Martinelli
1,‡ and
Giorgia Simonetti
1,‡
1
IRCCS Istituto Romagnolo per lo Studio dei Tumori “Dino Amadori”—IRST, 47014 Meldola (FC), Italy
2
Dipartimento di Medicina Specialistica, Diagnostica e Sperimentale, Università di Bologna, 40138 Bologna, Italy
3
IRCCS Azienda Ospedaliero-Universitaria di Bologna, Istituto di Ematologia “Seràgnoli”, 40138 Bologna, Italy
4
Department of Pathology, St. Jude Children’s Research Hospital, Memphis, TN 38105, USA
5
AOU Città della Salute e della Scienza di Torino, 10126 Torino, Italy
6
Hematology Unit & Romagna Transplant Network, Ravenna Hospital, 48121 Ravenna, Italy
*
Authors to whom correspondence should be addressed.
M.C.F. and J.N. equally contributed.
G.M. and G.S. shared the last authorship.
Biomedicines 2021, 9(4), 388; https://doi.org/10.3390/biomedicines9040388
Submission received: 1 March 2021 / Revised: 23 March 2021 / Accepted: 27 March 2021 / Published: 6 April 2021

Abstract

:
In acute myeloid leukemia (AML), the restoration of p53 activity through MDM2 inhibition proved efficacy in combinatorial therapies. WIP1, encoded from PPM1D, is a negative regulator of p53. We evaluated PPM1D expression and explored the therapeutic efficacy of WIP1 inhibitor (WIP1i) GSK2830371, in association with the MDM2 inhibitor Nutlin-3a (Nut-3a) in AML cell lines and primary samples. PPM1D transcript levels were higher in young patients compared with older ones and in core-binding-factor AML compared with other cytogenetic subgroups. In contrast, its expression was reduced in NPM1-mutated (mut, irrespective of FLT3-ITD status) or TP53-mut cases compared with wild-type (wt) ones. Either Nut-3a, and moderately WIP1i, as single agent decreased cell viability of TP53-wt cells (MV-4-11, MOLM-13, OCI-AML3) in a time/dosage-dependent manner, but not of TP53-mut cells (HEL, KASUMI-1, NOMO-1). The drug combination synergistically reduced viability and induced apoptosis in TP53-wt AML cell line and primary cells, but not in TP53-mut cells. Gene expression and immunoblotting analyses showed increased p53, MDM2 and p21 levels in treated TP53-wt cells and highlighted the enrichment of MYC, PI3K-AKT-mTOR and inflammation-related signatures upon WIP1i, Nut-3a and their combination, respectively, in the MV-4-11 TP53-wt model. This study demonstrated that WIP1 is a promising therapeutic target to enhance Nut-3a efficacy in TP53-wt AML.

Graphical Abstract

1. Introduction

Protein Phosphatase, Mg2+/Mn2+ Dependent 1D (PPM1D) is a member of the PP2C family of serine/threonine phosphatase and encodes for “Wild-Type p53-Induced Phosphatase 1” (WIP1). WIP1 is involved in the negative regulation of stress response pathways [1,2], DNA damage response (DDR) [3,4,5] and cell-cycle [6,7,8] Following DNA damages, p53 is activated and promotes the transcription of several downstream DDR-effectors including PPM1D. PPM1D dephosphorylates p53 at Ser15 [9], thus promoting the interaction with its negative regulators MDM2 and MDMX [10,11,12]. This autoregulatory feedback loop allows the termination of p53 response after DNA damages [11,13].
PPM1D amplification and WIP1 overexpression showed oncogenic properties across several cancer types and were associated with dismal outcome, mainly due to the suppression of p53 activity [14,15,16,17,18,19,20,21,22].
Moreover, PPM1D gain-of-function mutations are enriched in peripheral blood cells of individuals that have been previously exposed to chemotherapy [23,24], in therapy-related myelodysplastic syndromes and in clonal hematopoiesis of indeterminate potential [25,26,27]. PPM1D mutations confer advantages to hematopoietic stem cells in terms of self-renewal and/or proliferation, resulting in the expansion of multi-lineage and myeloid-based clones [25,26,27,28]. It has been recently reported that truncating PPM1D mutations that induce elevated protein expression, confer cytarabine resistance in AML and force the selective expansion of PPM1D-mutated leukemic cells [29]. Allosteric WIP1 inhibition can restore the sensitivity of PPM1D-mutated leukemia to chemotherapy. These preliminary data provide the rationale for exploiting the beneficial effect of WIP1 inhibitors in combinatorial therapies. The WIP1 inhibitor GSK2830371 (WIP1i) has been widely tested as single agent or in combination with chemotherapeutic or targeted drugs in pre-clinical studies on different neoplastic cell-lines, showing promising results [30,31,32,33]. Burdova et al. have recently demonstrated that WIP1 inhibition induces an accumulation of DNA damage in S/G2 cells and sensitizes cancer cells to olaparib [32], a poly ADP ribose polymerase inhibitor.
In leukemic cells, genomic instability is frequently linked to structural or functional p53 abnormalities [34,35,36]. Several mechanisms underlying non-mutational p53 inactivation might carry therapeutic relevance. The restoration of its activity through inhibition of the E3 ubiquitin-protein ligase binding to p53 (MDM2) has been extensively studied in the past years, as pharmacological intervention against AML that retains wild-type (wt) p53 [37,38,39]. Moreover, enhanced cytotoxicity and apoptotic response were observed by combining MDM2 inhibitors with chemotherapeutic (e.g., cytosine arabinoside and doxorubicin) or targeted agents (e.g., FLT3, MEK1 or BCL2 inhibitors) [40,41] and phase I/II studies are ongoing (NCT02670044; NCT03850535; NCT04029688). Combinatorial inhibition of MDM2 and WIP1 enhanced tumor growth-inhibitory and cytotoxic activity of MDM2 inhibitors in melanoma, neuroblastoma and breast cancer [30,32,33]. However, their combined activity in leukemia cells has not been investigated yet.
Thus, we here assessed the use of WIP1i in enhancing the therapeutic response of AML cell lines and primary cells to the MDM2 inhibitor Nutlin-3a and we elucidated the molecular mechanism underlying its action.

2. Experimental Section

2.1. Human AML Cell Lines

OCI-AML3 (DNMT3A-mut, NPM1-mut, TP53-wt), MOLM-13 (KMT2A-rearranged, TP53-wt), MV-4-11 (KMT2A-rearranged, FLT3-ITD, TP53-wt), NOMO-1 (KMT2A-rearranged, TP53-mut), HEL (TP53-mut, JAK2-mut) and KASUMI-1 (RUNX1-RUNXT1, TP53-mut) cell lines were obtained from Leibniz-Institut DSMZ-Deutsche Sammlung von Mikroorganismen und Zellkulturen GmbH (Braunschweig, Germany) and American Type Culture Collection (ATCC, Gaithersburg, MD, USA), respectively, and cultured following manufacturer’s recommendations. MOLM-13, MV-4-11, HEL, KASUMI-1 and NOMO-1 were cultured in RPMI-1640 medium (Euroclone, Milano, Italy), while OCI-AML3 were cultured in alpha-MEM (Thermo Fisher Scientific, Whaltam, MA, USA) in a humidified atmosphere of 5% CO2 at 37 °C. Media were supplemented with 2 mM L-glutamine (GE Healthcare, Chicago, IL, USA), 10–20% heat-inactivated fetal bovine serum (Thermo Fisher Scientific, Whaltam, MA, USA), 100 U/mL penicillin, 100 μg/mL streptomycin (GE Healthcare, Chicago, IL, USA).

2.2. Human Primary Cells

Primary AML blast cells were obtained upon written informed consent, as approved by the institutional ethics committees (Sant’Orsola-Malpighi Hospital, protocol 112/2014/U/Tess and Area Vasta Romagna, protocol 5805/2019) in accordance with the Declaration of Helsinki.
The mutational status of TP53 was analyzed by SOPHIA Myeloid Solution™ (SOPHiA GENETICS, Switzerland) as previously described [42] or by conventional Sanger sequencing, using the following primers (5′-3′): TP53 exon 5–6 fw: CACTTGTGCCCTGACTTTCA, rev: TTGCACATCTCATGGGGTTA; TP53 exon 7–9 fw: CGCACTGGCCTCATCTTGG, rev: TGTCTTTGAGGCATCACTGC. Capillary electrophoresis was performed to analyze NPM1 mutational status [43] and detect FLT3-ITD [44].
Mononuclear cells from bone marrow (BM) or peripheral blood (PB) of 13 newly-diagnosed or relapsed/refractory adult AML patients were collected by density gradient centrifugation using Lymphosep (Biowest, Riverside, MO, USA). Blast percentage was higher than 85%. Cells were cultured in StemSpan™ SFEM-II Medium (STEMCELL Technologies, Vancouver, Canada) containing 2 mM L-Glutamine (GE Healthcare), 20 ng/mL rhIL3, 20 ng/mL FLT3L, 20 ng/mL rhIL-6, 20 ng/mL rhSCF and 20 ng/mL rhG-CSF (PeproTech, London, UK).

2.3. Drugs

The MDM2 inhibitor Nutlin-3a (Nut-3a) and the WIP1i GSK2830371 were purchased from Sigma-Aldrich. Compounds were dissolved in DMSO to obtain 10 mM stock solutions and stored at −80 °C (WIP1i) and −20 °C (Nut-3a).

2.4. Cell Viability Assay

AML cell lines were seeded in 96-well plates at a concentration of 10,000 cells/well and incubated at 37 °C for 24, 48 and 72 h (h) with increasing drug concentrations: Nut-3a 0.5, 1, 2.5, 5 µM; WIP1i 5, 10, 20 µM (or DMSO, as vehicle). Primary samples were seeded in 6-well plates at concentration of 1 × 10⁶ cells/mL and treated with the highest doses of the two inhibitors (5 and 20 µM for Nut-3a and WIP1i respectively) based on preliminary results from ex vivo experiments (data not shown). Cell line viability was assessed by adding WST-1 reagent (Roche Applied Science, Switzerland) to the culture medium at 1:10 dilution. Cells were incubated at 37 °C and the optical density was measured by Thermo Scientific Multiskan EX microplate ELISA reader at λ450 after 3 h (Thermo Fisher Scientific). Drug effect was expressed as percentage of vehicle-treated cells. IC50 was calculated by GraphPad Prism v6.01 To evaluate synergism, additivity or antagonism of the co-treatment, the combination index (C.I.) was calculated by CompuSyn software (ComboSyn Inc.) [45]. Based on manufacturer’s instructions, we defined: synergism, CI < 1; additivity, CI = 1; antagonism, CI > 1. The viability of 3 AML primary cells upon treatment of Nut-3a and WIP1i was assessed by Trypan Blue staining (Bio-Rad Laboratories, Hercules, CA, USA).

2.5. Annexin V-Propidium IODIDE Staining of Apoptotic Cells

AML cell lines and primary cells were treated simultaneously with Nut-3a and WIP1i for 24 or 48 h. Cells were harvested and phosphatidylserine externalization was evaluated using the fluorescein isothiocyanate (FITC) Annexin V Apoptosis Detection Kit (eBioscience™ Thermo Fisher Scientific) according to manufacturer’s instruction. The percentage of apoptotic cells (Annexin V+) was determined by flow cytometry (BD Accuri C6 and Facs Canto II Flow Cytometer, BD Biosciences Pharmingen, San Jose, CA USA).

2.6. RNA Extraction and Gene Expression Profiling (GEP)

MV-4-11 (TP53-wt) and NOMO-1 (TP53-mut) cells were treated with Nut-3a (0.5 and 5 µM) and WIP1i (5 and 20 µM), respectively, or the drug combination (or vehicle) for 16 h (h). Cells were harvested and lysed in TRIzol® reagent (Invitrogen, ThermoFisher Scientific). RNA was extracted according to manufacturer’s instructions. Labeled cDNA was prepared and hybridized to the Human Clariom S Assay (ThermoFisher Scientific) following manufacturer’s recommendations. GEP was performed on three independent replicates and analyzed using Transcriptome Analysis Console Software (version 4.0.1, Thermo Fisher Scientific) with signal Space Transformation Robust Multi-Array average (sst-RMA) normalization. Two-fold changes and p ≤ 0.05 were selected as thresholds in the supervised data analysis. Gene expression changes induced by the combined treatment were calculated over the vehicle- or the single agent-treated samples. Gene set enrichment analysis (GSEA) was performed by GSEA software (Broad Institute), by comparing single agent exposure or drug combination with vehicle-treated cells. False discovery rate (FDR) ≤ 0.05 was used as cut-off for significance. Gene expression data are available in the Gene Expression Omnibus (GEO) repository, under the accession number GSE156182.

2.7. Analysis of Public GEP and RNA-Sequencing Cohorts

GSE6891 [46], GSE13159 [47] and The Cancer Genome Atlas (TCGA) [48] AML data were retrieved from the GEO repository (https://www.ncbi.nlm.nih.gov/gds) and the Genomic Data Commons (GDC) Data Portal (https://gdc.cancer.gov), respectively. Array data were normalized using Transcriptome Analysis Console Software (version 4.0.1) with Robust Multichip Average (RMA) normalization. Read counts from the TCGA dataset were transformed to Counts Per Million (CPM) using calcNormFactors (method = “TMM”) function in edgeR (v3.24.1, R v3.5.1).

2.8. Western Blots Analysis

After 16h treatment, 5 × 10⁶ cells from MOLM-13, OCI-AML3, MV-4-11, HEL, KASUMI-1 and NOMO-1 were collected and total protein extracts were prepared in RIPA lysis buffer, containing protease inhibitor cocktail 1X, sodium orthovanadate 1 mM and PMSF 2 mM (Santa Cruz Biotechnology, Dallas, TX, USA). Protein extract concentrations were quantified using the Bicinchoninic Acid (BCA) protein assay kit (Bio-Rad Laboratories). Proteins (30 µg) were loaded on 4–20% Mini-Protean TGX stain-free precast gels (Bio-Rad, Laboratories), blotted on nitrocellulose membranes using a TransBlot Turbo system (Bio-Rad Laboratories) and incubated overnight with primary antibodies, after 1 h blocking in Tris-buffered saline with 0.1% Tween-20 (TBS-T) plus 5% dry milk. The following primary antibodies were used: anti-WIP1 (#SC20712) from Santa Cruz Biotechnology; anti-p53 (PAb 140, NB 200-103) from Novus Biological (Centennial, CO, USA); anti-MDM2 (D1V2Z), anti-p21 WAF1/Cip1 (12D1), all from Cell Signaling (Danvers, MA, USA); anti-β-actin from Sigma-Aldrich. Horseradish peroxidase-conjugated anti-rabbit (NA934) and anti-mouse (NA931) IgG (GE Healthcare) were used as secondary antibodies. β-actin (clone AC-15, Abcam, Cambridge, UK) was used as loading control. The signal was detected using the enhanced chemi-luminescence kit (GE Healthcare) and the ChemiDoc MP system (Bio-Rad Laboratories). Data were analyzed by ImageJ 1.52v software (NIH, Bethesda, MD, USA).

2.9. Statistical Analyses

Data are presented as mean ± standard deviation (SD) or median and minimum-to-maximum values for continuous variables, or natural frequencies and percentages for categorical ones.
Normality was assessed by means of the Shapiro-Wilk test. The association between clinical or molecular variables and PPM1D expression was performed using Wilcoxon-Mann-Whitney test or the Kruskal Wallis test, as appropriate. When multiple comparisons were performed, p-values adjusted by using the Bonferroni method. One-way analysis of variance (ANOVA) with Dunnett’s post-hoc test wasperformed to compare cell viability, apoptosis and protein expression on multiple groups; Welch t-test was used to compare two groups. Statistical analyses were performed using GraphPad 8.0.1 software (GraphPad Inc., San Diego, CA, USA) and R (v3.4.1).

3. Results

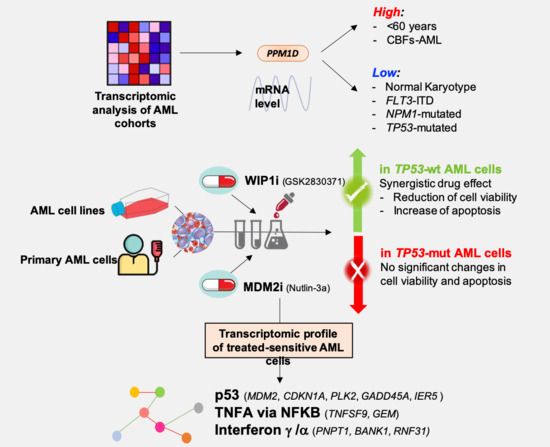
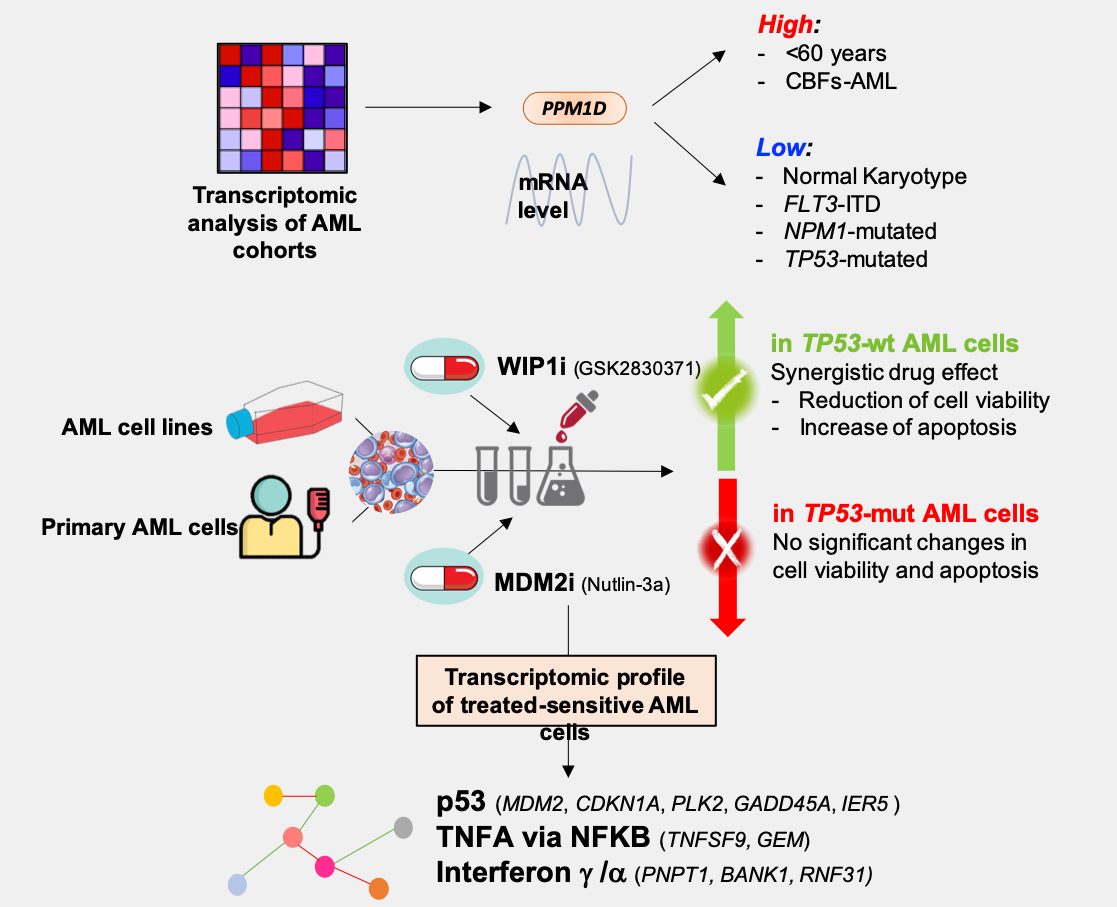
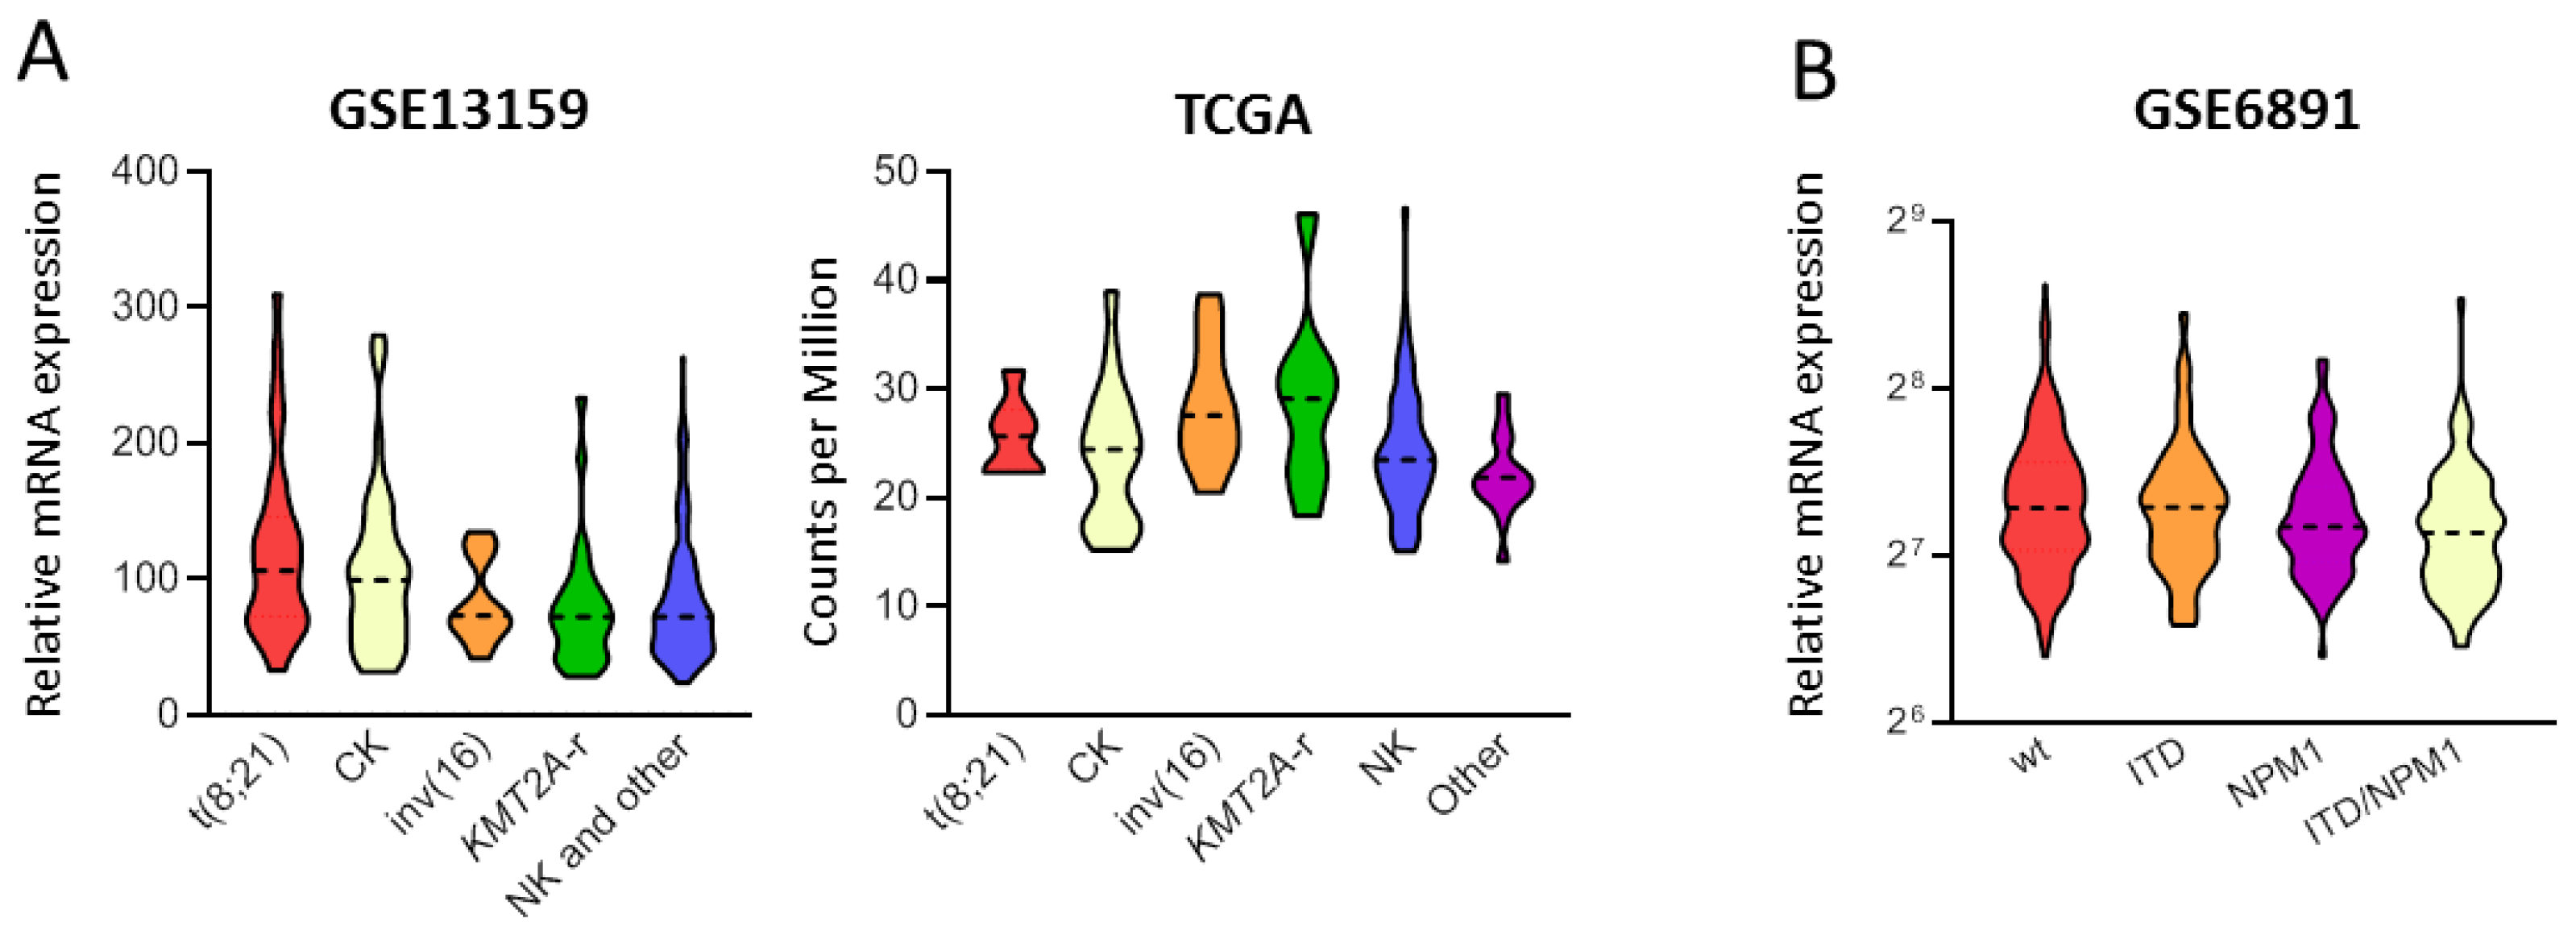
3.1. PPM1D mRNA Levels Differ among Age, Cytogenetic and Mutational Subgroups in AML

To investigate the expression of PPM1D across different AML subtypes and its correlation with clinical features, we analyzed 3 independent public transcriptomic cohorts with available clinical (age, disease type) and/or molecular (karyotype, mutations) data. PPM1D expression was higher in younger AML patients compared to the elderly (GSE6891, p = 0.03; TCGA, p = 0.004; Table 1). Moreover, we observed variation in PPM1D levels among cytogenetic subgroups (Kruskal Wallis test, TCGA p = 0.031; GSE13159, p < 0.001, Figure 1A), with higher expression in t(8;21) and inv(16)/t(16;16) cases and lower expression in normal karyotype AML in both the two independent cohorts. In addition, KMT2A-rearranged and complex karyotype AML showed high PPM1D expression in the TCGA and the GSE13159 datasets, respectively.
We then analyzed PPM1D expression according to the mutational status of AML-related genes (Table 1). We did not identify differences according to mutations in CEBPA, DNMT3A, KRAS/NRAS, IDH1, IDH2, ASXL1 and RUNX1. However, PPM1D expression was lower in FLT3-ITD AML compared with wt-cases (GSE6891, p = 0.017) and in NPM1-mut cases compared with wt-ones (GSE6891, p = 0.002). Therefore, we classified AML according to the combination of FLT3-ITD and NPM1 mutations and evaluated PPM1D expression across the subgroups (Kruskal Wallis test, GSE6891 p = 0.009). We observed that NPM1-mut AML displayed lower PPM1D expression, irrespective of FLT3 mutational status (Figure 1B). AML cases carrying TP53 mutations had lower PPM1D levels (Kruskal Wallis test, p = 0.007) in the TCGA dataset (TP53 mutational data were not available from the other cohorts).
We then analyzed WIP1 protein expression in a panel of TP53-wt (MV-4-11, OCI-AML3 and MOLM-13) and TP53-mut cells (NOMO-1, KASUMI-1 and HEL). In line with data from public cohorts, we observed high WIP1 levels in one of the KMT2A-rearranged models (MOLM-13) and in the t(8;21) KASUMI-1 cell line, intermediate levels in NPM1-mut OCI-AML3 cells and very low expression in the other TP53-mut models (NOMO-1 and HEL, Figure S1).
Overall, these data indicate that PPM1D expression is heterogeneous in AML and it varies according to cytogenetic and molecular status.

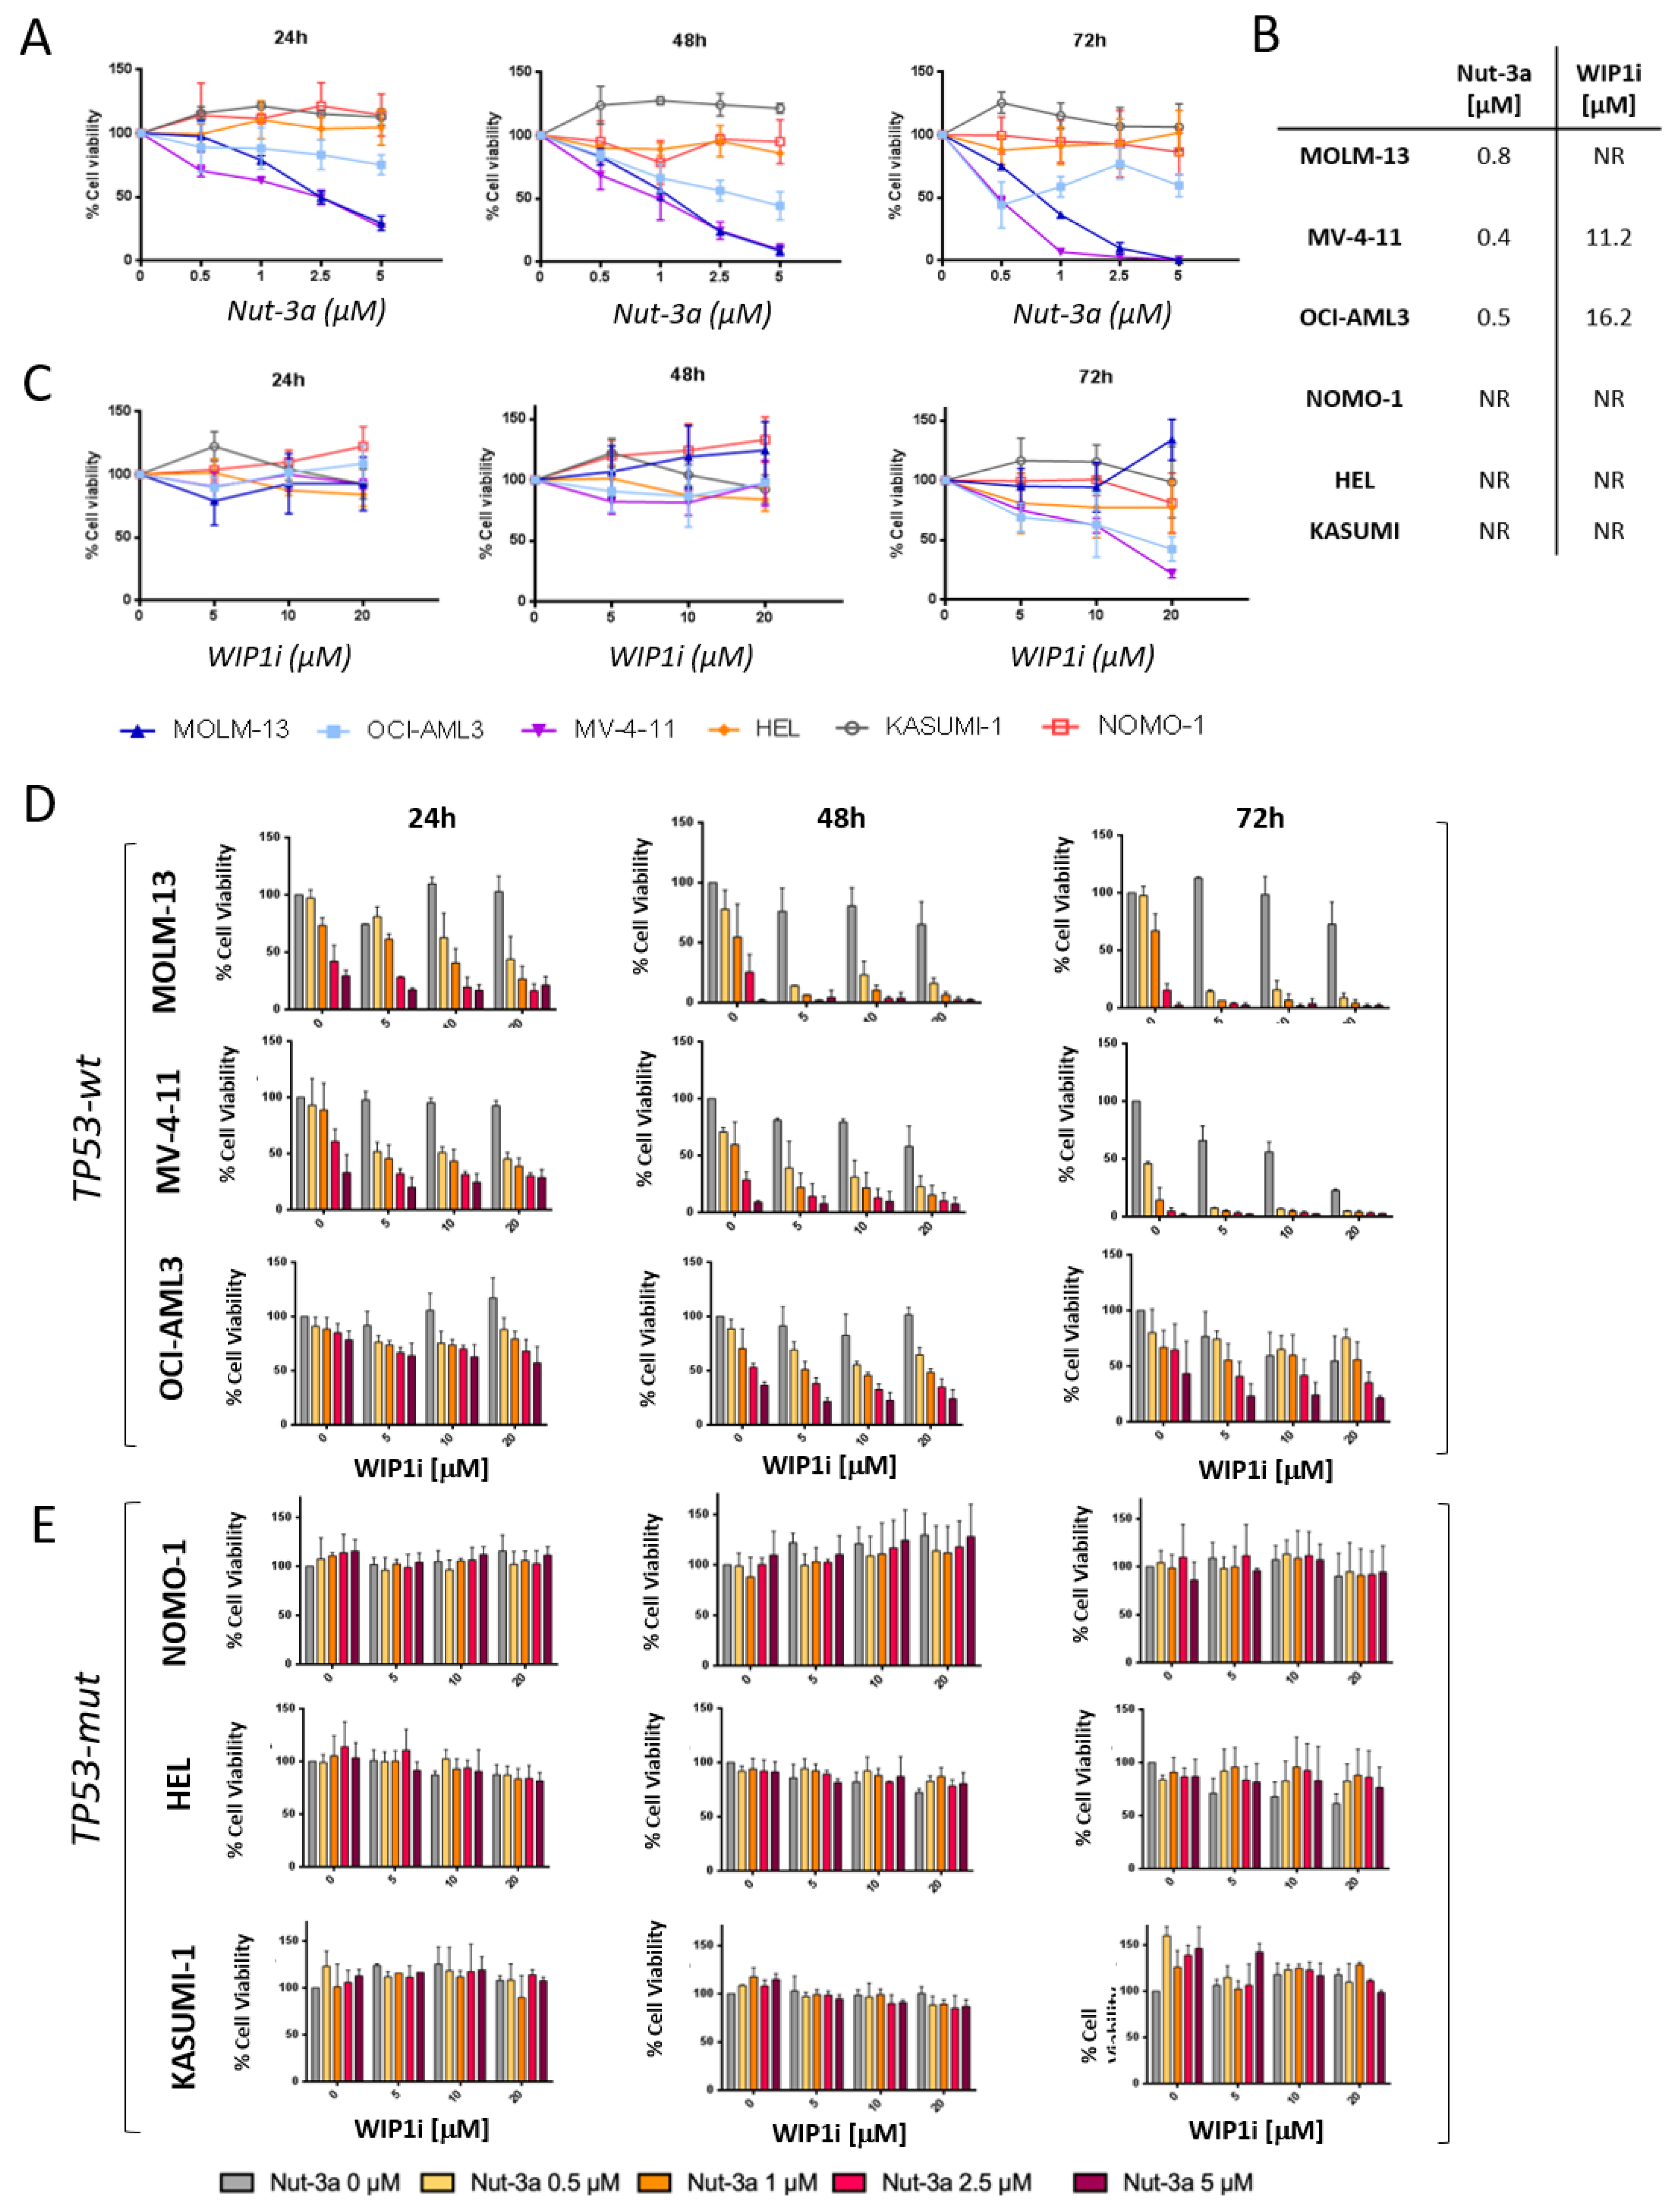
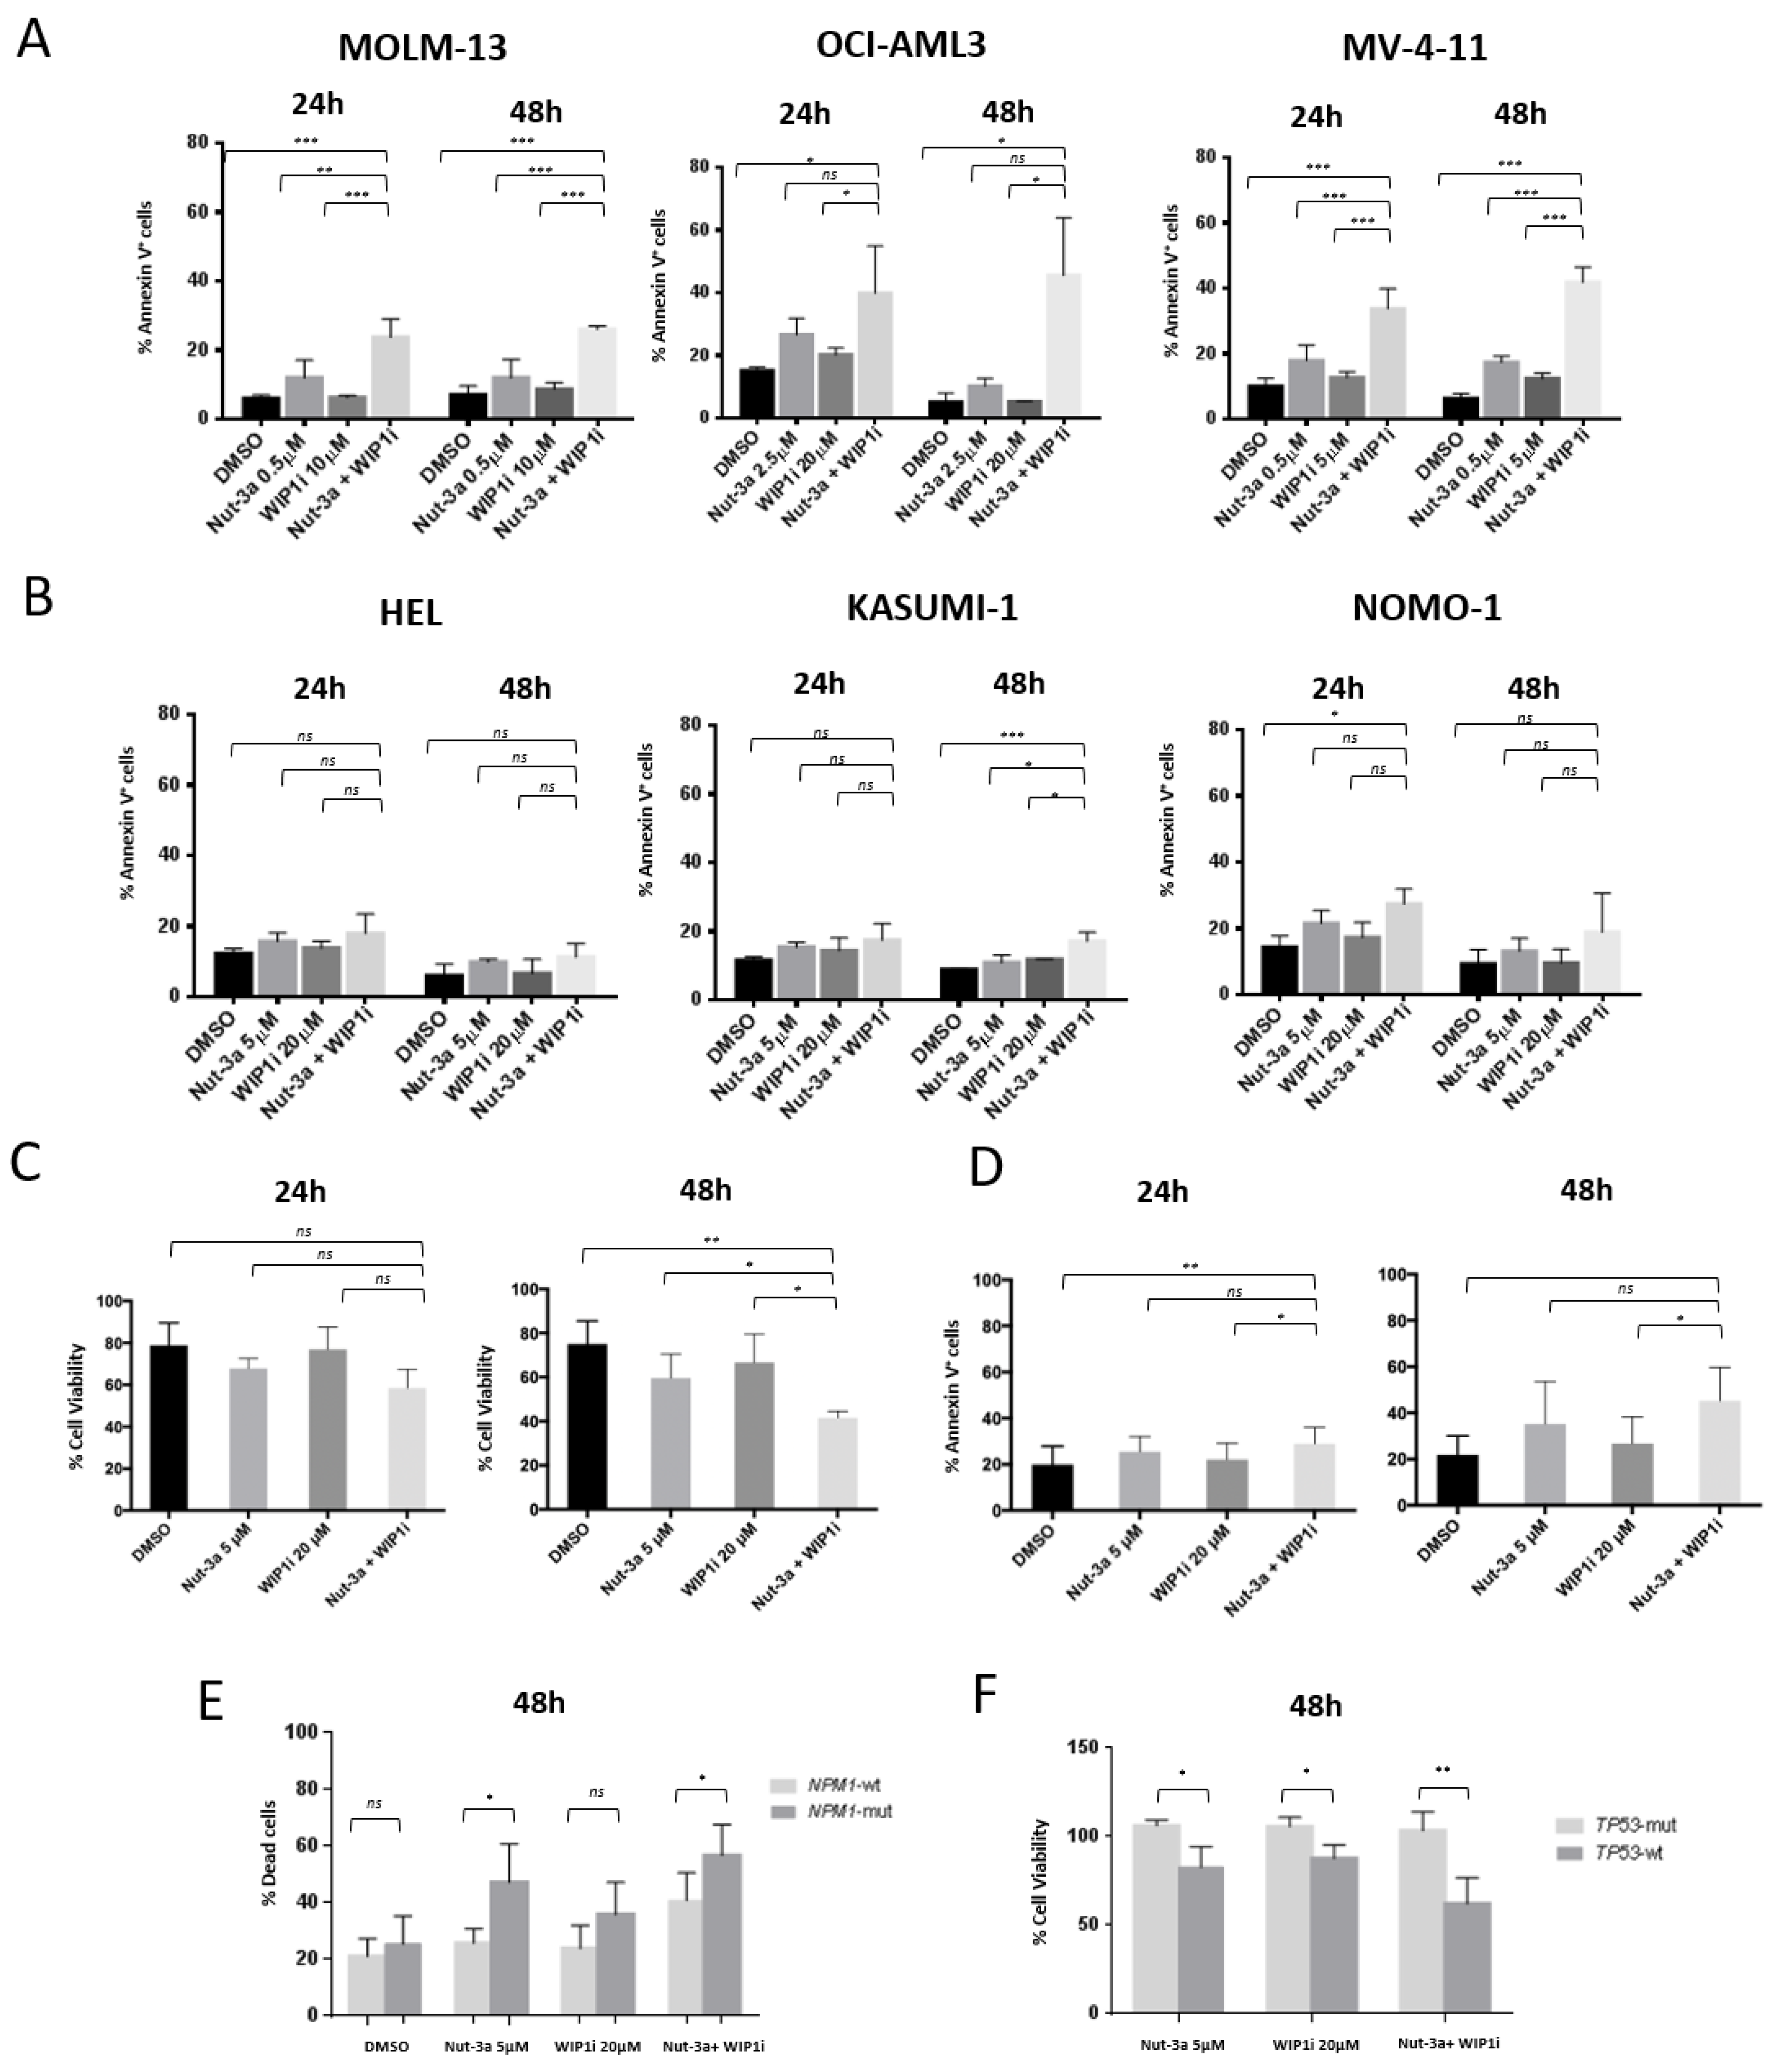
3.2. Combined Inhibition of Nut-3a and WIP1i Synergistically Reduces AML Cells Viability

To investigate whether p53 activation via simultaneous inhibition of WIP1 and MDM2 may be a valuable therapeutic strategy in AML, we performed in vitro preclinical assays. Single agent Nut-3a did not reduce cell viability in the TP53-mut cells, while showing a time and dosage-dependent effect in all the TP53-wt cells (Figure 2A), with IC50 values below 1 µM at 72 h (Figure 2B). We observed a cell viability reduction at 72 h of 97.4% and 99.3% (MV-4-11, p < 0.01), of 88.9% and 99.4% (MOLM-13, p < 0.001), of 23% and 40.3% (OCI-AML3, p < 0.01) at 2.5 and 5 µM of Nut-3a drug concentrations, respectively. OCI-AML3, along with MV-4-11, showed a better response to single agent WIP1i, with a significant decrease of cell viability at 72 h: 52.2% and 57.6% (OCI-AML3, p < 0.01); 37.9% and 78.2% (MV-4-11, p < 0.001) at the highest doses (10 and 20 µM, respectively, Figure 2C). WIP1i as single agent did not significantly affected MOLM-13, HEL, KASUMI-1 and NOMO-1 cell viability (Figure 2B,C).
We then tested the efficacy of the drug combination by incubating AML cell lines with Nut-3a and WIP1i for 24, 48 and 72 h. The combined treatment reduced the viability of TP53-wt cells (Figure 2D), while sparing the TP53-mut ones that remained insensitive (Figure 2E). The combination index analyses showed a synergic (or additive, according to dosages) effect of Nut-3a and WIP1i combination in MOLM-13, MV-4-11 and OCI-AML3, especially using low Nut-3a doses (Table S1).

3.3. WIP1i Sensitizes TP53-wt AML Cells to Nut-3a-Induced Apoptosis

To further investigate the mechanism of action of the drug combination, induction of apoptosis was evaluated. Based on the combination index analysis, cell lines were treated with different concentrations of Nut-3a and WIP1i (2.5 and 20 µM for OCI-AML3; 0.5 and 5 µM for MV-4-11; 0.5 and 10 µM for MOLM-13; 5 and 20 µM for HEL, KASUMI-1 and NOMO-1, respectively) for 24 and 48 h. We detected a significant increase in the percentage of apoptotic cells in the TP53-wt MOLM-13 and MV-4-11 cell lines, when simultaneously treated with the two drugs, compared with vehicle or single agent exposure at 48 h (Annexin-V+ MOLM-13 cells: drug combination, 26 ± 1%, Nut-3a, 12 ± 5.3%, WIP1i, 8.7 ± 2%, DMSO, 7.1 ± 2.5%; Annexin-V+ MV-4-11 cells: drug combination, 41.8 ± 4.7% Nut-3a, 17.4 ± 1.9%, WIP1i, 12.3 ± 1.7%, DMSO 6.2 ± 1.5%; Figure 3A). OCI-AML3 showed an enhanced apoptotic response to the combined treatment when compared with WIP1i alone or vehicle and a trend towards increased apoptosis compared with Nut-3a as single agent (Figure 3A). In line with the cell viability results, apoptosis of NOMO-1, HEL and KASUMI-1 cells were barely affected by the combined treatment at 48 h (18.9 ± 11.7%, 11.3 ± 3.8% and 17.1 ± 2.6% of Annexin-V+ cells upon drug combination vs. Nut-3a: 13.2 ± 3.8%, 9.9 ± 0.9% and 10.9 ± 2.2%; WIP1i: 9.6 ± 4.2%, 6.6 ± 4.1% and 11.8 ± 1.1%; vehicle: 9.3 ± 4.4%, 6 ± 3.2% and 8.9 ± 0.1% for NOMO-1 and HEL, respectively, Figure 3B).
These results were validated in primary TP53-wt AML cells (Table S2) in ex vivo assays. After 48 h, the combination of WIP1i and Nut-3a induced a significant decrease of cell viability compared to single agents or vehicle treatment (Figure 3C). This was accompanied by a progressive increase of apoptotic cells in the combined treatment at 48 h (45.2 ± 14.6%, compared with 35 ± 18.4% of Nut-3a, 27 ± 11.5% of WIP1i-treated samples and 21.8 ± 8.2% of control cells, Figure 3D). Of note, NPM1-mut AML showed a higher ex vivo sensitivity to Nut-3 and to the combined treatment compared with NPM1-wt cells at 48 h (Nut-3a: p = 0.020; drug combination: p = 0.040, Figure 3E). Conversely, primary TP53-mut leukemic cells neither responded to single agent nor to the combined treatment (Figure 3F).

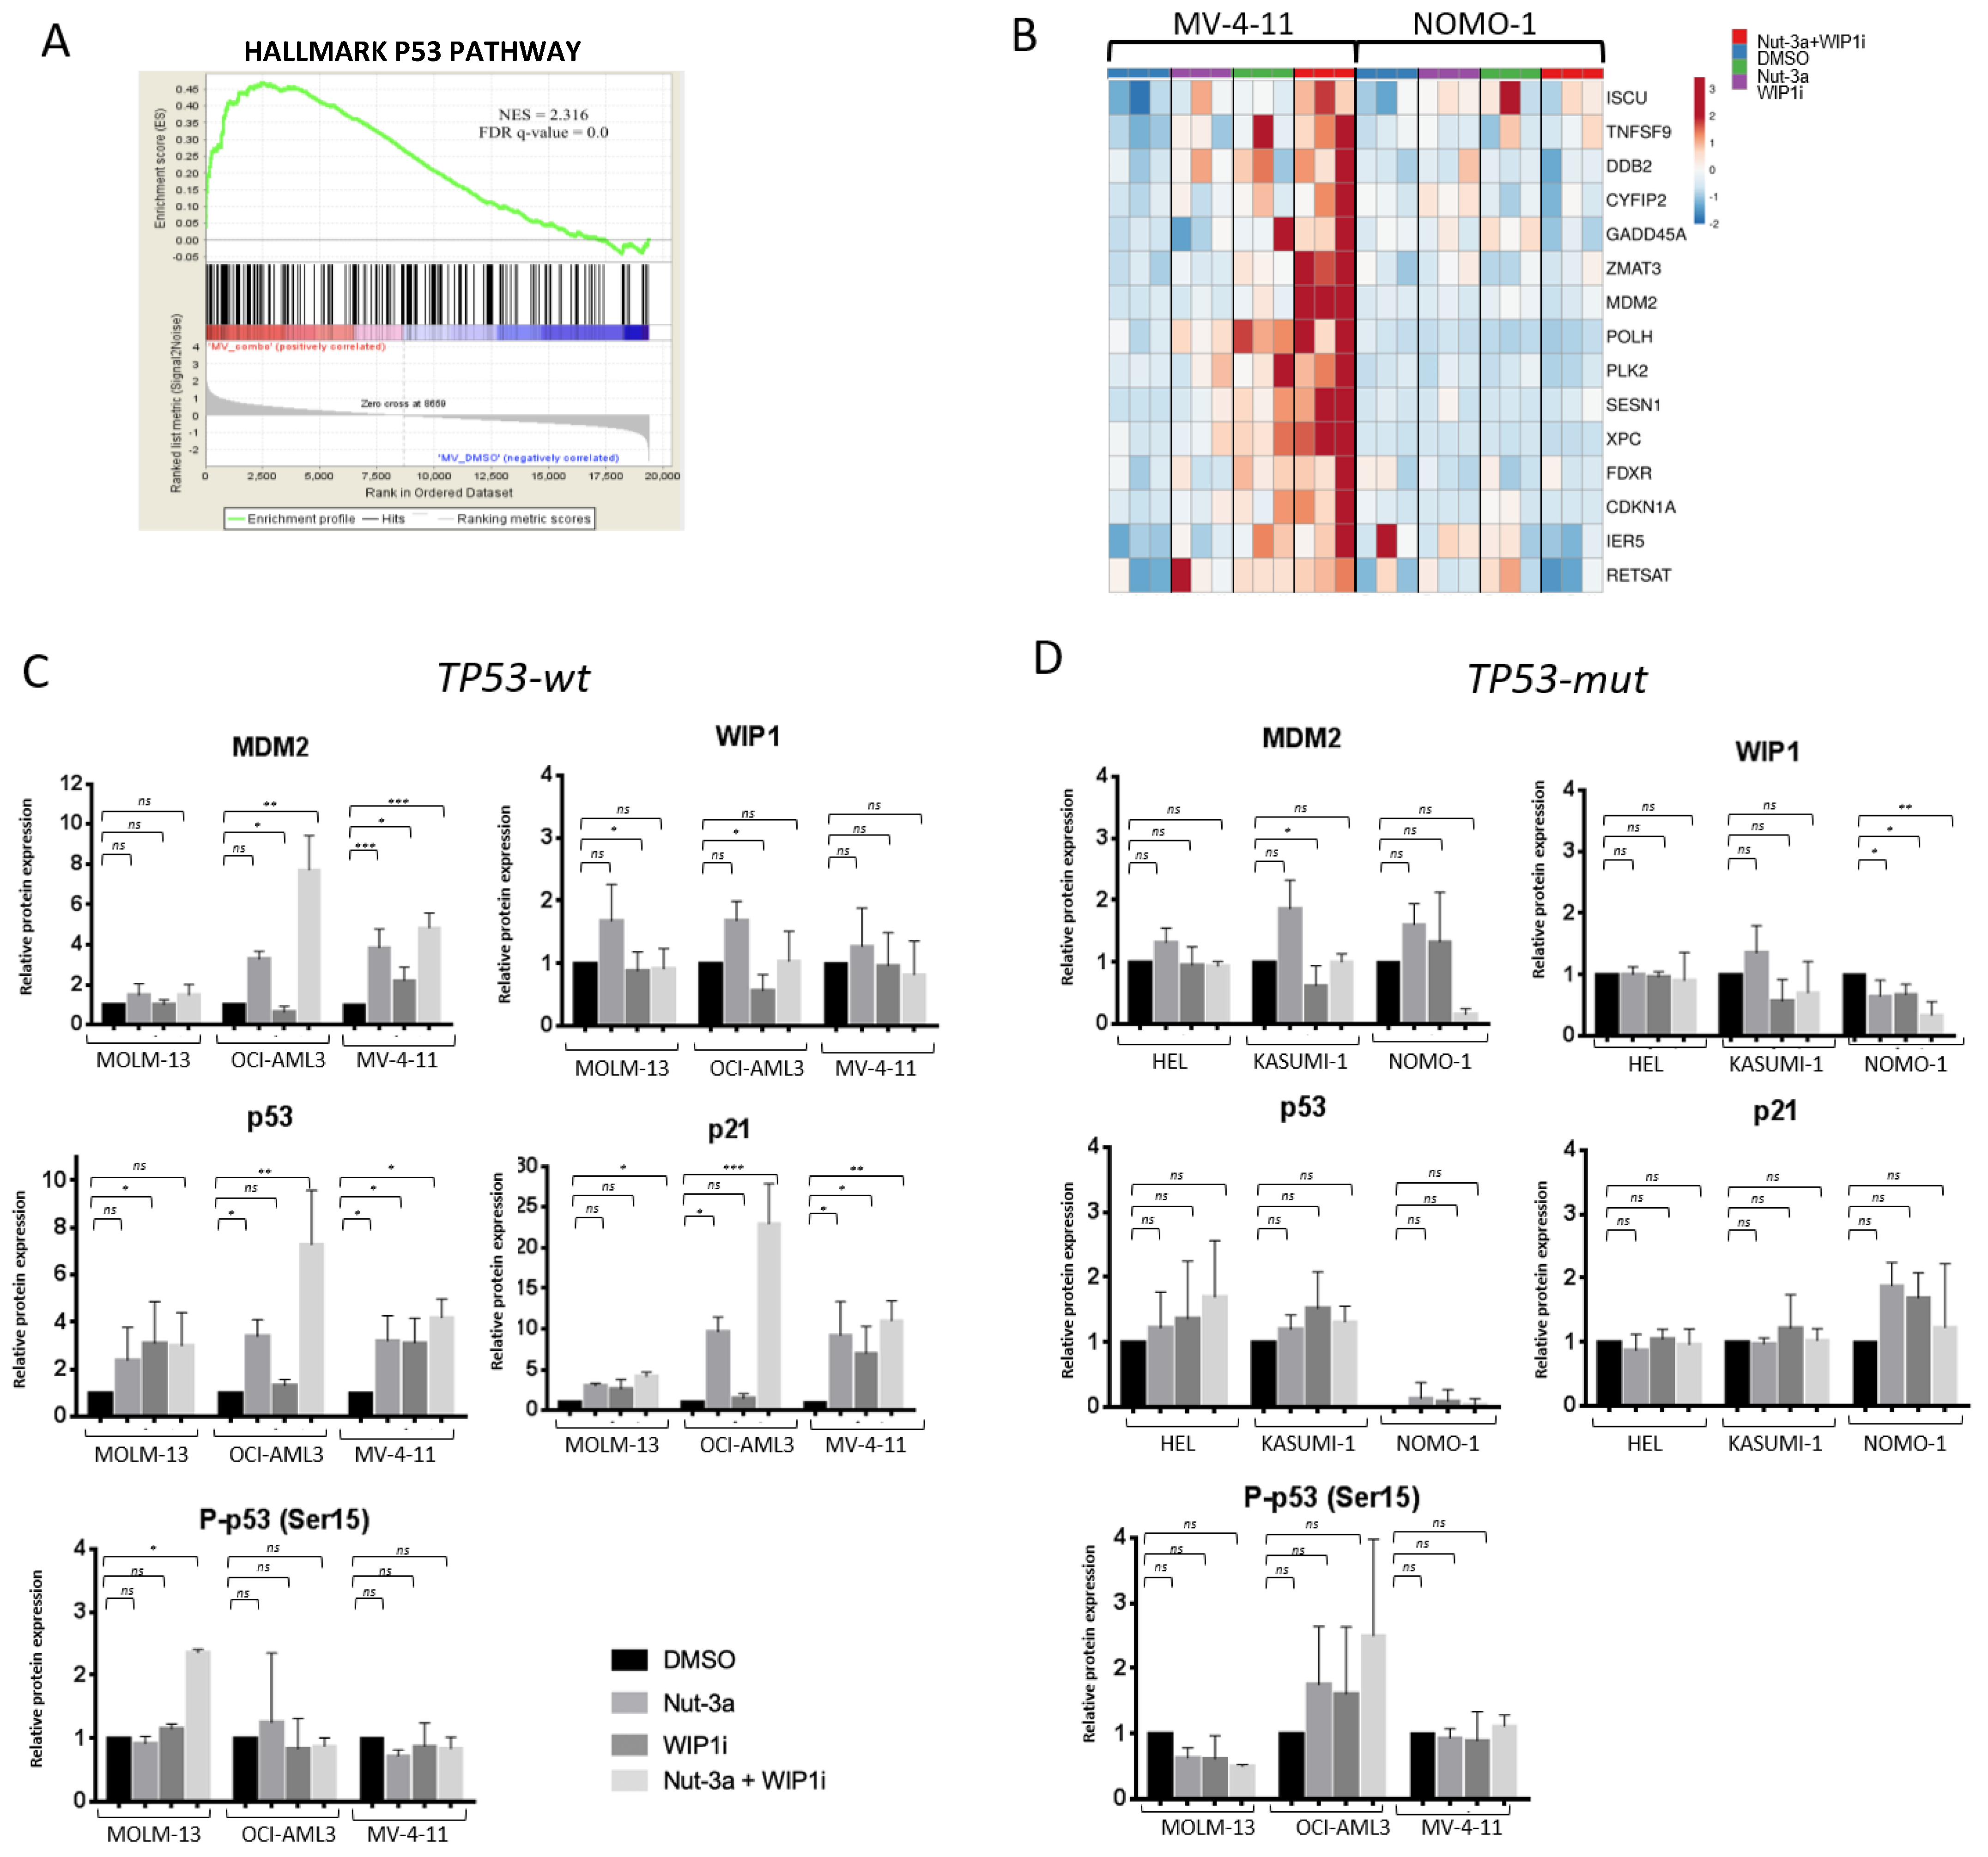
3.4. The Inhibition of WIP1 and MDM2 Altered the Expression of p53 Pathway-Related Genes in TP53-wt Cells

To elucidate changes in the transcriptional program of AML cells induced by Nut-3a and WIP1i combination, we performed gene expression analysis on representative TP53-wt and TP53-mut cell lines (MV4-11 and NOMO1) after 16h of treatment. This time point allowed the evaluation of transcriptional changes (Table S3–S8), avoiding excessive cell death. The analyses of differentially expressed genes showed enrichment of a p53 signature in MV-4-11 cells treated with the drug combination (vs. control, Normalized Enrichment Score (NES) = 2.32, FDR ≤ 0.001 Figure 4A) and in those treated with either Nut-3a or WIP1i as single agents (vs. vehicle (Nut-3a vs. DMSO: NES = 2.13, FDR ≤ 0.001; WIP1i vs. DMSO: NES = 1.49, FDR = 0.02, Figure S2A,B). Significantly upregulated genes belonging to this signature or annotated as bona fide p53 targets included MDM2, CDKN1A, PLK2, GADD45A, IER5 (Figure 4B). Overall, 33 genes from the signature or annotated as bona fide p53 targets [49] were upregulated in MV-4-11 cells, while only 3 genes showed increased expression in NOMO-1 cells treated with the drug combination (vs. control, Table S9).
The protein level p53 and of key signature genes (MDM2 and CDKN1A) was evaluated in the whole panel of cell lines, along with WIP1. The overexpression of MDM2 and p21 was confirmed by immunoblot analysis in MOLM-13, OCI-AML3 and MV-4-11 cells (single agents and/or combination, Figure 4C and Figure S3). Moreover, p53 protein levels were increased by all drug treatments in the TP53-wt cells. Conversely, in the TP53-mut models, p53 protein was barely detectable in NOMO-1 cells and was not significantly altered by the treatments also in HEL and KASUMI-1 (Figure 4D and Figure S3). Moreover, the p53 pathway was not affected in the TP53-mut cell lines, except for MDM2 downregulation in KASUMI-1 cells under WIP1i pressure (and a trend in NOMO1 cells when exposed to the drug combination) and WIP1 reduction in NOMO-1 treated cells. Finally, WIP1 protein showed a trend towards increased expression after Nut-3a treatment in the TP53-wt cells, (Figure 4C and Figure S3), while being downmodulated by the drugs and their combination in NOMO1 cells (Figure 4D and Figure S3).

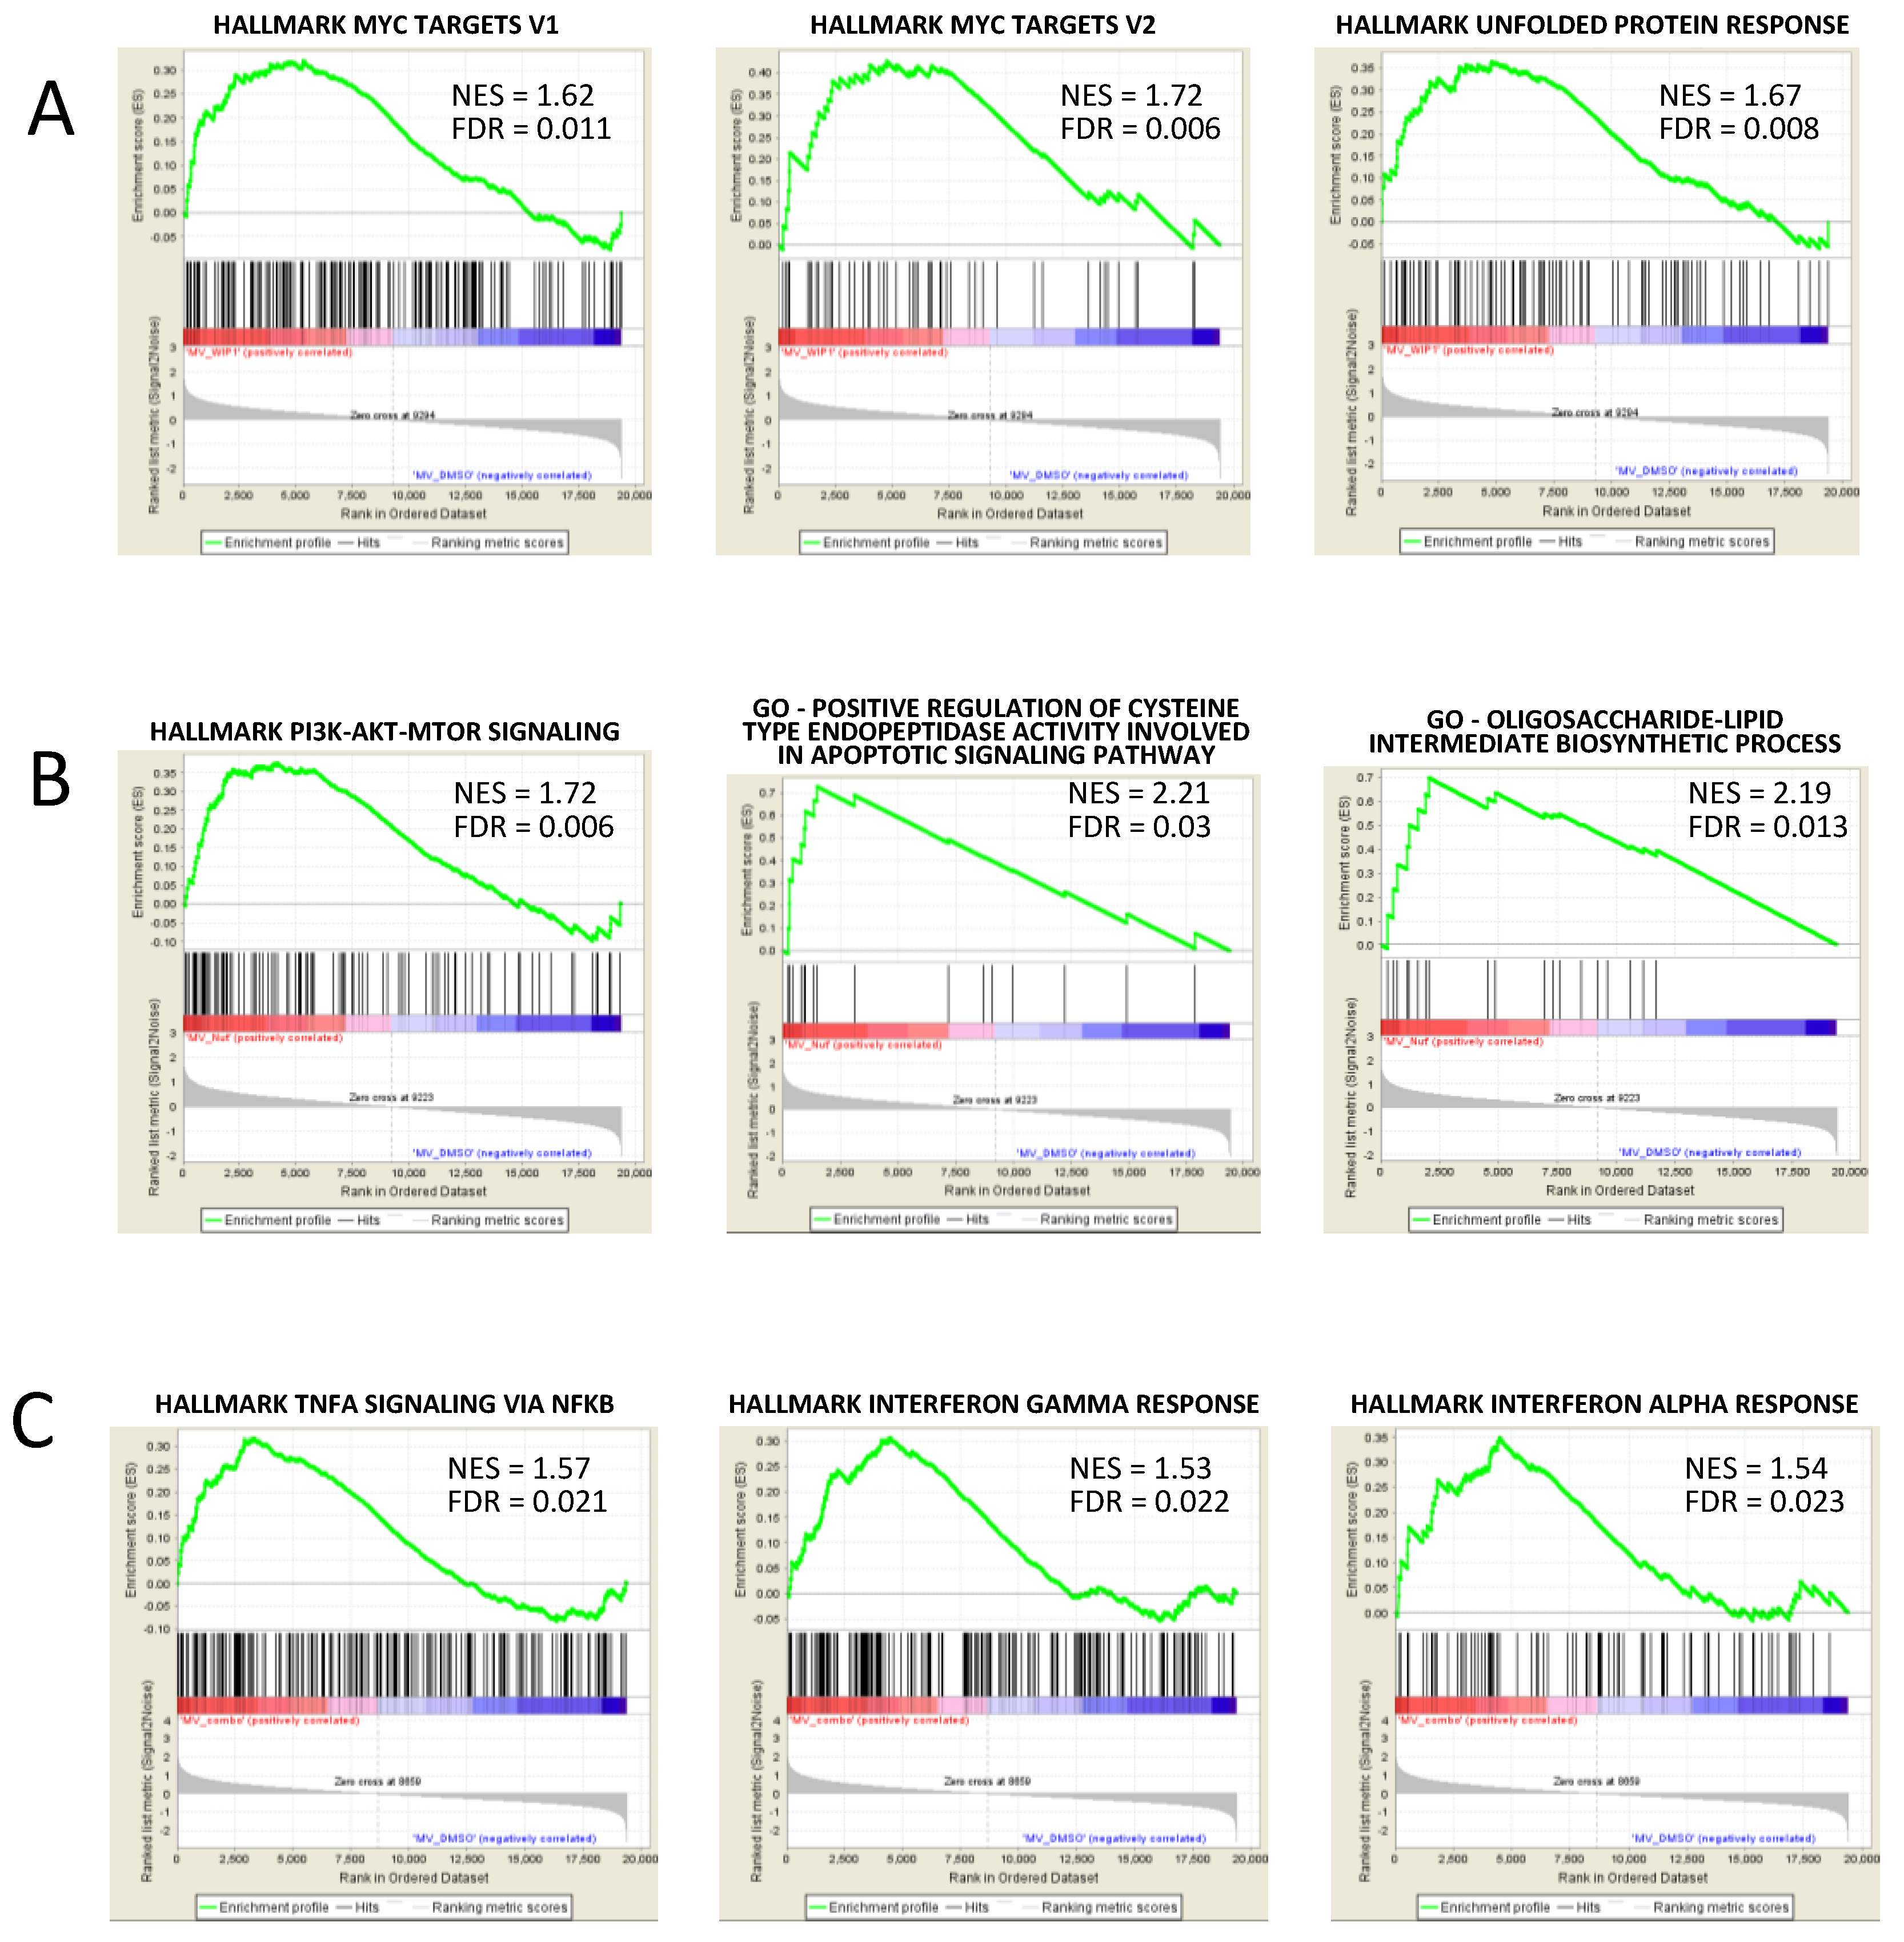
3.5. GSEA Analysis Showed the Enrichment of Single Agent- and Drug Combination-Specific Genes and Pathways in MV-4-11 and NOMO-1 Cells

Additional treatment-specific pathways were enriched upon drug exposure in the two cell lines selected for GEP analyses (Table 2), suggesting other mechanistic information, with differences between TP53-wt and TP53-mut cells. Single agent treatment with WIP1i in MV-4-11 showed enrichment of MYC targets (e.g., upregulation of SRSF1, RUVBL2, NIP7, PHB and downregulation of PSMC4) and unfolded protein response (e.g., upregulation of CXXC1 and CALR, Figure 5A). Gene expression changes induced by Nut-3a treatment led to enrichment of the following drug-specific signatures in MV-4-11: PI3K-mTOR signaling (e.g., upregulated MAP3K7, RAC1, MAPKAP1, PPP1CA), which can be involved in cell cycle and metabolism regulation, as oligosaccharide-lipid intermediate biosynthetic process (upregulated ALG3, MPDU1); positive regulation of cysteine-type endopeptidase activity involved in apoptotic signaling (upregulated TNFRSF10B, BAX, Figure 5B). In MV-4-11 cells, combined Nut-3a and WIP1i treatment, but not single agent exposure, led to enrichment of signatures of TNFA signaling via NFKB (e.g., TNFSF9, GEM upregulated); interferon-γ response (e.g., PNPT1, BANK1 upregulated) and interferon-α response (PNPT1 and RNF31 upregulated, Figure 5C), suggesting the induction of an inflammatory status.
In NOMO-1 cells, WIP1 inhibition had mild effects, with no enriched gene sets compared with control cells. Conversely, MDM2 inhibition and the drug combination led to upregulation of inflammatory signatures response (e.g., IL7R and TNFRSF9 upregulated) and TNFA signaling via NFKB (e.g., IER3, PHLDA1 upregulated, Figure S2C,D and Table 3).

4. Discussion

PPM1D is an emerging oncogene strictly related to the p53 pathway and involved in clonal hematopoiesis and AML pathogenesis [25,28,29,50]. WIP1, the protein encoded by PPM1D, is overexpressed in many solid tumors, conferring a poor prognosis [16,51,52], while its deficiency causes defects in hematopoietic differentiation, immune system and inflammation [53]. To better understand the functional role of WIP1 in AML and explore its therapeutic potential in drug combinations, we combined the analysis of gene expression datasets and in vitro/ex vivo preclinical data.
Although a recent study suggested that PPM1D may be highly expressed in poor risk AML cases [54], our results from at least 2 independent cohorts, showed high PPM1D levels in core binding factor AML and heterogeneous levels in cases with high risk and complex karyotype. Moreover, patients carrying TP53 mutations were characterized by lower PPM1D expression compared with wt-ones. Since a feedback-regulatory loop regulates PPM1D and p53, an impaired p53 activity, which is a feature of complex karyotype AML [35,36], may result in PPM1D expression changes.
PPM1D expression was also lower in NPM1-mut patients compared with NPM1-wt cases. PPM1D is one of the main actors in nucleolar formation through sequential phosphorylation of NPM1 [55]. Phosphorylation of cytoplasmic NPM1 at the Threonine 199 residue is important during mitotic progression, by preventing centrosome reduplication, thus reducing genotoxic stress conditions that may activate PPM1D expression [55,56]. In our ex vivo tests, NPM1-mutated AML cells showed an increased sensitivity to Nut-3a and the drug combination compared with NPM1-wt cases (excluding TP53-mut patients), suggesting a potential vulnerability.
Several studies have proven the efficacy of the MDM2 inhibitor Nut-3a in combination with chemotherapeutic and targeted agents [38,39,40]. Here, we demonstrated that the pharmacological inhibition of WIP1 synergizes with Nut-3a in TP53-wt AML cells promoting a significant induction of apoptosis (Figure 6A,B). The comparison between combined and single agent treatments highlighted a significant decrease of cell viability in MOLM-13, MV-4-11 and OCI-AML3 models and a strong induction of apoptosis. The NPM1-mut OCI-AML3 cell line showed a good response to WIP1i alone and a high percentage of apoptosis when treated with the drug combination. On the contrary, TP53-mut HEL, KASUMI-1 and NOMO-1 cells were insensitive to the tested treatments, as confirmed in primary samples. Gene and protein expression changes induced by drug treatment of the TP53-wt cell lines revealed a cooperation between Nut-3a and WIP1i in the stabilization of p53 protein level and activity, with activation of a p53 signature and upregulation of its downstream partners, including p21 and MDM2. In the resistant cells p53 and p21 proteins were not affected by the treatments, while WIP1 and MDM2 showed cell line-dependent changes, the latter being in contrast with the results obtained in the sensitive models. Gene expression signatures analysis highlighted additional pathway alterations induced by Nut-3a or WIP1i single agent and combined treatments. In particular, MDM2 inhibition led to enrichment of inflammatory signatures response- and NFKB-related genes in TP53-mut cells that was observed upon combined treatment in the TP53-wt cells [57]. These changes may alter the crosstalk between leukemic cells and the microenvironment and provide the rationale for novel drug combinations acting on the malignant cells and the immune response.
Overall, based on our results we hypothesize that the upregulation of MDM2 and the induction of MYC-related signatures mediated by WIP1 inhibition in TP53-wt cells may enhance cell sensitivity to Nut-3a [58,59]. MDM2 is also a potential marker of response to the drug combination, as previously observed for Nut-3a treatment [41]. Furthermore, our data suggest that, at least in some models, the combined treatment can stabilize the p53-phosphorylated form, which in turn is able, in cells expressing wildtype p53, to propagate the stress-mediated response by activating downstream targets and triggering apoptosis (Figure 6A,B) [60].
In conclusion, here we proposed a novel therapeutic strategy for TP53-wt AML based on the synergistic combination of Nut-3a and WIP1i and unraveled the transcriptomic changes induced by WIP1i alone or in combination with Nut-3a in AML cells. Future in vivo studies are needed to confirm these preclinical data and test the toxicity of the combined WIP1 and MDM2 inhibition. A large fraction of AML cases, in particular aneuploid and complex karyotype, has structurally intact but dysfunctional p53. In these patients, WIP1 inhibition may potentially improve the efficacy of novel experimental agents.

Supplementary Materials

The following are available online at https://www.mdpi.com/article/10.3390/biomedicines9040388/s1, Table S1: Combination index analysis of TP53-wt AML cells, Table S2: Characteristics of primary AML samples, Table S3: Top 20 upregulated (red) and downregulated (blue) genes in MV-4-11 cells treated with Nut-3a+WIP1i vs. control, Table S4: Top 20 upregulated (red) and downregulated (blue) genes in NOMO-1 cells treated with Nut3a+WIP1i vs. control, Table S5: Top 20 upregulated (red) and downregulated (blue) genes in MV-4-11 cells treated with Nut3a+WIP1i vs. WIP1i, Table S6: Top 20 upregulated (red) and downregulated (blue) genes in NOMO-1 cells treated with Nut3a+WIP1i vs. WIP1i, Table S7: Top 20 upregulated (red) and downregulated (blue) genes in MV-4-11 cells treated with Nut3a+WIP1i vs. Nut-3a, Table S8: Top 20 upregulated (red) and downregulated (blue) genes in NOMO-1 cells treated with Nut3a+WIP1i vs. Nut-3a, Table S9: P53 target and signature genes that are significantly upregulated in MV-4-11 or NOMO-1 cells treated with Nut-3a+WIP1i vs. control; Figure S1: WIP1 protein expression in AML cell lines, Figure S2: Additional transcriptional signatures in single and combined-treatment enriched in MV-4-11 and NOMO-1 cells, Figure S3 Expression changes of p53 and its related genes induced by the treatment in TP53-wt and TP53-mut cells.

Author Contributions

M.C.F. designed the study, performed experiments, analyzed the data and wrote the manuscript. J.N. performed experiments, analyzed the data and wrote the manuscript. A.G.L.d.R. designed the study, helped in data interpretation and wrote the manuscript. A.P., M.G. and A.F. performed experiments. E.P. performed statistical analyses. I.I. contributed to data interpretation and manuscript preparation. G.M. (Giovanni Marconi), S.S., C.P., A.C., E.A., M.B.G., M.R. and F.L. provided patients specimens and data. M.C. coordinated sample collection. G.M. (Giovanni Martinelli) supported the study design and data interpretation. G.S. designed the study, analyzed the data and wrote the manuscript. All authors have read and agreed to the published version of the manuscript.

Funding

This study was supported by “Associazione Italiana per la Ricerca sul Cancro” (AIRC-IG 19226 to G. Martinelli) and ERA PerMed (ERA Net Grant 779282 to G. Martinelli as a partner).

Institutional Review Board Statement

The study was conducted according to the guidelines of the Declaration of Helsinki, and approved by the Institutional Ethics Committee (Sant’Orsola-Malpighi Hospital, protocol 112/2014/U/Tess and Area Vasta Romagna, protocol 5805/2019).

Informed Consent Statement

Written informed consent has been obtained from the patients.

Data Availability Statement

Gene expression data are available in the Gene Expression Omnibus (GEO) repository, under the accession number GSE156182.

Acknowledgments

The authors would like to thank Lorenzo Ledda, Martina Pazzaglia, Matteo Bocconcelli, Roberta Napolitano, Maria Teresa Bochicchio for technical support and help; Eugenio Fonzi for bioinformatic help, Gastone Castellani for intellectual support and Gerardo Musuraca for help in providing patients specimens.

Conflicts of Interest

The authors declare no conflict of interest.

References

  1. Bhattacharya, D.; Hiregange, D.; Rao, B.J. ATR kinase regulates its attenuation via PPM1D phosphatase recruitment to chromatin during recovery from DNA replication stress signalling. J. Biosci. 2018, 43, 25–47. [Google Scholar] [CrossRef] [PubMed]
  2. Macurek, L.; Benada, J.; Müllers, E.; Halim, V.A.; Krejčíková, K.; Burdová, K.; Pecháčková, S.; Hodný, Z.; Lindqvist, A.; Medema, R.H.; et al. Downregulation of Wip1 phosphatase modulates the cellular threshold of DNA damage signaling in mitosis. Cell Cycle 2013, 12, 251–262. [Google Scholar] [CrossRef] [PubMed]
  3. Cha, H.; Lowe, J.M.; Li, H.; Lee, J.S.; Belova, G.I.; Bulavin, D.V.; Fornace, A.J. Wip1 Directly Dephosphorylates -H2AX and Attenuates the DNA Damage Response. Cancer Res. 2010, 70, 4112–4122. [Google Scholar] [CrossRef] [PubMed] [Green Version]
  4. Brazina, J.; Svadlenka, J.; Macurek, L.; Andera, L.; Hodny, Z.; Bartek, J.; Hanzlikova, H. DNA damage-induced regulatory interplay between DAXX, p53, ATM kinase and Wip1 phosphatase. Cell Cycle 2015, 14, 375–387. [Google Scholar] [CrossRef] [PubMed] [Green Version]
  5. Shreeram, S.; Demidov, O.N.; Hee, W.K.; Yamaguchi, H.; Onishi, N.; Kek, C.; Timofeev, O.N.; Dudgeon, C.; Fornace, A.J.; Anderson, C.W.; et al. Wip1 Phosphatase Modulates ATM-Dependent Signaling Pathways. Mol. Cell 2006, 23, 757–764. [Google Scholar] [CrossRef] [PubMed]
  6. Jaiswal, H.; Benada, J.; Müllers, E.; Akopyan, K.; Burdova, K.; Koolmeister, T.; Helleday, T.; Medema, R.H.; Macurek, L.; Lindqvist, A. ATM /Wip1 activities at chromatin control Plk1 re-activation to determine G2 checkpoint duration. EMBO J. 2017, 36, 2161–2176. [Google Scholar] [CrossRef]
  7. Choi, B.-K.; Fujiwara, K.; Dayaram, T.; Darlington, Y.; Dickerson, J.; Goodell, M.A.; Donehower, L.A. WIP1 dephosphorylation of p27 Kip1 Serine 140 destabilizes p27 Kip1 and reverses anti-proliferative effects of ATM phosphorylation. Cell Cycle 2020, 1–13. [Google Scholar] [CrossRef]
  8. Rodríguez, A.; Jesús Naveja, J.; Torres, L.; De Teresa, B.G.; Juárez-Figueroa, U.; Ayala-Zambrano, C.; Azpeitia, E.; Mendoza, L.; Frías, S. WIP1 contributes to the adaptation of fanconi anemia cells to DNA damage as determined by the regulatory network of the fanconi anemia and checkpoint recovery pathways. Front. Genet. 2019, 10, 411. [Google Scholar] [CrossRef] [Green Version]
  9. Lu, X. PPM1D dephosphorylates Chk1 and p53 and abrogates cell cycle checkpoints. Genes Dev. 2005, 19, 1162–1174. [Google Scholar] [CrossRef] [Green Version]
  10. Zhang, X.; Lin, L.; Guo, H.; Yang, J.; Jones, S.N.; Jochemsen, A.; Lu, X. Phosphorylation and Degradation of MdmX Is Inhibited by Wip1 Phosphatase in the DNA Damage Response. Cancer Res. 2009, 69, 7960–7968. [Google Scholar] [CrossRef] [Green Version]
  11. Lu, X.; Ma, O.; Nguyen, T.-A.; Jones, S.N.; Oren, M.; Donehower, L.A. The Wip1 Phosphatase Acts as a Gatekeeper in the p53-Mdm2 Autoregulatory Loop. Cancer Cell 2007, 12, 342–354. [Google Scholar] [CrossRef] [Green Version]
  12. Goloudina, A.R.; Kochetkova, E.Y.; Pospelova, T.V.; Demidov, O.N. Wip1 phosphatase: Between p53 and MAPK kinases pathways. Oncotarget 2016, 7, 31563. [Google Scholar] [CrossRef] [PubMed] [Green Version]
  13. Lindqvist, A.; de Bruijn, M.; Macurek, L.; Brás, A.; Mensinga, A.; Bruinsma, W.; Voets, O.; Kranenburg, O.; Medema, R.H. Wip1 confers G2 checkpoint recovery competence by counteracting p53-dependent transcriptional repression. EMBO J. 2009, 28, 3196–3206. [Google Scholar] [CrossRef] [PubMed] [Green Version]
  14. Castellino, R.C.; De Bortoli, M.; Lu, X.; Moon, S.-H.; Nguyen, T.-A.; Shepard, M.A.; Rao, P.H.; Donehower, L.A.; Kim, J.Y.H. Medulloblastomas overexpress the p53-inactivating oncogene WIP1/PPM1D. J. Neurooncol. 2008, 86, 245–256. [Google Scholar] [CrossRef] [Green Version]
  15. Bedognetti, D.; Hendrickx, W.; Marincola, F.M.; Miller, L.D. Prognostic and predictive immune gene signatures in breast cancer. Curr. Opin. Oncol. 2015, 27, 433–444. [Google Scholar] [CrossRef] [PubMed]
  16. Kleiblova, P.; Shaltiel, I.A.; Benada, J.; Ševčík, J.; Pecháčková, S.; Pohlreich, P.; Voest, E.E.; Dundr, P.; Bartek, J.; Kleibl, Z.; et al. Gain-of-function mutations of PPM1D/Wip1 impair the p53-dependent G1 checkpoint. J. Cell Biol. 2013, 201, 511–521. [Google Scholar] [CrossRef] [PubMed] [Green Version]
  17. Peng, T.-S.; He, Y.-H.; Nie, T.; Hu, X.-D.; Lu, H.-Y.; Yi, J.; Shuai, Y.-F.; Luo, M. PPM1D is a prognostic marker and therapeutic target in colorectal cancer. Exp. Ther. Med. 2014, 8, 430–434. [Google Scholar] [CrossRef] [Green Version]
  18. Li, K.; Liu, Y.; Xu, S.; Wang, J. PPM1D Functions as Oncogene and is Associated with Poor Prognosis in Esophageal Squamous Cell Carcinoma. Pathol. Oncol. Res. 2018. [Google Scholar] [CrossRef]
  19. Ma, D.; Zhang, C.-J.; Chen, Z.-L.; Yang, H. Prognostic value of PPM1D in 800 gastric cancer patients. Mol. Med. Rep. 2014, 10, 191–194. [Google Scholar] [CrossRef] [PubMed] [Green Version]
  20. Jiao, L.; Shen, D.; Liu, G.; Jia, J.; Geng, J.; Wang, H.; Sun, Y. PPM1D as a novel biomarker for prostate cancer after radical prostatectomy. Anticancer Res. 2014, 34, 2919–2925. [Google Scholar]
  21. Wang, Z.-P.; Chen, S.-Y.; Tian, Y. Wild-type p53-induced phosphatase 1 is a prognostic marker and therapeutic target in bladder transitional cell carcinoma. Oncol. Lett. 2017, 13, 875–880. [Google Scholar] [CrossRef] [PubMed] [Green Version]
  22. Li, G.-B.; Zhang, X.-L.; Yuan, L.; Jiao, Q.-Q.; Liu, D.-J.; Liu, J. Protein Phosphatase Magnesium-Dependent 1δ (PPM1D) mRNA Expression Is a Prognosis Marker for Hepatocellular Carcinoma. PLoS ONE 2013, 8, e60775. [Google Scholar] [CrossRef] [Green Version]
  23. Swisher, E.M.; Harrell, M.I.; Norquist, B.M.; Walsh, T.; Brady, M.; Lee, M.; Hershberg, R.; Kalli, K.R.; Lankes, H.; Konnick, E.Q.; et al. Somatic Mosaic Mutations in PPM1D and TP53 in the Blood of Women With Ovarian Carcinoma. JAMA Oncol. 2016, 2, 370–372. [Google Scholar] [CrossRef] [PubMed] [Green Version]
  24. Kim, B.; Won, D.; Lee, S.-T.; Choi, J.R. Somatic mosaic truncating mutations of PPM1D in blood can result from expansion of a mutant clone under selective pressure of chemotherapy. PLoS ONE 2019, 14, e0217521. [Google Scholar] [CrossRef]
  25. Hsu, J.I.; Dayaram, T.; Tovy, A.; De Braekeleer, E.; Jeong, M.; Wang, F.; Zhang, J.; Heffernan, T.P.; Gera, S.; Kovacs, J.J.; et al. PPM1D Mutations Drive Clonal Hematopoiesis in Response to Cytotoxic Chemotherapy. Cell Stem Cell 2018, 23, 700–713.e6. [Google Scholar] [CrossRef] [PubMed] [Green Version]
  26. Jaiswal, S.; Fontanillas, P.; Flannick, J.; Manning, A.; Grauman, P.V.; Mar, B.G.; Lindsley, R.C.; Mermel, C.H.; Burtt, N.; Chavez, A.; et al. Age-Related Clonal Hematopoiesis Associated with Adverse Outcomes. N. Engl. J. Med. 2014, 371, 2488–2498. [Google Scholar] [CrossRef] [PubMed] [Green Version]
  27. Genovese, G.; Kähler, A.K.; Handsaker, R.E.; Lindberg, J.; Rose, S.A.; Bakhoum, S.F.; Chambert, K.; Mick, E.; Neale, B.M.; Fromer, M.; et al. Clonal Hematopoiesis and Blood-Cancer Risk Inferred from Blood DNA Sequence. N. Engl. J. Med. 2014, 371, 2477–2487. [Google Scholar] [CrossRef] [PubMed] [Green Version]
  28. Xie, M.; Lu, C.; Wang, J.; Mclellan, M.D.; Kimberly, J.; Wendl, M.C.; Mcmichael, J.F.; Schmidt, H.K.; Miller, C.A.; Ozenberger, B.A.; et al. Age-related cancer mutations associated with clonal hematopoietic expansion. Nat. Med. 2015, 20, 1472–1478. [Google Scholar] [CrossRef] [PubMed]
  29. Kahn, J.D.; Miller, P.G.; Silver, A.J.; Sellar, R.S.; Bhatt, S.; Gibson, C.; McConkey, M.; Adams, D.; Mar, B.; Mertins, P.; et al. PPM1D truncating mutations confer resistance to chemotherapy and sensitivity to PPM1D inhibition in hematopoietic cells. Blood 2018, 132, 1095–1105. [Google Scholar] [CrossRef]
  30. Esfandiari, A.; Hawthorne, T.A.; Nakjang, S.; Lunec, J. Chemical Inhibition of Wild-Type p53-Induced Phosphatase 1 (WIP1/PPM1D) by GSK2830371 Potentiates the Sensitivity to MDM2 Inhibitors in a p53-Dependent Manner. Mol. Cancer Ther. 2016, 15, 379–391. [Google Scholar] [CrossRef] [Green Version]
  31. Zhang, M.; Xu, E.; Zhang, J.; Chen, X. PPM1D phosphatase, a target of p53 and RBM38 RNA-binding protein, inhibits p53 mRNA translation via dephosphorylation of RBM38. Oncogene 2015, 34, 5900–5901. [Google Scholar] [CrossRef] [PubMed] [Green Version]
  32. Wu, C.; Esfandiari, A.; Ho, Y.; Wang, N.; Mahdi, A.K.; Aptullahoglu, E.; Lovat, P.; Lunec, J. Targeting negative regulation of p53 by MDM2 and WIP1 as a therapeutic strategy in cutaneous melanoma. Nat. Publ. Gr. 2017, 118, 495–508. [Google Scholar] [CrossRef] [PubMed] [Green Version]
  33. Pechackova, S.; Burdova, K.; Benada, J.; Kleiblova, P.; Jenikova, G.; Macurek, L. Inhibition of WIP1 phosphatase sensitizes breast cancer cells to genotoxic stress and to MDM2 antagonist nutlin-3. Oncotarget 2016, 7, 14458–14475. [Google Scholar] [CrossRef] [PubMed] [Green Version]
  34. Rücker, F.G.; Schlenk, R.F.; Bullinger, L.; Kayser, S.; Teleanu, V.; Kett, H.; Habdank, M.; Kugler, C.M.; Holzmann, K.; Gaidzik, V.I.; et al. TP53 alterations in acute myeloid leukemia with complex karyotype correlate with specific copy number alterations, monosomal karyotype, and dismal outcome. Blood 2012, 119, 2114–2121. [Google Scholar] [CrossRef]
  35. Simonetti, G.; Padella, A.; do Valle, I.F.; Fontana, M.C.; Fonzi, E.; Bruno, S.; Baldazzi, C.; Guadagnuolo, V.; Manfrini, M.; Ferrari, A.; et al. Aneuploid acute myeloid leukemia exhibits a signature of genomic alterations in the cell cycle and protein degradation machinery. Cancer 2018. [Google Scholar] [CrossRef] [Green Version]
  36. Prokocimer, M.; Molchadsky, A.; Rotter, V. Dysfunctional diversity of p53 proteins in adult acute myeloid leukemia: Projections on diagnostic workup and therapy. Blood 2017, 130, 699–712. [Google Scholar] [CrossRef]
  37. Kojima, K.; Konopleva, M.; Samudio, I.J.; Shikami, M.; Cabreira-Hansen, M.; McQueen, T.; Ruvolo, V.; Tsao, T.; Zeng, Z.; Vassilev, L.T.; et al. MDM2 antagonists induce p53-dependent apoptosis in AML: Implications for leukemia therapy. Blood 2005, 106, 3150–3159. [Google Scholar] [CrossRef] [PubMed] [Green Version]
  38. Seipel, K.; Marques, M.A.T.; Sidler, C.; Mueller, B.U.; Pabst, T. The Cellular p53 Inhibitor MDM2 and the Growth Factor Receptor FLT3 as Biomarkers for Treatment Responses to the MDM2-Inhibitor Idasanutlin and the MEK1 Inhibitor Cobimetinib in Acute Myeloid Leukemia. Cancers (Basel) 2018, 10, 170. [Google Scholar] [CrossRef] [PubMed] [Green Version]
  39. Lehmann, C.; Friess, T.; Birzele, F.; Kiialainen, A.; Dangl, M. Superior anti-tumor activity of the MDM2 antagonist idasanutlin and the Bcl-2 inhibitor venetoclax in p53 wild-type acute myeloid leukemia models. J. Hematol. Oncol. 2016, 9, 50. [Google Scholar] [CrossRef] [Green Version]
  40. Daver, N.G.; Pollyea, D.A.; Garcia, J.S.; Jonas, B.A.; Yee, K.W.L.; Fenaux, P.; Assouline, S.; Vey, N.; Olin, R.; Roboz, G.J.; et al. Safety, Efficacy, Pharmacokinetic (PK) and Biomarker Analyses of BCL2 Inhibitor Venetoclax (Ven) Plus MDM2 Inhibitor Idasanutlin (idasa) in Patients (pts) with Relapsed or Refractory (R/R) AML: A Phase Ib, Non-Randomized, Open-Label Study. Blood 2018, 132, 767. [Google Scholar] [CrossRef]
  41. Reis, B.; Jukofsky, L.; Chen, G.; Martinelli, G.; Zhong, H.; So, V.; Dickinson, M.J.; Drummond, M.; Assouline, S.; Hashemyan, M.; et al. Acute myeloid leukemia patients’ clinical response to idasanutlin (RG7388) is associated with pre-treatment MDM2 protein expression in leukemic blasts. Haematologica 2016, 101, e185–e188. [Google Scholar] [CrossRef] [PubMed] [Green Version]
  42. Napolitano, R.; De Matteis, S.; Carloni, S.; Bruno, S.; Abbati, G.; Capelli, L.; Ghetti, M.; Bochicchio, M.; Liverani, C.; Mercatali, L.; et al. Kevetrin induces apoptosis in TP53 wild-type and mutant acute myeloid leukemia cells. Oncol. Rep. 2020, 44, 1561–1573. [Google Scholar] [CrossRef] [PubMed]
  43. Lin, L.-I.; Lin, T.-C.; Chou, W.-C.; Tang, J.-L.; Lin, D.-T.; Tien, H.-F. A novel fluorescence-based multiplex PCR assay for rapid simultaneous detection of CEBPA mutations and NPM mutations in patients with acute myeloid leukemias. Leukemia 2006, 20, 1899–1903. [Google Scholar] [CrossRef] [PubMed] [Green Version]
  44. Thiede, C.; Steudel, C.; Mohr, B.; Schaich, M.; Schäkel, U.; Platzbecker, U.; Wermke, M.; Bornhäuser, M.; Ritter, M.; Neubauer, A.; et al. Analysis of FLT3-activating mutations in 979 patients with acute myelogenous leukemia: Association with FAB subtypes and identification of subgroups with poor prognosis. Blood 2002, 99, 4326–4335. [Google Scholar] [CrossRef] [PubMed] [Green Version]
  45. Chou, T.C. Drug combination studies and their synergy quantification using the chou-talalay method. Cancer Res. 2010, 70, 440–446. [Google Scholar] [CrossRef] [PubMed] [Green Version]
  46. Verhaak, R.G.W.; Wouters, B.J.; Erpelinck, C.A.J.; Abbas, S.; Beverloo, H.B.; Lugthart, S.; Löwenberg, B.; Delwel, R.; Valk, P.J.M. Prediction of molecular subtypes in acute myeloid leukemia based on gene expression profiling. Haematologica 2009, 94, 131–134. [Google Scholar] [CrossRef] [PubMed] [Green Version]
  47. Kohlmann, A.; Kipps, T.J.; Rassenti, L.Z.; Downing, J.R.; Shurtleff, S.A.; Mills, K.I.; Gilkes, A.F.; Hofmann, W.-K.; Basso, G.; Dell’orto, M.C.; et al. An international standardization programme towards the application of gene expression profiling in routine leukaemia diagnostics: The Microarray Innovations in LEukemia study prephase. Br. J. Haematol. 2008, 142, 802–807. [Google Scholar] [CrossRef]
  48. Papaemmanuil, E.; Gerstung, M.; Bullinger, L.; Gaidzik, V.I.; Paschka, P.; Roberts, N.D.; Potter, N.E.; Heuser, M.; Thol, F.; Bolli, N.; et al. Genomic Classification and Prognosis in Acute Myeloid Leukemia. N. Engl. J. Med. 2016, 374, 2209–2221. [Google Scholar] [CrossRef]
  49. Fischer, M. Census and evaluation of p53 target genes. Oncogene 2017, 36, 3943–3956. [Google Scholar] [CrossRef] [PubMed] [Green Version]
  50. Zajkowicz, A.; Butkiewicz, D.; Drosik, A.; Giglok, M.; Suwiński, R.; Rusin, M. Truncating mutations of PPM1D are found in blood DNA samples of lung cancer patients. Br. J. Cancer 2015, 112, 1114–1120. [Google Scholar] [CrossRef] [Green Version]
  51. Clausse, V.; Goloudina, A.R.; Uyanik, B.; Kochetkova, E.Y.; Richaud, S.; Fedorova, O.A.; Hammann, A.; Bardou, M.; Barlev, N.A.; Garrido, C.; et al. Wee1 inhibition potentiates Wip1-dependent p53-negative tumor cell death during chemotherapy. Cell Death Dis. 2016, 7, e2195. [Google Scholar] [CrossRef] [PubMed] [Green Version]
  52. Yu, E.; Ahn, Y.S.; Jang, S.J.; Kim, M.-J.; Yoon, H.S.; Gong, G.; Choi, J. Overexpression of the wip1 gene abrogates the p38 MAPK/p53/Wip1 pathway and silences p16 expression in human breast cancers. Breast Cancer Res. Treat. 2007, 101, 269–278. [Google Scholar] [CrossRef] [PubMed]
  53. Uyanik, B.; Grigorash, B.B.; Goloudina, A.R.; Demidov, O.N. DNA damage-induced phosphatase Wip1 in regulation of hematopoiesis, immune system and inflammation. Cell Death Discov. 2017, 3, 17018. [Google Scholar] [CrossRef] [PubMed]
  54. Yu, M.; Hu, J.; He, D.; Chen, Q.; Liu, S.; Zhu, X.; Li, B. Potentiality of Protein phosphatase Mg 2+ /Mn 2+ dependent 1D as a biomarker for predicting prognosis in acute myeloid leukemia patients. J. Clin. Lab. Anal. 2020, 34, e23171. [Google Scholar] [CrossRef] [PubMed]
  55. Kozakai, Y.; Kamada, R.; Furuta, J.; Kiyota, Y.; Chuman, Y.; Sakaguchi, K. PPM1D controls nucleolar formation by up-regulating phosphorylation of nucleophosmin. Sci. Rep. 2016, 6, 33272. [Google Scholar] [CrossRef] [Green Version]
  56. Chan, N.; Meng Lim, T. Cytoplasmic nucleophosmin has elevated T199 phosphorylation upon which G2/M phase progression is dependent. Sci. Rep. 2015, 5, 11777. [Google Scholar] [CrossRef] [Green Version]
  57. Krześniak, M.; Zajkowicz, A.; Gdowicz-Kłosok, A.; Głowala-Kosińska, M.; Łasut-Szyszka, B.; Rusin, M. Synergistic activation of p53 by actinomycin D and nutlin-3a is associated with the upregulation of crucial regulators and effectors of innate immunity. Cell. Signal. 2020, 69, 109552. [Google Scholar] [CrossRef]
  58. Gamble, L.D.; Kees, U.R.; Tweddle, D.A.; Lunec, J. MYCN sensitizes neuroblastoma to the MDM2-p53 antagonists Nutlin-3 and MI-63. Oncogene 2012, 31, 752–763. [Google Scholar] [CrossRef] [Green Version]
  59. Phesse, T.J.; Myant, K.B.; Cole, A.M.; Ridgway, R.A.; Pearson, H.; Muncan, V.; van den Brink, G.R.; Vousden, K.H.; Sears, R.; Vassilev, L.T.; et al. Endogenous c-Myc is essential for p53-induced apoptosis in response to DNA damage in vivo. Cell Death Differ. 2014, 21, 956–966. [Google Scholar] [CrossRef] [Green Version]
  60. Cheng, Q.; Chen, J. Mechanism of p53 stabilization by ATM after DNA damage. Cell Cycle 2010, 9, 472–478. [Google Scholar] [CrossRef] [PubMed] [Green Version]
Figure 1. PPM1D expression in AML according to cytogenetic classification and FLT3-ITD/NPM1 status. (A) Violin plot of PPM1D transcript level in the GSE13159 and TCGA cohorts showing a significant different distribution among cytogenetic subgroups (t(8;21); CK: complex karyotype; inv(16): inv(16)/t(16;16); KMT2A-r: KMT2A-rearranged; NK: normal karyotype; AML carrying NK and other cytogenetics abnormalities could not be distinguished in GSE13159 due to data unavailability, thus named as “NK and other”). (B) Violin plot of PPM1D transcript level in the GSE6891 cohort showing a significant different distribution among molecular subgroups defined by FLT3-ITD and NPM1 mutations (wt: FLT3-ITD−/NPM1-wt; ITD: FLT3-ITD+/NPM1-wt; NPM1: FLT3-ITD−/NPM1-mut; ITD/NPM1: FLT3-ITD+/NPM1-mut). The plots represent the frequency distribution of PPM1D levels (from minimum to maximum) and the dotted line indicates the median value (only cohorts showing statistically significant results are reported in the figure).
Biomedicines 09 00388 g001
Figure 2. Viability of AML cell lines treated with Nut-3a and/or WIP1i. (A) Percentage of viable MOLM-13, MV-4-11, OCI-AML3, NOMO-1, HEL and KASUMI-1 AML cells treated with increasing concentrations of single agent Nut-3a (from 0.5 to 5 μM) for 24, 48 and 72 h. (B) IC50 values of AML cell lines at 72 h of treatment with Nut-3a or WIP1i (NR = not reached). (C) Percentage of viable cells treated with increasing concentrations of single agent WIP1i (from 5 to 20 μM) for 24, 48 and 72 h. Inhibition of cell viability induced in TP53-wt (D) and TP53-mut (E) AML cell lines by the combination of increasing concentrations of Nut-3a (from 0.5 to 5 μM) and WIP1i (from 5 to 20 µM) at 24, 48 and 72 h. Average value and standard deviation of 3 independent experiments are shown.
Biomedicines 09 00388 g002
Figure 3. Apoptotic response of AML cell lines and primary cells to combined Nut-3a and WIP1i treatment. (A) Histograms showing the percentage of apoptotic (AnnexinV+ cells) cells in TP53-wt (A) and TP53-mut cell lines (B) after 24 and 48 h treatment with single and combined Nut-3a and WIP1i. Average value and standard deviation of 3 independent experiments are shown. (C) Cell viability and (D) apoptotic response of TP53-wt AML primary cells (n = 3 and n = 6, respectively) after 24 h and 48 h treatment with single and combined Nut-3a and WIP1i treatments. (E) Histograms showing the percentage of dead cells in NPM1-mut and NPM1-wt primary AML cells (n = 5 each) after 48 h treatment with single and combined Nut-3a and WIP1i. (F) Histograms showing the percentage of viable cells (normalized on vehicle-treated cells) in TP53-mut (n = 3) and TP53-wt (n = 4) primary AML cells after 48 h treatment with single and combined Nut-3a and WIP1i (* p < 0.05, ** p < 0.01, *** p < 0.001, ns: not significant).
Biomedicines 09 00388 g003
Figure 4. Changes in the expression of p53-related genes induced by the treatment in TP53-wt and TP53-mut cells. Cells were harvested after 16 h of treatment (Nut-3a 0.5 and 5 µM; WIP1i 5 and 20 µM, for TP53-wt and TP53-mut cells, respectively) both for gene expression microarray and protein analyses. (A) Enrichment of p53 signature in MV-4-11 cells treated with the drug combination vs. vehicle (gene expression microarray). (B) Heatmap of MV-4-11 and NOMO-1 cells showing the significantly deregulated genes (differential expression analysis between Nut-3a+WIP1i-treated and vehicle-treated MV-4-11 cells, fold change ≥ 2, p < 0.05) belonging to the p53 signature in the analyzed models. (C) Protein quantification of p53-related genes in treated TP53-wt and (D) TP53-mut cells. Histograms show the average value of 3 independent experiments ± SD (* p < 0.05, ** p < 0.01, *** p < 0.001, ns: not significant).
Biomedicines 09 00388 g004
Figure 5. Treatment-specific transcriptional signatures enriched in MV-4-11 and NOMO-1 cells. GSEA plots of significantly enriched signatures in MV-4-11 cells treated with (A) WIP1i, (B) Nut-3a, or (C) their combination vs. control cells (NES: normalized enrichment score, FDR: false discovery rate).
Biomedicines 09 00388 g005
Figure 6. Proposed mechanism of action of Nut-3a and WIP1i combined treatment in AML cells. MDM2 inhibition enhances p53-dependent response to DNA damages induced by chemotherapy agents or replicative stress. Once Nut-3a binds to MDM2, p53 is released and activated through phosphorylation. Active p53 promotes the induction of apoptosis. (A) WIP1 is involved in the regulation of response to Nut-3a and dephosphorylates p53. WIP1 and p53 are co-regulated by a feedback-loop. (B) When WIP1i is simultaneously added to Nut-3a, p53 activation is enforced, resulting in enhanced apoptosis of AML cells. The arrows represent a stimulatory signal, truncated arrows represent a inhibition signal.
Biomedicines 09 00388 g006
Table 1. Association between PPM1D expression levels and clinical/molecular data across public datasets.
VariableGSE6891 [48] (n = 499)GSE13159 [49] (n = 458)TCGA [50] (n = 178)
PPM1D Mediann (%)p-ValuePPM1D Mediann (%)p-ValuePPM1D Median (Min–Max)n (%)p-Value
(Min–Max)(Min–Max)
Age
<60-years151.6 (83.9–393.3)417 (84.8)0.03NANANA25.6 (15.1–46.7)92 (51.7)0.004
≥60-years146.7 (94.5–234.4)75 (15.2) 22.6 (14.2–39.4)86 (48.3)
NA = 7
Cytogenetic group
t(8;21)169.8 (89.9–318.9)38 (9.0)0.185106.2 (32.6–309.9)35 (7.6)<0.00125.7 (22.3–31.7)7 (4.2)0.031
inv(16)/t(16;16)156.3 (95.8–319.7)42 (10.0) 73.2 (41.4–134.6)27 (5.9) 27.6 (20.5–38.7)11 (6.6)
NK147.5 (83.9–371.3)171 (40.5) NA0 23.5 (15.1–46.7)96 (57.8)
CK146.4 (97.9–259.7)34 (8.1) 99.3 (31.5–279.4)45 (9.8) 24.4 (15.2–39.0)21 (12.7)
KMT2A-r139.6 (94.3–256.3)17 (4.0) 72.2 (28.2–233.4)29 (6.3) 29.1 (18.3–46.1)10 (6.0)
Other143.1 (84.1–393.3)120 (28.4) NA0 21.9 (14.2–29.5)21 (12.7)
Normal/Other * 72.2 (23.4–263.2)322 (21.8)
NA = 77 NA = 12
FLT3-ITD
FLT3-ITD+146.1 (87.6–371.3)134 (26.9)0.017NANANA24.2 (14.2–46.7)32 (18.4)0.87
FLT3-ITD152.2 (83.9–393.3)365 (73.1) 23.2 (15.2–39.0)143 (81.7)
NA = 3
NPM1 status
NPM1-mut143.1 (83.9–371.3)159 (39.9)0.002NANANA23.7 (16.1–46.7)53 (30.3)0.69
NPM1-wt155.8 (84.1–393.3)340 (68.1) 24.0 (14.2–46.1)122 (69.7)
NA = 3
The sum does not add up to the total due to missing values. * “NK” and “other” cytogenetic subgroups were not distinguished in GSE13159. CK: complex karyotype; ITD: internal tandem duplication; KMT2A-r: KMT2A-rearranged; min-max: minimum-to-maximum value; mut: mutated; NA: not available; NK: normal karyotype; wt: wildtype.
Table 2. Most significant enriched pathways in MV-4-11 cells upon drug treatment.
Pathway NameNESFDRReatment Comparison
Hallmark of p53 Pathway2.31≤0.001Nut3a+WIP1i vs. DMSO
2.13≤0.001Nut3a vs. DMSO
1.490.029WIP1i vs. DMSO
Hallmark of Protein Secretion1.98≤0.001Nut3a+WIP1i vs. DMSO
2.24≤0.001Nut3a vs. DMSO
1.730.005WIP1i vs. DMSO
Hallmark of Oxidative Phosphorylation1.870.001Nut3a+WIP1i vs. DMSO
1.94≤0.001Nut3a vs. DMSO
2.310.005WIP1i vs. DMSO
Hallmark of Apoptosis1.700.009Nut3a+WIP1i vs. DMSO
1.700.003Nut3a vs. DMSO
1.520.024WIP1i vs. DMSO
Hallmark of mTORC1 Signaling1.750.002Nut3a vs. DMSO
1.880.003WIP1i vs. DMSO
Hallmark of Fatty Acid Metabolism1.750.002Nut3a vs. DMSO
1.620.010WIP1i vs. DMSO
Hallmark of DNA Repair1.580.014Nut3a vs. DMSO
1.630.011WIP1i vs. DMSO
Hallmark of Peroxisome1.520.024Nut3a vs. DMSO
1.800.005WIP1i vs. DMSO
Hallmark of TNFA Signaling Via NFKB1.570.021Nut3a+WIP1i vs. DMSO
Hallmark of Interferon Gamma Response1.530.022Nut3a+WIP1i vs. DMSO
Hallmark of Interferon Alpha Response1.540.023Nut3a+WIP1i vs. DMSO
Hallmark of PI3K AKT mTOR Signaling1.730.002Nut3a vs. DMSO
Positive Regulation Of Cysteine Type Endopeptidase Activity Involved In Apoptotic Signaling Pathway2.210.030Nut3a vs. DMSO
Oligosaccharide-Lipid Intermediate Biosynthetic Process2.190.013Nut3a vs. DMSO
Hallmark of MYC Targets_V21.720.006WIP1i vs. DMSO
Hallmark of Unfolded Protein Response1.670.008WIP1i vs. DMSO
Hallmark of MYC Targets_V11.620.011WIP1i vs. DMSO
FDR: false discovery rate; NES: normalized enrichment score.
Table 3. Most significant enriched pathways in NOMO-1 cells upon drug treatment.
Pathway NameNESFDRTreatment Comparison
Hallmark of Inflammatory Response1.990.001Nut3a+WIP1i vs. DMSO
1.530.043Nut3a vs. DMSO
Hallmark of TNFA Signaling Via NFKB2.020.002Nut3a+WIP1i vs. DMSO
1.520.022Nut3a vs. DMSO
FDR: false discovery rate; NES: normalized enrichment score.
Publisher’s Note: MDPI stays neutral with regard to jurisdictional claims in published maps and institutional affiliations.

