Article

Identification and Validation of New Cancer Stem Cell-Related Genes and Their Regulatory microRNAs in Colorectal Cancerogenesis

Faculty of Medicine, Institute of Pathology, University of Ljubljana, 1000 Ljubljana, Slovenia
*
Author to whom correspondence should be addressed.
Biomedicines 2021, 9(2), 179; https://doi.org/10.3390/biomedicines9020179
Submission received: 12 January 2021 / Revised: 31 January 2021 / Accepted: 4 February 2021 / Published: 11 February 2021

Abstract

:
Significant progress has been made in the last decade in our understanding of the pathogenetic mechanisms of colorectal cancer (CRC). Cancer stem cells (CSC) have gained much attention and are now believed to play a crucial role in the pathogenesis of various cancers, including CRC. In the current study, we validated gene expression of four genes related to CSC, L1TD1, SLITRK6, ST6GALNAC1 and TCEA3, identified in a previous bioinformatics analysis. Using bioinformatics, potential miRNA-target gene correlations were prioritized. In total, 70 formalin-fixed paraffin-embedded biopsy samples from 47 patients with adenoma, adenoma with early carcinoma and CRC without and with lymph node metastases were included. The expression of selected genes and microRNAs (miRNAs) was evaluated using quantitative PCR. Differential expression of all investigated genes and four of six prioritized miRNAs (hsa-miR-199a-3p, hsa-miR-335-5p, hsa-miR-425-5p, hsa-miR-1225-3p, hsa-miR-1233-3p and hsa-miR-1303) was found in at least one group of CRC cancerogenesis. L1TD1, SLITRK6, miR-1233-3p and miR-1225-3p were correlated to the level of malignancy. A negative correlation between miR-199a-3p and its predicted target SLITRK6 was observed, showing potential for further experimental validation in CRC. Our results provide further evidence that CSC-related genes and their regulatory miRNAs are involved in CRC development and progression and suggest that some them, particularly miR-199a-3p and its SLITRK6 target gene, are promising for further validation in CRC.

1. Introduction

Colorectal cancer (CRC) is ranked as the third most common cause of morbidity due to cancer worldwide [1]. The five-year survival of patients with CRC can vary, with five-year survival rates of approximately 90% in patients with adenoma with early carcinoma and approximately 8–12% in patients with advanced CRC [2]. Despite the introduction of new treatment modalities, 40–50% of CRC patients develop metastases [1,2,3,4]. The prognosis can be improved significantly with the detection of early lesions through population screening programs [5,6].
CRC development is divided into discrete stages, ranging from normal mucosa to invasive carcinoma. The majority of CRC cases develop from precursor lesions, adenomas and serrated polyps [4]. Molecular pathways involved in CRC development include stepwise accumulation of mutations, epigenetic changes, and changes in gene expression, leading to uncontrolled cell division and an invasive phenotype [4,7]. Most genetic events that are associated with tumour development occur early, before the formation of the adenoma, leading to an urgent need to define mechanisms responsible for the switch from adenoma to carcinoma.
It is believed that the bulk of any given neoplasm consists of cells incapable of metastatic seeding or tumour progression. A minority of cancer cells, referred to as cancer stem cells (CSC) or CSC-like cells [8], are capable of self-renewal, differentiation and mobility. They are mostly found as a subpopulation on the invasive tumour front, and are believed to be responsible for invasiveness, metastatic spread and relapse [9,10]. Additionally, turnover of CSCs is slow, which in turn allows greater resistance to therapies that target rapidly replicating cells [9,10].
Two separate mechanisms have been suggested for the development of CSC in CRC. According to the first, oncogenic mutations accumulate within the colonic crypt stem cells, located in the bottom area of a normal crypt. These CSCs are able to differentiate into mature cancer cells and exhibit uncontrolled proliferation. According to the second mechanism, cancer cells undergoing an accumulation of genetic changes and/or epithelial-mesenchymal transition dedifferentiate from normal mature epithelial cells into a state similar to stem cells [11].
In a previous study, we used a bioinformatics analysis of publicly available gene expression microarray projects [12] and identified potential markers for differentiation between normal colon mucosa, adenoma and CRC. Some of the differentially expressed genes were associated with CSC-like cells, namely L1TD1, SLITRK6, ST6GALNAC1 and TCEA3. L1TD1, a gene-encoding RNA-binding protein, has been identified as a marker for human embryonic stem cells, their renewal and cancer cell proliferation. It has been associated with RNA transcription, splicing, processing, localization, stability and translation [13,14,15,16]. SLITRK6, an integral membrane protein, has been found to be highly expressed in human adult neural stem-like cells and in several cancers. It has been associated with cell adhesion and actin cytoskeleton [17,18,19], cell features that are closely related to cell differentiation, stemness, cancer cell migration and invasion [20,21,22]. ST6GALNAC1, encoding an enzyme, has been associated with cell migration, contact and maintenance of isolated CRC stem cells. It is involved in the activation of akt pathway and it is a potential candidate for CSC targeting therapy [23]. TCEA3, a transcription elongation factor, has been shown to regulate differentiation of mouse embryonal stem cells through the Lefty1-Nodal-Smad2 pathway [24].
However, there is very limited information about their role in CRC. We therefore analysed the expression of these four genes during CRC cancerogenesis, from normal mucosa, adenoma and adenoma with early carcinoma to advanced CRC, predicted miRNAs that could regulate these genes and analysed their expression as well.

2. Materials and Methods

2.1. Patient and Tissue Selection

Patients who underwent excision or resection of adenoma, adenoma with early carcinoma and CRC from 2015 to 2019 were included in the study. For routine histopathologic examination, tissue samples were fixed in 10% buffered formalin and embedded in paraffin (FFPE). During routine examination, all specimens were evaluated by a pathologist according to standard procedures and, after histopathologic examination, pTNM (pathologic Tumour Node Metastasis) classification was assessed on the basis of the depth of invasion and extent of the primary tumour, the number of lymph nodes with metastases and the presence of distant metastases (AJCC 8th edition [25]). For the purpose of this study, biopsy samples were collected retrospectively from the archives of the Institute of Pathology, Faculty of Medicine, University of Ljubljana. After re-evaluation of consecutive cases for each group by a pathologist and initial quality check, representative samples were selected for further study. Samples of normal mucosa obtained from resected CRC specimens were used as control samples. Patients treated by radiotherapy, chemotherapy or biologic drugs prior to surgery were not included in this study. Patients with mucinous carcinomas or signet cell carcinomas were also excluded. Only sporadic CRC cases were included. Tissue samples were grouped as normal mucosa, adenoma, adenoma with early carcinoma, CRC without lymph node metastases (CRC N0) or CRC with lymph node metastases (CRC N+).
The study was conducted according to the guidelines of the Declaration of Helsinki, and approved by the National Medical Ethics Committee (Republic of Slovenia, Ministry of Health), approval number 0120-54/2020/4.

2.2. Target miRNAs Identification and Prioritization

For the identified differentially expressed genes (DEGs), we searched for miRNA targets that might be involved in the regulation of their expression. The databases MiRTar [26], miRDB [27], Mirna-coadread [28], TarBase [29], TargetScan [30], miRBase [31] and a literature based search on Pubmed, as well as the settings used in the miRNA mining, are given in Table S1.
miRNAs that could target selected DEGs were checked in the miRBase [31] for annotation, method of identification and validation. Cases in which the miRNAs were identified as not true miRNAs were discarded. Only miRNAs either with a known functional association with cancer or that appeared in at least two databases as related to the target gene were considered as potential regulators of DEGs. The identified miRNAs from Table S1 were further prioritized as explained below.
Alignment between the miRNA and gene sequence was inspected manually and mismatches in the seed region were noted. In cases in which there was a maximum of one mismatch in the miRNA seed binding region in the binding relevant 2–7 bp, the matching was considered sufficient for further analysis [32]. Additionally, in cases in which a relevant reference for cancer associations was identified, the miRNA was also considered for further analysis. We identified the sequence 70 bp and 30 bp upstream and downstream of the mature miRNA binding site, the former for minimum free energy (ΔG) determination in regard to the folding of the sequence and 30 bp for secondary structure analysis [33,34]. Higher ΔG upstream or downstream of the binding site may imply binding issues, whereas a lower ΔG suggests a locally linear RNA structure around the target mRNA-binding site [34]. We also identified ΔG of the potential binding site and identified cases in which the difference between the potential binding site and the 70 bp flanking 3′ and 5′ was at least 10 kcal/mol [35]. ΔG and secondary structure analysis was performed using mFold [36] and Vienna RNAfold [37]. Identification of secondary structures and destabilising elements (DSE) or stabilising elements (SE) was performed for each miRNA-binding site and the 30 bp flanking sequence on each side. Potential DSEs with the following cut-off lengths include a hairpin loop, ≥11 bp; interior loop, ≥9 bp; bulge loop, ≥7 bp; multiple branching loop ≥ 11 bp; and joint sequence or free end, ≥11 bp. DSE could aid in miRNA binding while stabilising elements (SE) including stems, as explained by Zhao, Samal and Srivastava [34]. Structures were considered significant for inhibition of miRNA binding if the ΔG of the structure was lower than −6 kcal/mol [38]. Identification of potential conservation of miRNA-target gene binding site sequences between human, mouse, rat and chicken was performed using TargetScan 7.2 [30].
RNA22 [39] was used for identification of statistically significant (p ≤ 0.05) alignments between DEG target 3′-UTR sites and miRNAs. The settings used in the analysis were: 8-mer or 7-mer seed binding, 1 unpaired sequence in seed region, 1 G:U wobble, maximum folding energy for heteroduplex −12.0 and 20.0 kcal/mol. The heteroduplex energies with cut-off −12.0 and −20.0 kcal/mol used in RNA22 were the energies suggested by the software and the typical setting described in the study by Miranda, Huynh, Tay, Ang, Tam, Thomson, Lim and Rigoutsos [39]. Results of individual analyses were compared for possible overlaps. The full workflow of the prioritization is shown in Figure 1.

2.3. RNA Isolation and Quality Assessment

RNA was obtained from FFPE tissue slides using a microtome (4 × 10 µm-thick slides). RNA, including miRNAs, was isolated using an AllPrep DNA/RNA FFPE kit (Qiagen, Hilden, Germany) kit according to the manufacturer’s protocol. Concentration and quality assessment of the isolated RNA was performed using a spectrophotometer ND-1000 or ND-One (Nanodrop, Thermo Fisher Scientific, Waltham, MA, USA) at wavelengths 260 nm and 280 nm. Prior to further analysis, RNA quality was tested using reverse transcription and amplification of GAPDH (Hs_GAPDH_vb.1_SG, 100 bp) by SybrGreen technology. Samples that did not amplify during this initial control step were excluded from further analysis.

2.4. Reverse Transcription (RT) and Pre-Amplification

Reverse transcription (RT) of the isolated mRNA was performed using OneTaq®® RT-PCR Kit (New England Biolabs, Ipswich, MA, USA) using a mix of random hexamers and oligo-dT primers according to the manufacturer’s protocol. We used 60 ng of RNA in the total 10 µL RT reaction and 1 µL of random hexamers, and incubated for 5 min at 70 °C. Afterward, we added 5 µL of the Reaction mix and 1 µL of Enzyme mix to the reaction and incubated at 25 °C for 5 min, 42 °C for 1 h and 80 °C for 5 min.
Preamplification of the obtained cDNA was performed using the TaqMan®® Preamp Master Mix (Thermo Fisher Scientific, Waltham, MA, USA) according to the manufacturer’s instructions. For a 10 µL reaction, we added 5 µL of PreAmp Master Mix (2×), 2.5 µL of Pooled TaqMan®® Gene Expression probes (Thermo Fisher Scientific, Waltham, MA, USA) (0.2×, diluted in TE buffer) and 2.5 µL of cDNA. Incubation was performed at 95 °C for 10 min, 95 °C for 15 s and 60 °C for 4 min.
RT of the isolated miRNAs was performed using the TaqMan™ MicroRNA Reverse Transcription Kit (Applied Biosystems, Foster City, CA, USA) according to the manufacturer’s protocol. The reaction volume was a total of 10 µL, including 10 ng of RNA, 2 µL of RT primer, 0.1 µL of 100 mM dNTPs, 1 µL of MultiScribe™ Reverse Transcriptase 50 U/µL, 1 µL of 10× Reverse Transcription Buffer, 0.19 µL of the RNase Inhibitor 20 U/µL and 0.71 µL nuclease-free water. The conditions for the reverse transcription were 30 min at 16 °C, 30 min at 42 °C and 5 min at 85 °C.

2.5. Selection of Primers and Probes

The TaqMan-based approach (Thermo Fisher Scientific, Waltham, MA, USA) was used for the quantitative real-time PCR (qPCR) methodology. A predesigned mixture of primers and probes was used for expression analysis of mRNAs of DEGs and their potential regulatory miRNAs relative to reference genes (RGs). The candidate genes were selected after a bioinformatics analysis performed in a previous study [12]. The potential regulatory miRNAs were selected as described above. Selected probes are shown in Table 1, with reference genes (RGs) presented in bold.

2.6. Quantitative Real-Time PCR (qPCR)

Prior to qPCR amplification, efficiencies were determined in triplicate reactions for each probe and for each group of samples. The dilution series included 4-point dilutions ranging from 5-fold to 625-fold for mRNAs/miRNAs. A Rotor Gene Q (Qiagen, Hilden, Germany) machine was used for all qPCR analyses, and all 10 µL testing reactions were performed in duplicate. For mRNAs, the cycling protocol was 50 °C for 2 min, 95 °C for 10 min, 40 cycles of 95 °C for 15 s and 62 °C for 1 min. For miRNAs, the cycling protocol was 95 °C for 10 min, 40 cycles of 95 °C for 15 s and 60 °C for 60 s. The reactions included 5.0 µL of the FastStart™ PCR Master mix (Roche Diagnostics, Basel, Switzerland), 0.5 µL of the TaqMan probe and 4.5 µL of cDNA (pre-amplified cDNA diluted 5-fold for mRNAs and for miRNAs cDNA diluted 100–fold).
After efficiency correction, the obtained ΔCq (normalized Cq of analysed mRNAs/miRNAs relative to geometric mean of RGs) were used for analysis of target gene/miRNA expression. The fold difference in the expression was calculated against the normal mucosa samples group using the ΔΔCq method [40].

2.7. Statistics

Differences in expression were compared between tumour and corresponding normal mucosa using ΔCq and the Willcoxon Rank test (nonparametric test for dependent samples). For comparison of relative quantification of mRNAs/miRNAs between independent groups of samples (e.g., adenoma vs. normal mucosa), ΔCq and the Mann–Whitney U test were used (nonparametric test for independent group of samples). ΔΔCq and the Mann–Whitney U test were used for comparison between CRC N0 and CRC N+ sample groups. Using the Spearman coefficient, we analysed whether miRNAs and the target mRNA were in reverse correlation and whether miRNAs and mRNAs were associated with cancerogenesis. All statistical analyses of experimental data were performed using SPSS version 24 (SPSS Inc., Chicago, IL, USA). Differences in expression between groups were considered significant at p ≤ 0.05.

3. Results

3.1. Patient Characteristics

Approximately 30% of retrospectively selected cases successfully passed initial quality control. Our study therefore included 70 biopsy samples from 47 patients with adenoma (n = 11), adenoma with early carcinoma (n = 13), CRC without lymph node metastases (n = 10) and CRC with lymph node metastases (n = 13). There were 15 women and 32 men, aged 73.7 ± 8.4 and 65.7 ± 11.4 years, respectively. As a control group, microscopically normal mucosa from CRC resected specimens was used (n = 23). Demographic characteristics of the included patients are shown in Table 2.
Among adenomas, there were six cases of tubular adenoma with high-grade dysplasia, three tubulovillous adenomas with high-grade dysplasia and two tubulovillous adenomas with low-grade dysplasia. Among adenomas with early carcinoma, there were six tubulovillous adenomas, six tubular adenomas and one villous adenoma, all with high grade dysplasia and with malignant transformation, evidenced by invasion of the dysplastic glands in the submucosa (pT1). Among CRC cases, there were two stage I carcinomas, five stage IIA, two stage IIB, eight stage IIIB, one stage IIIC, four stage IVA and one stage IVB carcinomas. Of the CRC cases, 7 cases were poorly differentiated and 16 were moderately differentiated.

3.2. Differential Gene Expression

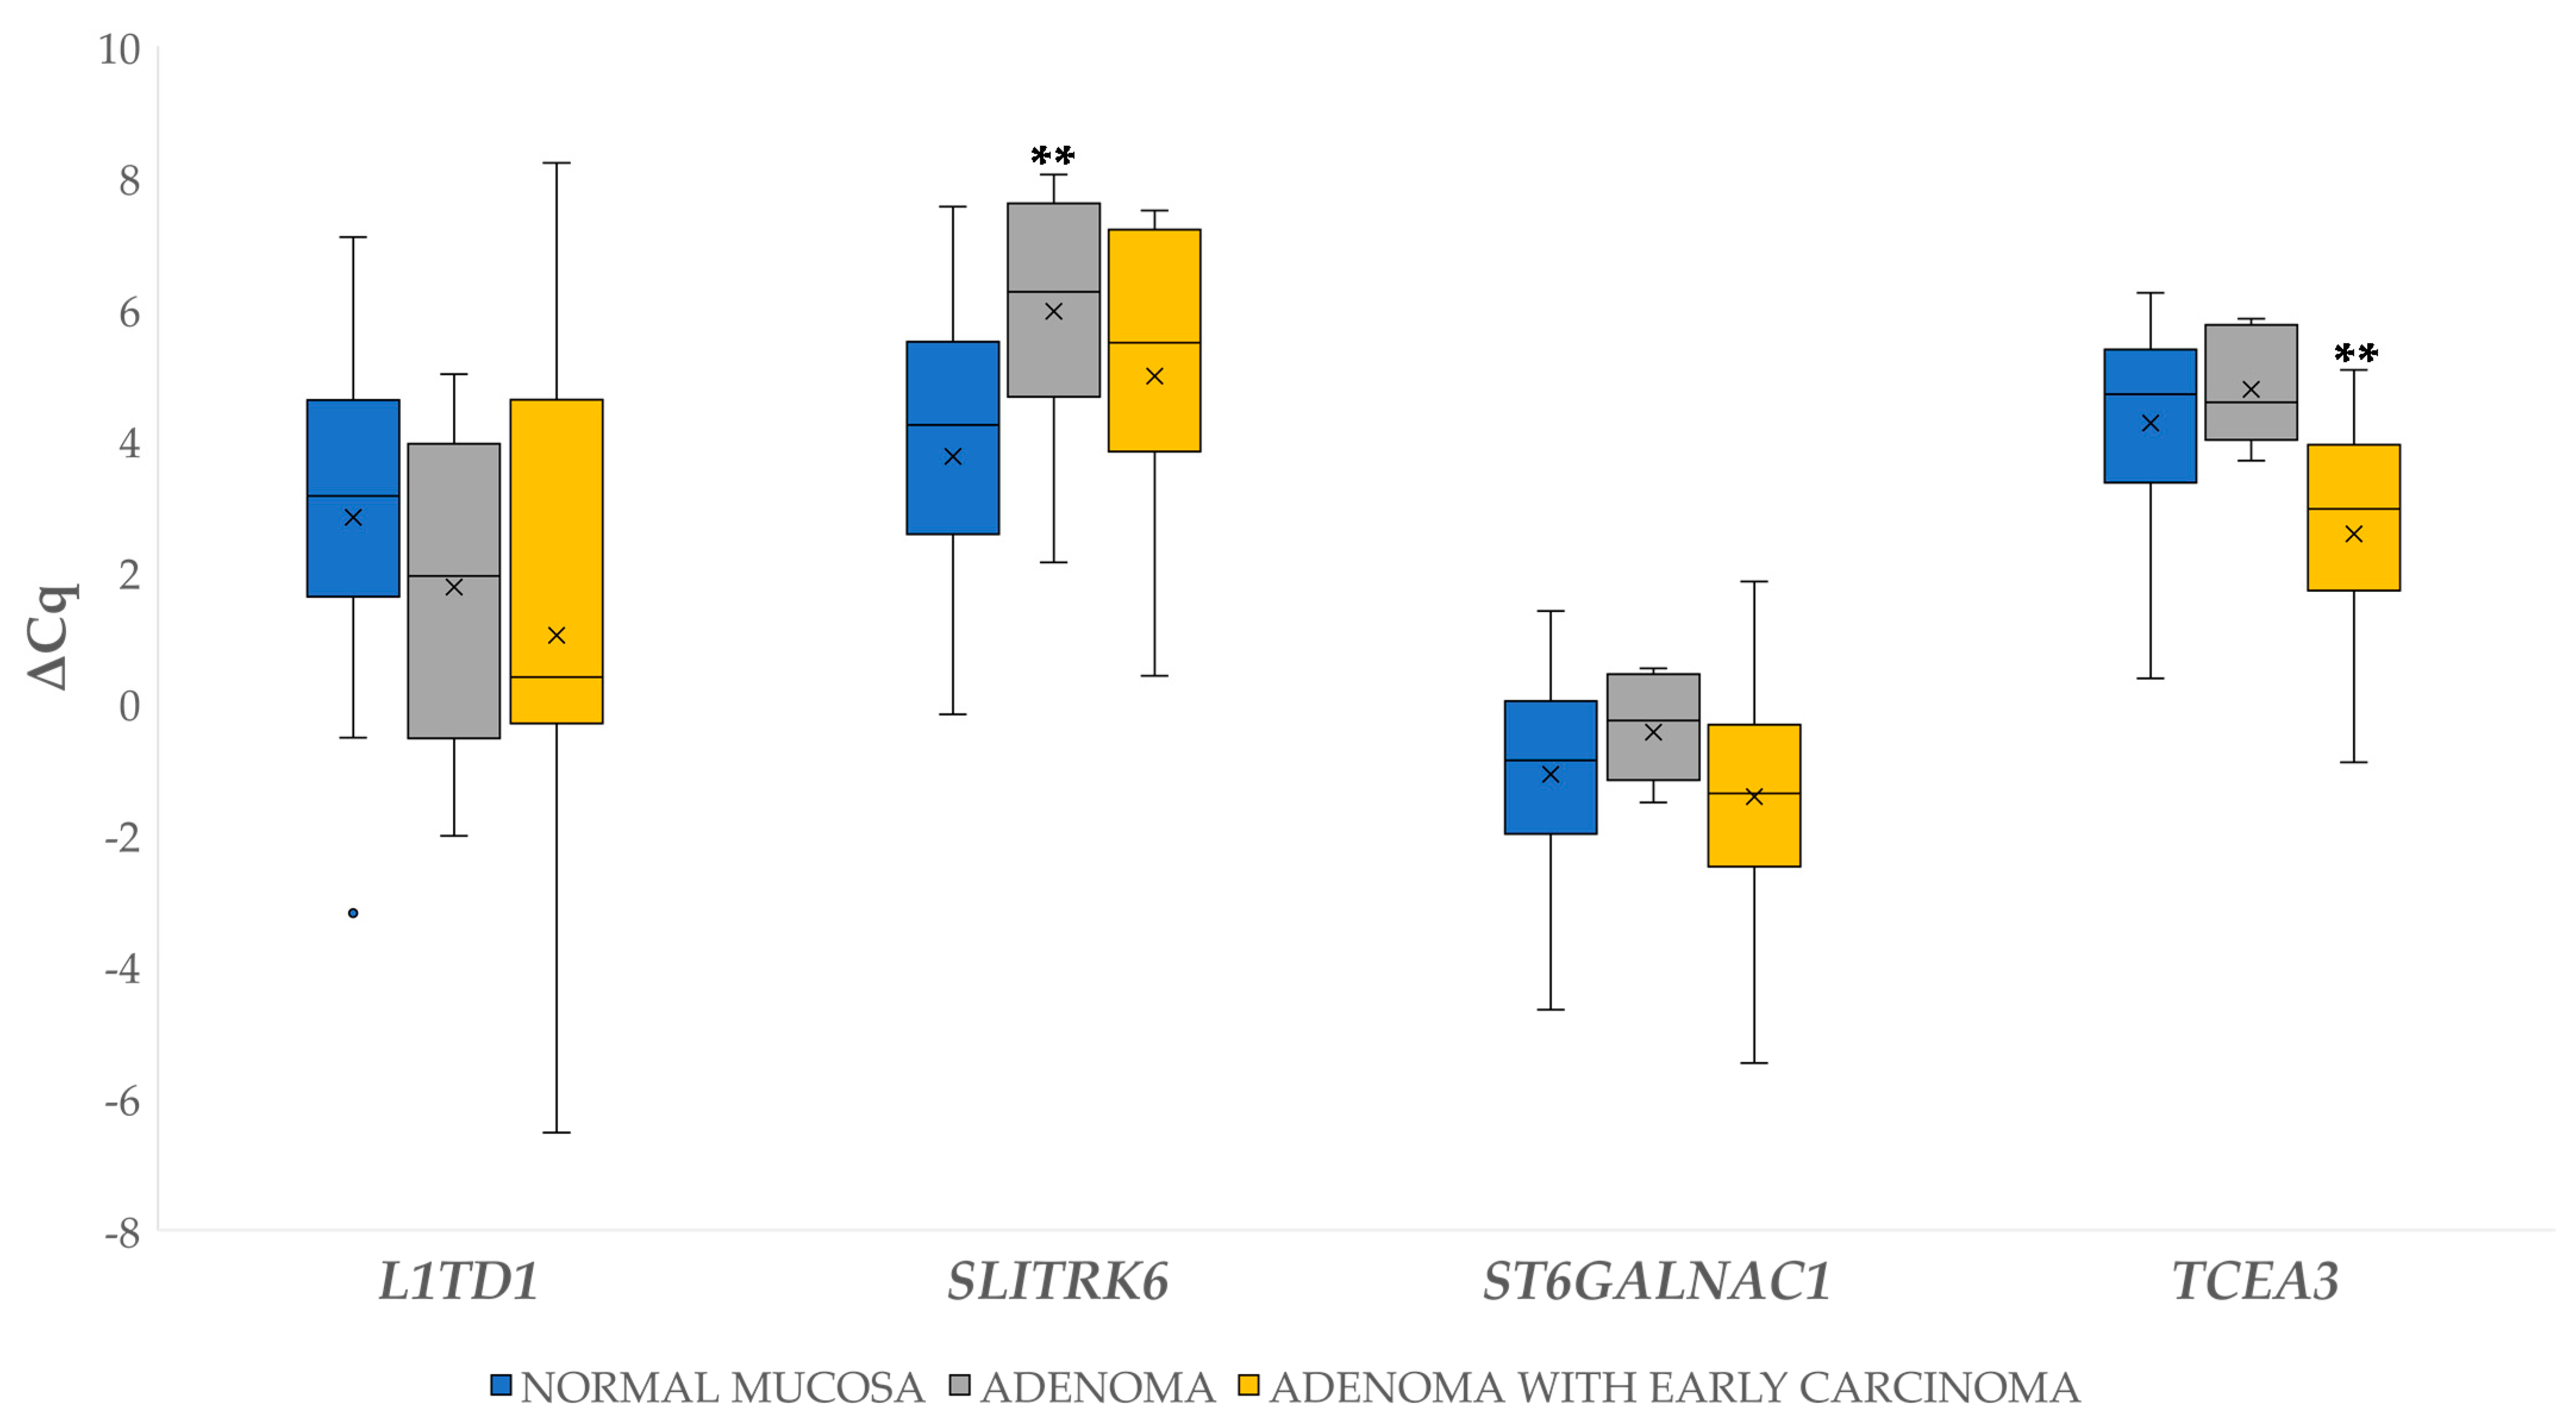
3.2.1. Differential Gene Expression in Adenoma and Adenoma with Early Carcinoma

∆Cq for the investigated genes in adenoma and adenoma with early carcinoma were statistically evaluated independently against normal mucosa samples. Statistically significant results include 6.20-fold downregulation of SLITRK6 (p = 0.010) in adenomas, and 3.22-fold upregulation of TCEA3 in adenomas with early carcinoma (p = 0.006). The results are shown in Figure 2.
We also observed statistically significant 4.58-fold upregulation in adenoma with early carcinoma compared to adenoma for the gene TCEA3 (p ≤ 0.001).

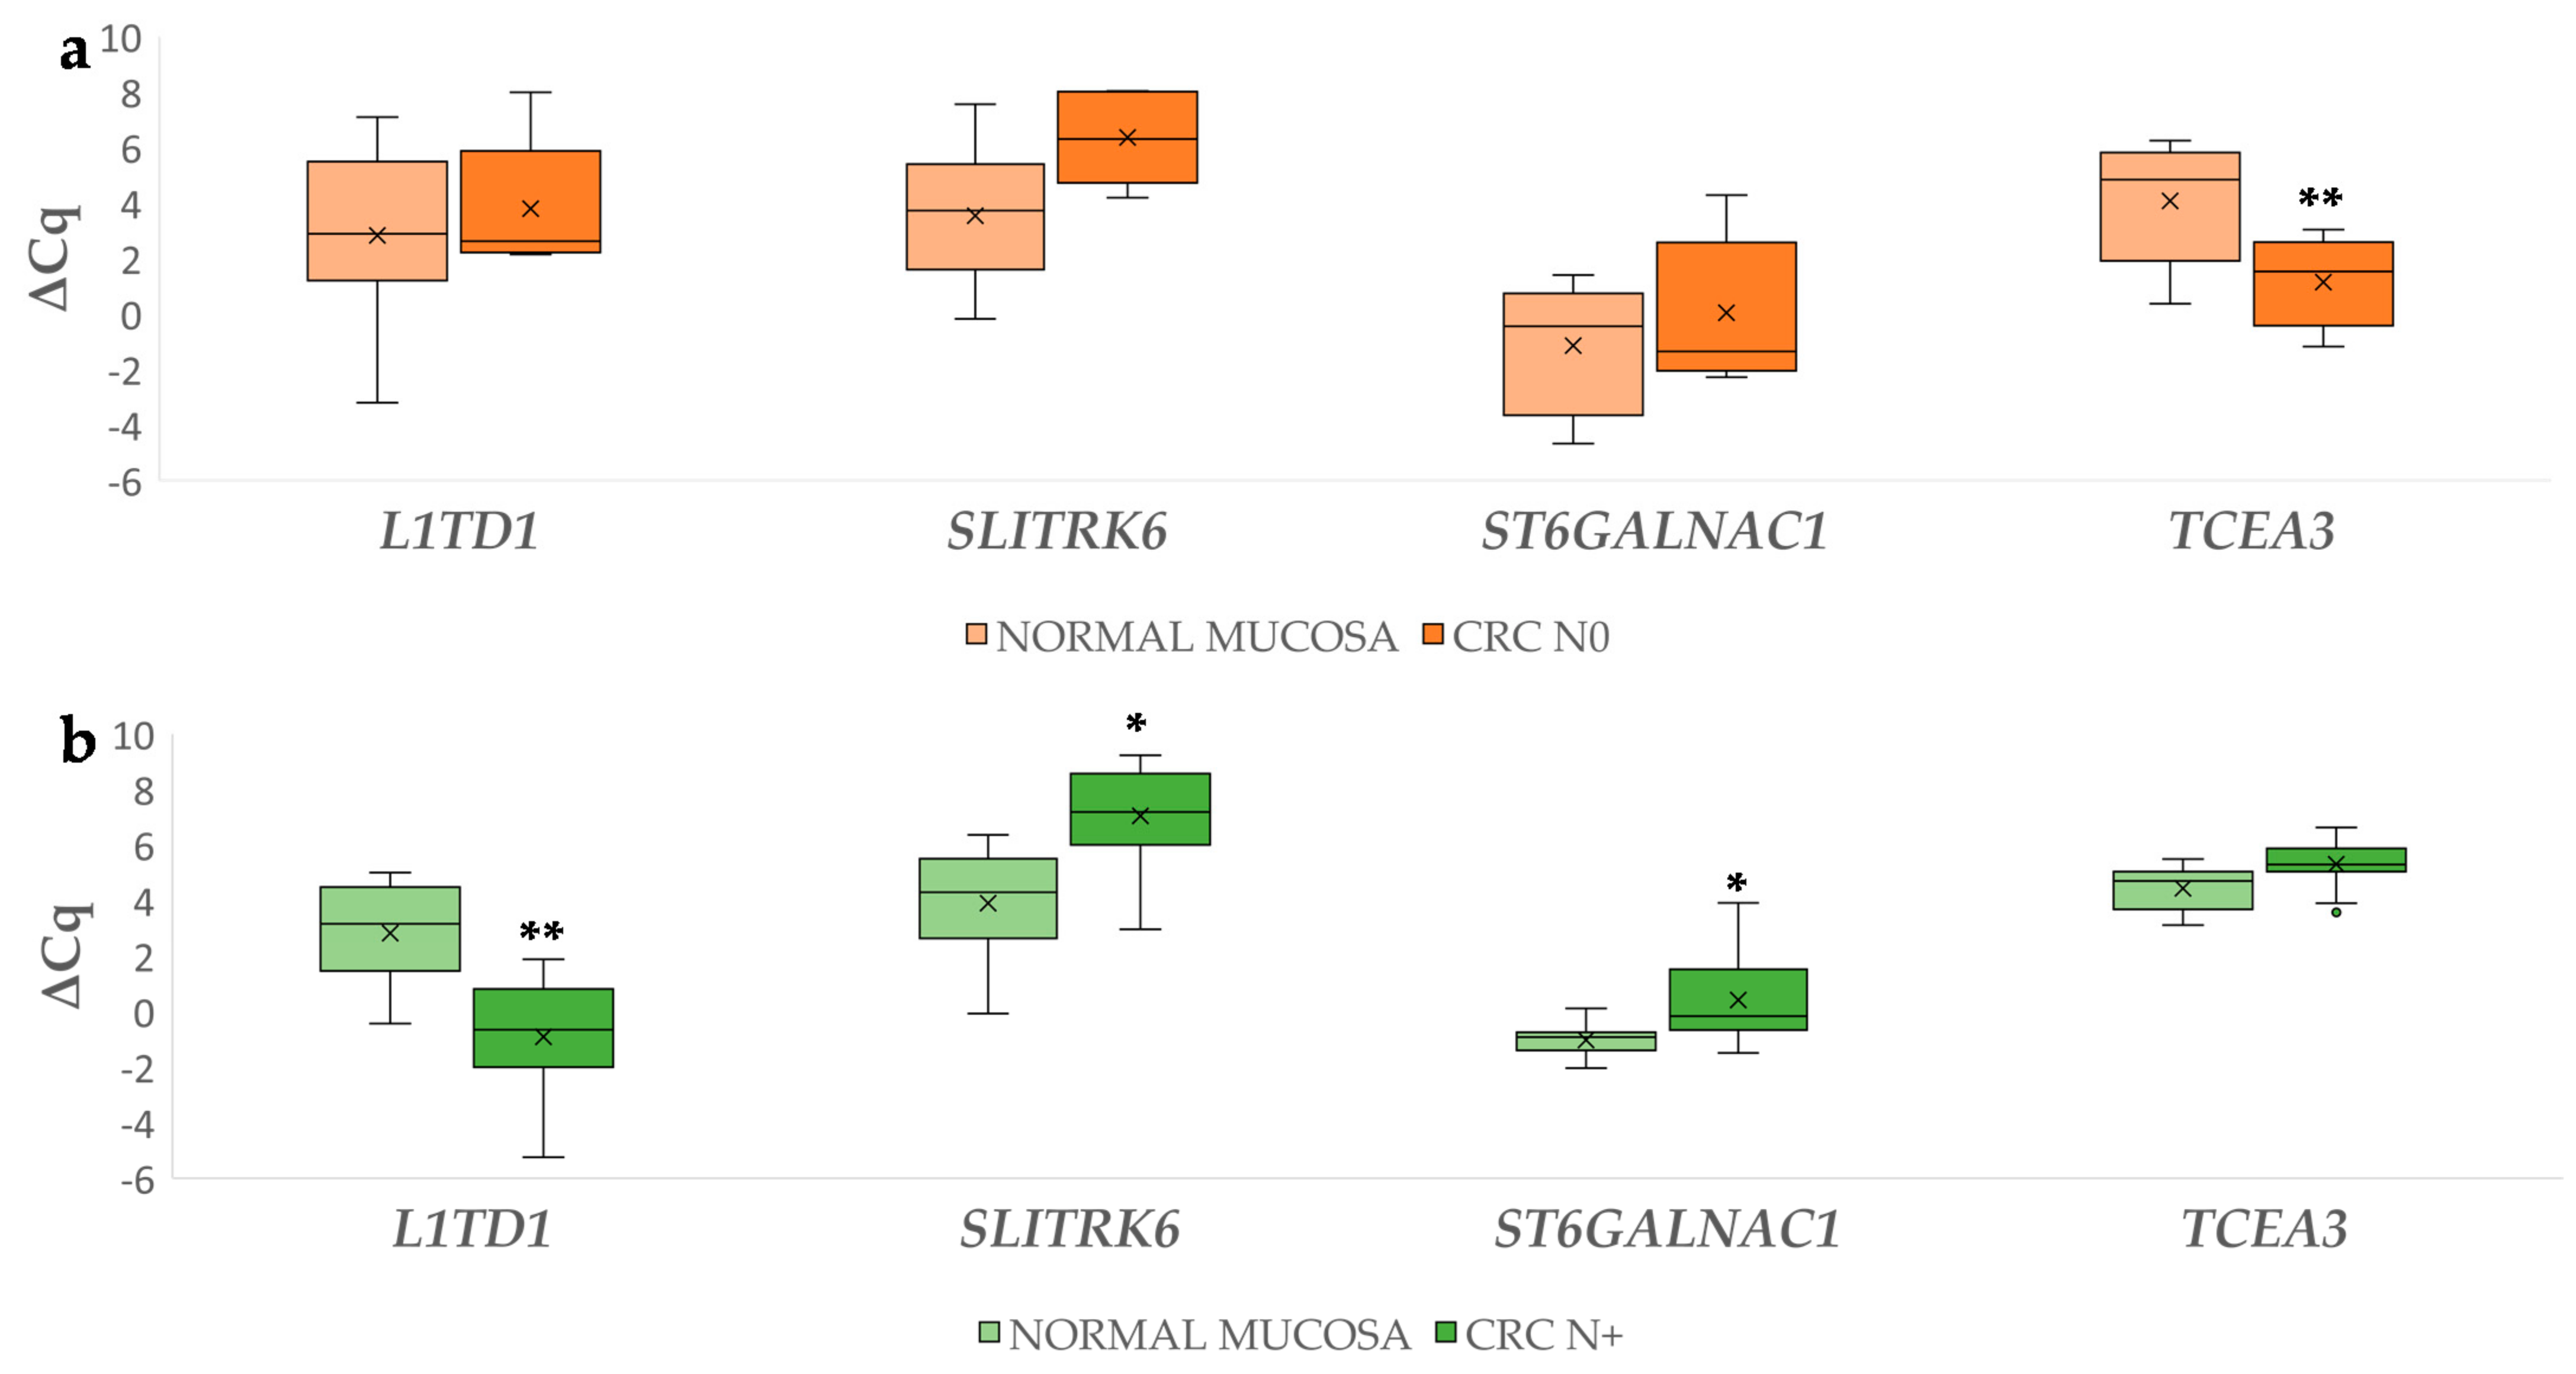
3.2.2. Differential Gene Expression in Carcinoma Compared to Normal Mucosa

Differences in expression of the investigated genes between CRC N0 or CRC N+ and corresponding normal mucosa were calculated using ∆Cq. Statistically significant results include the 7.16-fold upregulation of L1TD1 in CRC N+ (p = 0.008) and 6.16-fold downregulation of SLITRK6 (p = 0.039) and 3.10-fold for ST6GALNAC1 (p = 0.02) in CRC N+. Additionally, 7.97-fold upregulation of TCEA3 in the CRC N0 (p = 0.004) was also observed. The results are shown in Figure 3.

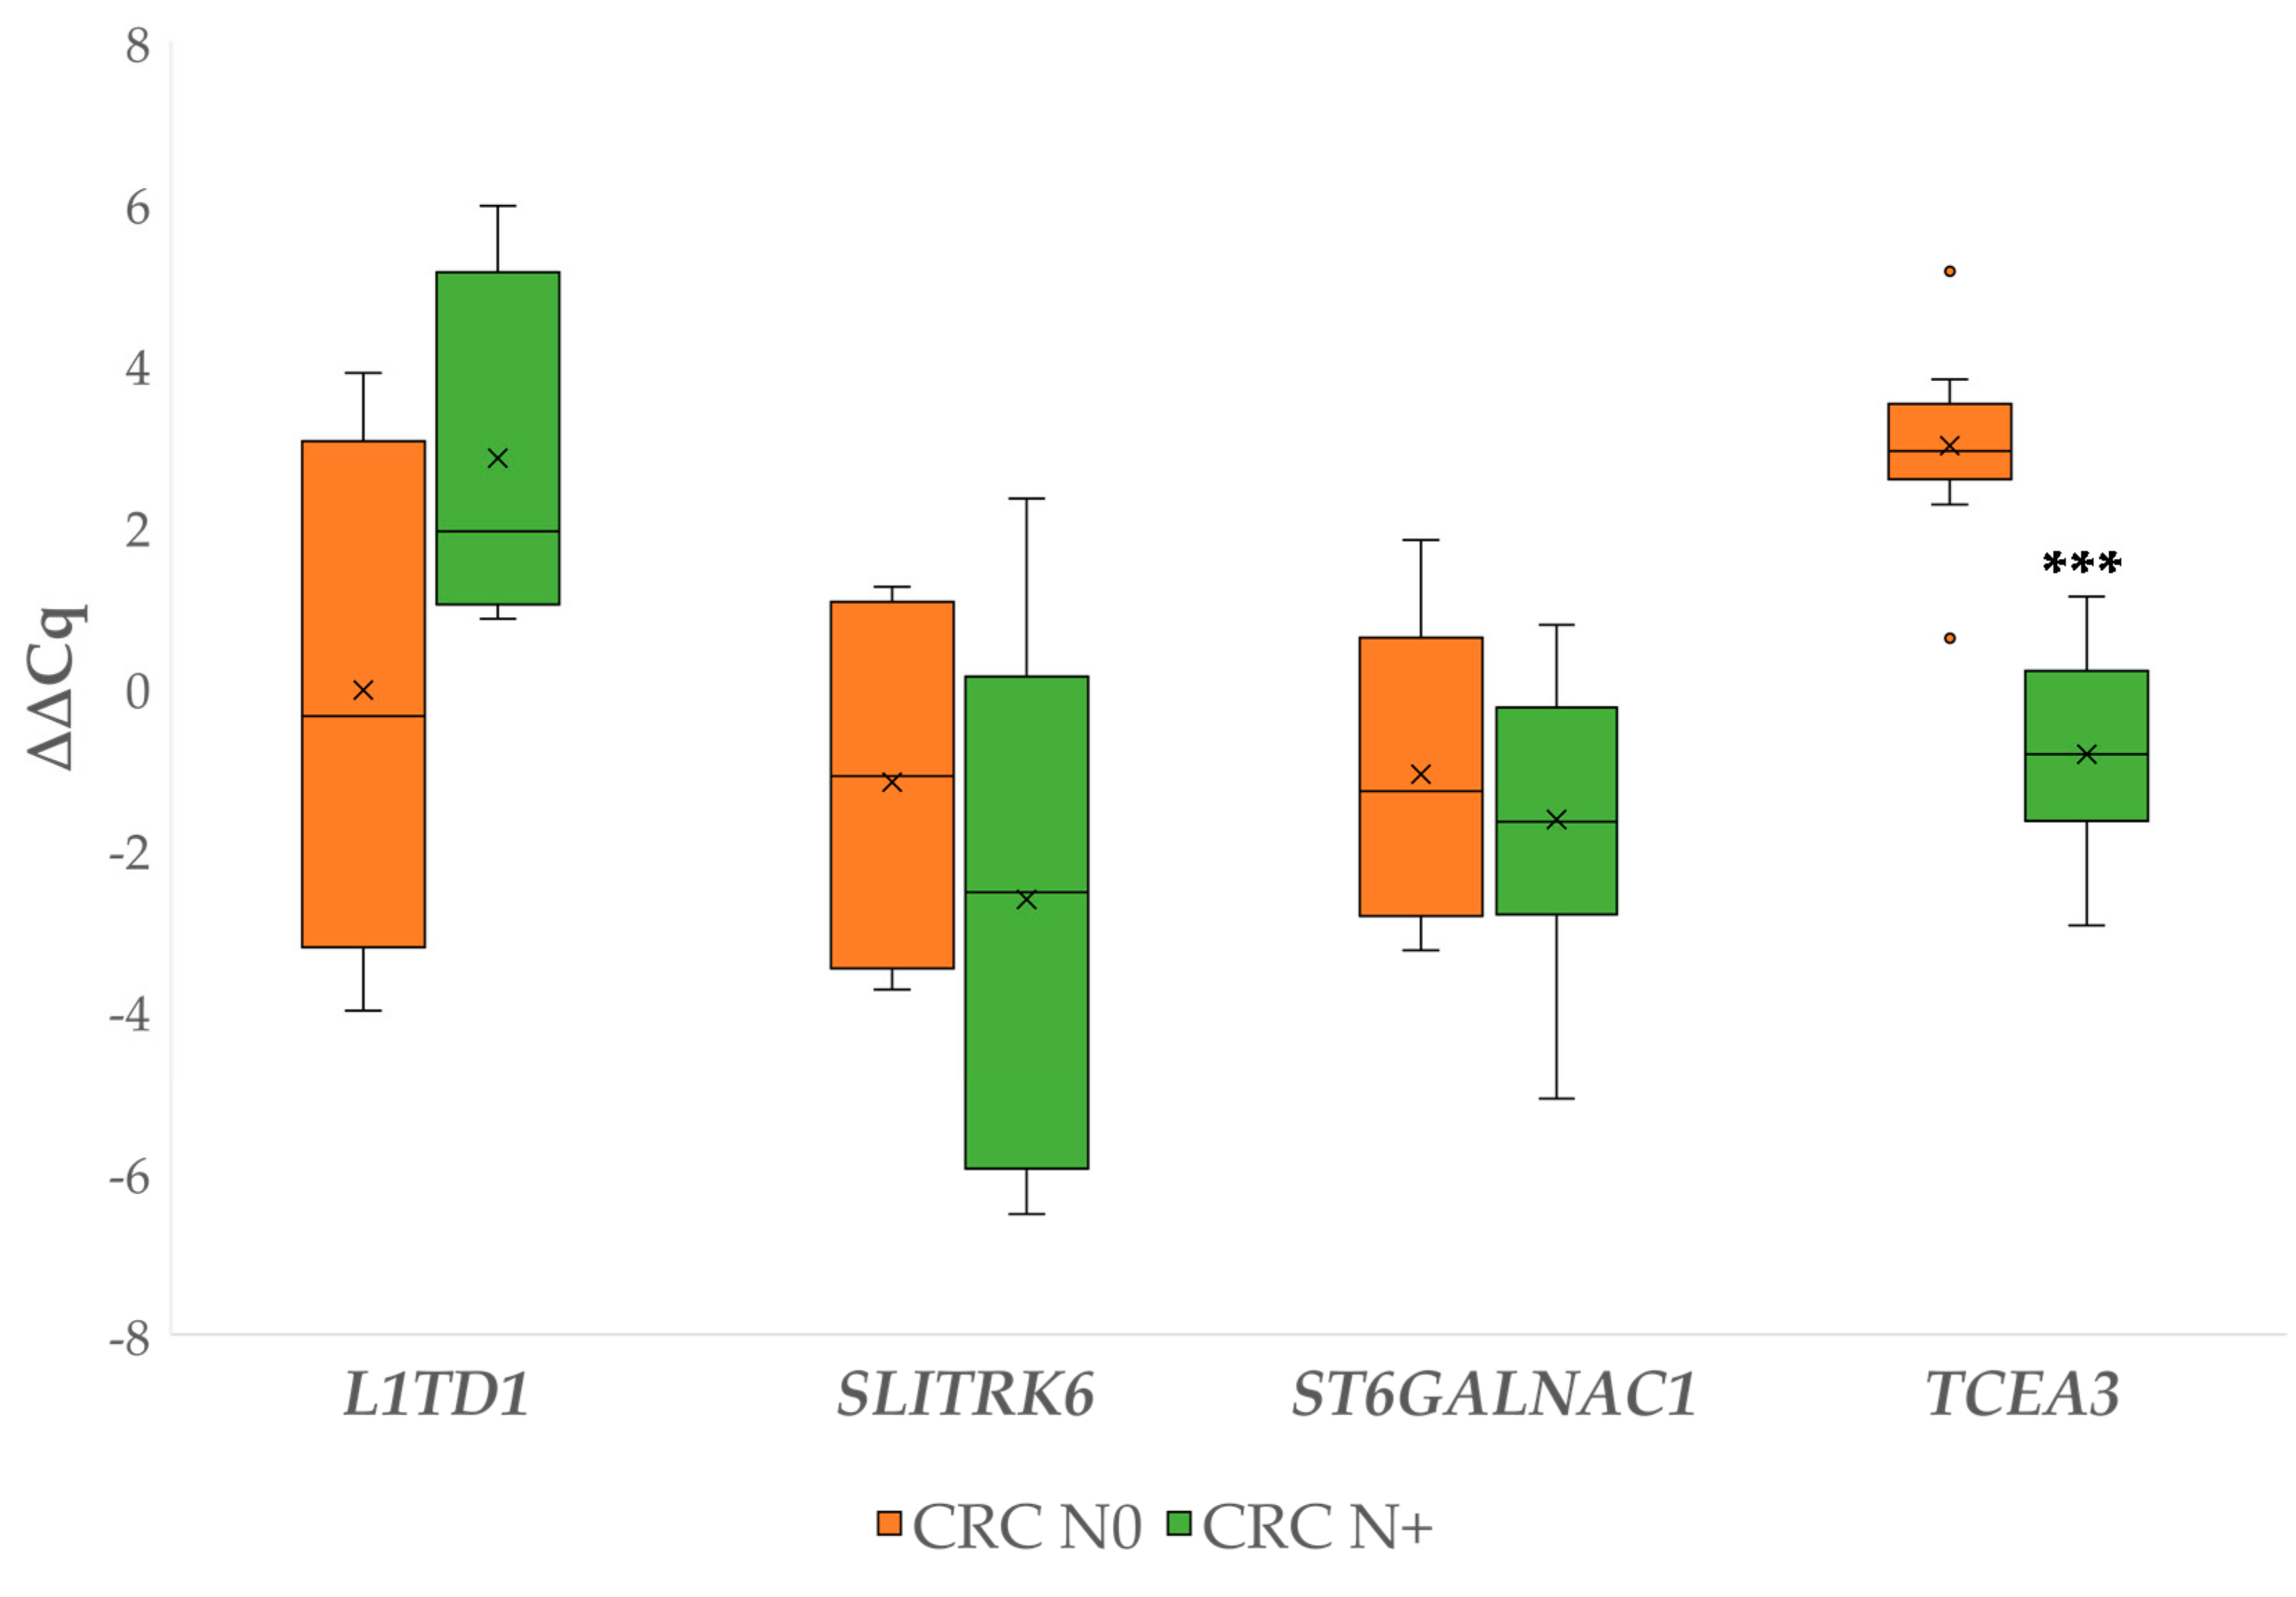
3.2.3. Gene Expression in Carcinoma with Lymph Node Metastases Compared to Carcinoma without Lymph Node Metastases

∆Cq values for each carcinoma case were first calculated against the corresponding normal mucosa. Then, the independent ∆∆Cq comparisons for the investigated genes between the CRC N0 and CRC N+ were performed. Statistical significance was identified for TCEA3, which was upregulated in the CRC N0 group compared to CRC N+ (p ≤ 0.000). The results are shown in Figure 4. The complete statistical comparisons are available in Table S2.

3.3. Prioritization of Potential miRNA-Target Gene Associations

Only miRNAs with a known functional association with cancer or which appeared in at least two databases in correlation with the target gene were considered for further prioritization.
The complete results of the miRNA prioritization for target genes correlations with relevant information and manual alignment with free energy comparisons and secondary structure identification are available in Tables S3 and S4. The complete results of the RNA22 analysis are presented in Table S5.
After comparison of the results of analyses presented in Tables S3–S5, we identified several miRNAs for further validation. A condensed view of choosing a specific miRNA for further validation in association with a potential target gene is presented in Table 3. The minimum requirements are in bold. Only cases with DSEs present in the sequence, a known previous association with the target gene and a previous association with CRC, are included.

3.4. Differential miRNA Expression

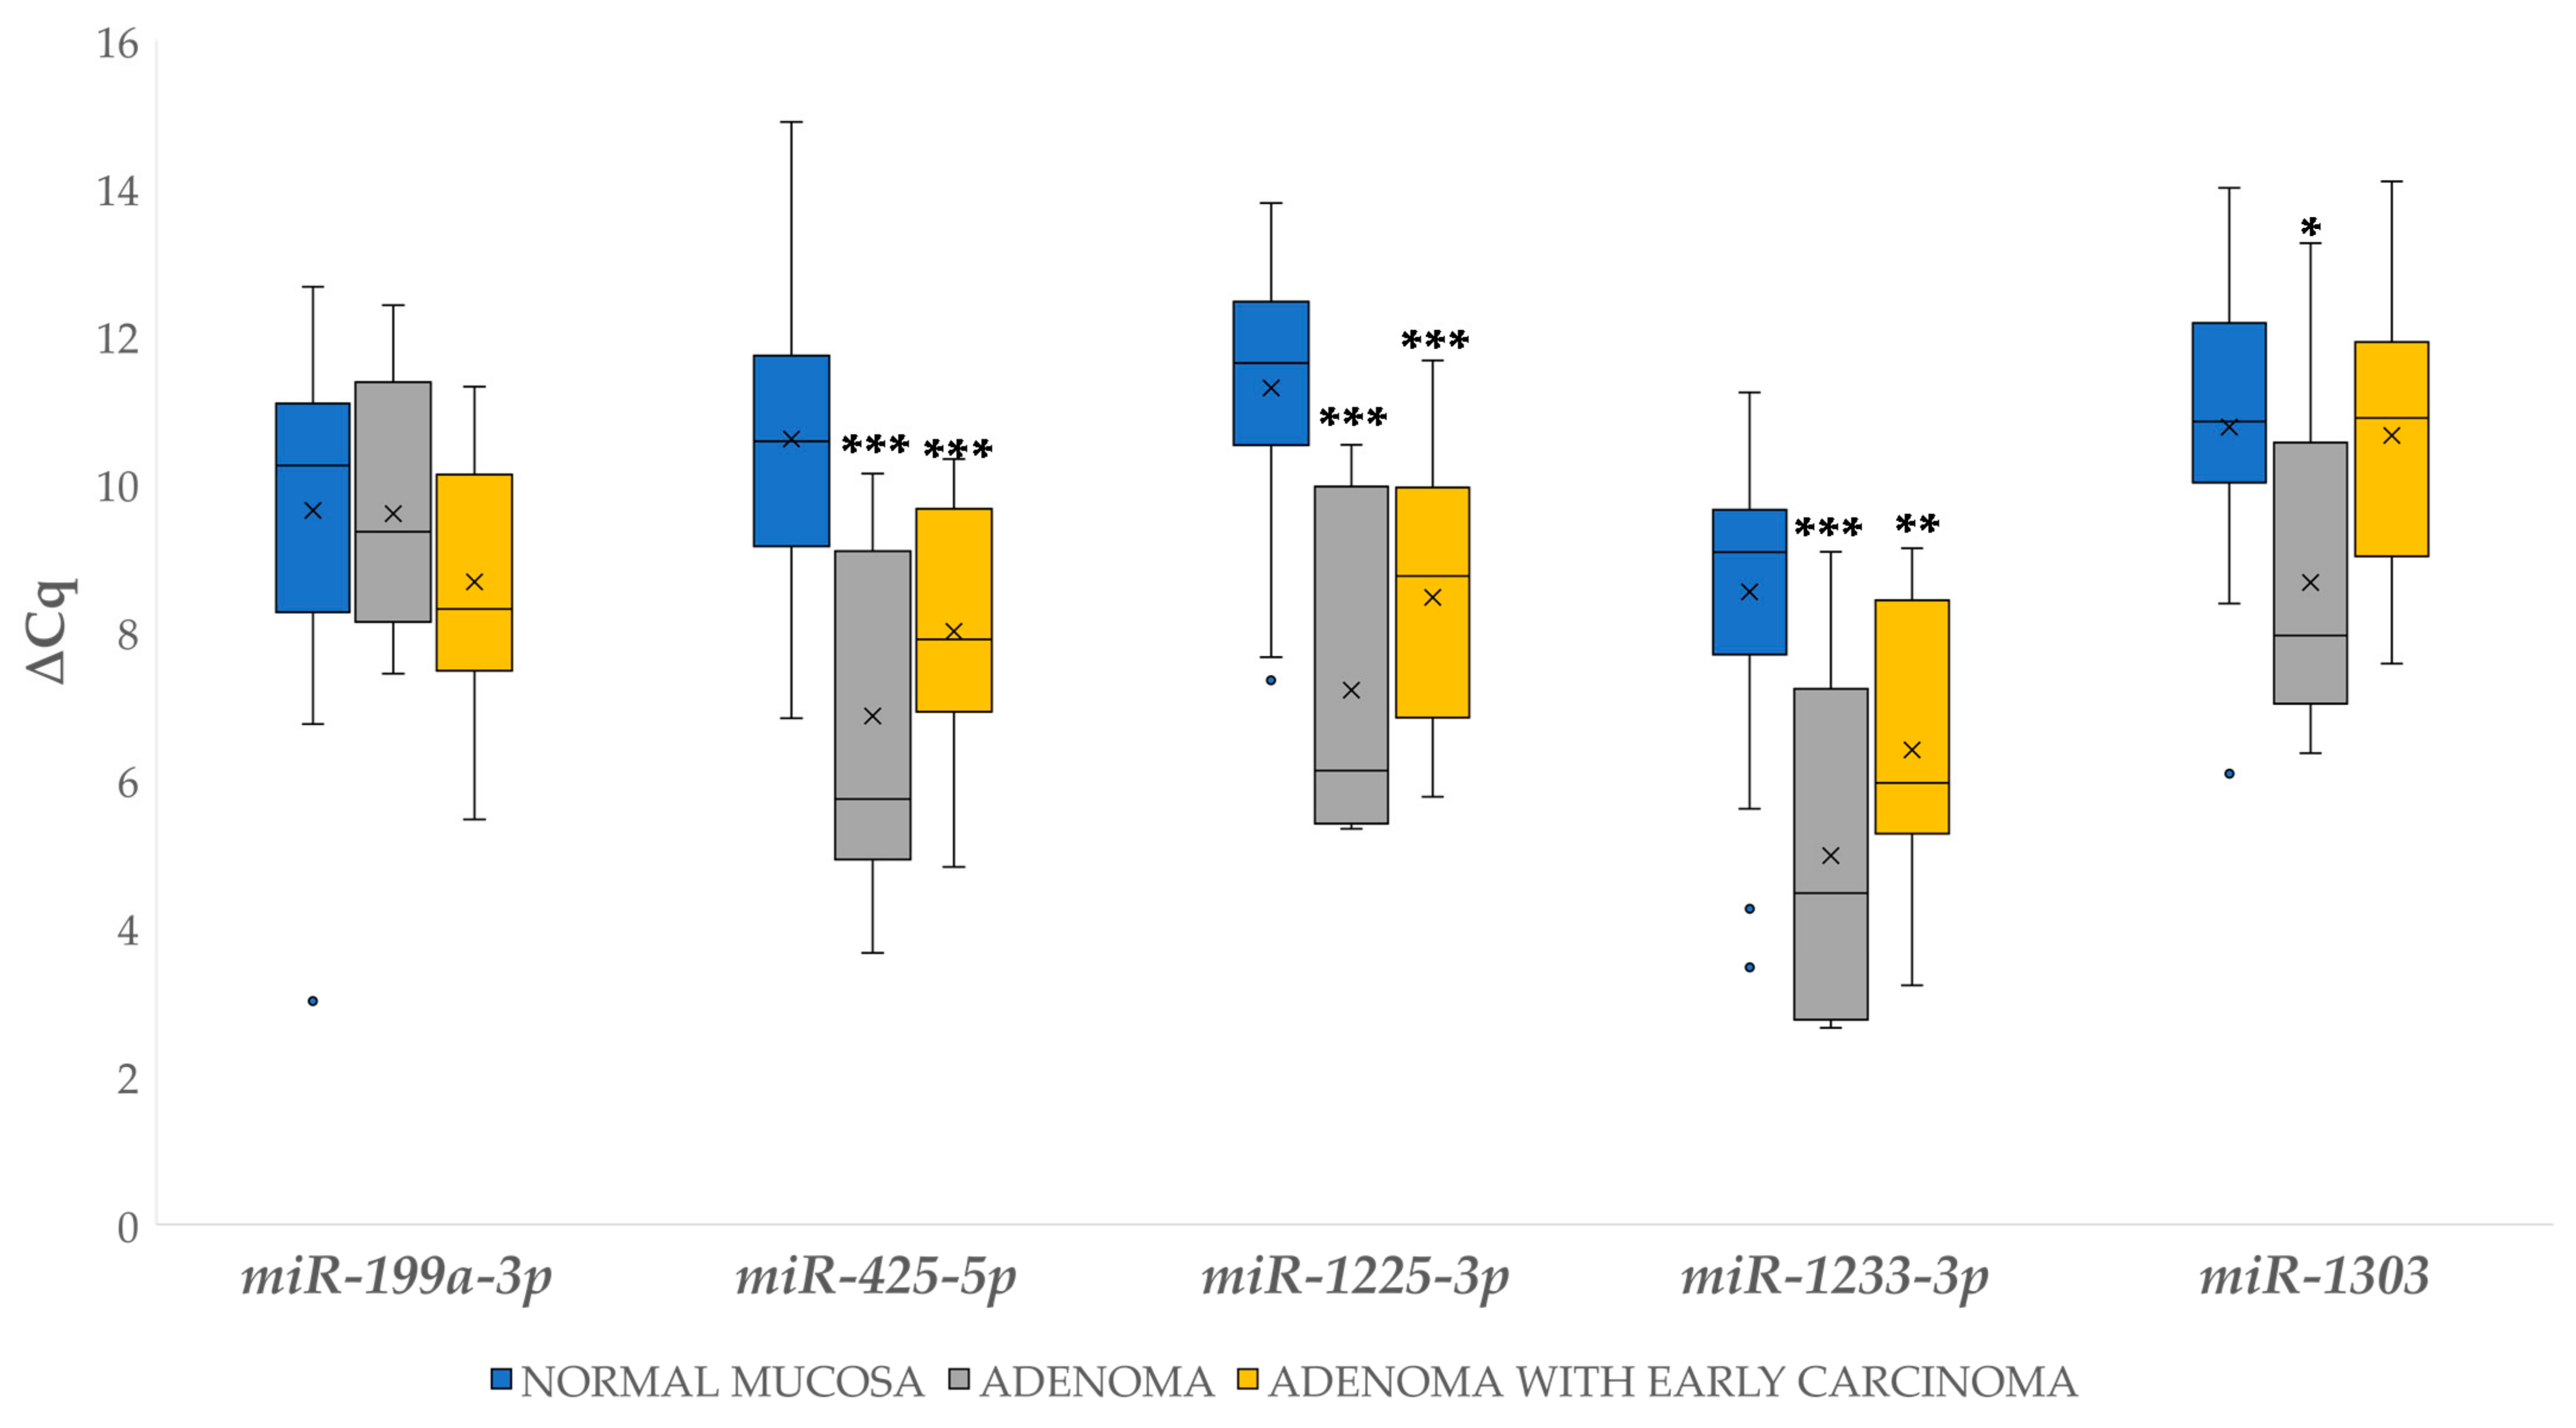
3.4.1. Differential Expression of miRNAs in Adenoma and Adenoma with Early Carcinoma

We compared ∆Cq values of the investigated miRNAs in adenomas and adenoma with early carcinoma to normal mucosa samples. Among the investigated miRNAs, miR-335-5p was not expressed in normal mucosa, adenoma and adenoma with early carcinoma.
Statistically significant changes in expression included upregulation for the majority of miRNAs in both adenoma and adenoma, with early carcinoma in comparison to normal mucosa: 13.43-fold and 6.07-fold for miR-425-5p (p < 0.001, p < 0.001), respectively; 16.97-fold and 6.78-fold for miR-1225-3p (p < 0.001, p < 0.001), respectively; and 11.86-fold and 4.40-fold for miR-1233-3p (p < 0.001, p = 0.003), respectively. miR-1303 was significantly 4.29-fold upregulated only in the adenoma group (p = 0.025). The results are shown in Figure 5.

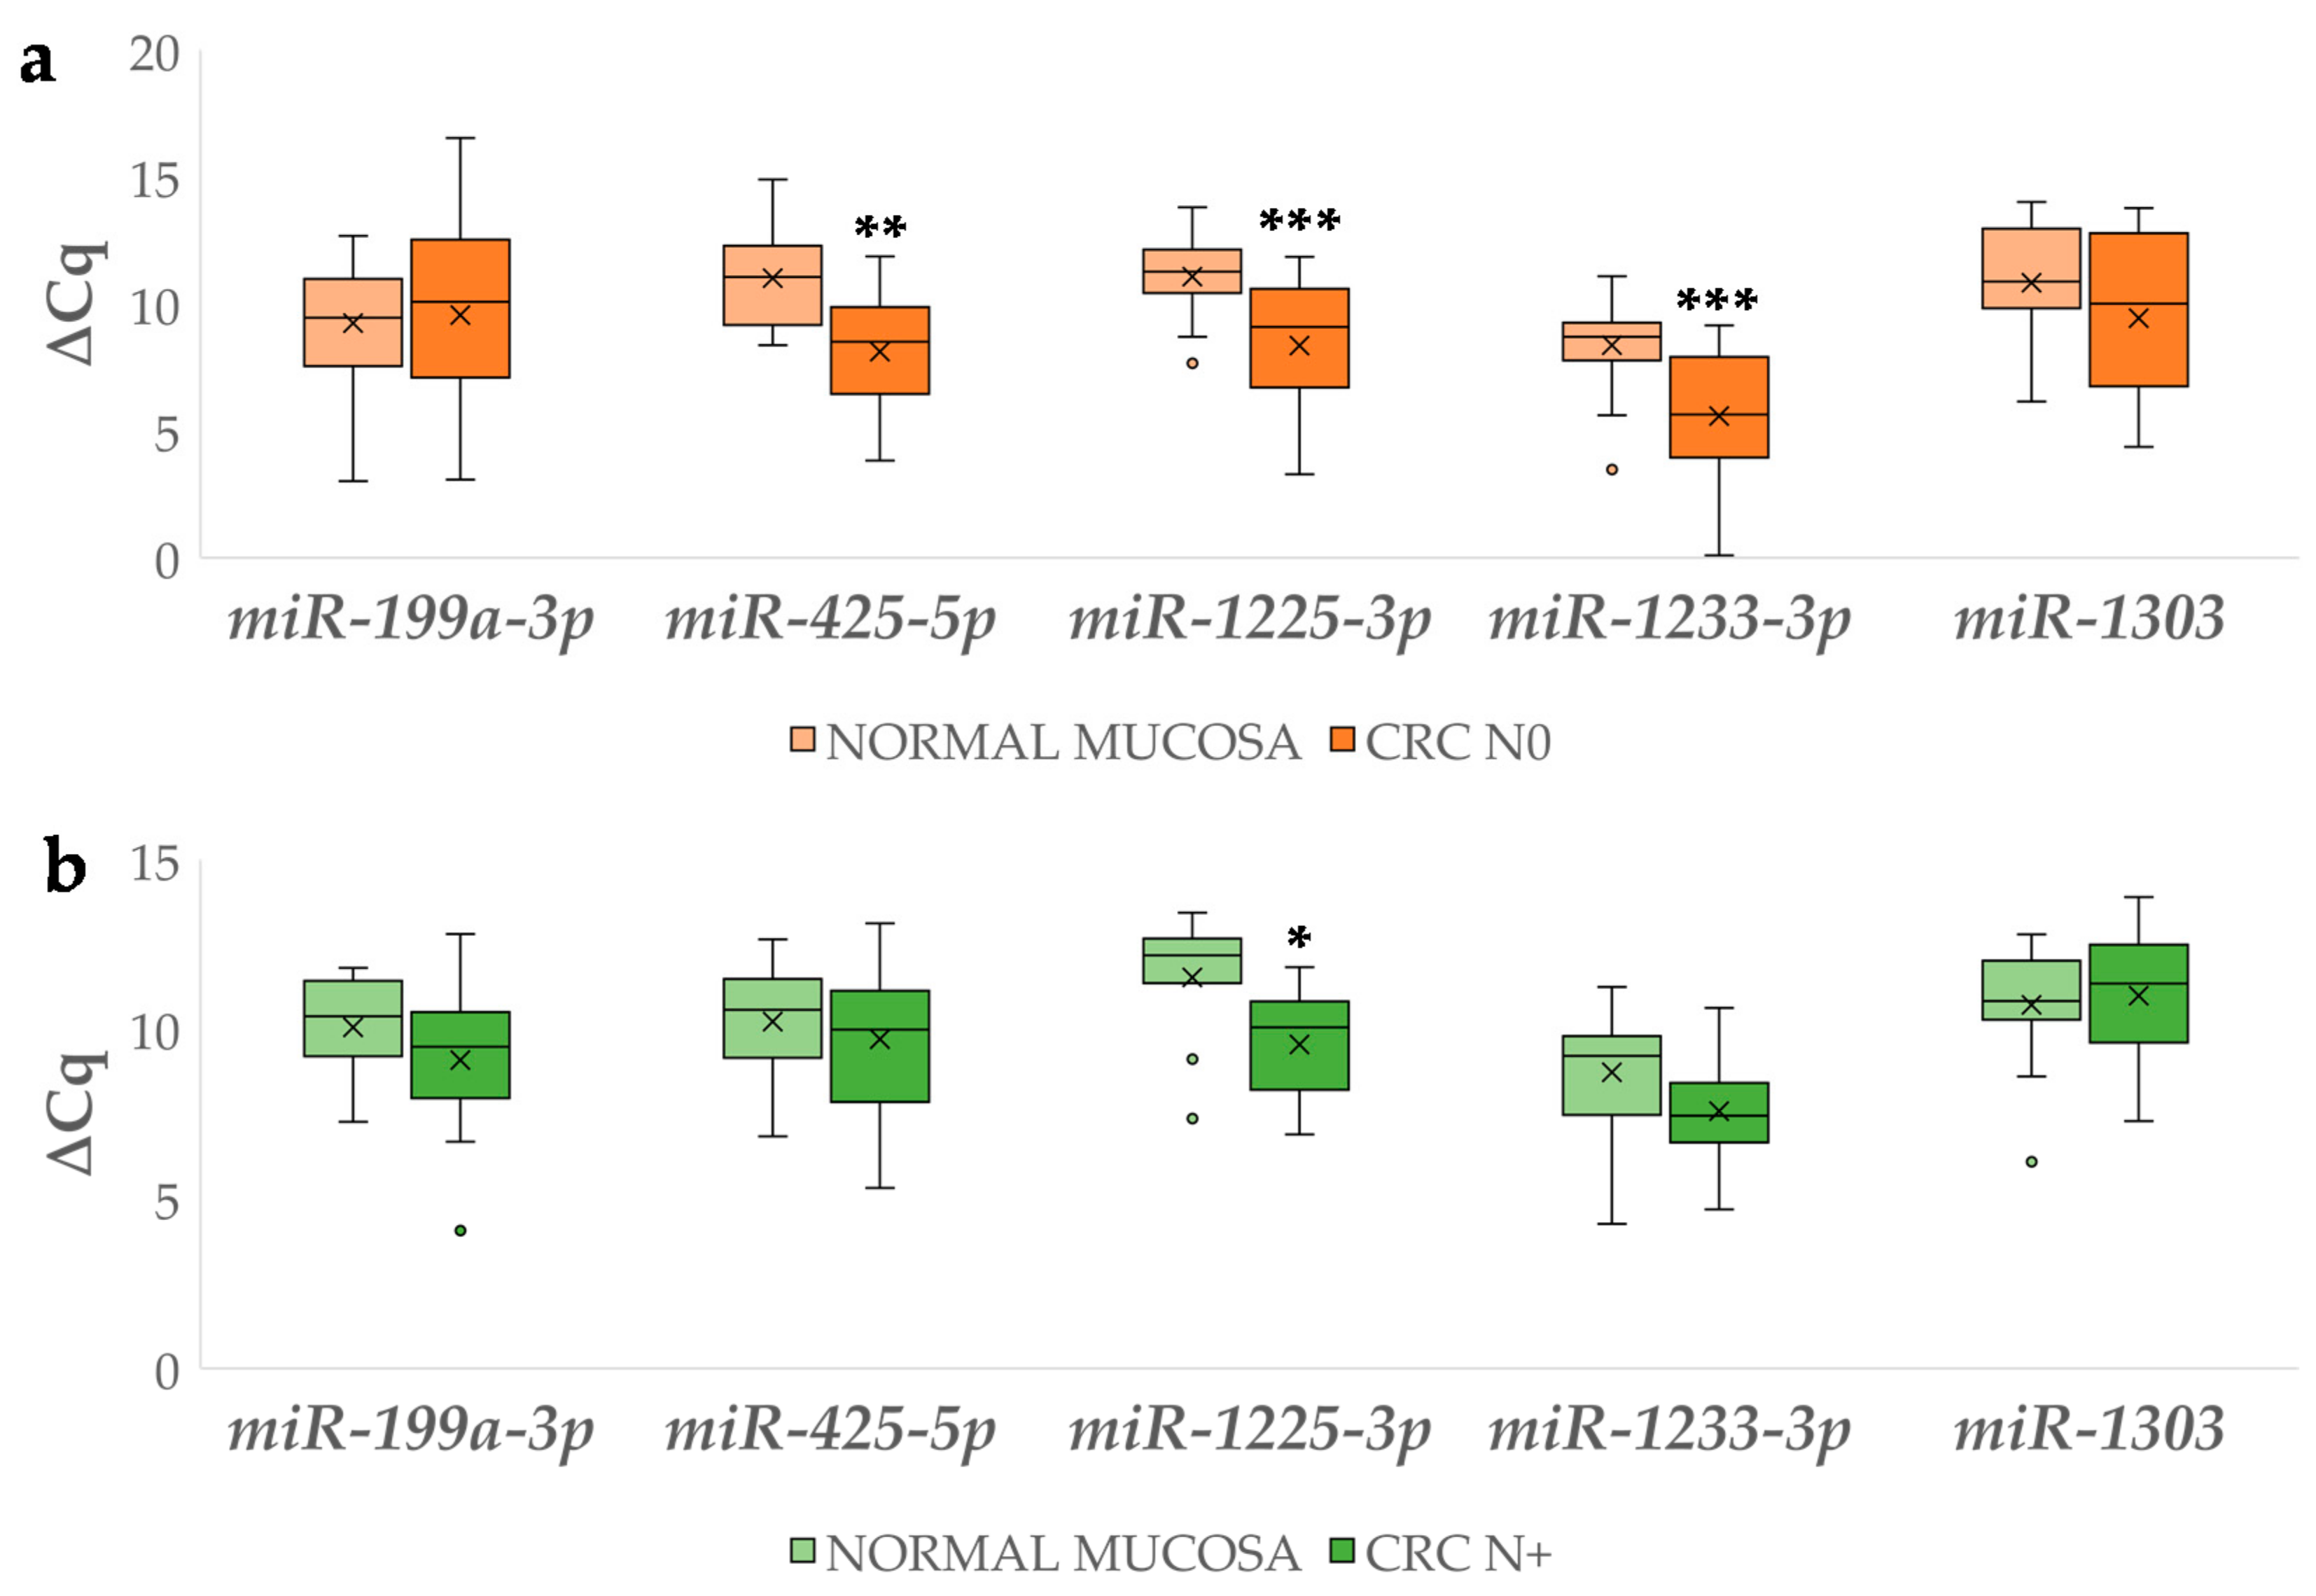
3.4.2. Differential miRNA Expression in Carcinoma with and without Lymph Node Metastases Compared to Corresponding Normal Mucosa

∆Cq values for the investigated miRNAs were compared between CRC N0 and CRC N+ and their corresponding normal mucosa, as shown in Figure 6. Statistically significant results include the 7.38-fold upregulation of miR-425-5p (p = 0.002), 6.60-fold for miR-1225-3p (p = 0.001) and 6.95-fold for miR-1233-3p (p = 0.001) in CRC N0 and 3.28-fold for miR-1225-3p (p = 0.019) in CRC N+. Among the investigated miRNAs, miR-335-5p was expressed neither in normal mucosa nor in CRC.

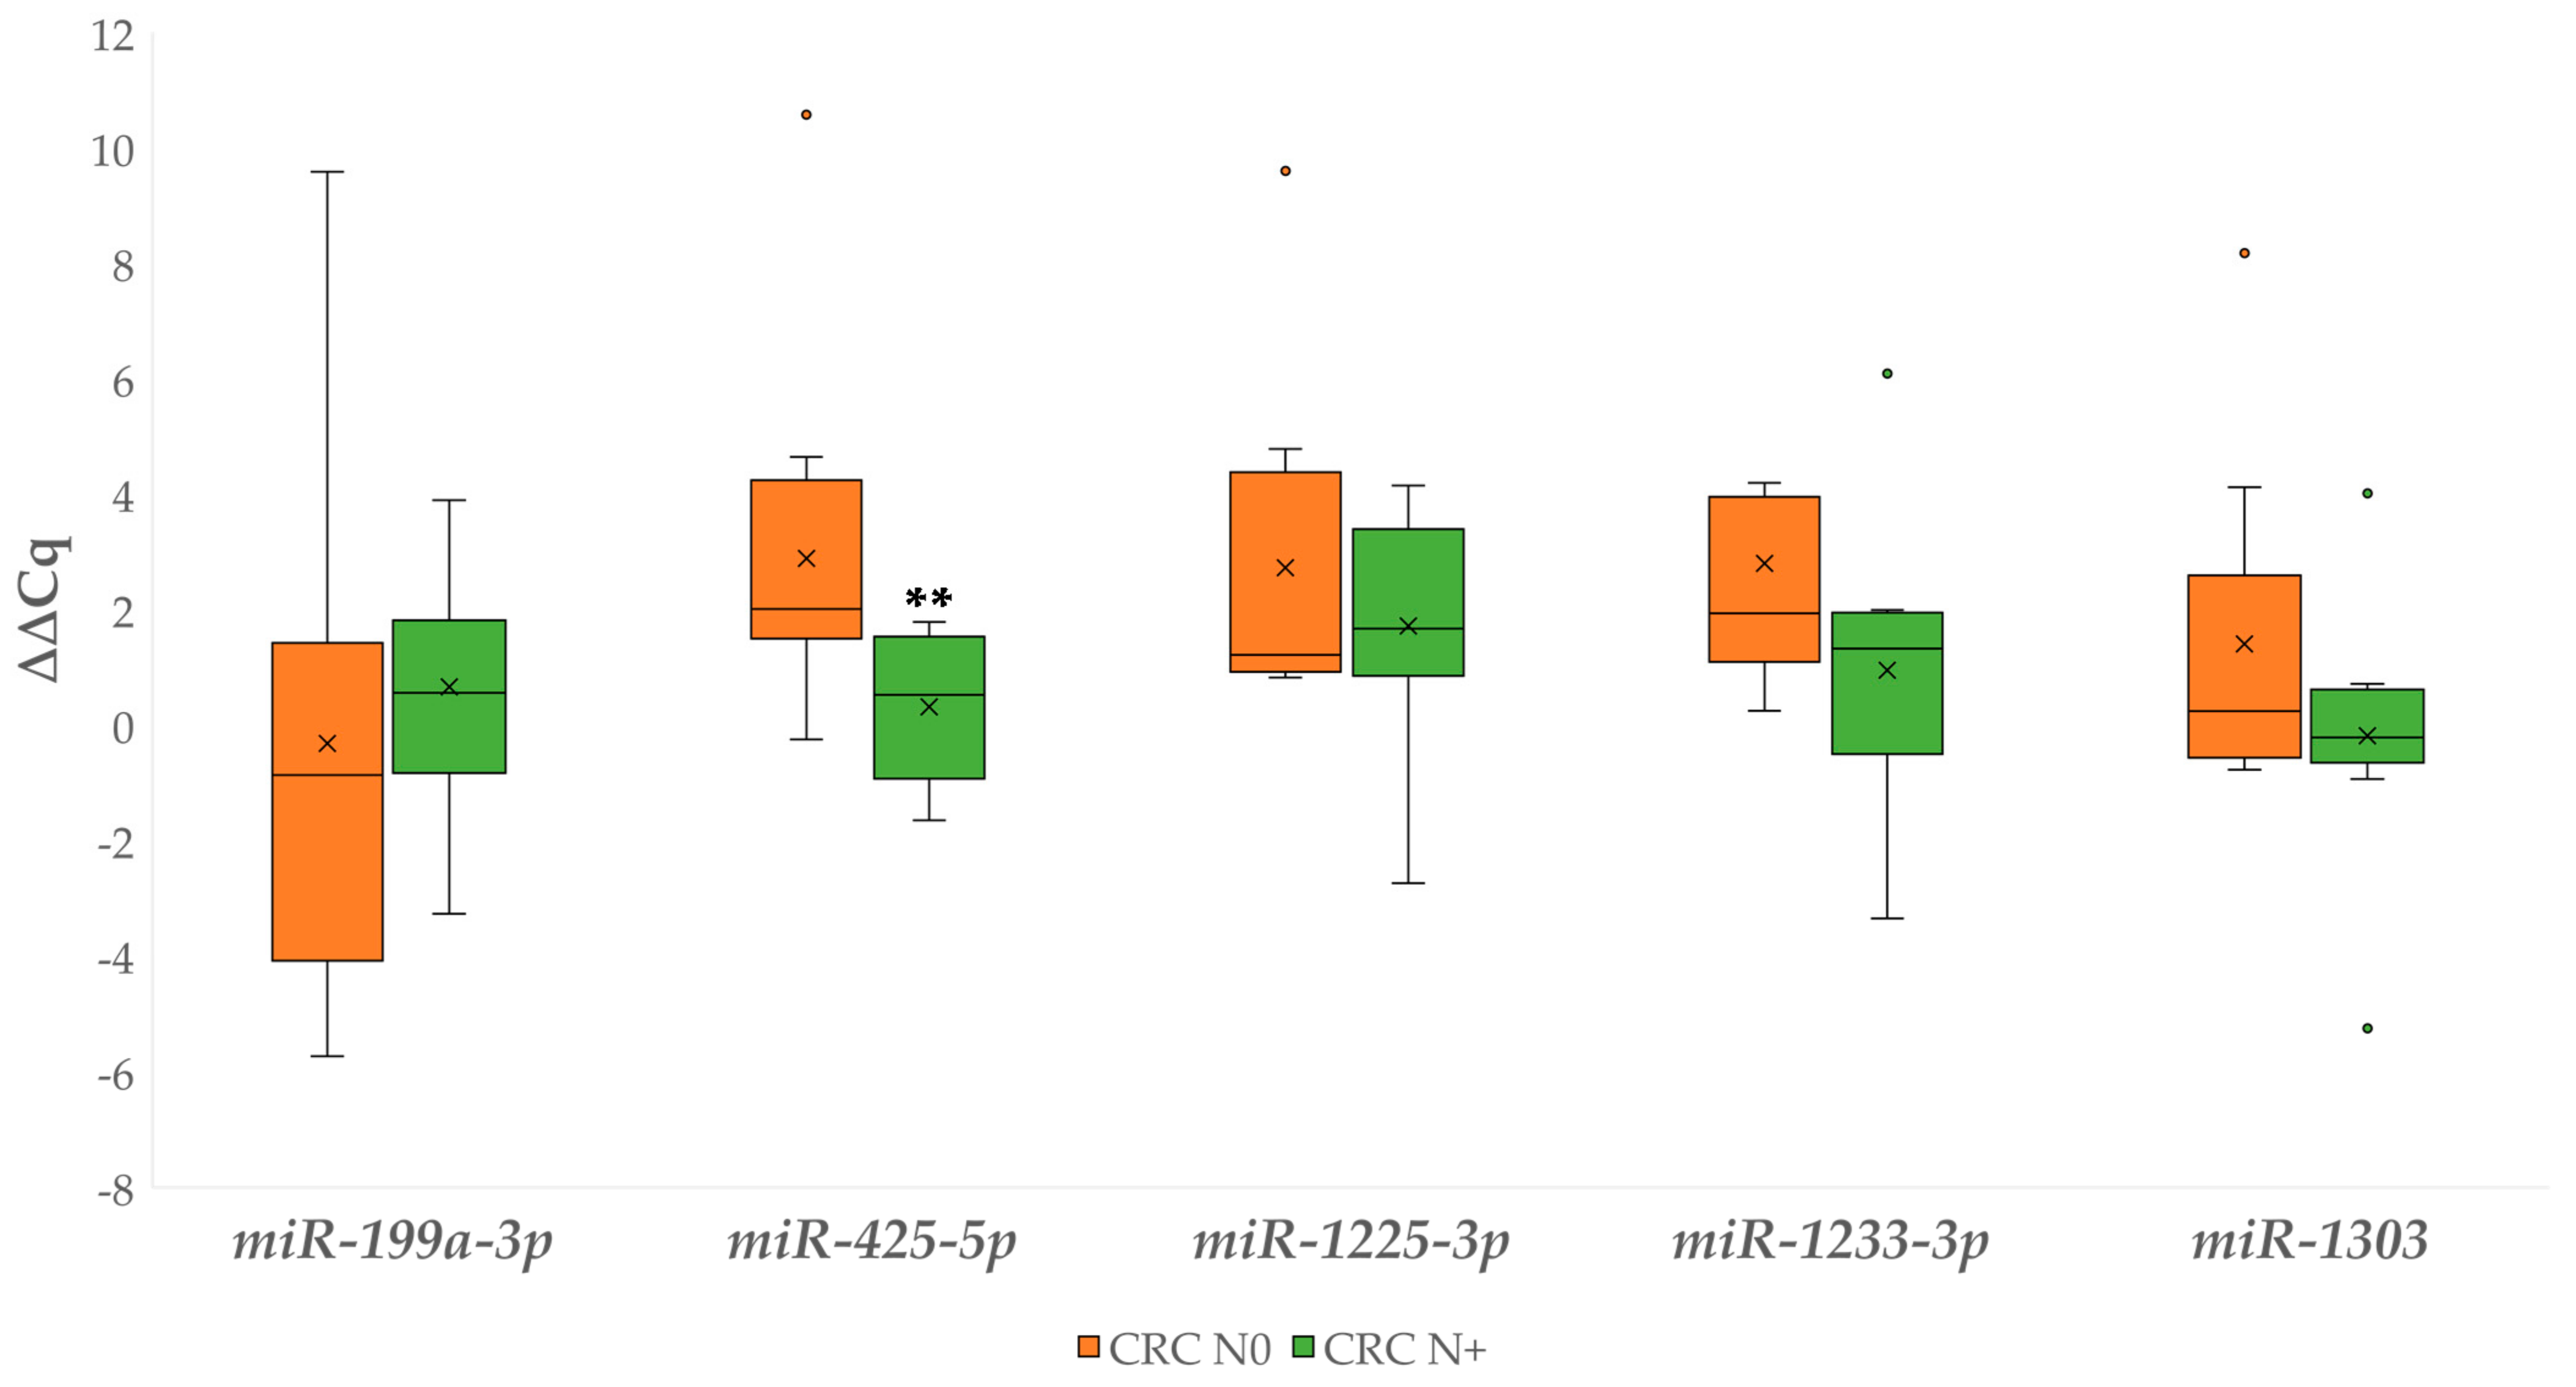
3.4.3. Differential Expression of miRNAs Between Carcinoma with and without Lymph Node Metastases

Figure 7 shows independent ∆∆Cq comparisons for the investigated miRNAs between the CRC N0 and CRC N+, which revealed a statistically significant difference in the expression of miR-425-5p (p = 0.003). Additional statistical comparisons are available in Table S6.

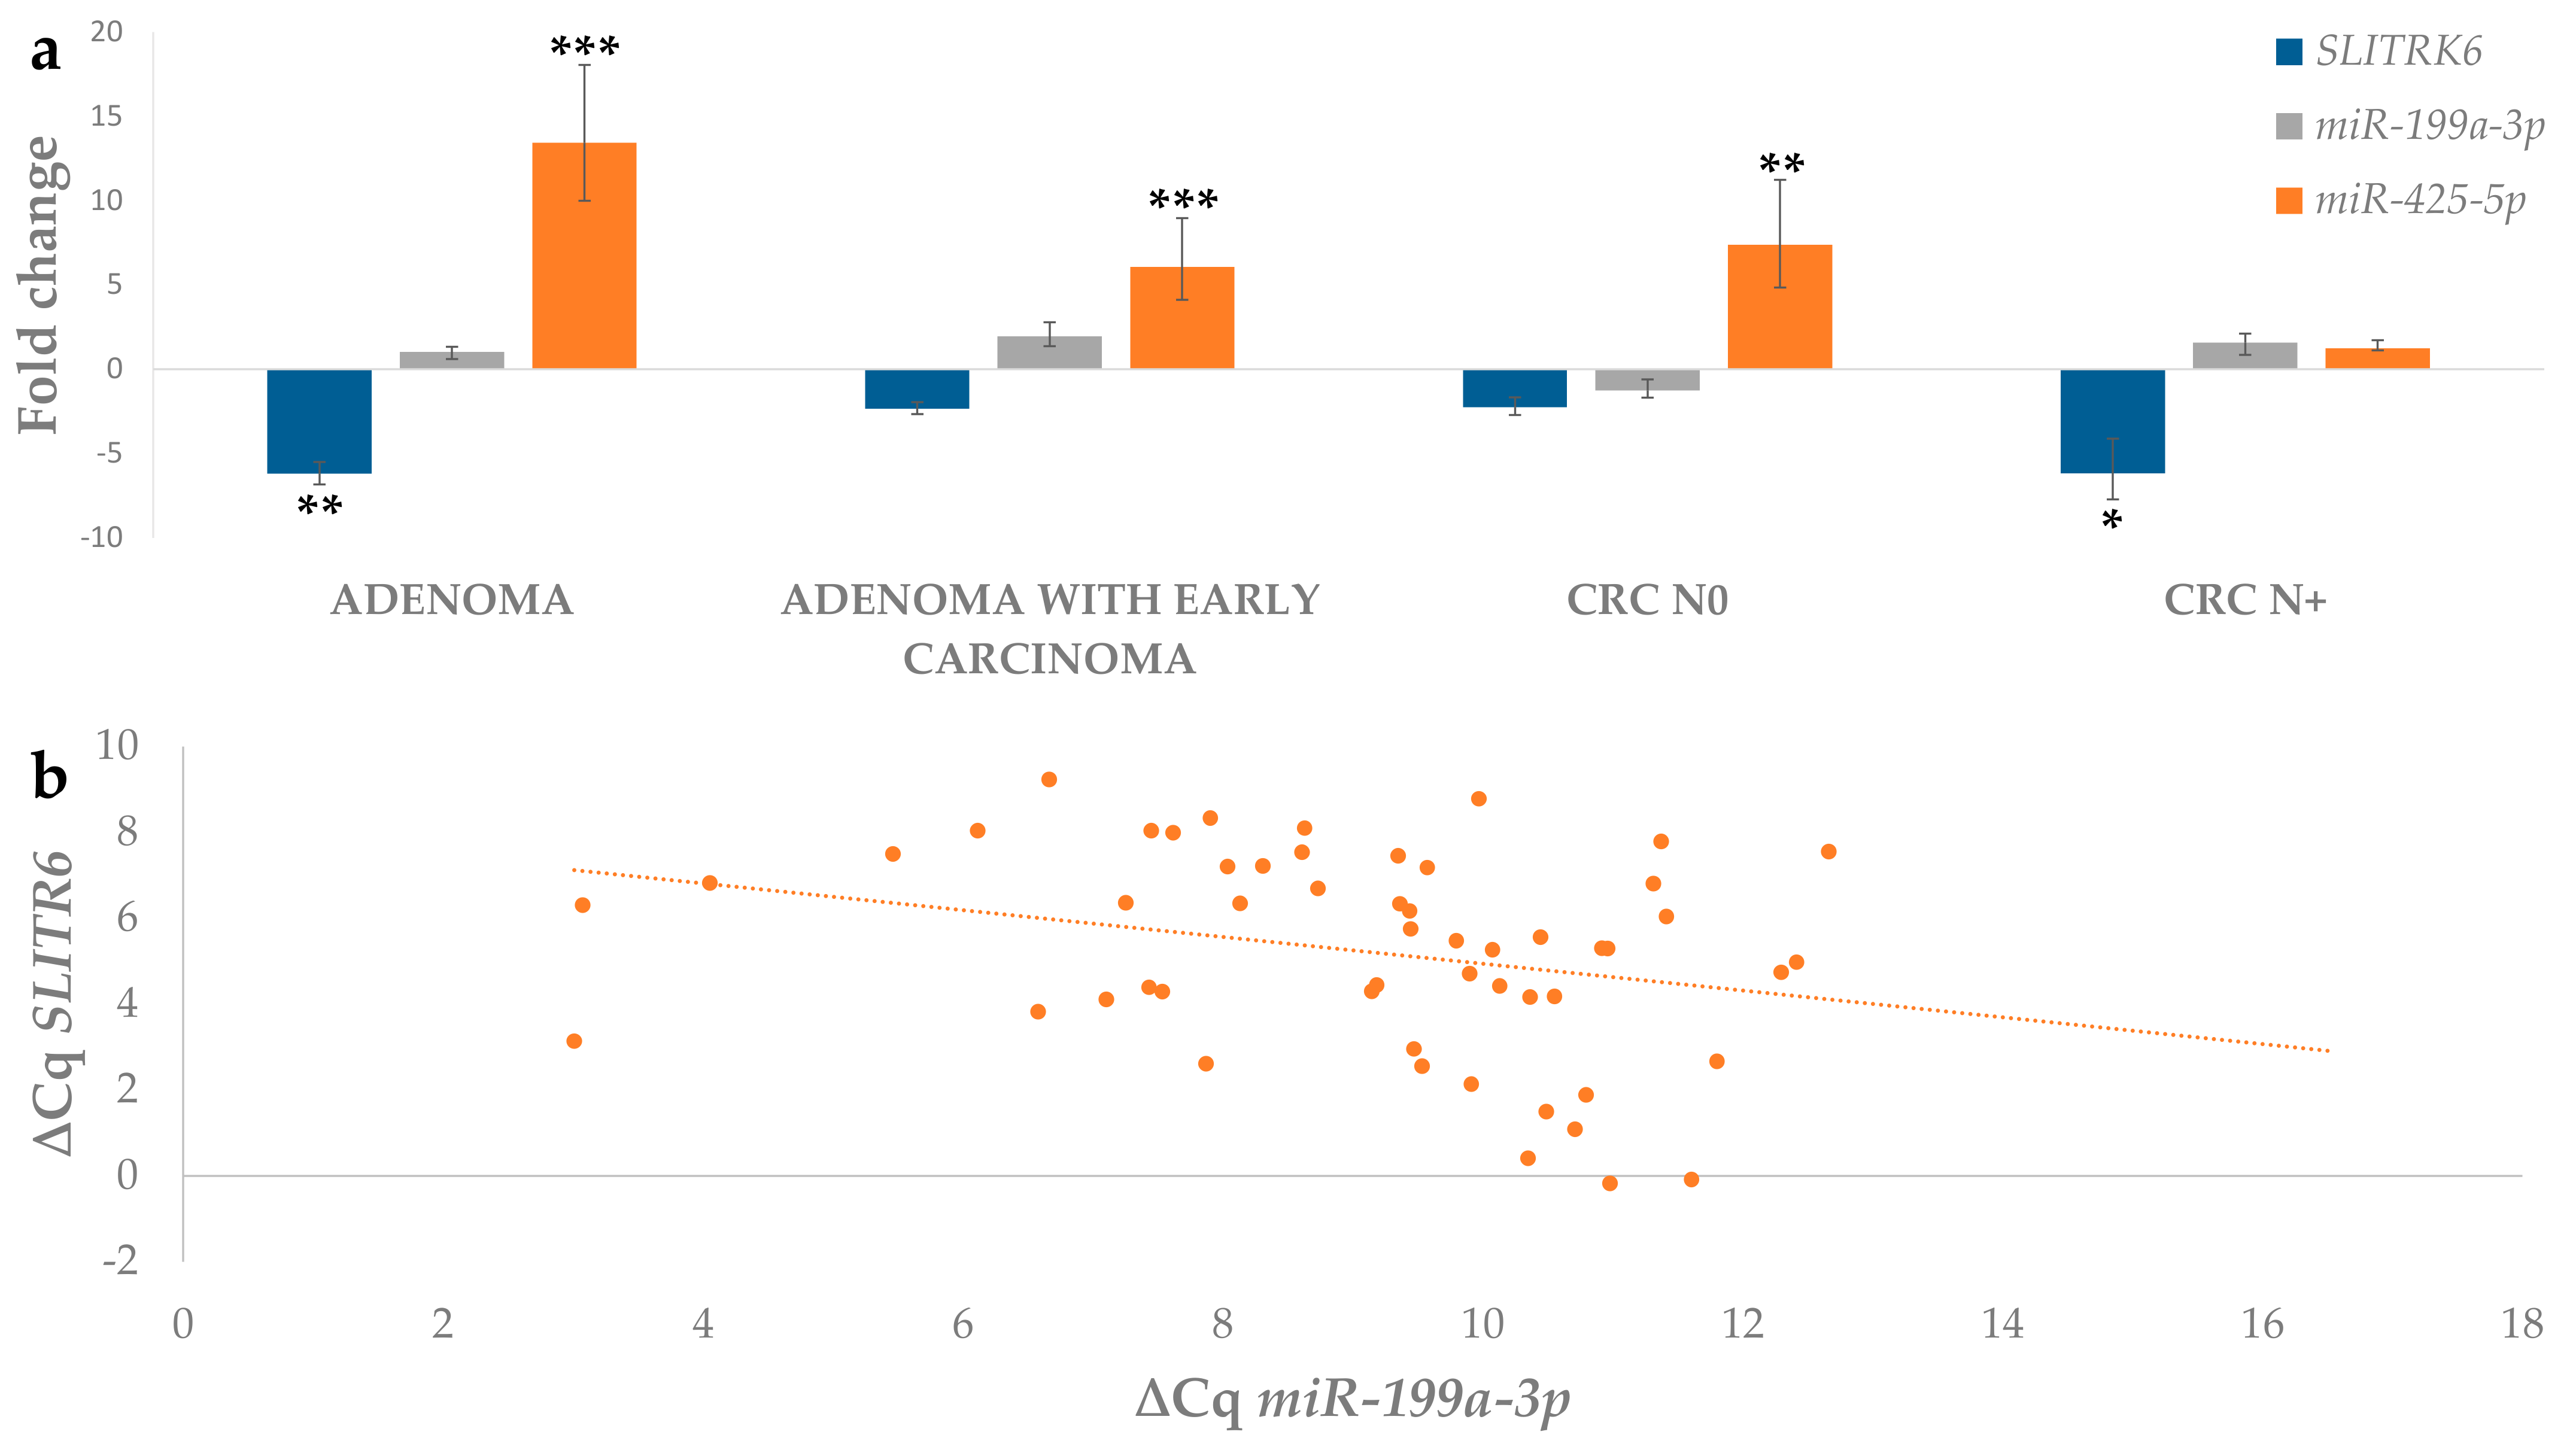
3.5. Correlation between Expression of Investigated Genes and Their Potentially Regulatory miRNAs

The expression of L1TD1 to miR-1303, as shown in Figure 8, showed an inverse trend in all analysed groups except the adenoma group. However, we were not able to confirm a negative correlation between L1TD1 and miR-1303 (Table 4).
Comparing the fold change expression data for SLITRK6 with the predicted miRNAs miR-425-5p and miR-199a-3p, we observed an inverse trend of expression between miR-425-5p and SLITRK6 in all tested groups. Expression of miR-199a-3p remained at similar levels throughout the adenoma-carcinoma progression. The results are shown in Figure 9a. However, we were able to confirm a negative correlation between SLITRK6 and miR-199a-3p, as shown in Figure 9b. The correlation testing results are given in Table 4.
Expression of the TCEA3 gene showed a similar trend in adenoma with early carcinoma and CRC N0 to both miRNAs, miR-1225-3p and miR-1233-3p. In adenoma and CRC N+, both miRNAs showed opposite trends in expression to its potential target gene TCEA3. The results are shown in Figure 10. We were not able to confirm any correlation between TCEA3 and miR-1225-3p or miR-1233-3p (Table 4).

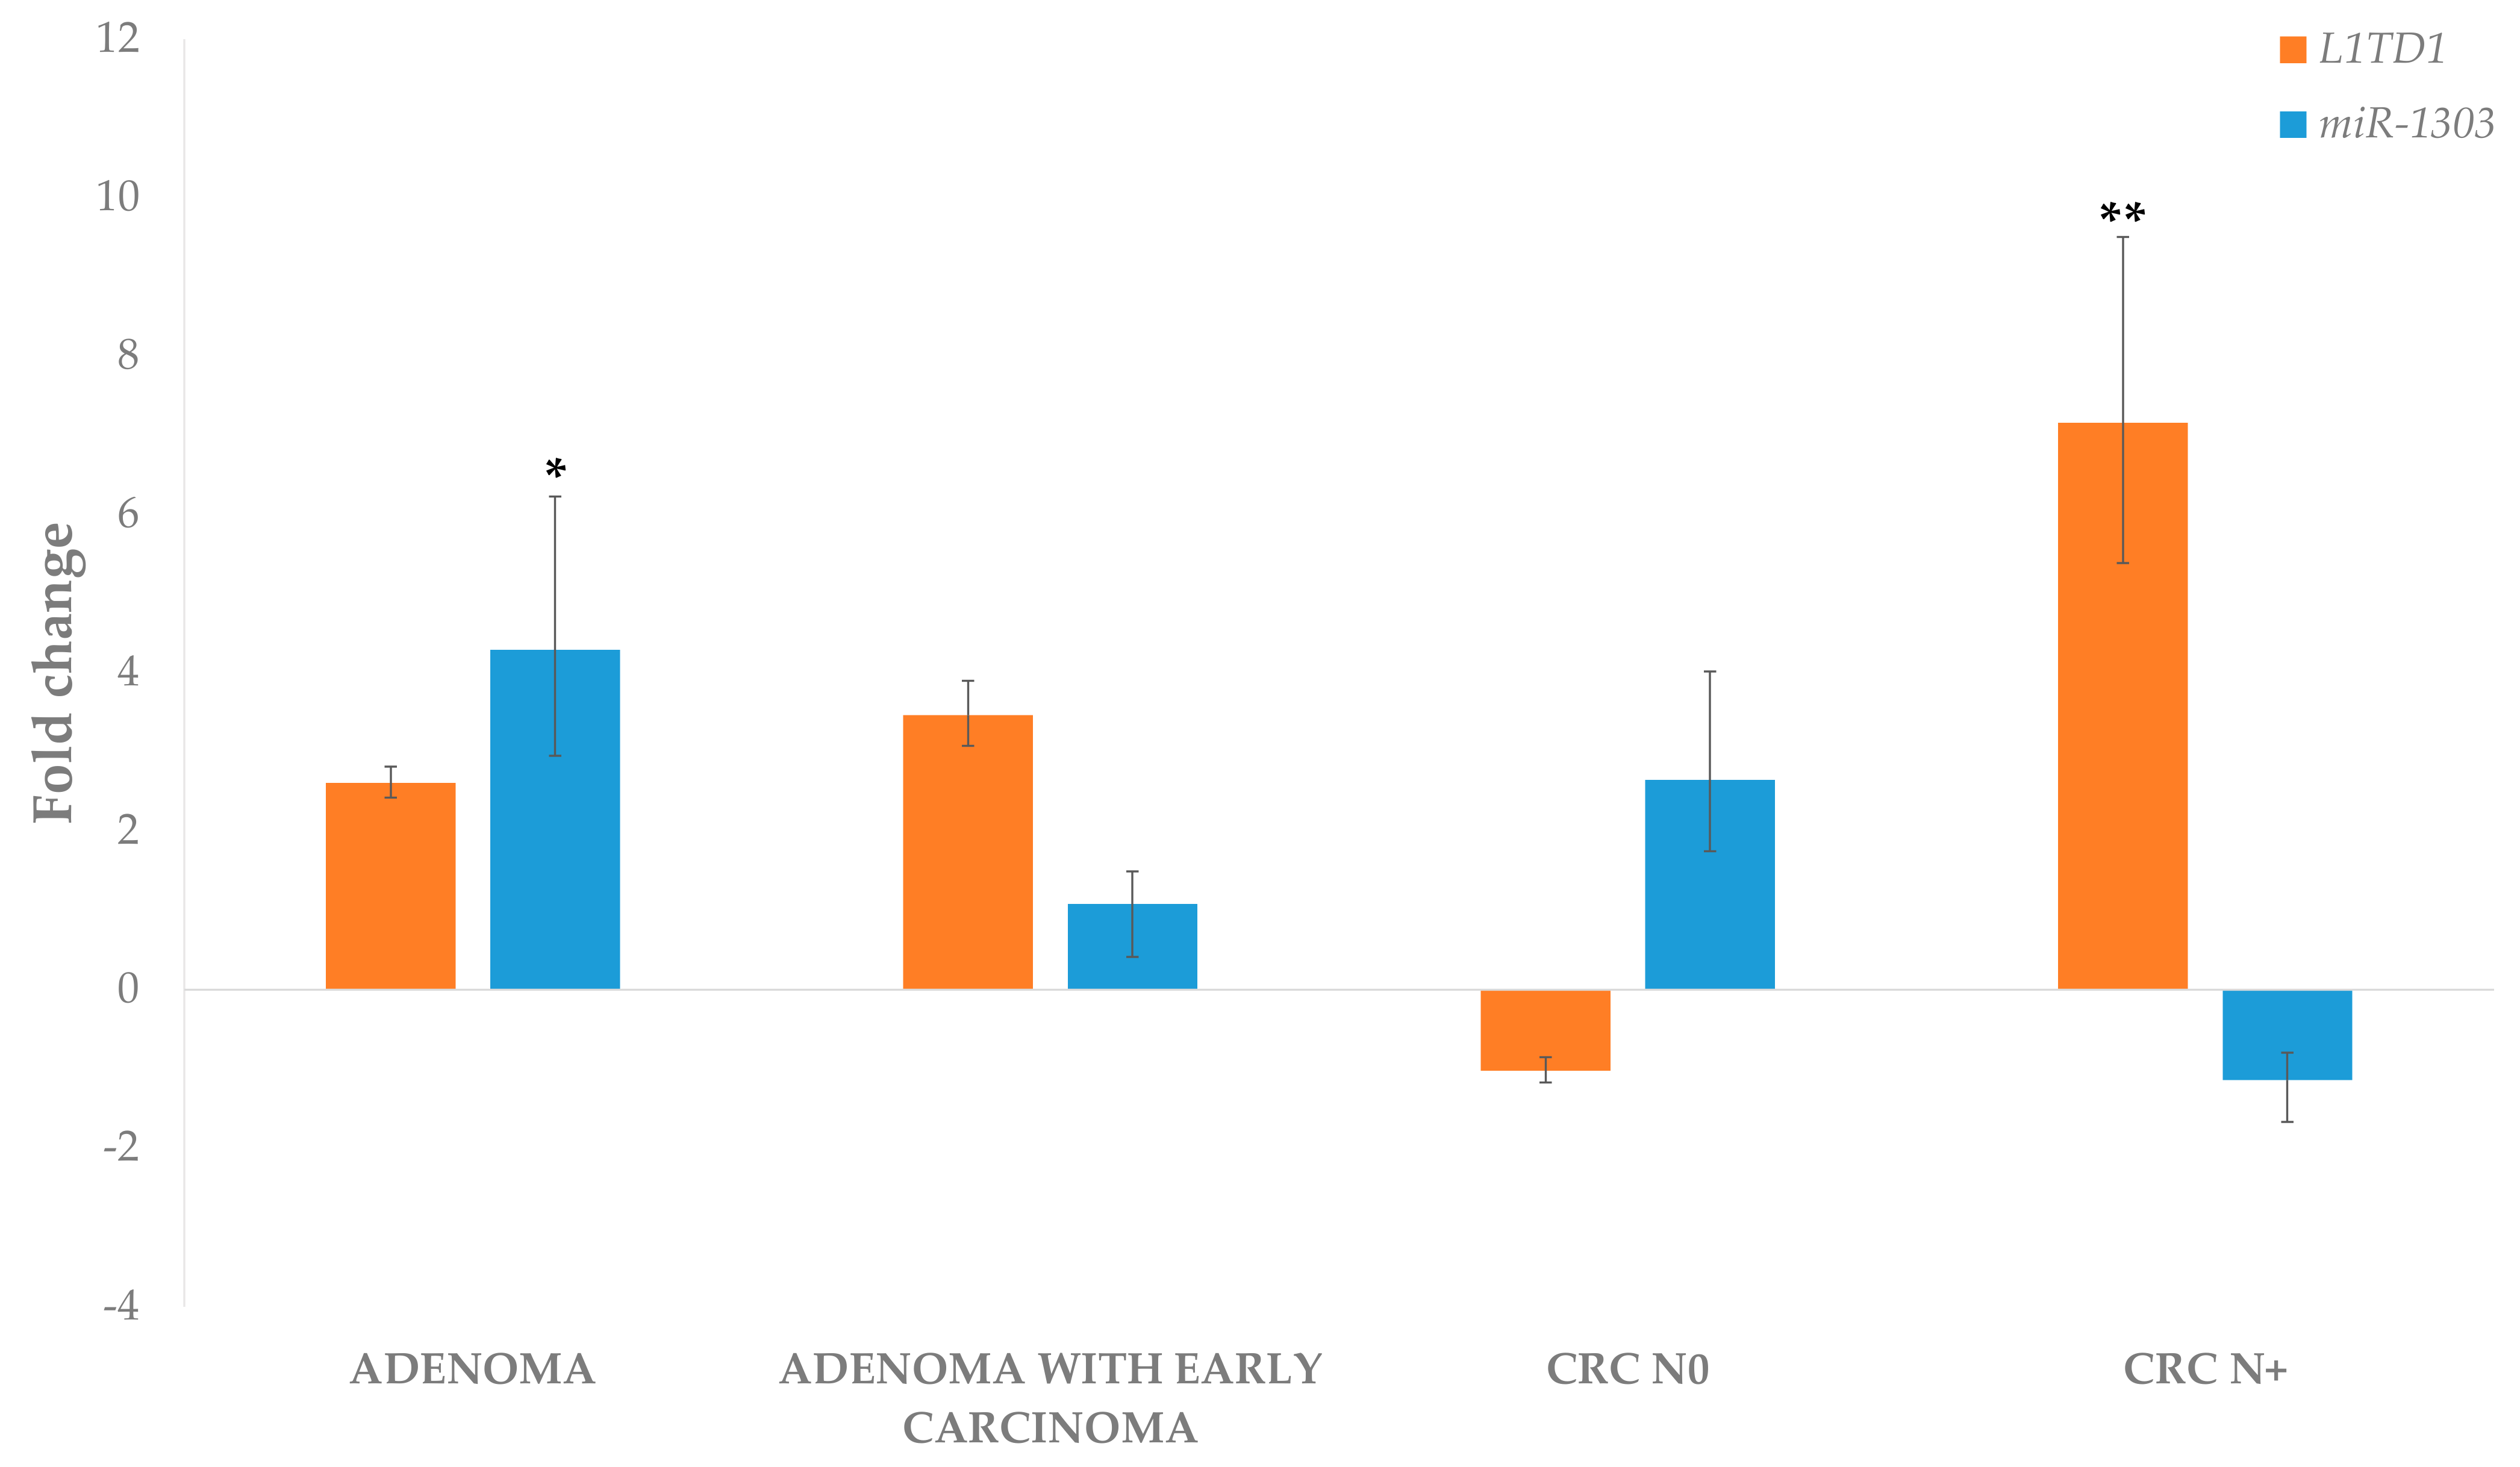
3.6. Gene and miRNA Correlation to the Level of Malignancy

The Spearman correlation coefficient showed that L1TD1 and SLITRK6 were significantly correlated to level of malignancy. L1TD1 was weakly positively correlated, SLITRK6 was moderately negatively correlated and miR-1225-3p and miR-1233-3p were significantly positively correlated to the level of malignancy (Table 5).

4. Discussion

We validated four genes related to CSC and CSC-like properties which were previously identified using bioinformatics analysis as differentially expressed between normal mucosa, adenoma and CRC [12]. We also validated miRNAs postulated by a bioinformatics approach as regulating these genes. We found that in CRC, expression of ST6GALNAC1 decreased and expression of L1TD1 increased with level of malignancy, whereas SLITRK6 and TCEA3 showed variable expression. TCEA3 was also related to the malignant transformation of adenoma to adenoma with early carcinoma and the development of lymph node metastases in CRC. Furthermore, we found differential expression of miRNAs that potentially regulate these genes (miR-199a-3p, miR-425-5p, miR-1225-3p, miR-1233-3p and miR-1303) and a negative correlation between miR-199a-3p and its potential target gene SLITRK6.
Expression of the L1TD1 gene in our study progressively increased from adenoma to CRC, with the highest expression in CRC with lymph node metastases. L1TD1 has been shown to be associated with RNA binding, renewal of undifferentiated embryonal stem cells [13] and embryonal carcinoma cell lines [14]. In human embryonal stem cells, L1TD1 has also been associated with canonical markers of pluripotency that are also involved in cancerogenesis, such as OCT4, NANOG, LIN28 and SOX2 [15]. With the use of bioinformatics analysis, a higher expression of L1TD1 in CRC was shown to be associated with longer disease-free survival [16]. Our results showed a positive trend of expression of L1TD1 to CRC cancerogenesis. However, its role remains speculative due to limited information on L1TD1 in cancerogenesis.
Our study showed variable expression of gene SLITRK6 during CRC cancerogenesis. It was downregulated in all stages of CRC development, except in adenoma with early carcinoma, in which it was upregulated. SLITRK6 has been shown to be highly expressed in neural stem and progenitor cells [17], and it has been associated with cytoskeletal dynamics, axon guidance and cell adhesion [18]. In other cancer types, it was expressed at high levels in bladder cancer and, to a lesser extent, in lung cancer, breast cancer and glioblastomas. Moreover, in bladder cancer, it was suggested as a promising target for conjugate therapy [19]. A bioinformatics study on CRC showed differentially expressed SLITRK6 together with L1TD1 and ST6GALNAC1 [16], and it was downregulated in CRC compared to adenomas using microarray expression analysis [41]. However, our results showed no significant differences in expression between adenomas and CRC. This difference may be explained by the use of different methodologies for expression analysis of SLITRK6 (microarrays versus qPCR).
Gene expression of ST6GALNAC1 in our study progressively decreased from adenoma to CRC, with the lowest expression in CRC with lymph node metastases. This gene, and its product STn antigen, has been demonstrated to be associated with cell contact, cell migration and prognosis of patients with carcinoma of the colon, stomach, pancreas, breast, prostate and ovaries [23]. STn antigen has been used as a target in immunotherapy trials for breast, colon and ovarian cancer [23]. Data regarding its expression and function in normal human tissues are limited [16,23]. It has also been associated with stem cell maintenance in ovarian cancer [42], as well as with the maintenance of isolated stem cells of CRC [23]. Its upregulation has been associated with good prognosis in breast cancer [43] and enhanced tumorigenicity in a breast cancer cell line [44]. siRNA silencing of ST6GALNAC1 led to reduced growth, migration and invasion of gastric cancer cells in vitro [45], whereas its overexpression enhanced their metastatic ability [46]. Due to limited data on its role in CRC and different patterns of expression in several cancers, further investigation is needed for better understanding the involvement of this gene in CRC cancerogenesis and metastatic spread.
Gene TCEA3 showed variable expression in our study, with significant upregulation in adenoma with early carcinoma and CRC without lymph node metastases. Interestingly, its expression was also significantly different between adenoma and CRC and between CRC without and with lymph node metastases, suggesting its role in metastases development. TCEA3 was shown to have a higher expression level in mouse embryonal cells and was involved in regulation of stem cell differentiation [24]. Expression of TCEA3 was lower in cell lines of ovarian carcinoma in which its interaction with receptor TGFβ I induced cell death [47]. TCEA3 has also been associated with stomach cancer, in which high expression has been associated with better prognosis, lower proliferation of carcinoma cells and induction of apoptosis [48]. In a bioinformatics study of microarray expression data of normal colon tissue and CRC, TCEA3 downregulation was identified among differentially expressed genes [49]. Our results are therefore consistent with previous findings on stomach cancer and CRC, thus contributing to understanding the involvement of TCEA3 in CRC cancerogenesis.
When investigating correlations of genes/miRNAs with the level of malignancy, it is important to note that SLITRK6 showed a moderate negative correlation and L1TD1 was positively correlated with the level of malignancy. Among miRNAs, the expression of miR-1225-3p and miR-1233-3p, targeting TCEA3, were in weak positive correlation with the level of malignancy.
Interestingly, when investigating the miRNA-predicted target gene correlations, only miR-199a-3p and its target SLITRK6 were in significant correlation. The pair was negatively correlated, which suggests inhibition of the target gene by the miRNA [50]. This correlation has not yet been previously observed in CRC.
miR-199a-3p was downregulated in our study in all investigated groups. However, no significant differences among the groups were found. In previous studies, miR-199a-3p was found to be highly expressed in the late stage of differentiation of human embryonal stem cells, as well as foetal pancreas and adult islet samples [51]. Additionally, miR-199a-3p was shown to target stemness and mitogenic-related pathways to suppress the expansion and tumorigenic capabilities of prostate cancer stem cells in vitro [52]. In CRC, miR-199a-3p was described as being significantly downregulated in the microarray expression data [53]. Upregulation of miR-199a/b contributed to cisplatin resistance in ALDHA1+ CRC stem cells [54]. Our data are consistent with previous microarray results on CRC. Further investigation of the exact involvement of miR-199a-3p in cancerogenesis of CRC is needed.
miR-425-5p was significantly upregulated in all investigated groups except CRC with lymph node metastases. Additionally, significant differences in expression were observed between adenoma and CRC and between CRC without and with lymph node metastases, suggesting its role in malignant transformation and the development of metastases. miR-425-5p has been previously associated with CRC, showing that miR-425-5p regulates chemoresistance in CRC cells [55] both in vitro and in vivo. A microarray analysis comparing isogenic chemo-sensitive and chemo-resistant HCT116 cell lines identified differentially expressed miR-425-5p. Xenograft mouse models showed that miR-425-5p inhibitor sensitized HCT116-R xenografts to chemotherapeutic drugs in vivo. miR-425-5p was also upregulated in a microarray expression experiment on CRC [56], and it was found that miR-425-5p downregulation impacted stemness and cisplatin resistance in laryngeal carcinoma cells [57]. Our results are consistent with previous microarray results on CRC.
miR-1225-3p is another miRNA in our study that was significantly upregulated in all investigated groups compared to normal mucosa. Additionally, it was also significantly differentially expressed between adenoma and CRC, suggesting a role in malignant transformation. Published data have shown that it was associated with the TCEA3 gene in project GSE42095 performed on differentiated embryonic stem cells [51] and with CRC in project GSE35602 on CRC stromal tissue, in which it was upregulated [56]. Using microarray analysis, it was identified as one of the 173 differentially expressed miRNAs between spheroid body-forming cells (which possess gastric cancer stem cell properties) and parental cells on MKN-45 gastric cancer cell line cells [58]. Our results are consistent with microarray results on CRC stromal tissue.
miR-1233-3p was significantly upregulated in all investigated groups when compared to normal mucosa except CRC with lymph node metastases. Additionally, it was also significantly differentially expressed between adenoma and CRC, suggesting a role in malignant transformation. miR-1233-3p was associated with the TCEA3 gene in project GSE28260, which was performed on renal cortex and medulla [59]. It was associated with CRC in a study performed on serum miRNA profiling in patients with colon adenomas or cancer, in which it was downregulated when comparing CRC to normal samples [60]. Before comparing our results to those performed on serum samples, it is important to note that, in addition to the fact that there are numerous differences in tissue types, there are also numerous differences in the methodologies used for profiling different tissue types.
miR-1303 showed variable expression with significant upregulation in adenoma in comparison to normal mucosa. Additionally, it was also significantly differentially expressed between adenoma and CRC, suggesting a role in malignant transformation. miR-1303 has been previously investigated in association with CRC, in which it was found to be part of a group with frequent and sometimes biallelic mutations in microsatellite instable (MSI) tumours. No direct link was found between the presence or absence of mono- or biallelic alterations and the levels of mature miR-1303 expression in MSI cell lines. A significant increase in miR-1303 was observed in microsatellite stable (MSS) CRC cell lines in comparison to normal colonic mucosa [61]. A correlation between miR-1303 and L1TD1 was also previously identified in the integrative knowledge base for miRNA-mRNA expression in colorectal cancer [28]. However, expression of this miRNA is variable, and there are limited data regarding its role in CRC cancerogenesis.
Genes associated with CSC features could be promising prognostic and therapeutic markers. It has been previously shown that CSC-associated molecular profiles can predict tumour regeneration and disease relapse after conventional therapy in CRC patients [9,62,63,64,65,66]. Direct targeting can be achieved by inhibiting self-renewal pathways, by interfering with antiapoptotic or metabolic pathways, by activating differentiation pathways or by acting on the protective microenvironment through the involved genes. Several potential anti-CSC targeted drugs have emerged in previous studies, with some of them making their way to the clinic [67]. As previously mentioned, SLITRK6 is a promising candidate for conjugate therapy in bladder cancer [19] and the product of ST6GALNAC1 has been a target in immunotherapy trials for several cancers [23]. Studying miRNAs regulating selected genes is also a promising therapeutic approach by silencing these genes using miRNAs mimic or by depleting miRNAs using antagomirs to re-express investigated genes [68].
One of the limitations of our study is related to normal samples, which were taken at least 20 cm away from the tumour and showed no microscopic abnormalities. However, genetic and protein aberrations may already be present in morphologically normal mucosa [69,70]. Despite certain limitations, these samples may be used as corresponding control samples to overcome differences in the genetic background. Additionally, the newly identified associations of these genes and miRNAs with CSCs, CRC development and progression in this study are of a preliminary nature. Further validation through a functional study may be needed for additional confirmation of the results. Another limitation is the relatively small sample size. The latter is due to the use of formalin-fixed paraffin-embedded (FFPE) tissue samples, in which nucleic acids are fragmented and therefore difficult to analyse. However, all FFPE cases were evaluated by pathologists, enabling appropriate diagnosis. Furthermore, only samples that successfully passed the initial quality control and samples with stable expression of the reference genes were selected for further analysis, thus limiting the number of included samples.

5. Conclusions

Using a bioinformatics approach, we identified and validated new CSC-related genes with a previously unknown or poorly defined role in CRC development and progression. Expression of three investigated genes progressively increased (L1TD1) or decreased (ST6GALNAC1, SLITRK6) with the level of malignancy. The TCEA3 gene was also related to the malignant transformation of adenoma to adenoma with early carcinoma and development of lymph node metastases in CRC.
The expression of some of the potential regulatory miRNAs confirmed the alterations in gene expression in CRC development. Our results provide further evidence that CSC-related genes and their regulatory miRNAs are involved in CRC cancerogenesis and progression, and suggest that some of them, particularly miR-199a-3p and its SLITRK6 target gene, are promising for further validation in CRC.

Supplementary Materials

The following are available online at https://www.mdpi.com/2227-9059/9/2/179/s1.

Author Contributions

Conceptualization, K.U., E.B., N.Z.; methodology, K.U., M.Ž., E.B., validation, K.U. and M.Ž.; formal analysis, K.U.; data curation, K.U.; writing—original draft preparation, K.U. and E.B., writing—review and editing, E.B., M.Ž., N.Z.; visualization, K.U.; supervision, E.B., N.Z. All authors have read and agreed to the published version of the manuscript.

Funding

This research was funded by the Slovenian Research Agency (research core funding no. P3-0054; project funding J3-1754; PhD research funding).

Institutional Review Board Statement

The study was conducted according to the guidelines of the Declaration of Helsinki, and approved by the National Medical Ethics Committee (Republic of Slovenia, Ministry of Health), approval number 0120-54/2020/4.

Informed Consent Statement

Patient consent was waived due to the following reason. As stated in the approval document, the study is retrospective, observational, performed on tissue samples that were obtained during routine diagnostic/therapeutic procedures, consisted of either excision or resection. Therefore, enough tissue was available for routine analysis and research. Moreover, tissue is still available for any additional analysis in the future. Our State Ethical Committee does not require informed consent from patients in such studies. However, the informed consent was obtained before the routine procedure.

Conflicts of Interest

The authors declare no conflict of interest.

References

  1. Kudryavtseva, A.V.; Lipatova, A.V.; Zaretsky, A.R.; Moskalev, A.A.; Fedorova, M.S.; Rasskazova, A.S.; Shibukhova, G.A.; Snezhkina, A.V.; Kaprin, A.D.; Alekseev, B.Y.; et al. Important molecular genetic markers of colorectal cancer. Oncotarget 2016, 7, 53959–53983. [Google Scholar] [CrossRef] [PubMed] [Green Version]
  2. Cao, H.; Xu, E.; Liu, H.; Wan, L.; Lai, M.-D. Epithelial–mesenchymal transition in colorectal cancer metastasis: A system review. Pathol. Res. Pr. 2015, 211, 557–569. [Google Scholar] [CrossRef]
  3. Balch, C.; Ramapuram, J.B.; Tiwari, A.K. The epigenomics of embryonic pathway signaling in colorectal cancer. Front. Pharmacol. 2017, 8, 267. [Google Scholar] [CrossRef] [Green Version]
  4. Sepulveda, A.R.; Portillo, A.J.D. Molecular basis of diseases of the gastrointestinal tract. In Molecular Pathology, 2nd ed.; Coleman, W.B., Tsongalis, G.J., Eds.; Elsevier BV: Amsterdam, The Netherlands, 2018; pp. 387–415. [Google Scholar] [CrossRef]
  5. Järvinen, H.J.; Mecklin, J.-P.; Sistonen, P. Screening reduces colorectal cancer rate in families with hereditary nonpolyposis colorectal cancer. Gastroenterology 1995, 108, 1405–1411. [Google Scholar] [CrossRef]
  6. Brenner, H.; Jansen, L.; Ulrich, A.; Chang-Claude, J.; Hoffmeister, M. Survival of patients with symptom- and screening-detected colorectal cancer. Oncotarget 2016, 7, 44695–44704. [Google Scholar] [CrossRef] [Green Version]
  7. Fischer, J.; Walker, L.C.; Robinson, B.A.; Frizelle, F.A.; Church, J.M.; Eglinton, T.W. Clinical implications of the genetics of sporadic colorectal cancer. ANZ J. Surg. 2019, 89, 1224–1229. [Google Scholar] [CrossRef] [PubMed]
  8. Blank, A.; Roberts, D.E.I.; Dawson, H.; Zlobec, I.; Lugli, A. Tumor heterogeneity in primary colorectal cancer and corresponding metastases. Does the apple fall far from the tree? Front. Med. 2018, 5, 234. [Google Scholar] [CrossRef] [Green Version]
  9. Dylla, S.J.; Beviglia, L.; Clarke, M.F.; Hoey, T.; Lewicki, J.; Gurney, A.L.; Park, I.-K.; Chartier, C.; Raval, J.; Ngan, L.; et al. Colorectal cancer stem cells are enriched in xenogeneic tumors following chemotherapy. PLoS ONE 2008, 3, e2428. [Google Scholar] [CrossRef]
  10. Saiki, Y.; Ishimaru, S.; Mimori, K.; Takatsuno, Y.; Nagahara, M.; Ishii, H.; Yamada, K.; Mori, M. Comprehensive analysis of the clinical significance of inducing pluripotent stemness-related gene expression in colorectal cancer cells. Ann. Surg. Oncol. 2009, 16, 2638–2644. [Google Scholar] [CrossRef]
  11. Munro, M.J.; Wickremesekera, S.K.; Peng, L.; Tan, S.T.; Itinteang, T. Cancer stem cells in colorectal cancer: A review. J. Clin. Pathol. 2018, 71, 110–116. [Google Scholar] [CrossRef]
  12. Hauptman, N.; Boštjančič, E.; Žlajpah, M.; Ranković, B.; Zidar, N. Bioinformatics analysis reveals most prominent gene candidates to distinguish colorectal adenoma from adenocarcinoma. BioMed Res. Int. 2018, 2018, 1–10. [Google Scholar] [CrossRef] [PubMed] [Green Version]
  13. Wong, R.C.-B.; Ibrahim, A.; Fong, H.; Thompson, N.; Lock, L.F.; Donovan, P.J. L1TD1 is a marker for undifferentiated human embryonic stem cells. PLoS ONE 2011, 6, e19355. [Google Scholar] [CrossRef] [PubMed] [Green Version]
  14. Närvä, E.; Rahkonen, N.; Rao, A.; Lahesmaa, R.; Emani, M.R.; Lund, R.; Pursiheimo, J.-P.; Nästi, J.; Autio, R.; Rasool, O.; et al. RNA-binding protein L1TD1 interacts with LIN28 via RNA and is required for human embryonic stem cell self-renewal and cancer cell proliferation. Stem Cells 2011, 30, 452–460. [Google Scholar] [CrossRef] [PubMed] [Green Version]
  15. Emani, M.R.; Närvä, E.; Stubb, A.; Chakroborty, D.; Viitala, M.; Rokka, A.; Rahkonen, N.; Moulder, R.; Denessiouk, K.; Trokovic, R.; et al. The L1TD1 protein interactome reveals the importance of post-transcriptional regulation in human pluripotency. Stem Cell Rep. 2015, 4, 519–528. [Google Scholar] [CrossRef] [PubMed] [Green Version]
  16. Chakroborty, D.; Emani, M.; Klén, R.; Böckelman, C.; Hagström, J.; Haglund, C.; Ristimäki, A.; Lahesmaa, R.; Elo, L.L. L1TD1-a prognostic marker for colon cancer. BMC Cancer 2019, 19, 727. [Google Scholar] [CrossRef] [PubMed] [Green Version]
  17. Sandberg, C.J.; Vik-Mo, E.O.; Behnan, J.; Helseth, E.; Langmoen, I.A. Transcriptional profiling of adult neural stem-like cells from the human brain. PLoS ONE 2014, 9, e114739. [Google Scholar] [CrossRef] [PubMed]
  18. Proenca, C.C.; Gao, P.; Shmelkov, S.V.; Rafii, S.; Lee, F.S. Slitrks as emerging candidate genes involved in neuropsychiatric disorders. Trends Neurosci. 2011, 34, 143–153. [Google Scholar] [CrossRef] [Green Version]
  19. Morrison, K.; Challita-Eid, P.M.; Verlinsky, A.; Aviña, H.; Doñate, F.; Joseph, I.B.; Pereira, D.S.; Morrison, K.; Stover, D.R.; Raitano, A.; et al. Development of ASG-15ME, a novel antibody-drug conjugate targeting SLITRK6, a new urothelial cancer biomarker. Mol. Cancer Ther. 2016, 15, 1301–1310. [Google Scholar] [CrossRef] [PubMed] [Green Version]
  20. Farahani, E.; Patra, H.K.; Jangamreddy, J.R.; Rashedi, I.; Kawalec, M.; Pariti, R.K.R.; Batakis, P.; Wiechec, E. Cell adhesion molecules and their relation to (cancer) cell stemness. Carcinogenesis 2014, 35, 747–759. [Google Scholar] [CrossRef] [Green Version]
  21. Ambriz, X.; De Lanerolle, P.; Ambrosio, J.R. The mechanobiology of the actin cytoskeleton in stem cells during differentiation and interaction with biomaterials. Stem Cells Int. 2018, 2018, 1–11. [Google Scholar] [CrossRef] [Green Version]
  22. Yamaguchi, H.; Condeelis, J. Regulation of the actin cytoskeleton in cancer cell migration and invasion. Biochim. Biophys. Acta (BBA) Mol. Cell Res. 2007, 1773, 642–652. [Google Scholar] [CrossRef] [Green Version]
  23. Ogawa, T.; Hirohashi, Y.; Murai, A.; Nishidate, T.; Okita, K.; Wang, L.; Ikehara, Y.; Satoyoshi, T.; Usui, A.; Kubo, T.; et al. ST6GALNAC1 plays important roles in enhancing cancer stem phenotypes of colorectal cancer via the Akt pathway. Oncotarget 2017, 8, 112550–112564. [Google Scholar] [CrossRef] [Green Version]
  24. Park, K.-S.; Cha, Y.; Han, Y.-M.; Kim, J.; Song, J.; Kim, J.Y.; Tesar, P.J.; Lanza, R.; Lee, K.-A.; Kim, K.-S.; et al. Transcription elongation factor Tcea3 regulates the pluripotent differentiation potential of mouse embryonic stem cells, via the Lefty1-Nodal-Smad2 pathway. Stem Cells 2012, 31, 282–292. [Google Scholar] [CrossRef] [PubMed] [Green Version]
  25. Brierley, J.D.; Gospodarowicz, M.K.; Wittekind, C. (Eds.) TNM Classification of Malignant Tumours, 8th ed.; Wiley Blackwell: Oxford, UK, 2017. [Google Scholar]
  26. Chou, C.H.; Shrestha, S.; Yang, C.D.; Chang, N.W.; Lin, Y.L.; Liao, K.W.; Huang, W.C.; Sun, T.H.; Tu, S.J.; Lee, W.H.; et al. miRTarBase update 2018: A resource for experimentally validated microRNA-target interactions. Nucleic Acids Res. 2018, 46, D296–D302. [Google Scholar] [CrossRef] [PubMed]
  27. Liu, W.; Wang, X. Prediction of functional microRNA targets by integrative modeling of microRNA binding and target expression data. Genome Biol. 2019, 20, 1–10. [Google Scholar] [CrossRef] [PubMed]
  28. Skok, D.J.; Hauptman, N.; Boštjančič, E.; Zidar, N. The integrative knowledge base for miRNA-mRNA expression in colorectal cancer. Sci. Rep. 2019, 9, 1–9. [Google Scholar] [CrossRef] [Green Version]
  29. Karagkouni, D.; Paraskevopoulou, M.D.; Chatzopoulos, S.; Vlachos, I.S.; Tastsoglou, S.; Kanellos, I.; Papadimitriou, D.; Kavakiotis, I.; Maniou, S.; Skoufos, G.; et al. DIANA-TarBase v8: A decade-long collection of experimentally supported miRNA–gene interactions. Nucleic Acids Res. 2018, 46, D239–D245. [Google Scholar] [CrossRef] [PubMed] [Green Version]
  30. Agarwal, V.; Bell, G.W.; Nam, J.-W.; Bartel, D.P. Predicting effective microRNA target sites in mammalian mRNAs. eLife 2015, 4, e05005. [Google Scholar] [CrossRef]
  31. Kozomara, A.; Birgaoanu, M.; Griffiths-Jones, S. miRBase: From microRNA sequences to function. Nucleic Acids Res. 2019, 47, D155–D162. [Google Scholar] [CrossRef]
  32. Brennecke, J.; Stark, A.; Russell, R.B.; Cohen, S.M. Principles of microRNA–target recognition. PLoS Biol. 2005, 3, e85. [Google Scholar] [CrossRef]
  33. Kertesz, M.; Iovino, N.; Unnerstall, U.; Gaul, U.; Segal, E. The role of site accessibility in microRNA target recognition. Nat. Genet. 2007, 39, 1278–1284. [Google Scholar] [CrossRef]
  34. Zhao, Y.; Samal, E.; Srivastava, D. Serum response factor regulates a muscle-specific microRNA that targets Hand2 during cardiogenesis. Nat. Cell Biol. 2005, 436, 214–220. [Google Scholar] [CrossRef]
  35. Boštjančič, E.; Zidar, N.; Glavač, D. MicroRNAs and cardiac sarcoplasmic reticulum calcium ATPase-2 in human myocardial infarction: Expression and bioinformatic analysis. BMC Genom. 2012, 13, 552. [Google Scholar] [CrossRef] [Green Version]
  36. Benias, P.C.; Wells, R.G.; Theise, N.D.; Sackey-Aboagye, B.; Klavan, H.; Reidy, J.; Buonocore, D.; Miranda, M.; Kornacki, S.; Wayne, M.; et al. Structure and distribution of an unrecognized interstitium in human tissues. Sci. Rep. 2018, 8, 1–8. [Google Scholar] [CrossRef]
  37. Lorenz, R.; Bernhart, S.H.F.; Zu Siederdissen, C.H.; Tafer, H.; Flamm, C.; Stadler, P.F.; Hofacker, I.L. ViennaRNA package 2.0. Algorithms Mol. Biol. 2011, 6, 26. [Google Scholar] [CrossRef] [PubMed]
  38. Doench, J.G. Specificity of microRNA target selection in translational repression. Genes Dev. 2004, 18, 504–511. [Google Scholar] [CrossRef] [PubMed] [Green Version]
  39. Miranda, K.C.; Huynh, T.; Tay, Y.; Ang, Y.-S.; Tam, W.-L.; Thomson, A.M.; Lim, B.; Rigoutsos, I. A pattern-based method for the identification of microrna binding sites and their corresponding heteroduplexes. Cell 2006, 126, 1203–1217. [Google Scholar] [CrossRef] [Green Version]
  40. Latham, G.J. Normalization of microRNA quantitative RT-PCR data in reduced scale experimental designs. Methods Mol. Biol. 2010, 667, 19–31. [Google Scholar] [CrossRef] [PubMed]
  41. Carvalho, B.; Sillars-Hardebol, A.H.; Postma, C.; Mongera, S.; Droste, J.T.S.; Obulkasim, A.; Van De Wiel, M.; Van Criekinge, W.; Ylstra, B.; Fijneman, R.J.A.; et al. Colorectal adenoma to carcinoma progression is accompanied by changes in gene expression associated with ageing, chromosomal instability, and fatty acid metabolism. Cell. Oncol. 2012, 35, 53–63. [Google Scholar] [CrossRef] [PubMed] [Green Version]
  42. Wang, W.-Y.; Cao, Y.-X.; Zhou, X.; Wei, B.; Zhan, L.; Sun, S.-Y. Stimulative role of ST6GALNAC1 in proliferation, migration and invasion of ovarian cancer stem cells via the Akt signaling pathway. Cancer Cell Int. 2019, 19, 86. [Google Scholar] [CrossRef] [Green Version]
  43. Patani, N.; Jiang, W.; Mokbel, K. Prognostic utility of glycosyltransferase expression in breast cancer. Cancer Genom. Proteom. 2009, 5, 333–340. [Google Scholar]
  44. Julien, S.; Adriaenssens, E.; Ottenberg, K.; Furlan, A.J.; Courtand, G.; Vercoutter-Edouart, A.-S.; Hanisch, F.-G.; Delannoy, P.; Le Bourhis, X. ST6GalNAc I expression in MDA-MB-231 breast cancer cells greatly modifies their O-glycosylation pattern and enhances their tumourigenicity. Glycobiology 2005, 16, 54–64. [Google Scholar] [CrossRef] [Green Version]
  45. Tamura, F.; Sato, Y.; Hirakawa, M.; Yoshida, M.; Ono, M.; Osuga, T.; Okagawa, Y.; Uemura, N.; Arihara, Y.; Murase, K.; et al. RNAi-mediated gene silencing of ST6GalNAc I suppresses the metastatic potential in gastric cancer cells. Gastric Cancer 2016, 19, 85–97. [Google Scholar] [CrossRef] [Green Version]
  46. Ozaki, H.; Matsuzaki, H.; Ando, H.; Kaji, H.; Nakanishi, H.; Ikehara, Y.; Narimatsu, H. Enhancement of metastatic ability by ectopic expression of ST6GalNAcI on a gastric cancer cell line in a mouse model. Clin. Exp. Metastasis 2012, 29, 229–238. [Google Scholar] [CrossRef] [Green Version]
  47. Cha, Y.; Kim, D.-K.; Hyun, J.; Kim, S.-J.; Park, K.-S. TCEA3 binds to TGF-beta receptor I and induces Smad-independent, JNK-dependent apoptosis in ovarian cancer cells. Cell. Signal. 2013, 25, 1245–1251. [Google Scholar] [CrossRef]
  48. Li, J.; Jin, Y.; Pan, S.; Chen, Y.; Wang, K.; Lin, C.; Jin, S.; Wu, J. TCEA3 attenuates gastric cancer growth by apoptosis induction. Med. Sci. Monit. 2015, 21, 3241–3246. [Google Scholar] [CrossRef] [Green Version]
  49. Guo, Y.; Bao, Y.; Ma, M.; Yang, W. Identification of key candidate genes and pathways in colorectal cancer by integrated bioinformatical analysis. Int. J. Mol. Sci. 2017, 18, 722. [Google Scholar] [CrossRef] [Green Version]
  50. Diaz, G.; Zamboni, F.; Tice, A.; Farci, P. Integrated ordination of miRNA and mRNA expression profiles. BMC Genom. 2015, 16, 1–13. [Google Scholar] [CrossRef] [Green Version]
  51. Liao, X.; Xue, H.; Wang, Y.-C.; Nazor, K.L.; Guo, S.; Trivedi, N.N.; Peterson, S.E.; Liu, Y.; Loring, J.F.; Laurent, L. Matched miRNA and mRNA signatures from an hESC-based in vitro model of pancreatic differentiation reveal novel regulatory interactions. J. Cell Sci. 2013, 126, 3848–3861. [Google Scholar] [CrossRef] [Green Version]
  52. Liu, R.; Liu, C.; Zhang, D.; Liu, B.; Chen, X.; Rycaj, K.; Jeter, C.; Calhoun-Davis, T.; Li, Y.; Yang, T.; et al. miR-199a-3p targets stemness-related and mitogenic signaling pathways to suppress the expansion and tumorigenic capabilities of prostate cancer stem cells. Oncotarget 2016, 7, 56628–56642. [Google Scholar] [CrossRef] [Green Version]
  53. Shen, Z.-L.; Wang, B.; Jiang, K.-W.; Ye, C.-X.; Cheng, C.; Yan, Y.-C.; Zhang, J.-Z.; Yang, Y.; Gao, Z.-D.; Ye, Y.-J.; et al. Downregulation of miR-199b is associated with distant metastasis in colorectal cancer via activation of SIRT1 and inhibition of CREB/KISS1 signaling. Oncotarget 2016, 7, 35092–35105. [Google Scholar] [CrossRef] [Green Version]
  54. Chen, B.; Zhang, D.; Kuai, J.; Cheng, M.; Fang, X.; Li, G. Upregulation of miR-199a/b contributes to cisplatin resistance via Wnt/β-catenin-ABCG2 signaling pathway in ALDHA1+ colorectal cancer stem cells. Tumor Biol. 2017, 39. [Google Scholar] [CrossRef] [Green Version]
  55. Zhang, Y.; Hu, X.; Miao, X.; Zhu, K.; Cui, S.; Meng, Q.; Sun, J.; Wang, T. Micro RNA-425-5p regulates chemoresistance in colorectal cancer cells via regulation of Programmed Cell Death 10. J. Cell. Mol. Med. 2016, 20, 360–369. [Google Scholar] [CrossRef] [Green Version]
  56. Nishida, N.; Nagahara, M.; Mori, M.; Sato, T.; Mimori, K.; Sudo, T.; Tanaka, F.; Shibata, K.; Ishii, H.; Sugihara, K.; et al. Microarray analysis of colorectal cancer stromal tissue reveals upregulation of two oncogenic mirna clusters. Clin. Cancer Res. 2012, 18, 3054–3070. [Google Scholar] [CrossRef] [Green Version]
  57. Yuan, Z.; Xiu, C.; Liu, D.; Zhou, G.; Yang, H.; Pei, R.; Ding, C.; Cui, X.; Sun, J.; Song, K. Long noncoding RNA LINC-PINT regulates laryngeal carcinoma cell stemness and chemoresistance through miR-425-5p/PTCH1/SHH axis. J. Cell. Physiol. 2019, 234, 23111–23122. [Google Scholar] [CrossRef]
  58. Liu, J.; Ma, L.; Wang, Z.; Wang, L.; Liu, C.; Chen, R.; Zhang, J. MicroRNA expression profile of gastric cancer stem cells in the MKN-45 cancer cell line. Acta Biochim. Biophys. Sin. 2014, 46, 92–99. [Google Scholar] [CrossRef] [Green Version]
  59. Marques, F.Z.; Campain, A.E.; Tomaszewski, M.; Zukowska-Szczechowska, E.; Yang, Y.H.J.; Charchar, F.J.; Morris, B.J. Gene expression profiling reveals renin mRNA overexpression in human hypertensive kidneys and a role for microRNAs. Hypertension 2011, 58, 1093–1098. [Google Scholar] [CrossRef] [Green Version]
  60. Zhang, Y.; Li, M.; Ding, Y.; Fan, Z.; Zhang, J.; Zhang, H.; Jiang, B.; Zhu, Y. Serum MicroRNA profile in patients with colon adenomas or cancer. BMC Med. Genom. 2017, 10, 23. [Google Scholar] [CrossRef] [Green Version]
  61. El-Murr, N.; Abidi, Z.; Wanherdrick, K.; Svrcek, M.; Gaub, M.-P.; Flejou, J.-F.; Hamelin, R.; Duval, A.; Lesuffleur, T. MiRNA genes constitute new targets for microsatellite instability in colorectal cancer. PLoS ONE 2012, 7, e31862. [Google Scholar] [CrossRef] [Green Version]
  62. Giampieri, R.; Scartozzi, M.; Cecchini, L.; Guerrieri, M.; Bearzi, I.; Cascinu, S.; Loretelli, C.; Piva, F.; Mandolesi, A.; Lezoche, G.; et al. Cancer stem cell gene profile as predictor of relapse in high risk stage II and stage III, radically resected colon cancer patients. PLoS ONE 2013, 8, e72843. [Google Scholar] [CrossRef] [Green Version]
  63. Merlos-Suárez, A.; Barriga, F.M.; Clevers, H.; Sancho, E.; Mangues, R.; Batlle, E.; Jung, P.; Iglesias, M.; Céspedes, M.V.; Rossell, D.; et al. The intestinal stem cell signature identifies colorectal cancer stem cells and predicts disease relapse. Cell Stem Cell 2011, 8, 511–524. [Google Scholar] [CrossRef] [Green Version]
  64. Colak, S.; Zimberlin, C.D.; Fessler, E.; Hogdal, L.J.; Prasetyanti, P.R.; Grandela, C.; Letai, A.; Medema, J.P. Decreased mitochondrial priming determines chemoresistance of colon cancer stem cells. Cell Death Differ. 2014, 21, 1170–1177. [Google Scholar] [CrossRef] [Green Version]
  65. Lombardo, Y.; Scopelliti, A.; Cammareri, P.; Todaro, M.; Iovino, F.; Ricci–Vitiani, L.; Gulotta, G.; Dieli, F.; De Maria, R.; Stassi, G. Bone morphogenetic protein 4 induces differentiation of colorectal cancer stem cells and increases their response to chemotherapy in mice. Gastroenterology 2011, 140, 297–309.e6. [Google Scholar] [CrossRef]
  66. Lotti, F.; Jarrar, A.M.; Pai, R.K.; Hitomi, M.; Lathia, J.; Mace, A.; Gantt, G.A.; Sukhdeo, K.; DeVecchio, J.; Vasanji, A.; et al. Chemotherapy activates cancer-associated fibroblasts to maintain colorectal cancer-initiating cells by IL-17A. J. Exp. Med. 2013, 210, 2851–2872. [Google Scholar] [CrossRef] [Green Version]
  67. Zeuner, A.; Todaro, M.; Stassi, G.; De Maria, R. Colorectal cancer stem cells: From the crypt to the clinic. Cell Stem Cell 2014, 15, 692–705. [Google Scholar] [CrossRef] [Green Version]
  68. Wang, V.; Wu, W. MicroRNA-based therapeutics for cancer. BioDrugs 2009, 23, 15–23. [Google Scholar] [CrossRef]
  69. Sanz-Pamplona, R.; Berenguer, A.; Cordero, D.; Molleví, D.G.; Crous-Bou, M.; Sole, X.; Paré-Brunet, L.; Guino, E.; Salazar, R.; Santos, C.; et al. Aberrant gene expression in mucosa adjacent to tumor reveals a molecular crosstalk in colon cancer. Mol. Cancer 2014, 13, 46. [Google Scholar] [CrossRef] [Green Version]
  70. Polley, A.C.; Mulholland, F.; Pin, C.; Williams, E.A.; Bradburn, D.M.; Mills, S.J.; Mathers, J.C.; Johnson, I.T. Proteomic analysis reveals field-wide changes in protein expression in the morphologically normal mucosa of patients with colorectal neoplasia. Cancer Res. 2006, 66, 6553–6562. [Google Scholar] [CrossRef] [Green Version]
Figure 1. Identification and prioritization of miRNAs. Legend: DEG, differentially expressed genes; DSE, destabilising elements; ΔG, minimum free energy; ID, identification.
Biomedicines 09 00179 g001
Figure 2. Expression (∆Cq) of four genes (L1TD1, SLITRK6, ST6GALNAC1, TCEA3) in normal mucosa, adenoma and adenoma with early carcinoma. Legend: x, mean; ◦, outlier; ** p ≤ 0.01.
Biomedicines 09 00179 g002
Figure 3. Expression (∆Cq) of the investigated genes in carcinoma without (a) and with lymph node metastases (b) and corresponding normal mucosa. Legend: CRC N0, colorectal carcinoma without lymph node metastases; CRC N+, colorectal carcinoma with lymph node metastases; x, mean; ◦, outlier; * p ≤ 0.05; ** p ≤ 0.01.
Biomedicines 09 00179 g003
Figure 4. Expression (∆∆Cq) of the investigated genes (L1TD1, SLITRK6, ST6GALNAC1, TCEA3) in carcinoma without and carcinoma with lymph node metastases. Legend: CRC N0, colorectal carcinoma without lymph node metastases; CRC N+, colorectal carcinoma with lymph node metastases; x, mean; ◦, outlier; *** p ≤ 0.001.
Biomedicines 09 00179 g004
Figure 5. Expression (∆Cq) of the investigated miRNAs in normal mucosa, adenoma and adenoma with early carcinoma. Legend: x, mean; ◦, outlier; * p ≤ 0.05; ** p ≤ 0.01; *** p ≤ 0.001.
Biomedicines 09 00179 g005
Figure 6. Expression (∆Cq) of the investigated miRNAs in carcinoma without (a) and with lymph node metastases (b) in comparison to corresponding normal mucosa. Legend: CRC N0, colorectal carcinoma without lymph node metastases; CRC N+, colorectal carcinoma with lymph node metastases; x, mean; ◦, outlier; * p ≤ 0.05, ** p ≤ 0.01; *** p ≤ 0.001.
Biomedicines 09 00179 g006
Figure 7. Expression (∆∆Cq) of the investigated miRNAs in carcinoma without and with lymph node metastases. Legend: CRC N0, colorectal carcinoma without lymph node metastases; CRC N+, colorectal carcinoma with lymph node metastases; x, mean; ◦, outlier; ** p ≤ 0.01.
Biomedicines 09 00179 g007
Figure 8. Expression of L1TD1 and miR-1303 in adenoma, adenoma with early carcinoma and carcinoma without and with lymph node metastases. Legend: CRC N0, colorectal carcinoma without lymph node metastases; CRC N+, colorectal carcinoma with lymph node metastases; * p ≤ 0.05; ** p ≤ 0.01.
Biomedicines 09 00179 g008
Figure 9. (a) Expression of SLITRK6, miR-199a-3p and miR-425-5p in adenoma, adenoma with early carcinoma and carcinoma without and with lymph node metastases; (b) Correlation between expression (∆Cq) of miR-199a-3p and target gene SLITRK6. Legend: CRC N0, colorectal carcinoma without lymph node metastases; CRC N+, colorectal carcinoma with lymph node metastases; * p ≤ 0.05; ** p ≤ 0.01; *** p ≤ 0.001.
Biomedicines 09 00179 g009
Figure 10. Expression of TCEA3, miR-1225-3p and miR-1233-3p in adenoma, adenoma with early carcinoma and carcinoma without and with lymph node metastases. Legend: CRC, colorectal carcinoma; N0, without lymph node metastases; N+, with lymph node metastases; * p ≤ 0.05; ** p ≤ 0.01; *** p ≤ 0.001.
Biomedicines 09 00179 g010
Table 1. Selected probes.
Gene/miRNAAssay IDSequence (Probe Sequence or Mature miRNA Sequence)
B2MHs99999907_m1GTTAAGTGGGATCGAGACATGTAAG
IPO8Hs00183533_m1GGGGAATTGATCAGTGCATTCCACT
L1TD1Hs00219458_m1TTTTTCGCCAGGCACCAAGGCACAG
SLITRK6Hs00536106_s1TTTCCATGGACTGGAAAACCTGGAA
ST6GALNAC1Hs01027885_m1AGGAGGCCTTCAGACGACTTGCCCT
TCEA3Hs00957468_m1GAAATCGAAGATCATATCTACCAAG
hsa-miR-199a-3p002304ACAGUAGUCUGCACAUUGGUUA
hsa-miR-335-5p000546UCAAGAGCAAUAACGAAAAAUGU
hsa-miR-425-5p001516AAUGACACGAUCACUCCCGUUGA
hsa-miR-1225-3p002766UGAGCCCCUGUGCCGCCCCCAG
hsa-miR-1233-3p002768UGAGCCCUGUCCUCCCGCAG
hsa-miR-1274b002884UCCCUGUUCGGGCGCCA
hsa-miR-1303002792UUUAGAGACGGGGUCUUGCUCU
RNU6B001093CGCAAGGATGACACGCAAATTCGTGAAGCGTTCCATATTTTT
Table 2. Demographic characteristics of the included patients.
PatientsAdenomaAdenoma with Early CarcinomaCRC without Lymph Node MetastasesCRC with Lymph Node Metastases
M:F10:19:44:69:4
Age62.3 ± 10.764.9 ± 5.772.7 ± 11.673.2 ± 11.8
Legend: CRC, colorectal cancer; F, female; M, male.
Table 3. Condensed view of prioritization results for the miRNAs identified for further validation.
GenemiRNAAssociation with at Least Two DatabasesFolding Free Energy
Constraints
RNA22Direct
Validation
L1TD1hsa-miR-1303++
SLITRK6hsa-miR-199a-3p++
hsa-miR-425-5p++
ST6GALNAC1hsa-miR-335-5p++
TCEA3hsa-miR-335-5p++
hsa-miR-1225-3p++
hsa-miR-1233-3p+++ *
Legend: CRC, colorectal carcinoma; *, did not appear as a significant binding pair, but had a folding energy higher than the software cut-off.
Table 4. Spearman’s correlation coefficients between expression of genes and their potentially regulatory miRNAs.
Gene and miRNACorrelation CoefficientSignificance (2-Tailed)
L1TD1miR-1303−0.0240.862
SLITRK6miR-425-5p−0.1870.176
miR-199a-3p−0.3230.017 *
TCEA3miR-1233-3p0.1160.360
miR-1225-3p0.0560.660
Legend: * p ≤ 0.05.
Table 5. Spearman correlation coefficients of the association between ΔCq of analysed genes and miRNAs and level of malignancy (from normal mucosa to adenoma, adenoma with early carcinoma, carcinoma without and carcinoma with lymph node metastases).
Gene and miRNACorrelation CoefficientSignificance (2-Tailed)
L1TD10.3360.011
SLITRK6−0.433<0.001
ST6GALNAC1−0.1860.141
TCEA30.1020.419
miR-199a-3p0.1280.291
miR-425-5p0.2090.083
miR-1225-3p0.3450.003
miR-1233-3p0.2760.021
miR-13030.0140.912
Publisher’s Note: MDPI stays neutral with regard to jurisdictional claims in published maps and institutional affiliations.

