Article

Role of Kallikrein 7 in Body Weight and Fat Mass Regulation

1
Medical Department III-Endocrinology, Nephrology and Rheumatology, University of Leipzig, 04103 Leipzig, Germany
2
German Center for Diabetes Research (DZD), 85764 Neuherberg, Germany
3
Department of Life Sciences and Chemistry, Jacobs University Bremen, 28759 Bremen, Germany
4
Institute of Anatomy and Cell Biology, Martin-Luther-University Halle-Wittenberg, 06108 Halle (Saale), Germany
5
Institute of Molecular Medicine and Cell Research, Faculty of Medicine, University of Freiburg, 79104 Freiburg, Germany
6
Helmholtz Institute for Metabolic, Obesity and Vascular Research (HI-MAG) of the Helmholtz Zentrum München at the University of Leipzig and University Hospital Leipzig, Philipp-Rosenthal-Str. 27, 04103 Leipzig, Germany
7
Medical Center, Institute of Surgical Pathology, Faculty of Medicine, University of Freiburg, 79106 Freiburg, Germany
8
Integrated Research and Treatment Center (IFB) AdiposityDiseases, University of Leipzig, 04103 Leipzig, Germany
*
Authors to whom correspondence should be addressed.
Biomedicines 2021, 9(2), 131; https://doi.org/10.3390/biomedicines9020131
Submission received: 4 January 2021 / Revised: 21 January 2021 / Accepted: 25 January 2021 / Published: 29 January 2021
(This article belongs to the Section Molecular and Translational Medicine)

Abstract

:
Increased plasma and adipose tissue protease activity is observed in patients with type 2 diabetes and obesity. It has been proposed that specific proteases contribute to the link between obesity, adipose tissue inflammation and metabolic diseases. We have recently shown that ablation of the serine protease kallikrein-related peptidase 7 (Klk7) specifically in adipose tissue preserves systemic insulin sensitivity and protects mice from obesity-related AT inflammation. Here, we investigated whether whole body Klk7 knockout (Klk7−/−) mice develop a phenotype distinct from that caused by reduced Klk7 expression in adipose tissue. Compared to littermate controls, Klk7−/− mice gain less body weight and fat mass both under chow and high fat diet (HFD) feeding, are hyper-responsive to exogenous insulin and exhibit preserved adipose tissue function due to adipocyte hyperplasia and lower inflammation. Klk7−/− mice exhibit increased adipose tissue thermogenesis, which is not related to altered thyroid function. These data strengthen our recently proposed role of Klk7 in the regulation of body weight, energy metabolism, and obesity-associated adipose tissue dysfunction. The protective effects of Klk7 deficiency in obesity are likely linked to a significant limitation of adipocyte hypertrophy. In conclusion, our data indicate potential application of specific KLK7 inhibitors to regulate KLK7 activity in the development of obesity and counteract obesity-associated inflammation and metabolic diseases.

1. Introduction

Obesity increases the risk to develop type 2 diabetes, cardiovascular and fatty liver diseases, likely in the context of promoting an underlying pro-inflammatory state [1]. Adipose tissue (AT) dysfunction is characterized by immune cell infiltration, adipocyte hypertrophy, ectopic fat deposition and altered adipokine secretion [2,3].
Elevated plasma and AT protease activity is associated with obesity, type 2 diabetes and chronic inflammation [4,5]. Intra- and extracellular proteases are significantly contributing to AT function, and dysregulation of proteolytic activities represents a direct link between obesity, AT inflammation and cardio-metabolic diseases. Global or conditional knock out of proteases or modulation of specific proteases’ activity reduced weight gain, inflammation and improved metabolic parameters under high fat diet (HFD) [5,6,7,8]. In accordance with that, overexpression of endogenous serpin inhibitors such as α1-antitrypsin (SERPINA1) and vaspin (SERPINA12) in AT reduces weight gain, inflammation and preserves insulin sensitivity under high fat diet [6,9].
In various mouse models, vaspin treatment improved glucose metabolism and reduced food intake [10,11,12,13]. Vaspin-mediated protection of AT from obesity-induced inflammation may contribute to improved insulin sensitivity, as has been shown in adipocytes in vitro [14]. Vaspin targets the serine protease KLK7 and the regulation of proteolytic activity represents an integral component of vaspins’ protective effects in obesity [15]. Klk7 ablation in AT partially protects mice from HFD-induced epigonadal fat expansion, AT inflammation, and preserves systemic insulin sensitivity [16]. Moreover, KLK7 was one of the most significantly upregulated genes during differentiation of human adipocytes from both lean and obese patients that may link inflammation and adipogenesis [17].
KLK7 is a member of the tissue kallikrein family that comprises 15 chymotrypsin- or trypsin-like serine proteases in humans [18,19]. KLK7 is predominantly expressed in the skin where it is involved in the desquamation process [20]. Aberrant KLK7 activity is a major underlying pathogenic mechanism of inflammatory skin diseases such as psoriasis [21], acne rosacea [22] and Netherton syndrome [23]. Quantitative mass spectrometry-based proteomics data shows highest KLK7 protein expression in hair follicles, the colon and esophagus [24]. KLK7 is also associated with tumor progression in various cancer types [25] and may therefore be considered a treatment target for a variety of diseases including those related to obesity [15,16].
Here, we test the hypothesis that whole-body ablation of Klk7 cause a metabolically healthy phenotype that is distinct from that observed in mice with reduced Klk7 AT expression.

2. Research Design and Methods

2.1. Animal Studies

Mice were housed in pathogen-free facilities (three to five mice per group and cage) at 22 ± 2 °C on a 12 h light/dark cycle. All mice had ad libitum access to water and food and were either fed a standard chow diet (EV153, 3.3% from fat, Ssniff®, Soest, Germany) or kept on a HFD containing 55% kJ from fat (E15772-34, Ssniff®, Soest, Germany) starting at an age of six weeks.

2.2. Generation and Genotyping of Klk7−/− Mice

Ablation of the Klk7 gene was achieved by cross breeding previously described [16] floxed Klk7fl/fl mice (generated by Taconic-Artemis, Cologne, Germany) with mice ubiquitously expressing Cre-recombinase under the transcriptional control of a human cytomegalovirus (CMV) minimal promoter [26] (Jackson Laboratories, B6.C-Tg(CMV-Cre)1 Cgn/J, stock no. 006054). Recombination results in ubiquitous deletion of exons two to five with loss of function for the Klk7 gene. Resulting CMV-Cre+_Klk7fl/fl mice (termed as Klk7−/− throughout the manuscript) were backcrossed on C57BL/6N background for at least five generations. Littermates without floxed Klk7 gene (CMV-Cre+_Klk7+/+) or without the Cre gene (CMV-Cre_Klk7fl/fl) were used as controls. Genomic DNA was isolated from the tail tip by using the DNeasy Kit (Qiagen, Hilden, Germany). Genotyping was performed by PCR using the following two primers (loxP site): 5′-GGGATGTAGGATTATGAGTGAGC-3′ (forward) and 5′-CAGTCCAGTGAACTGCTCACC-3′ (reverse); CMV-Cre: 5′-GCGGTCTGGCAGTAAAAACTATC-3′ (forward) and 5′-GTGAAACAGCATTGCTGTCACTT-3′ (reverse). DNA from control mice produced a 276 bp band, Klk7+/fl or Klk7fl/fl mice a 402 bp. Adipose-specific Klk7−/− knockout mice were previously described [16].

2.3. Phenotypic Characterization

Twelve male Klk7−/− mice and control littermates were studied from the age of six up to 32 weeks on chow diet. Total body weight was recorded weekly up to an age of 14 weeks, and thereafter in two-week intervals. Body composition, intraperitoneal (i.p.) insulin tolerance tests (ITT), glucose tolerance tests (GTT), indirect calorimetry were performed as described [16]. GTTs were performed after an overnight fast, ITT in ad libitum-fed mice. Under chow diet, GTT and ITT were performed at the age of 12 and 24 weeks, HFD animals underwent GTT and ITT at 18 weeks of age.
Blood glucose was determined from whole-venous blood samples using an automated glucose monitor (FreeStyle Mini; Abbott GmbH, Ludwigshafen, Germany). Serum adiponectin, chemerin, insulin, leptin, MCP-1, vaspin, fT3 and TT4 were measured by standard ELISAs [16]. Thyroid stimulating hormone (TSH) was determined in blood serum using a TSH-specific ELISA kit (CEA463MU, Cloud-Clone Corp., Houston, TX, USA). Serum concentrations of triglycerides (TGs), free fatty acids (FFAs) and cholesterol were analyzed by an automated system (COBAS 7000, Roche, Mannheim, Germany). For assessment of glycogen levels, liver tissues were homogenized and a glycogen assay kit was used (Biovision, Glycogen Assay Kit, Ilmenau, Germany).
Body composition was determined in conscious mice by nuclear magnetic resonance technology using an EchoMRI-700 instrument (Echo Medical Systems, Houston, TX, USA) in 10, 20 and 30 weeks old mice. Energy metabolism was analyzed using indirect calorimetry and CaloSys V2.1 metabolic chambers (TSE Systems, Bad Homburg, Germany) at an age of 30 weeks as previously described [16]. After 8–10 h of acclimatization, food and water intake, mean oxygen consumption (O2), CO2 production, respiratory exchange ratio, energy expenditure, spontaneous locomotor activity (X, Y, Z cage movement) and the distance run on a treadmill were recorded every 30 min for a total of 60 h. Rectal body temperature and body length (naso-anal length) were measured at the end of the study.
After sacrificing, organs were immediately removed, weighed (liver, subcutaneous inguinal (iWAT), epididymal (eWAT) and brown adipose tissue (BAT)) and frozen in liquid nitrogen. Measurements of adipocyte size distribution, and AT immunohistology was performed as described previously [16] using anti-CD16/32 (1:100; eBioscience, San Diego, CA, USA) to block Fc-receptors and stained by anti-CD45-e780 (1:200), anti-F4/80-PE-Cy7, anti-CD11c-PE, (all 1:100; eBioscience) and anti-CD206-Alexa647 (1:50; AbD Serotec, Kidlington, UK). DNA staining was performed using 7-aminoactinomycin D (7-AAD; BD Pharmingen, Feldkirchen, Germany).

2.4. RNA Isolation and Quantitative Real-Time PCR Analysis

RNA isolation and quantitative real-time PCR were performed as previously described [16]. All primer sequences are listed in Supplementary Table S1. Specific mRNA expression was calculated relative to 36B4 or 18S using the ΔΔCT method, as indicated.

2.5. Primary Adipocyte Cell Culture and Western Blot Analyses

AT stromal vascular fraction (SVF) was isolated, cultured and differentiated into mature adipocytes as previously described [16]. Insulin sensitivity of fully differentiated primary adipocytes from iWAT, eWAT and BAT was analyzed after 15 min stimulation with 100 nM insulin and subsequent Western blot analysis as previously described [14]. Primary antibodies were the following: phospho-AKT and AKT (CST #4060 and CST #4691, both from Cell Signaling Technologies, Danvers, MA, USA), cytochrome c (136F3) (CST #4280), a-tubulin (CST #2144), OxPhos rodent (#45-8099 ThermoFisher, Waltham, MA, USA), UCP1 (ab10983), b-actin (A2066, Sigma Aldrich, St. Louis, MO, USA). HRP-coupled secondary antibodies (CST#7074). Chemiluminescence was detected using the G:BOX Chemi XX9 documentation system with GeneTools analysis software (Syngene, Cambridge, UK).

2.6. Proteomics of AT Depots

Formalin-fixed, paraffin embedded specimens of iWAT and eWAT depots of control or ATKlk7−/− mice were processed [27] and liquid chromatography tandem mass spectrometry (LC-MS/MS) was performed as described [28]. Each group consisted of four biological replicates. Data analysis was performed with MaxQuant 1.6.12, using tryptic specificity with up to two missed cleavages, fixed cysteine carbamidomethylation, no variable modifications, and a mouse reference proteome sequence file downloaded from EMBL-EBI on 4th February 2020. Statistical analysis of quantitative proteomic data was performed using linear models for microarray analysis (limma) [29,30]. Proteins with an FDR-adjusted p-value < 0.05 and a quantitative alteration of >50% were considered to be significantly affected (Supplementary Tables S2–S5). Proteins were defined as exclusively expressed, whenever they were detected in N ≤ 1 samples of group A and N ≥ 3 samples of group B for the respective comparisons. For a broad over-representation analysis, proteins with an unadjusted p-value < 0.01 irrespective of fold change were considered, together with proteins exclusively detected in either control or ATKLK7−/− mice. Over-representation analysis was performed using the R topGO package (Version 2.42.0) [31] and gene ontology (GO) annotation. A broad gene list enrichment analysis for pathways was performed using Enrichr (www.amppharm.mssm.edu/Enrichr) [32,33].

2.7. Thyroid Gland Analysis

Thyroid tissue sampling and cryo-sectioning, biochemical analyses, indirect immunofluorescence and imaging as well as thyroid phenotyping by automated image analysis were performed as published [34,35,36]. The thyroid gland was removed, and either snap-frozen in liquid nitrogen (biochemistry), or fixed in 4% PFA in 200 mM HEPES, pH 7.4 (morphology). Cryo-preservation was carried out by incubating the thyroid tissue in Tissue Freezing Medium (Jung, through Leica Microsystems, Wetzlar, Germany) for 24 h, before tissue was frozen in the gas phase of liquid nitrogen and stored at −80 °C until sectioning. Thyroid tissue samples were homogenized and lysed in ice-cold PBS (68 mM NaCl, 63.2 mM Na2HPO4, 11.7 mM NaH2PO4, pH 7.2), containing 0.5% Triton X-100, 1 mM EDTA, and protease inhibitors (0.2 μg/mL aprotinin, Sigma-Aldrich (St. Louis, MI, USA), 1153; EDTA; 10 μM E-64, Enzo Life Science, Farmingdale, NY, USA, ALX 260007-M005; 1 μM pepstatin A, Sigma-Aldrich, 77170).

2.8. Statistical Analyses

Statistical analyses were performed using GraphPad Prism 7.0. Data are presented as means ± SEM. Differences between groups were analyzed as indicated in the figure legends. Sample sizes for every figure or table are presented in Supplementary Table S6.

3. Results

3.1. Generation of Klk7−/− Mice

Constitutive Klk7 knockout was achieved by deleting exons two to five of the Klk7 gene as previously described [16]. Heterozygous genetic deletion generates a Cre PCR product of a 100 bp as well as 276 bp (control) and 402 bp (floxed) instead of a 276 bp band found in control animals. Homozygous Klk7−/− animals showed a 100 bp Cre PCR product (Supplementary Figure S1A). Klk7−/− mice are fertile and were obtained with the expected Mendelian frequency. Using PCR analysis of genomic DNA, we confirmed Klk7 gene disruption (Supplementary Figure S1B).

3.2. Body Weight Gain and Body Fat Mass are Markedly Reduced in Klk7−/− Mice

Klk7−/− mice gained significantly less body weight than control littermates upon both chow and high fat diet, starting at an age of 14 weeks (Figure 1A,B, Table 1). Lower body weight of Klk7−/− mice was accompanied by a ~40% significant reduction of total fat mass under HFD (Figure 1C,D). In chow-fed mice, relative eWAT fat mass was significantly reduced, and HFD leads to both, a significant reduction in eWAT and iWAT fat mass in Klk7−/− vs. control mice (Figure 1E,F). Lean body mass was not altered in Klk7−/− mice (Supplementary Figure S2). Similarly, liver weight and liver glycogen content were not different (Figure 1E and Supplementary Figure S3).
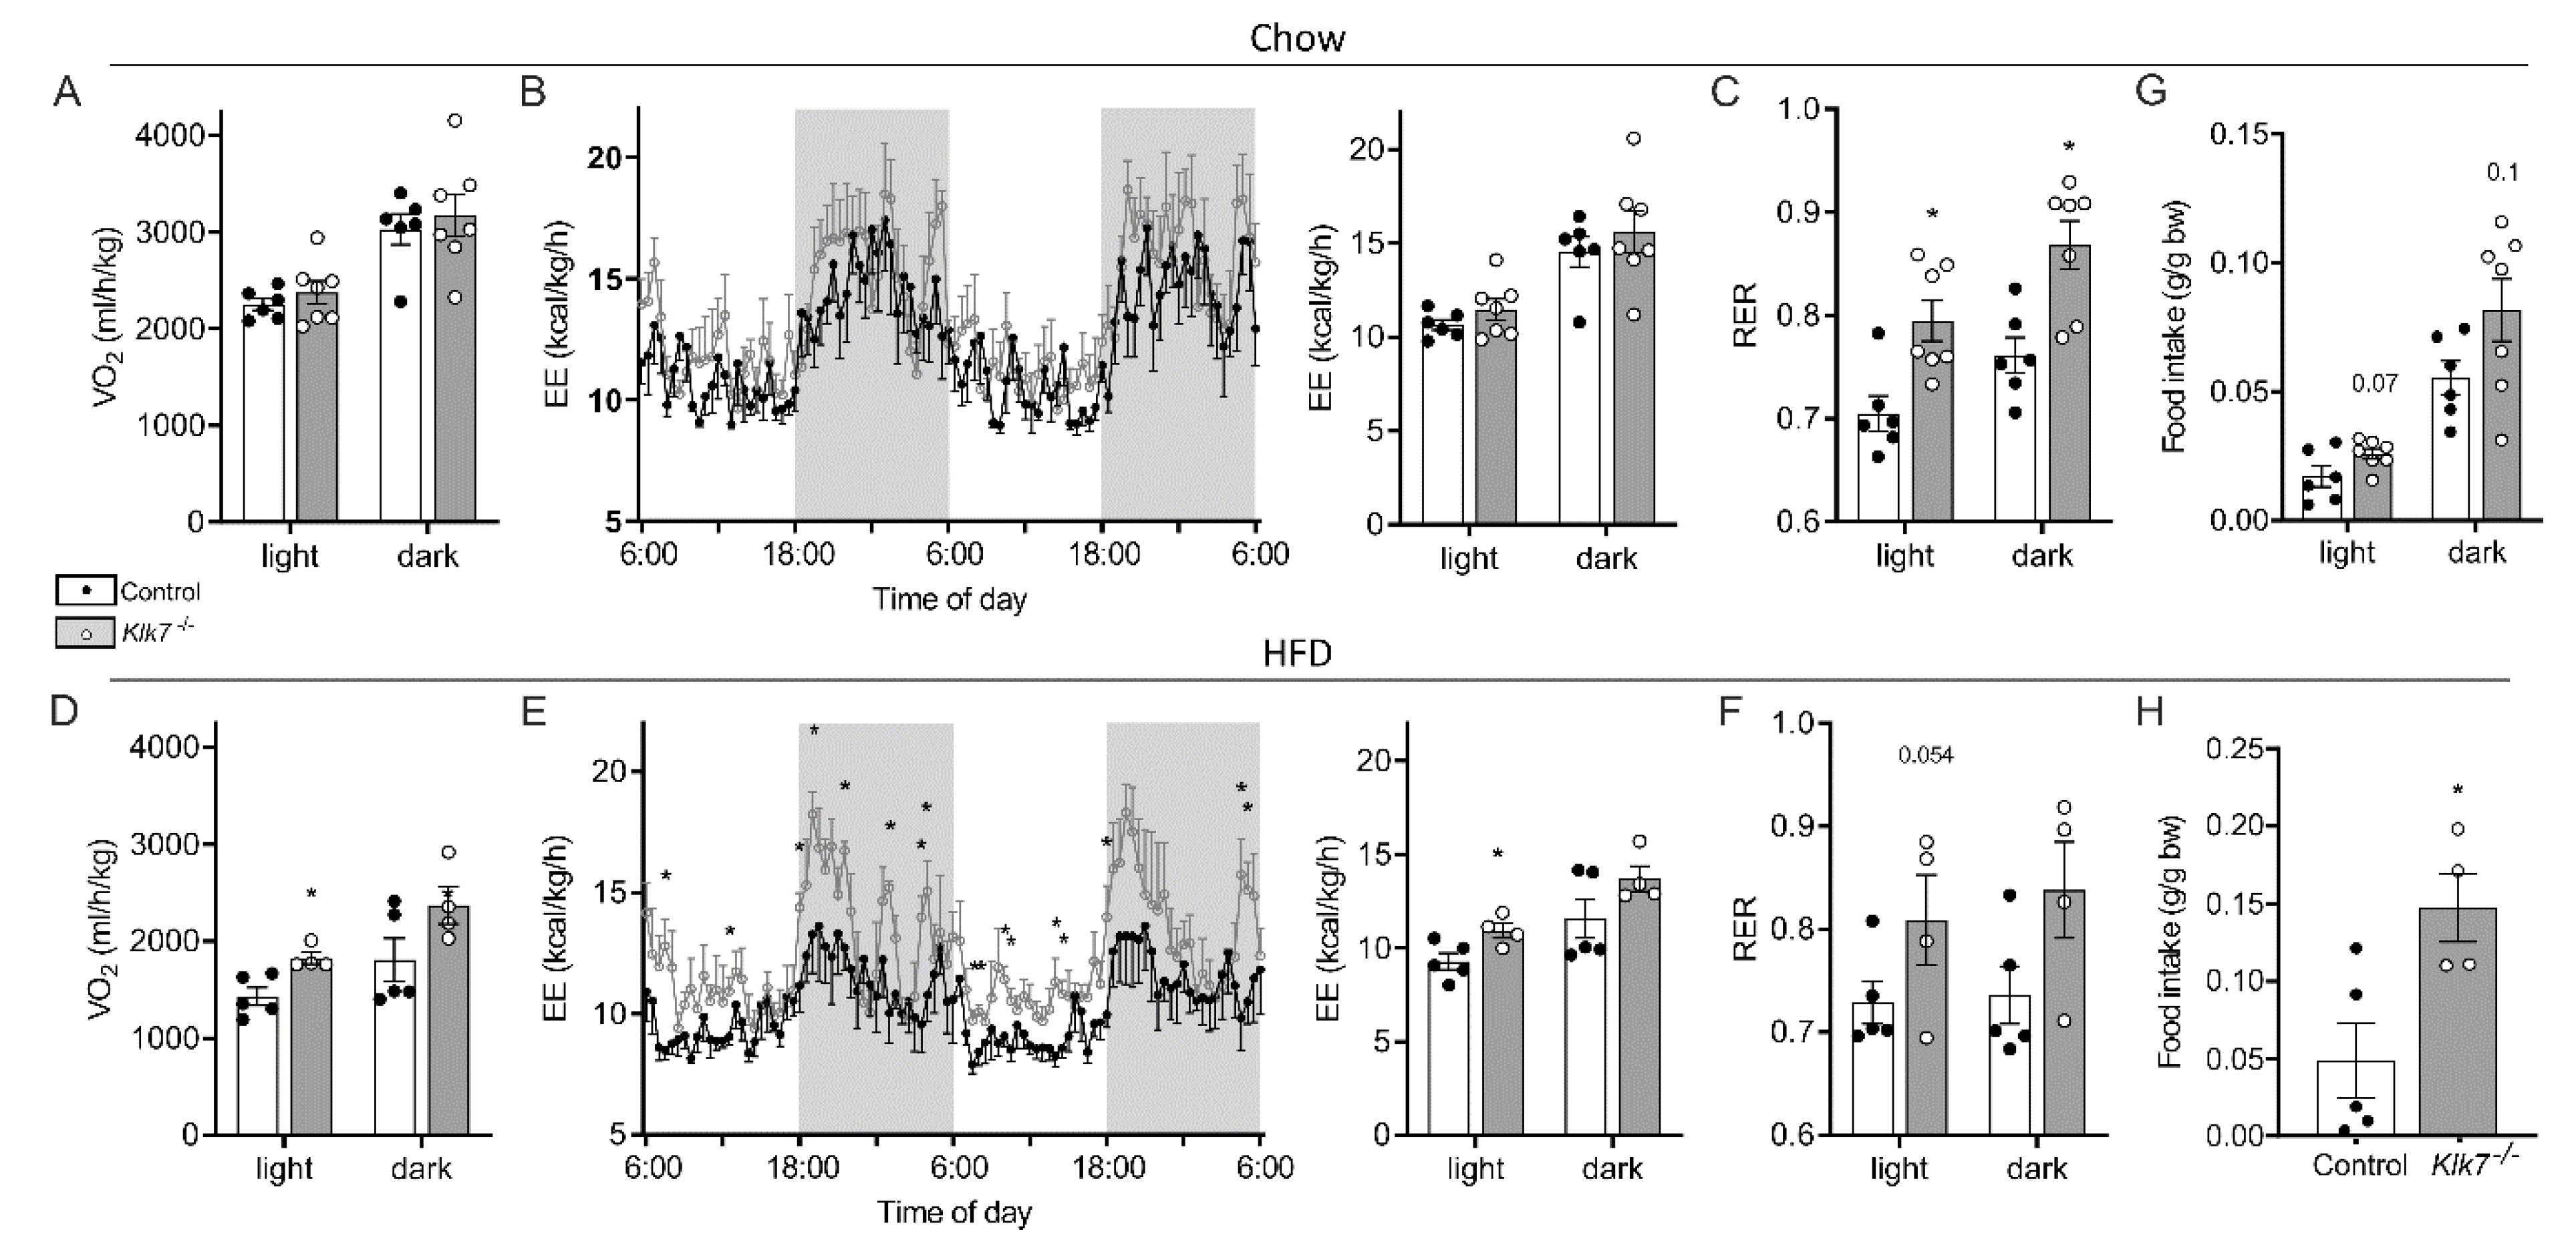
Energy expenditure was assessed using indirect calorimetry (Figure 2). While there was no change in oxygen consumption (Figure 2A) and total energy expenditure (EE, Figure 2B) in chow-fed animals, Klk7−/− mice under HFD showed significantly higher oxygen consumption (Figure 2D) and EE during the light phase compared to controls (p < 0.05; Figure 2E). Locomotor activity was not affected by Klk7−/−. Interestingly, Klk7−/− exhibited a preference for carbohydrate oxidation reflected by significantly higher respiratory exchange ratios (RER) compared to controls (Figure 2C,F). As observed in ATKlk7−/− mice [16], food intake was higher in Klk7−/− mice, both under chow and HFD (Figure 2G,H).

3.3. Consequences of Klk7−/− on Adipose Tissue

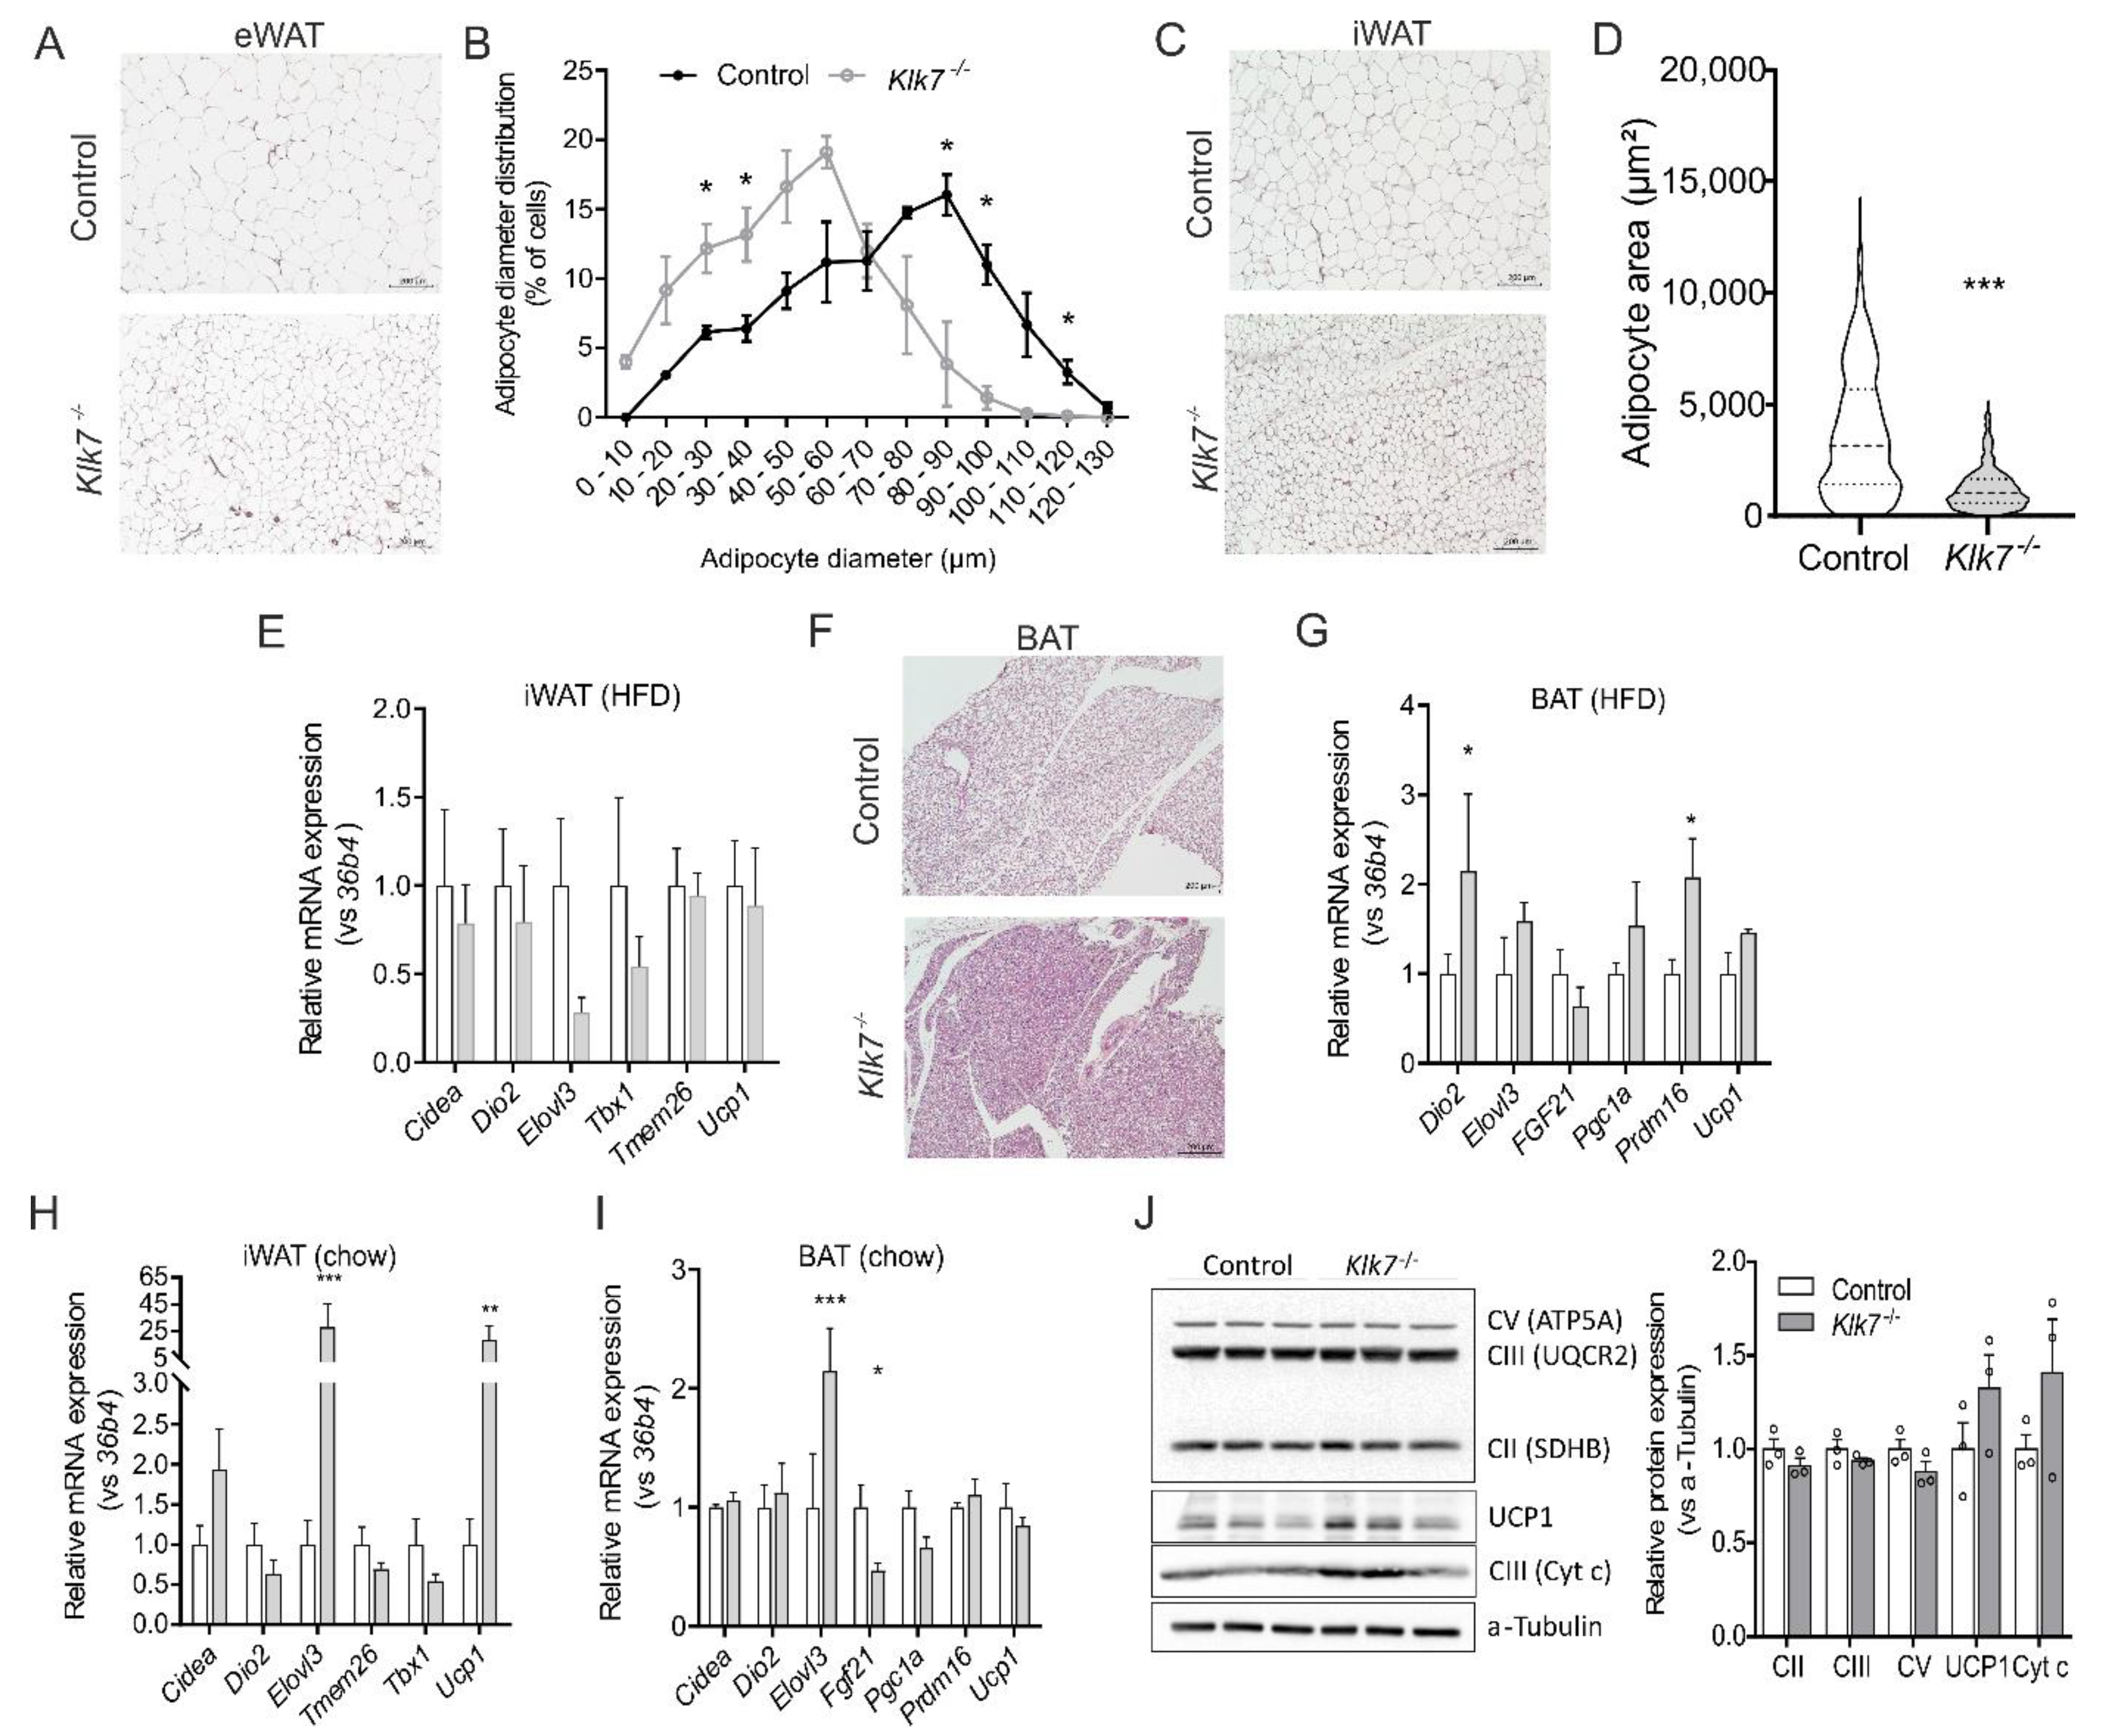
We performed adipocyte size distribution measurements and AT histology analyses. Expression of genes involved in thermogenesis (Ucp1, Cidea, Dio2, Elovl3, Fgf21, Pgc1a, Prdm16) and WAT browning (Tmem26, Tbx1) were analyzed in BAT, iWAT and eWAT. In HFD-fed mice, adipocytes were significantly smaller in eWAT (Figure 3A,B) and iWAT (Figure 3C,D) of Klk7−/− mice compared to controls. There were no differences in the expression of thermogenic genes (Figure 3E). Macrophage infiltration into eWAT of HFD-fed Klk7−/− mice was diminished, with more M2 and significantly less M1 polarized AT macrophages in the AT samples analyzed (Supplementary Figure S4). In Klk7−/− mice, HFD-induced whitening of BAT was reduced (Figure 3F) in parallel to increased expression of Dio2 and Prdm16 (Figure 3G). In chow-fed Klk7−/− mice, gene and protein expression related to BAT activity, mitochondrial activity and WAT browning were significantly higher compared to controls (Figure 3I,J).

3.4. Klk7−/− Mice Exhibit Lower Body Temperature and Altered Circulating T3

Thyroid hormones are major physiological regulators of metabolism and AT function. Surprisingly, body temperature of chow-fed Klk7−/− was significantly lower compared to control mice (Figure 4A). As multiple kallikrein proteases including KLK7 are expressed in thyroid tissue [37], we investigated potential effects of Klk7 deficiency on thyroid hormone generation, circulating thyroid stimulating hormone (TSH), total T4 (TT4), and free T3 (fT3) concentrations. While TSH and TT4 remained unchanged, fT3 serum levels were in tendency lower in Klk7−/− compared to control mice (Figure 4B–D). In the liver, expression of thyroid hormone responsive genes Pdk4 and thyroxine-binding globulin (Tbg) were decreased, while deiodinase 1 (Dio1) expression was not altered (Figure 4E). Expression of thyroglobulin solubilizing and degrading enzymes were evaluated in thyroid lysates of Klk7−/− mice, but protein amounts of aspartic cathepsin D as well as the cysteine proteases cathepsins B and L were not different from controls (Figure 4F and Supplementary Figure S5). In addition, thyroid protein analyses using gel-electrophoresis or immunostaining did not indicate genotype-related abnormalities (Figure 4G,H). Finally, thyroid histology and phenotyping revealed that thyroid follicle size and distribution is similar in control and Klk7−/− mice (Figure 4I).

3.5. Ablation of Klk7 Does Not Affect Circulating Vaspin and Chemerin

Klk7−/− mice do not develop abnormalities of circulating parameters, except for a 15% increase in FFAs under HFD (Table 1). Importantly, chemerin and vaspin serum concentrations were not different between Klk7−/− and control mice (Table 1). In proteome analyses, chemerin (RARRES2) was only detected in iWAT of HFD-fed Klk7−/− mice (Supplementary Table S3).

3.6. Klk7−/− Mice Exhibit Increased Sensitivity to Exogenous Insulin

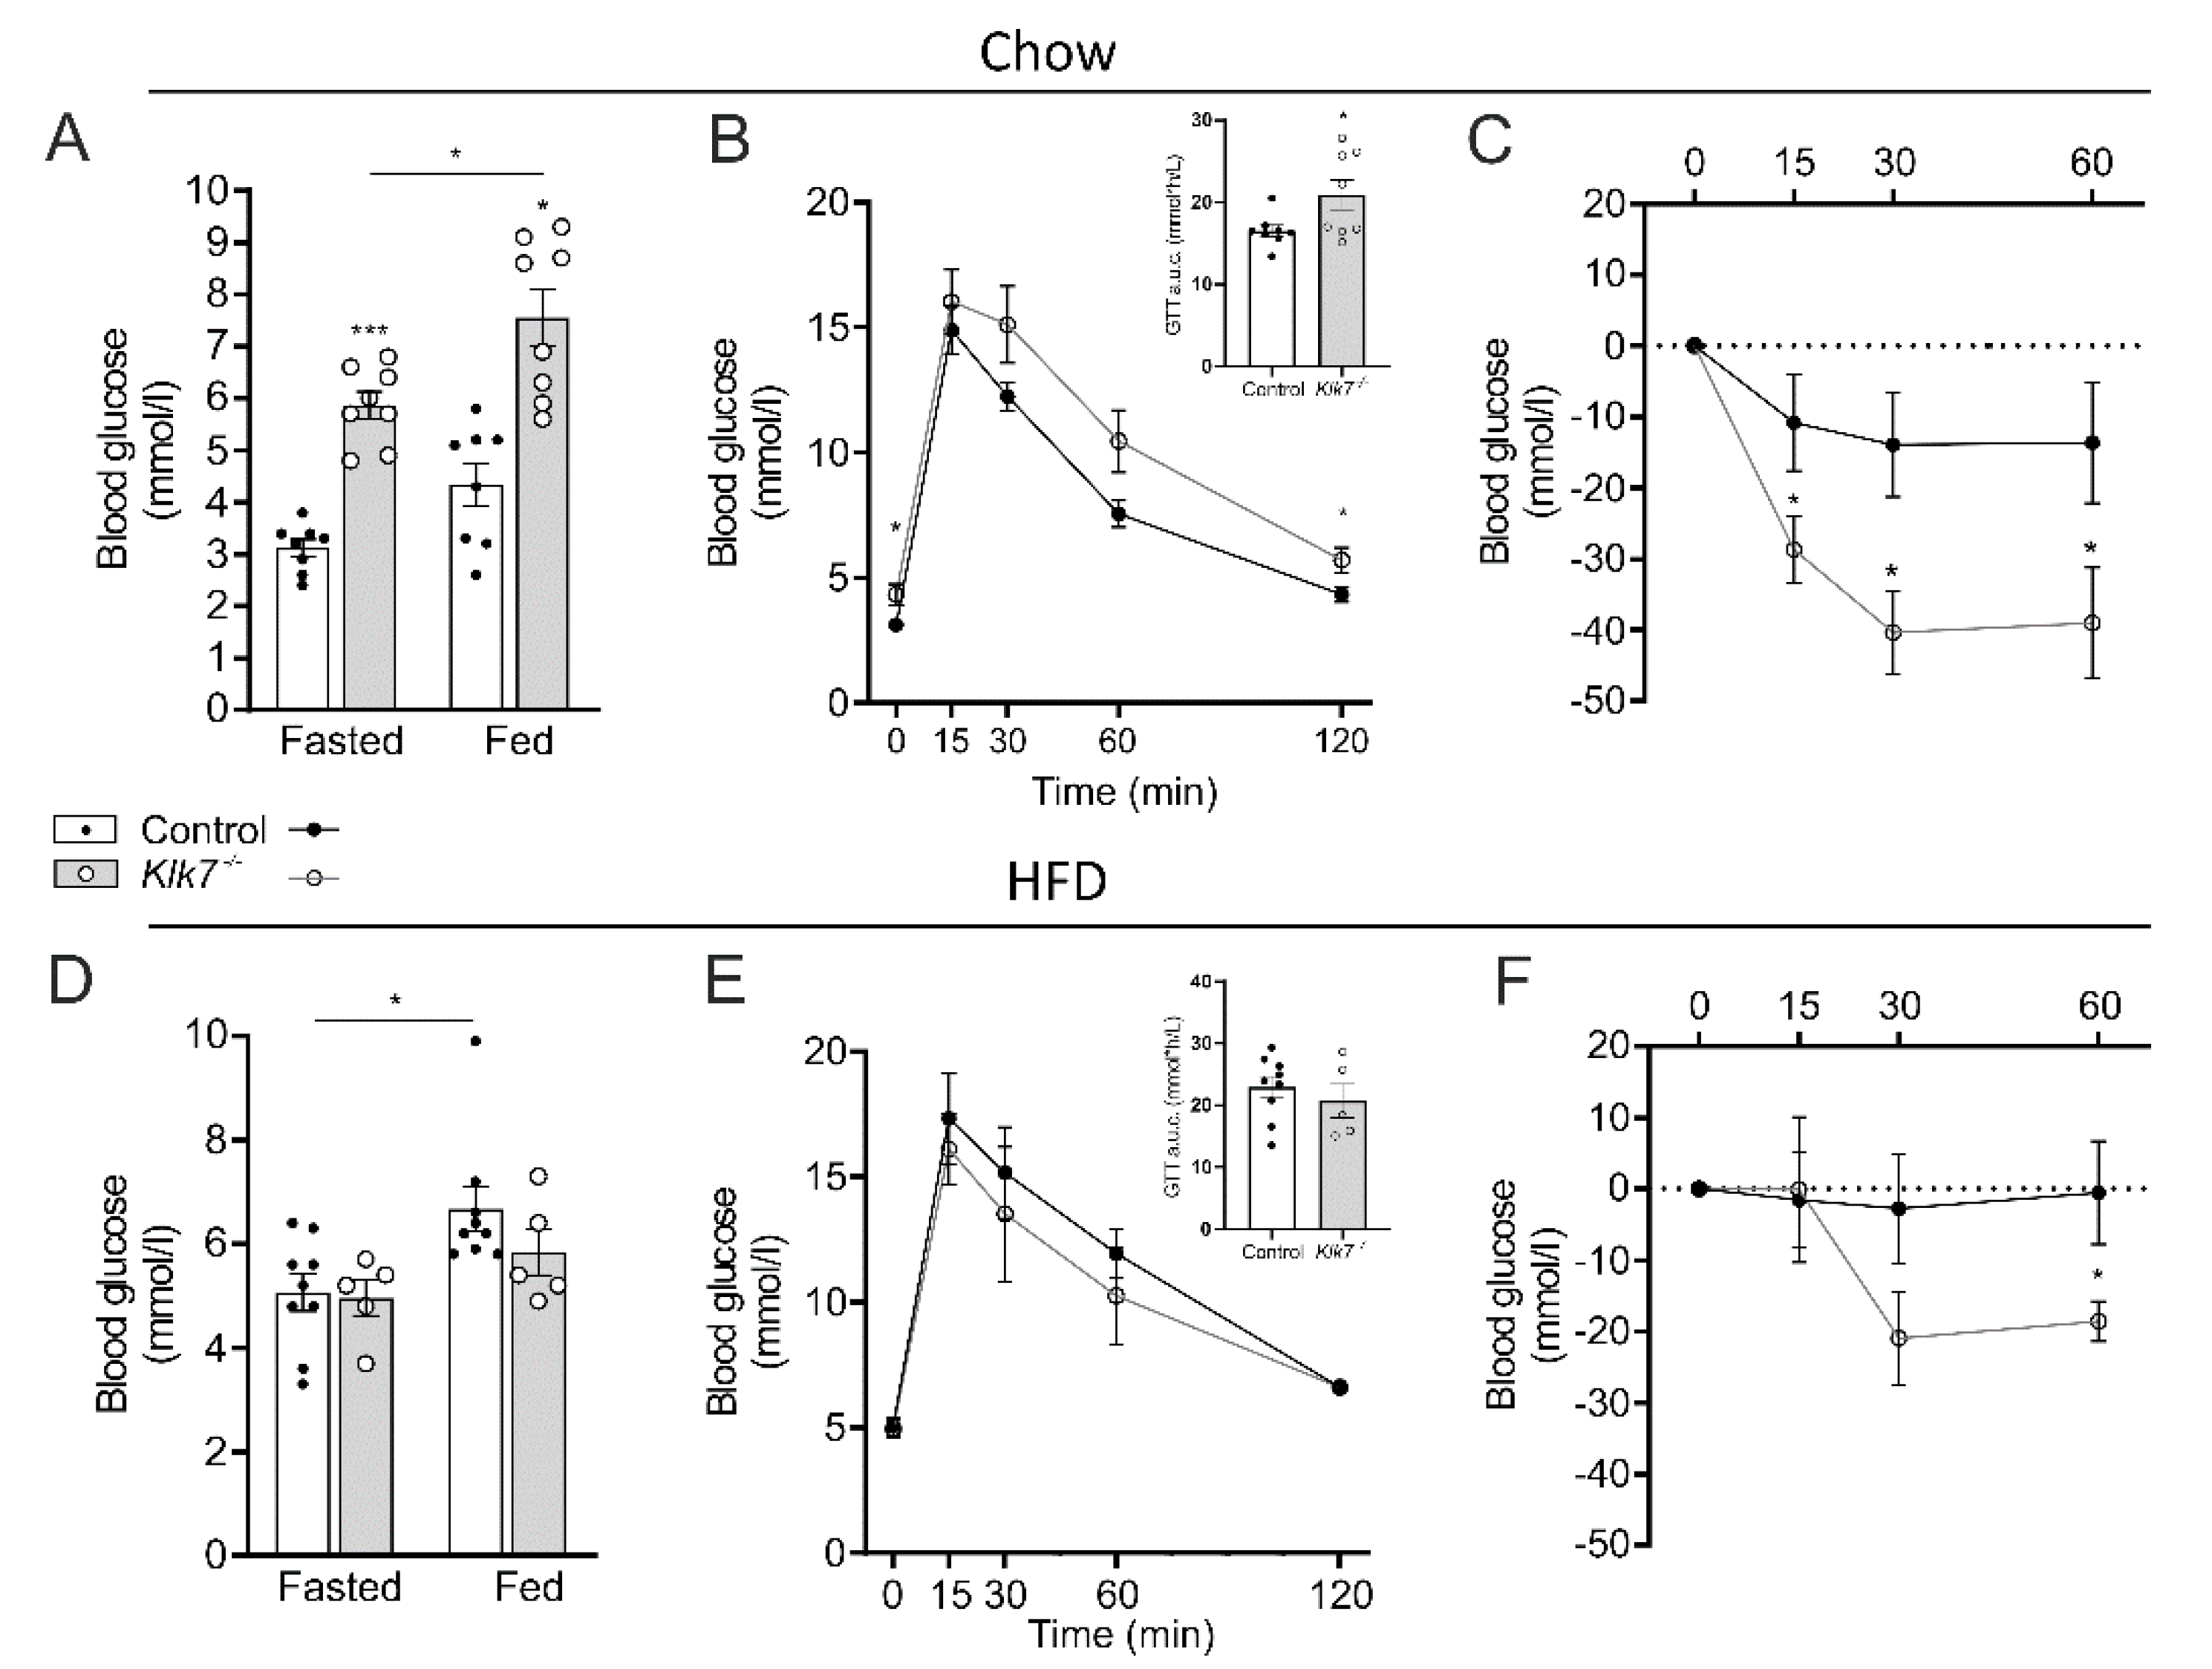
Despite the leaner phenotype, chow-fed Klk7−/− mice have ~80% higher fasted (p < 0.001) and fed (p < 0.05) glucose concentrations (Figure 5A). Moreover, Klk7−/− mice exhibit impaired glucose tolerance, with significantly higher areas under the curve of the GTT in comparison to control animals (p < 0.05; Figure 5B). On the other hand, ITTs revealed a pronounced higher sensitivity of Klk7−/− mice to exogenous insulin compared to controls (Figure 5C).
In contrast to chow-fed animals, fasted and fed blood glucose levels were not significantly different between KLK7−/− and control mice in response to HFD (Figure 5D). Despite the leaner phenotype of HFD-fed KLK7−/− mice, glucose tolerance was not different between the genotypes (Figure 5E). In contrast to KLK7−/− mice, HFD-fed controls almost lost responsiveness to exogenous insulin (Figure 5F). The leptin to adiponectin ratio and MCP-1 levels were significantly lower in both, chow- and HFD-fed KLK7−/− mice compared to controls (Figure 6A, Table 1).
Interestingly, in chow-fed mice glucose infusion rate (GIR) during hyperinsulinemic-euglycemic clamp studies was not different between KLK7−/− and controls (Figure 6B). Hepatic glucose production (HGP) and insulin-induced suppression of HGP were indistinguishable between KLK7−/− and control animals (Figure 6C). At the organ level, we measured significantly higher uptake of glucose into the heart of KLK7−/− mice (Figure 6D). Fully differentiated primary adipocytes from eWAT and iWAT of KLK7−/− mice showed significantly lower insulin-induced AKT activation in Western blot analyses (Figure 6E).

3.7. Klk7−/− Mice Have Depot-Specific Protein Expression Signatures in AT

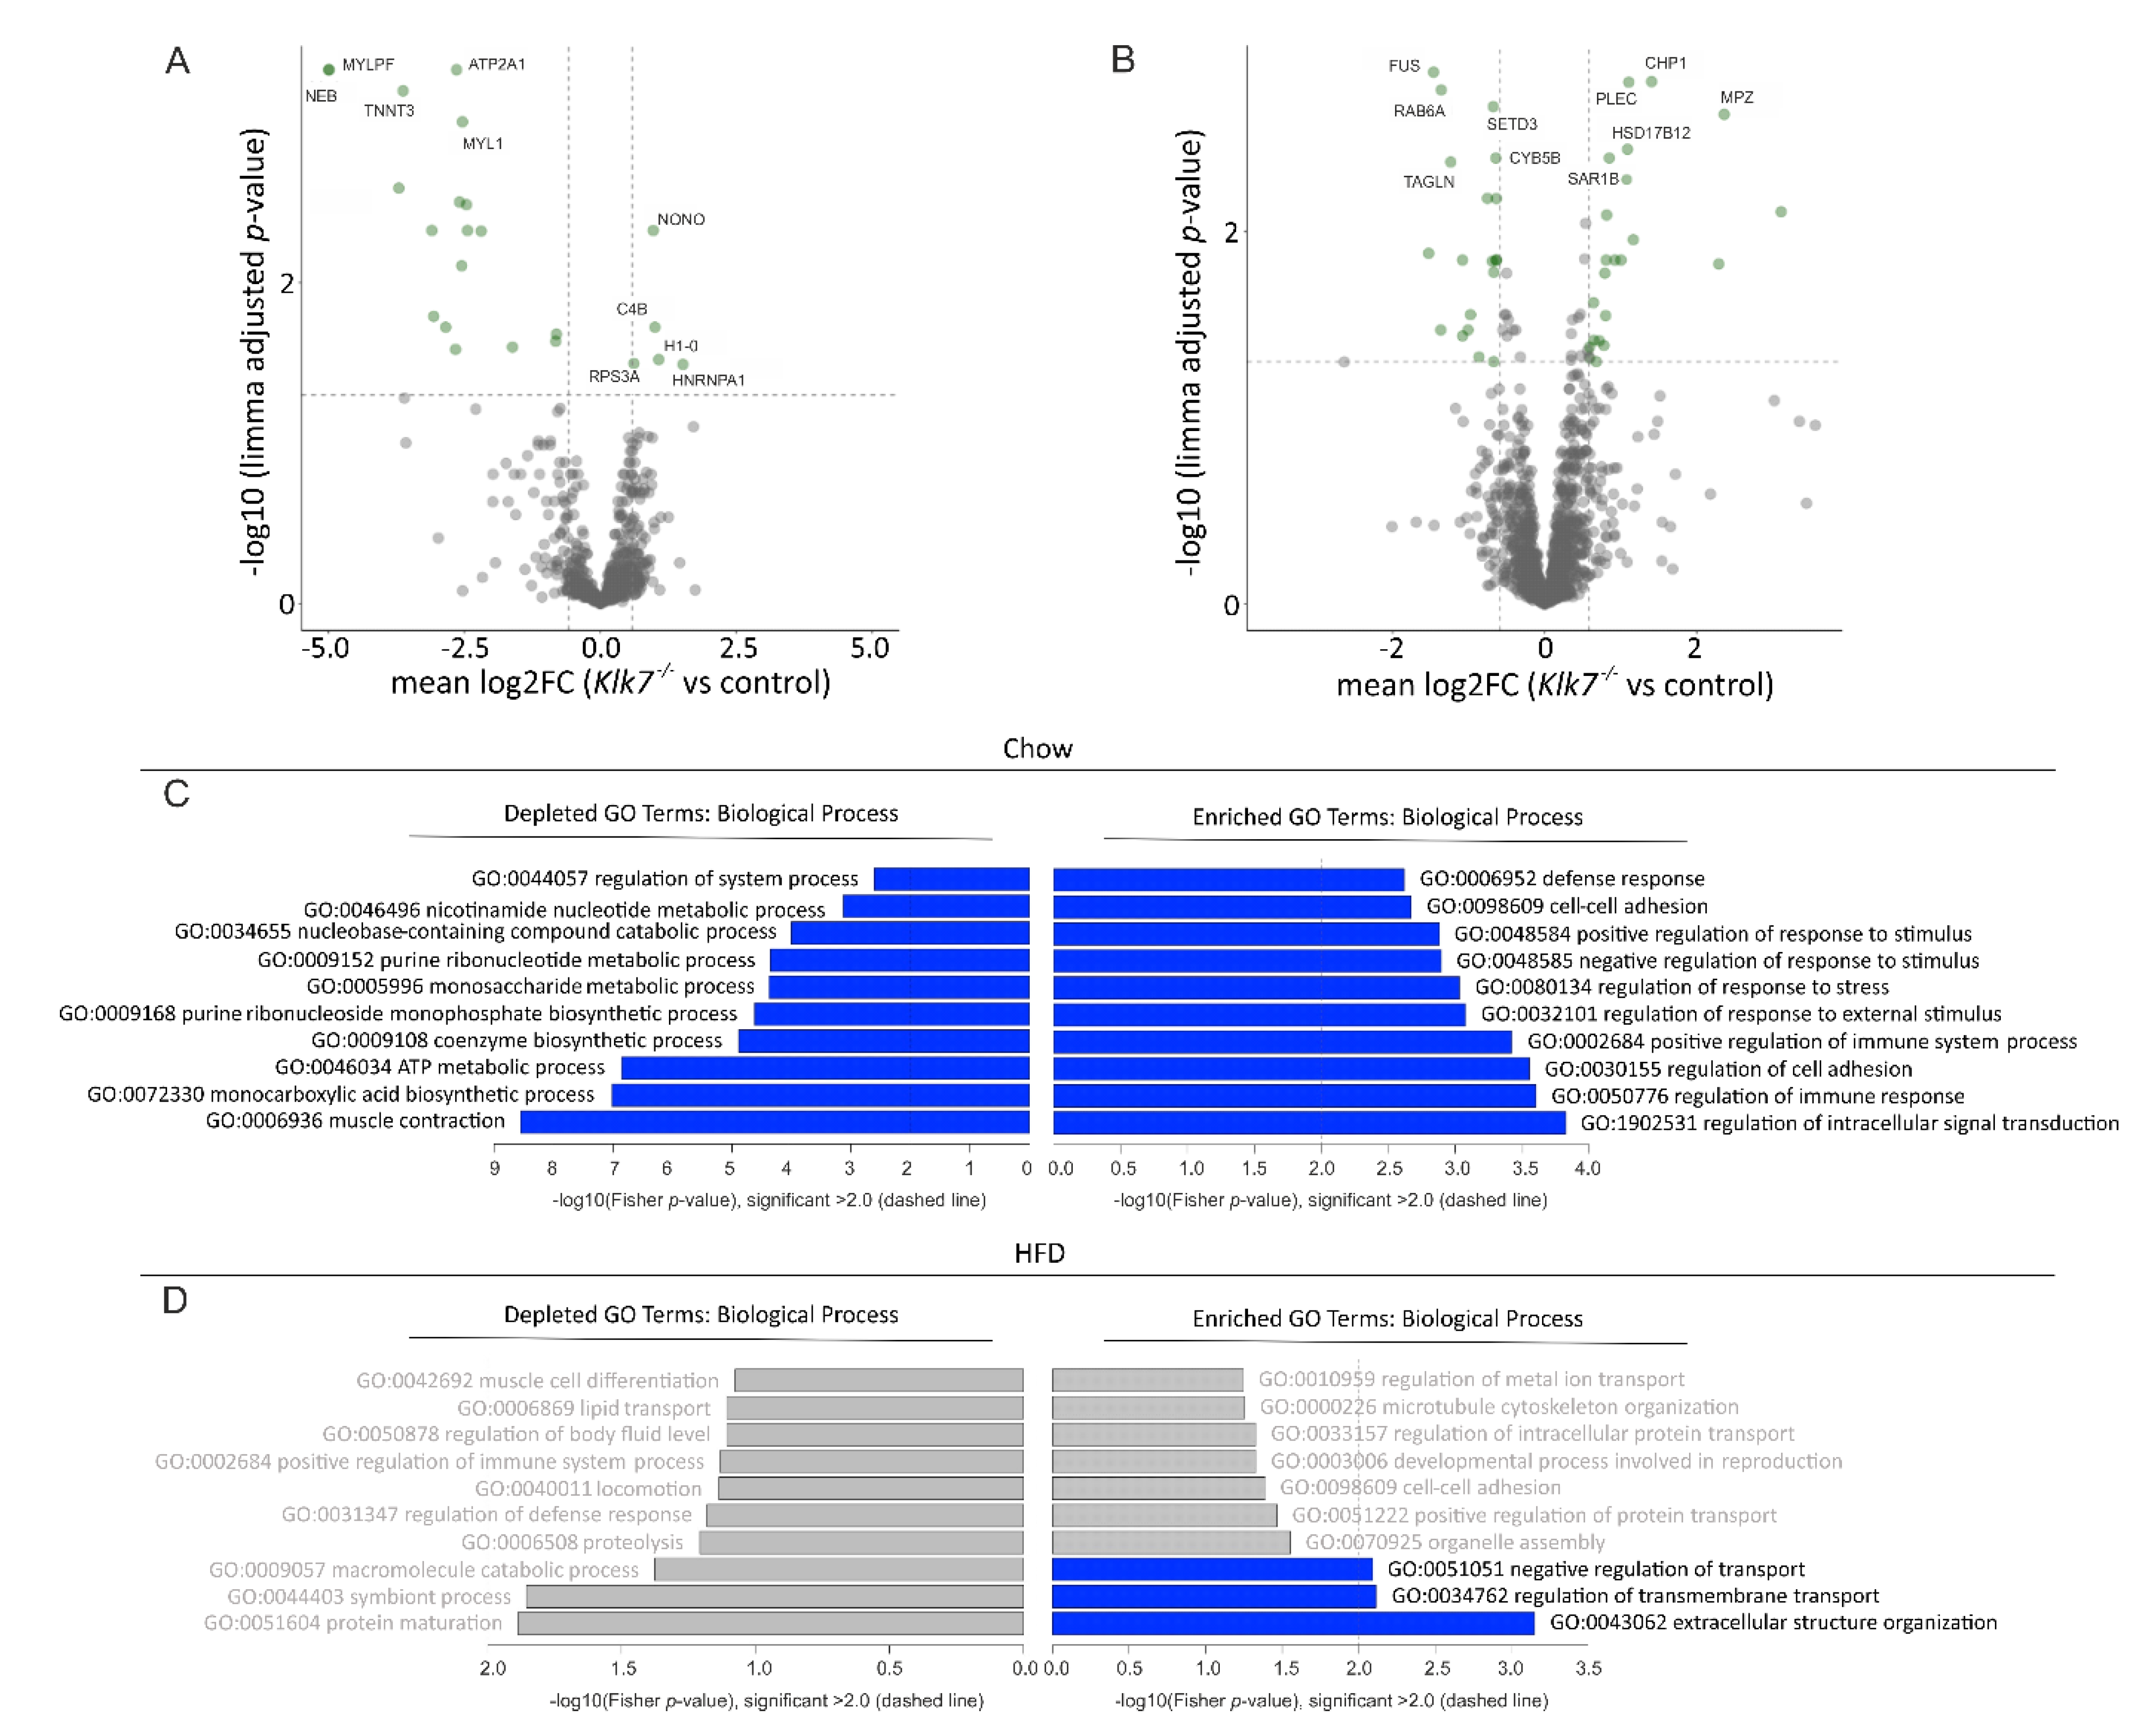
As we observed major alterations in AT of Klk7−/− mice, we aimed to unravel changes in protein expression that may contribute to improved AT function. Therefore, we performed label-free quantitative proteome analyses in eWAT and iWAT depots of adipose-specific Klk7−/− knockout mice (ATKlk7−/−) and control mice fed either chow or HFD. First, we compared expression of proteins in eWAT and iWAT between the HFD and chow diet group in controls only. Proteins over- and exclusively expressed in HFD versus chow fed mice were considered as markers of obesity. As shown in Supplementary Table S2, pathways related to PPAR signaling, fatty acid, glucose and cholesterol metabolism were increased in HFD induced obesity. We then focused on the impact of Klk7 deletion in AT on proteome composition in ATKlk7−/− mice. Significantly affected proteins were only identified in iWAT (23 under chow and 59 under HFD conditions) (Figure 7A,B). The number of proteins exclusively detected in AT samples was higher in iWAT (52 under chow and 66 under HFD) than in eWAT (8 under chow and 21 under HFD). These data indicate a more prominent role of Klk7 in subcutaneous AT. There was little overlap between identified proteins in chow and HFD conditions (Supplementary Tables S3 and S4).
Interestingly, we observed a striking accumulation of exclusively detected proteins in iWAT of chow-fed ATKlk7−/− mice (25 out of 52, Supplementary Table S4). This was accompanied by a number of significantly downregulated markers, thereof multiple tight junction proteins (MYLPF, MYH2, ACTN3, NEB). Pathway analysis revealed enrichment of proteins involved in ER processing of proteins, the phagosome, in amino and nucleotide sugar metabolism as well as PPAR signaling and sucrose metabolism to be affected by loss of Klk7 in AT. GO term analysis indicated upregulation of proteins involved in the regulation of immune responses as well as intracellular signal transduction and cell adhesion (Figure 7C). Repressed pathways were related to cGMP-PKG as well as calcium signaling (Supplementary Table S5) and proteins related to GO terms of muscle contraction, ATP metabolism and monocarboxylic acid metabolism were significantly repressed in iWAT of chow-fed ATKlk7−/− mice compared to controls (Figure 7C).
In iWAT of HFD-fed animals, COL3A1, CD163, NCK1, HFE, DNAJC3 and AGT were downregulated ATKlk7−/− mice compared to controls. KEGG pathway analysis revealed a highly significant induction of metabolic proteins in iWAT of obese ATKlk7−/− mice that are involved in fatty acid elongation and degradation (Supplementary Table S5). GO terms enrichment revealed significant reduction of proteins involved in extracellular structure organization and regulation of transport (Figure 7D). We compared our data to a dataset comprising potential proteolytic substrates of KLK7 identified by degradome analyses [38]. Overall, putative KLK7 substrates (~20% of differentially expressed proteins) were only observed in iWAT of HFD fed animals, independent of the genotype (Supplementary Tables S3 and S4). Our analyses corroborate a more pronounced impact of diet over KLK7 genotype on AT proteome. In subcutaneous AT, KLK7 seems to play an important role in the regulation of immune response and metabolism.

4. Discussion

We tested the hypothesis that ablation of Klk7 at the whole body level may cause a metabolically “healthier” phenotype that is distinct from that observed in ATKlk7−/− mice.
A key finding of the study is that whole-body deletion of Klk7 resembles the phenotype of AT-specific KO in many aspects. However, beyond the expected growth curve differences from ATKlk7−/− mice [16], Klk7−/− mice exhibit a leaner phenotype with aging. Body weight differences between Klk7−/− and control mice became significant under chow fed conditions at an age of 30 weeks. Both under chow and HFD, body fat mass was significantly lower in Klk7−/− compared to control mice, whereas lean body mass or organ weights were not affected by Klk7 ablation.
In contrast to ATKlk7−/−, Klk7−/− mice exhibit a generalized fat mass reduction suggesting an additional systemic role of Klk7 reduction beyond AT-specific effects on adipogenesis or expandability. Counter-intuitively to lower fat mass and preserved lean mass, Klk7−/− mice had higher food intake than controls. This may represent an (not entirely sufficient) attempt to compensate for higher energy expenditure of Klk7−/− compared to control mice as found in metabolic chamber experiments. In addition, lower fat mass was accompanied by lower circulating leptin, which may have contributed to higher food intake of Klk7−/− mice. However, based on our data, we are not able to distinguish potential causality chains whether effects of Klk7 ablation primarily cause activation of energy metabolism or affect central regulation of food intake. Lower leptin levels, a higher RER, absence of adipocyte hypertrophy and increased thermogenic gene expression may additionally suggest AT browning as another mechanism explaining the leaner phenotype and higher energy expenditure of Klk7−/− mice. As result of lower fat mass and/or healthier AT, we find circulating adipokine differences between the genotypes with lower levels of systemic inflammatory markers (e.g., MCP1) and higher circulating adiponectin. This phenotype was preserved under HFD conditions and mostly reflects the phenotype of ATKlk7−/− mice [16].
Thyroid hormones are major physiological regulators of metabolism [39] and partly of AT function [40]. In rats, kallikrein-related peptidases are regulated by thyroid hormones [41]. Although the overall thyroid state remained unaffected in Klk7−/− mice as indicated by unchanged serum TT4 and TSH levels, fT3 levels were lower in comparison to control animals. Our data suggest that T4-to-T3 conversion rates or T4-inactivation are affected by loss of Klk7. However, expression of the outer- and inner-ring deiodinating enzyme Dio1 in the liver was not affected by Klk7 deficiency, arguing against a liver-mediated change in TH metabolism. To further investigate the role of thyroid hormones on the phenotype of Klk7−/− mice, we performed detailed biochemical and morphometric analyses. The results indicated unchanged protein amounts of aspartic and cysteine cathepsins, which are the main thyroglobulin processing and degrading enzymes acting in the follicle lumen for solubilization from cross-linked multimers (cathepsins B and L) and in endo-lysosomal degradation of the TH precursor (cathepsins B, D, and L) [34,42,43]. Because thyroglobulin degradation states did not differ between the genotypes, we conclude that thyroglobulin biosynthesis, cross-linking for storage in the follicle lumen and utilization for TH liberation are not altered in Klk7−/− mice. However, we cannot exclude that decreased fT3 concentrations in the circulation feed back onto thyroid functionality. Hence, a thorough analysis was performed using semi-automated Cell Profiler-based histological examination of thyroid tissue sections [34,35,36], indicating that KLK7 is dispensable for proper thyroid development and function. This is an interesting finding, because the thyroid protease web is characterized by a high degree of redundancy when cysteine peptidases are considered [42,43]. Obviously, serine proteases such as KLK7 are not redundantly co-regulated with thyroglobulin-processing enzymes, and therefore likely play a different role in thyroid physiology.
Based on the phenotype similarities between ATKlk7−/− and Klk7−/− mice, we postulate that AT development and metabolism plays an important role in determining the phenotype of Klk7−/− mice. Compared to iWAT of control mice, we found significant differences in expression of proteins previously connected to AT development, function and expansion, such as COL3A1, CD163, NCK1, HFE, DNAJC3 and AGT [44,45,46,47,48,49]. Thus, the proteome signature of iWAT from ATKlk7−/− mice reflects a maintained normal AT function under HFD conditions. In addition, regulators of immune response were higher expressed, whereas proteins promoting macrophage-infiltration during the progression of obesity-associated inflammation, such as CD5L [50], were reduced. Together, AT signatures distinctly associated with reduced Klk7 expression may contribute to lower macrophage infiltration into AT [16].
The (AT-specific) consequences of Klk7 disruption may be explained by KLK7-related processes in AT including a reduced activation of pro-inflammatory adipokines such as chemerin. Interestingly, chemerin was only detected in iWAT of Klk7−/− mice with diet induced obesity. We have previously shown that KLK7 activates human chemerin by cleaving the preform into the active chemerin156 [51]. The effects of chemerin on adipocyte insulin sensitivity and glucose uptake are disputed [52,53] and may not alone explain impaired glucose uptake observed in primary adipocytes of Klk7−/− mice. However, Klk7−/− mice did not exhibit lower circulating chemerin, suggesting that modulation of chemerin activation by KLK7 does not represent the main mechanism explaining the leaner phenotype. Yet, chemerin is also involved in adipogenesis [54], and this may be in accordance with an increase of iWAT mass [16]. A higher expression of cathepsin L protease in iWAT of Klk7−/− mice may further contribute to the expansion of this depot, as loss this protease has been shown to affect adipocyte differentiation and lipid accumulation [7].
Both chow and HFD-fed Klk7−/− mice are more responsive to exogenous insulin. In hyperinsulinemic-euglycemic clamps, we could exclude that higher sensitivity to exogenous insulin was caused by higher insulin sensitivity of Klk7−/− compared to control mice. Differences in the response to intraperitoneal versus intravenous insulin application could be related to local effects of KLK7 action on insulin degradation. Insulin is cleaved by KLK7 in vitro [55], and inhibition of KLK7 activity is associated with prolonged insulin circulation and action in vivo [15]. One limitation of our study is that we are not able to provide formal proof of the concept that KLK7 modulates insulin action in vivo. Circulating, putatively KLK7-derived insulin fragments or differences in insulin degradation dynamics between Klk7−/− and control mice would have supported our hypothesis that KLK7-mediated insulin degradation occurs in vivo and contributes to prolonged insulin action. Despite the better response to insulin of Klk7−/− mice, endogenous insulin does not seem to be sufficient to maintain glucose homeostasis, particularly after a glucose challenge. Under chow fat conditions and despite lower fat mass, Klk7−/− mice are characterized by higher fasted, fed and GTT glucose levels. These differences were not confirmed under HFD. Because we consider AT as the critical organ of KLK7 action with regard to glucose homeostasis, we further investigated AT insulin sensitivity. Indeed, we find that primary adipocytes from Klk7−/− mice display lower insulin-induced AKT-phosphorylation compared to adipocytes obtained from controls and may therefore be considered insulin resistant. In contrast, glucose uptake into AT during the steady state of the clamp was not significantly different between Klk7−/− and control mice. Lower expression levels of AT SERCAs (sarcoplasmic/endoplasmic reticulum calcium ATPases SERCA3 and SERCA1), voltage-dependent anion-selective channel 1 (VDAC1) and ADP/ATP translocase 2 (SLC25A5) detected in our proteome analysis point towards impaired calcium homeostasis and increased cytosolic calcium levels. While we did not analyze hepatic proteome changes, similar changes in hepatic calcium levels could dysregulate liver glucose production via increased gluconeogenesis, thereby contributing to the observed hyperglycemia in chow-fed AT-Klk7−/− mice.

5. Conclusions

Whole body Klk7 deficiency significantly decreases body weight gain, both age-related and diet-induced. These data confirm and strengthen our recently demonstrated role of Klk7 in the regulation of body weight, energy metabolism, and obesity-associated adipocyte dysfunction using the AT-specific knockout [16]. Yet, in the constitutional knockout, the protective effects of Klk7 deficiency against obesity-associated adipose dysfunction and subsequently insulin resistance under HFD can be mainly attributed to lower fat mass (both, of eWAT and iWAT). This is a striking difference to the conditional ATKlk7−/−, where the protective effects were observed despite no significant differences in HFD-induced weight gain and obesity.
Together with rodent and human studies providing evidence that elevated plasma protease activity is associated with obesity and type 2 diabetes [4,5,6], this argues for the contribution of specific proteases to obesity and related diseases. Our data further suggest KLK7 as a treatment target for these diseases. Over the last years, various small molecule or peptide-based inhibitors of KLK7 have been described [56,57,58,59,60,61,62,63,64,65,66]. Application of these molecules to Klk7−/− mice may further improve our understanding of KLK7-related or -dependent mechanisms in AT function and obesity development.

Supplementary Materials

The following files are available online at https://www.mdpi.com/2227-9059/9/2/131/s1. Figure S1: Genotyping of CMV-Cre+_Klk7fl/fl animals, Figure S2: Lean mass in chow and HFD-fed animals, Figure S3: Liver glycogen content in Klk7−/− mice, Figure S4: Analysis of macrophage polarization in eWAT, Figure S5: Representative Western blot analysis of cathepsin B and D expression, Table S1–S7.

Author Contributions

A.K., N.K., M.B. conceived the study and supervised the project. A.K. is the guarantor of this work, had full access to all data in the study, and takes responsibility for the integrity of the data and data analysis. J.W. and K.K. performed experiments and analyzed data. M.L.B. and O.S. performed and analyzed proteomics. A.R.-L. analyzed data. M.R., A.P. and K.B. performed thyroid gland analyses. M.K., S.D. performed clamp experiments and indirect calorimetry. M.G. performed FACS analysis and adipose tissue histological experiments. M.S. contributed to discussion. J.T.H. and M.B. analyzed data and wrote the manuscript. All authors contributed to, reviewed and commented on the manuscript. All authors have read and agreed to the published version of the manuscript.

Funding

This work was funded by the Deutsche Forschungsgemeinschaft (DFG) Collaborative Research Center SFB1052 (B1 to M.B.; B4 to N.K., B9 to M.G., C7 to J.T.H.), in the framework of the priority program SPP1629 (BR1308/11-2 to K.B., KR 4258/1-1, KR 4258/3-1 to K.K.), and was supported by the German Federal Ministry of Education and Research (BMBF) IFB AdiposityDiseases, FKZ: 01EO1501, the Helmholtz Alliance ICEMED—Imaging and Curing Environmental Metabolic Diseases, through the Initiative and Networking Fund of the Helmholtz Association and the German Center for Diabetes Research (DZD; grant: 82DZD00601).

Institutional Review Board Statement

The study was conducted according to the guidelines of the Declaration of Helsinki, and all animal experiments were approved by the local authorities of the state of Saxony (Germany), as recommended by the responsible local animal ethics review board (Landesdirektion Leipzig, Germany, TVV23/12, TVV16/15, T02/13 and T08/16).

Data Availability Statement

All data generated or analyzed during this study are included in the published article and its online Supplementary files. The resources (e.g., Klk7−/− and ATKlk7−/− mice) generated and analyzed during the current study are available from the corresponding author upon reasonable request.

Acknowledgments

We would like to thank Eva Böge, Viola Döbel, Frauke Beermann, Claudia Gebhardt, Sabine Päschke and Daniela Kern for technical assistance.

Conflicts of Interest

M.B. received honoraria as a consultant and speaker from Amgen, AstraZeneca, Bayer, Boehringer-Ingelheim, Lilly, Novo Nordisk, Novartis and Sanofi. All other authors declare no competing interests.

Abbreviations

AKTprotein kinase B
ATadipose tissue
a.u.c.area under the curve
BATbrown adipose tissue
bpbase pair
bwbody weight
Cideacell death inducing DFFA like effector a
CMVcytomegalovirus
COL3A1collagen type 3A1
Crecauses/cyclic recombination
DEGdifferentially expressed gene
Diodeiodinase
DNAJC3DnaJ heat shock protein family (Hsp40) member C3
EEenergy expenditure
Elovl3elongation of very long chain fatty acids like 3
ERendoplasmic reticulum
eWATepididymal white adipose tissue
Fcfragment crystallizable
FCfold change
FDRfalse discovery rate
FFAfree fatty acid
FGF21fibroblast growth factor 21
fT3free T3
GIRglucose infusion rate
GOgene ontology
GTTglucose tolerance tests
HCheavy chain
HFDhigh fat diet
HFEhomeostatic iron regulator
HGPhepatic glucose production
HMWhigh molecular weight
HRPhorseraddish peroxidase
i.p.intraperitoneal
ITTinsulin tolerance tests
iWATinguinal white adipose tissue
KEGGKyoto Encyclopedia of Genes and Genomes
KLK7kallikrein-related peptidase 7–protein
KLK7kallikrein-related peptidase 7–human gene
Klk7kallikrein-related peptidase 7–mouse gene
Klk7−/−mouse Klk7 gene knockout
Limmalinear models for microarray analysis
M1classically activated macrophage
M2alternatively activated macrophage
MCP-1monocyte chemotactic protein 1
MRImagnetic resonance imaging
MYH2myosin heavy chain 2
MYLPFmyosin light chain
NCK1NCK adaptor protein 1
NEBnebulin
PDK4pyruvat dehydrogenase kinase 4
PEphycoerythrin
PGC1APPAR gamma coactivator 1-alpha
PKGprotein kinase G
PPARperoxisome proliferator activated receptor
PRDM16PR/SET domain 16
RARRES2retinoic acid receptor responder 2
RERrespiratory exchange ratio
SCsingle chain
SERCAsarcoplasmic/endoplasmic reticulum calcium ATPase
SLC25A5ADP/ATP translocase 2
SVFstromal vascular fraction
Tbgthyroxine-binding globulin
Tbx1T-box transcription factor 1
TGtriglyceride
THthyroid hormone
TMEM26transmembrane protein 26
TSHthyroid stimulating hormone
TT4total T4
TUBtubulin
UCP1uncoupling protein 1
Vaspinvisceral adipose tissue-derived serine protease inhibitor
VDAC1voltage-dependent anion-selective channel 1

References

  1. Bray, G.A. Medical consequences of obesity. J. Clin. Endocrinol. Metab. 2004, 89, 2583–2589. [Google Scholar] [CrossRef] [PubMed] [Green Version]
  2. Klöting, N.; Blüher, M. Adipocyte dysfunction, inflammation and metabolic syndrome. Rev. Endocr. Metab. Disord. 2014, 15, 277–287. [Google Scholar] [CrossRef] [PubMed]
  3. Kusminski, C.M.; Bickel, P.E.; Scherer, P.E. Targeting adipose tissue in the treatment of obesity-associated diabetes. Nat. Rev. Drug Discov. 2016, 15, 639–660. [Google Scholar] [CrossRef] [PubMed]
  4. Mesallamy, H.O.E.; Hamdy, N.M.; Mostafa, D.M.; Amin, A.I. The Serine Protease Granzyme B as an Inflammatory Marker, in Relation to the Insulin Receptor Cleavage in Human Obesity and Type 2 Diabetes Mellitus. J. Interf. Cytok. Res. 2014, 34, 179–186. [Google Scholar] [CrossRef] [PubMed]
  5. Kuo, C.-S.; Chen, J.-S.; Lin, L.-Y.; Schmid-Schönbein, G.W.; Chien, S.; Huang, P.-H.; Chen, J.-W.; Lin, S.-J. Inhibition of Serine Protease Activity Protects Against High Fat Diet-Induced Inflammation and Insulin Resistance. Sci. Rep. 2020, 10, 1–11. [Google Scholar] [CrossRef]
  6. Mansuy-Aubert, V.; Zhou, Q.L.; Xie, X.; Gong, Z.; Huang, J.-Y.; Khan, A.R.; Aubert, G.; Candelaria, K.; Thomas, S.; Shin, D.-J.; et al. Imbalance between Neutrophil Elastase and its Inhibitor α1-Antitrypsin in Obesity Alters Insulin Sensitivity, Inflammation, and Energy Expenditure. Cell Metab. 2013, 17, 534–548. [Google Scholar] [CrossRef] [Green Version]
  7. Yang, M.; Zhang, Y.; Pan, J.; Sun, J.; Liu, J.; Libby, P.; Sukhova, G.K.; Doria, A.; Katunuma, N.; Peroni, O.D.; et al. Cathepsin L activity controls adipogenesis and glucose tolerance. Nat. Cell Biol. 2007, 9, 970–977. [Google Scholar] [CrossRef]
  8. Funicello, M.; Novelli, M.; Ragni, M.; Vottari, T.; Cocuzza, C.; Soriano-Lopez, J.; Chiellini, C.; Boschi, F.; Marzola, P.; Masiello, P.; et al. Cathepsin K Null Mice Show Reduced Adiposity during the Rapid Accumulation of Fat Stores. PLoS ONE 2007, 2, e683. [Google Scholar] [CrossRef]
  9. Nakatsuka, A.; Wada, J.; Iseda, I.; Teshigawara, S.; Higashio, K.; Murakami, K.; Kanzaki, M.; Inoue, K.; Terami, T.; Katayama, A.; et al. Vaspin Is an Adipokine Ameliorating ER Stress in Obesity as a Ligand for Cell-Surface GRP78/MTJ-1 Complex. Diabetologia 2012, 61, 2823–2832. [Google Scholar] [CrossRef] [Green Version]
  10. Klöting, N.; Kovacs, P.; Kern, M.; Heiker, J.T.; Fasshauer, M.; Schön, M.R.; Stumvoll, M.; Beck-Sickinger, A.G.; Blüher, M. Central vaspin administration acutely reduces food intake and has sustained blood glucose-lowering effects. Diabetologia 2011, 54, 1819–1823. [Google Scholar] [CrossRef] [Green Version]
  11. Hida, K.; Wada, J.; Eguchi, J.; Zhang, H.; Baba, M.; Seida, A.; Hashimoto, I.; Okada, T.; Yasuhara, A.; Nakatsuka, A.; et al. Visceral adipose tissue-derived serine protease inhibitor: A unique insulin-sensitizing adipocytokine in obesity. Proc. Natl. Acad. Sci. USA 2005, 102, 10610–10615. [Google Scholar] [CrossRef] [PubMed] [Green Version]
  12. Brunetti, L.; Di Nisio, C.; Recinella, L.; Chiavaroli, A.; Leone, S.; Ferrante, C.; Orlando, G.; Vacca, M. Effects of vaspin, chemerin and omentin-1 on feeding behavior and hypothalamic peptide gene expression in the rat. Peptides 2011, 32, 1866–1871. [Google Scholar] [CrossRef] [PubMed]
  13. Luo, X.; Li, K.; Zhang, C.; Yang, G.; Yang, M.; Jia, Y.; Zhang, L.; Ma, Z.A.; Boden, G.; Li, L. Central administration of vaspin inhibits glucose production and augments hepatic insulin signaling in high-fat-diet-fed rat. Int. J. Obes. 2016, 40, 947–954. [Google Scholar] [CrossRef] [PubMed]
  14. Zieger, K.; Weiner, J.; Krause, K.; Schwarz, M.; Kohn, M.; Stumvoll, M.; Bluher, M.; Heiker, J.T. Vaspin suppresses cytokine-induced inflammation in 3T3-L1 adipocytes via inhibition of NFkappaB pathway. Mol. Cell Endocrinol. 2018, 460, 181–188. [Google Scholar] [CrossRef] [PubMed] [Green Version]
  15. Heiker, J.T.; Klöting, N.; Kovacs, P.; Kuettner, E.B.; Sträter, N.; Schultz, S.; Kern, M.; Stumvoll, M.; Blüher, M.; Beck-Sickinger, A.G. Vaspin inhibits kallikrein 7 by serpin mechanism. Cell. Mol. Life Sci. 2013, 70, 2569–2583. [Google Scholar] [CrossRef] [PubMed] [Green Version]
  16. Zieger, K.; Weiner, J.; Kunath, A.; Gericke, M.; Krause, K.; Kern, M.; Stumvoll, M.; Klöting, N.; Blüher, M.; Heiker, J.T. Ablation of kallikrein 7 (KLK7) in adipose tissue ameliorates metabolic consequences of high fat diet-induced obesity by counteracting adipose tissue inflammation in vivo. Cell. Mol. Life Sci. 2017, 75, 727–742. [Google Scholar] [CrossRef]
  17. Sang-Hyeop, L.N.-H.; Koh, B.-J.K.; Song, L.; Song-Cheol, K.; Sun, S.C. Putative Positive Role of Inflammatory Genes in Fat Deposition Supported by Altered Gene Expression in Purified Human Adipocytes and Preadipocytes from Lean and Obese Adipose Tissues. J. Transl. Med. 2020, 18, 433. [Google Scholar]
  18. Prassas, I.; Eissa, A.; Poda, G.; Diamandis, E.P. Erratum: Unleashing the therapeutic potential of human kallikrein-related serine proteases. Nat. Rev. Drug Discov. 2015, 14, 732. [Google Scholar] [CrossRef] [Green Version]
  19. Egelrud, T. Purification and Preliminary Characterization of Stratum Corneum Chymotryptic Enzyme: A Proteinase That May Be Involved in Desquamation. J. Investig. Dermatol. 1993, 101, 200–204. [Google Scholar] [CrossRef] [Green Version]
  20. Sondell, B.; Thornell, L.E.; Egelrud, T. Evidence that stratum corneum chymotryptic enzyme is transported to the stratum corneum extracellular space via lamellar bodies. J. Investig. Dermatol. 1995, 104, 819–823. [Google Scholar] [CrossRef] [Green Version]
  21. Ekholm, E.; Egelrud, T. Stratum corneum chymotryptic enzyme in psoriasis. Arch. Dermatol. Res. 1999, 291, 195–200. [Google Scholar] [CrossRef] [PubMed]
  22. Yamasaki, K.; Di Nardo, A.; Bardan, A.; Murakami, M.; Ohtake, T.; Coda, A.; Dorschner, R.A.; Bonnart, C.; Descargues, P.; Hovnanian, A.; et al. Increased serine protease activity and cathelicidin promotes skin inflammation in rosacea. Nat. Med. 2007, 13, 975–980. [Google Scholar] [CrossRef]
  23. Kasparek, P.; Ileninova, Z.; Zbodakova, O.; Kanchev, I.; Benada, O.; Chalupský, K.; Brattsand, M.; Beck, I.M.; Sedlacek, R. KLK5 and KLK7 Ablation Fully Rescues Lethality of Netherton Syndrome-Like Phenotype. PLoS Genet. 2017, 13, e1006566. [Google Scholar] [CrossRef] [PubMed]
  24. Samaras, P.; Schmidt, T.; Frejno, M.; Gessulat, S.; Reinecke, M.; Jarzab, A.; Zecha, J.; Mergner, J.; Giansanti, P.; Ehrlich, H.-C.; et al. ProteomicsDB: A multi-omics and multi-organism resource for life science research. Nucleic Acids Res. 2019, 48, D1153–D1163. [Google Scholar] [CrossRef] [PubMed]
  25. Borgoño, C.A.; Diamandis, E.P. The emerging roles of human tissue kallikreins in cancer. Nat. Rev. Cancer 2004, 4, 876–890. [Google Scholar] [CrossRef] [PubMed]
  26. Schwenk, F.; Baron, U.; Rajewsky, K. A cre-transgenic mouse strain for the ubiquitous deletion of loxP-flanked gene segments including deletion in germ cells. Nucleic Acids Res. 1995, 23, 5080–5081. [Google Scholar] [CrossRef] [PubMed] [Green Version]
  27. Föll, M.; Fahrner, M.; Oria, V.O.; Kühs, M.; Biniossek, M.L.; Werner, M.; Bronsert, P.; Schilling, O. Reproducible proteomics sample preparation for single FFPE tissue slices using acid-labile surfactant and direct trypsinization. Clin. Proteom. 2018, 15, 1–15. [Google Scholar] [CrossRef] [Green Version]
  28. Oria, V.O.; Bronsert, P.; Thomsen, A.; Föll, M.; Zamboglou, C.; Hannibal, L.; Behringer, S.; Biniossek, M.; Schreiber, C.; Grosu, A.; et al. Proteome Profiling of Primary Pancreatic Ductal Adenocarcinomas Undergoing Additive Chemoradiation Link ALDH1A1 to Early Local Recurrence and Chemoradiation Resistance. Transl. Oncol. 2018, 11, 1307–1322. [Google Scholar] [CrossRef]
  29. Ritchie, M.E.; Phipson, B.; Wu, D.; Hu, Y.; Law, C.W.; Shi, W.; Smyth, G.K. limma powers differential expression analyses for RNA-sequencing and microarray studies. Nucleic Acids Res. 2015, 43, e47. [Google Scholar] [CrossRef]
  30. Kammers, K.; Cole, R.N.; Tiengwe, C.; Ruczinski, I. Detecting significant changes in protein abundance. EuPA Open Proteom. 2015, 7, 11–19. [Google Scholar] [CrossRef] [Green Version]
  31. Alexa, A.; Rahnenfuhrer, J. TopGo: Enrichment Analysis for Gene Ontology; R Package Version 2.42.0. 2020. Available online: https://bioconductor.org/packages/release/bioc/html/topGO.html (accessed on 27 January 2021). [CrossRef]
  32. Chen, E.Y.; Tan, C.M.; Kou, Y.; Duan, Q.; Wang, Z.; Meirelles, G.V.; Clark, N.R.; Ma’Ayan, A. Enrichr: Interactive and collaborative HTML5 gene list enrichment analysis tool. BMC Bioinform. 2013, 14, 128. [Google Scholar] [CrossRef] [PubMed] [Green Version]
  33. Kuleshov, M.V.; Jones, M.R.; Rouillard, A.D.; Fernandez, N.F.; Duan, Q.; Wang, Z.; Koplev, S.; Jenkins, S.L.; Jagodnik, K.M.; Lachmann, A.; et al. Enrichr: A comprehensive gene set enrichment analysis web server 2016 update. Nucleic Acids Res. 2016, 44, W90–W97. [Google Scholar] [CrossRef] [PubMed] [Green Version]
  34. Weber, J.; McInnes, J.; Kizilirmak, C.; Rehders, M.; Qatato, M.; Wirth, E.K.; Schweizer, U.; Verrey, F.; Heuer, H.; Brix, K. Interdependence of thyroglobulin processing and thyroid hormone export in the mouse thyroid gland. Eur. J. Cell Biol. 2017, 96, 440–456. [Google Scholar] [CrossRef] [PubMed] [Green Version]
  35. Qatato, M.; Szumska, J.; Skripnik, V.; Rijntjes, E.; Köhrle, J.; Brix, K. Canonical TSH Regulation of Cathepsin-Mediated Thyroglobulin Processing in the Thyroid Gland of Male Mice Requires Taar1 Expression. Front. Pharmacol. 2018, 9. [Google Scholar] [CrossRef] [PubMed] [Green Version]
  36. Dauth, S.; Rakov, H.; Sîrbulescu, R.F.; Ilies, I.; Weber, J.; Dugershaw, B.B.; Braun, D.; Rehders, M.; Wirth, E.K.; Führer, D.; et al. Function of Cathepsin K in the Central Nervous System of Male Mice is Independent of Its Role in the Thyroid Gland. Cell. Mol. Neurobiol. 2020, 40, 695–710. [Google Scholar] [CrossRef] [PubMed]
  37. Shaw, J.L.; Diamandis, E.P. Distribution of 15 human kallikreins in tissues and biological fluids. Clin Chem 2007, 53, 1423–1432. [Google Scholar] [CrossRef] [PubMed] [Green Version]
  38. Yu, Y.; Prassas, I.; Dimitromanolakis, A.; Diamandis, E.P. Novel Biological Substrates of Human Kallikrein 7 Identified through Degradomics. J. Biol. Chem. 2015, 290, 17762–17775. [Google Scholar] [CrossRef] [PubMed] [Green Version]
  39. Mullur, R.; Liu, Y.-Y.; Brent, G.A. Thyroid Hormone Regulation of Metabolism. Physiol. Rev. 2014, 94, 355–382. [Google Scholar] [CrossRef] [Green Version]
  40. Weiner, J.; Hankir, M.K.; Heiker, J.T.; Fenske, W.; Krause, K. Thyroid hormones and browning of adipose tissue. Mol. Cell. Endocrinol. 2017, 458, 156–159. [Google Scholar] [CrossRef]
  41. Clements, J.A.; Matheson, B.; Funder, J. Tissue-specific regulation of the expression of rat kallikrein gene family members by thyroid hormone. Biochem. J. 1990, 267, 745–750. [Google Scholar] [CrossRef] [Green Version]
  42. Friedrichs, B.; Tepel, C.; Reinheckel, T.; Deussing, J.; Von Figura, K.; Herzog, V.; Peters, C.; Saftig, P.; Brix, K. Thyroid functions of mouse cathepsins B, K, and L. J. Clin. Investig. 2003, 111, 1733–1745. [Google Scholar] [CrossRef] [PubMed] [Green Version]
  43. Brix, K.; Szumska, J.; Weber, J.; Qatato, M.; Venugopalan, V.; Al-Hashimi, A.; Rehders, M. Auto-Regulation of the Thyroid Gland Beyond Classical Pathways. Exp. Clin. Endocrinol. Diabetes 2020, 128, 437–445. [Google Scholar] [CrossRef] [PubMed]
  44. Kralova, L.I.; Kralova, A.; Cejkova, S.; Fronek, J.; Petras, M.; Sekerkova, A.; Thieme, F.; Janousek, L.; Poledne, R. Characterisation and comparison of adipose tissue macrophages from human subcutaneous, visceral and perivascular adipose tissue. J. Transl. Med. 2016, 14, 208. [Google Scholar] [CrossRef] [PubMed] [Green Version]
  45. Haider, N.; Dusseault, J.; Larose, L. Nck1 Deficiency Impairs Adipogenesis by Activation of PDGFRalpha in Preadipocytes. Science 2018, 6, 22–37. [Google Scholar]
  46. Hubler, M.J.; Peterson, K.R.; Hasty, A.H. Iron homeostasis: A new job for macrophages in adipose tissue? Trends Endocrinol. Metab. 2015, 26, 101–109. [Google Scholar] [CrossRef] [Green Version]
  47. Sharma, N.K.; Das, S.K.; Mondal, A.K.; Hackney, O.G.; Chu, W.S.; Kern, P.A.; Rasouli, N.; Spencer, H.J.; Yao-Borengasser, A.; Elbein, S.C. Endoplasmic Reticulum Stress Markers Are Associated with Obesity in Nondiabetic Subjects. J. Clin. Endocrinol. Metab. 2008, 93, 4532–4541. [Google Scholar] [CrossRef]
  48. Giacchetti, G.; Faloia, E.; Sardu, C.; Camilloni, M.A.; Mariniello, B.; Gatti, C.; Garrapa, G.; Guerrieri, M.; Mantero, F. Gene expression of angiotensinogen in adipose tissue of obese patients. Int. J. Obes. 2000, 24, S142–S143. [Google Scholar] [CrossRef] [Green Version]
  49. Kim, S.; Urs, S.; Massiera, F.; Wortmann, P.; Joshi, R.; Heo, Y.-R.; Andersen, B.; Kobayashi, H.; Teboul, M.; Ailhaud, G.P.; et al. Effects of High-Fat Diet, Angiotensinogen (agt) Gene Inactivation, and Targeted Expression to Adipose Tissue on Lipid Metabolism and Renal Gene Expression. Horm. Metab. Res. 2002, 34, 721–725. [Google Scholar] [CrossRef]
  50. Kurokawa, J.; Nagano, H.; Ohara, O.; Kubota, N.; Kadowaki, T.; Arai, S.; Miyazaki, T. Apoptosis inhibitor of macrophage (AIM) is required for obesity-associated recruitment of inflammatory macrophages into adipose tissue. Proc. Natl. Acad. Sci. USA 2011, 108, 12072–12077. [Google Scholar] [CrossRef] [Green Version]
  51. Schultz, S.; Saalbach, A.; Heiker, J.T.; Meier, R.; Zellmann, T.; Simon, J.C.; Beck-Sickinger, A.G. Proteolytic activation of prochemerin by kallikrein 7 breaks an ionic linkage and results in C-terminal rearrangement. Biochem. J. 2013, 452, 271–280. [Google Scholar] [CrossRef] [Green Version]
  52. Kralisch, S.; Weise, S.; Sommer, G.; Lipfert, J.; Lossner, U.; Bluher, M.; Stumvoll, M.; Fasshauer, M. Interleukin-1beta induces the novel adipokine chemerin in adipocytes in vitro. Regul. Pept. 2009, 154, 102–106. [Google Scholar] [CrossRef] [PubMed]
  53. Takahashi, M.; Takahashi, Y.; Takahashi, K.; Zolotaryov, F.N.; Hong, K.S.; Kitazawa, R.; Iida, K.; Okimura, Y.; Kaji, H.; Kitazawa, S.; et al. Chemerin enhances insulin signaling and potentiates insulin-stimulated glucose uptake in 3T3-L1 adipocytes. FEBS Lett. 2008, 582, 573–578. [Google Scholar] [CrossRef] [PubMed] [Green Version]
  54. Helfer, G.; Wu, Q.-F. Chemerin: A multifaceted adipokine involved in metabolic disorders. J. Endocrinol. 2018, 238, R79–R94. [Google Scholar] [CrossRef] [PubMed]
  55. Skytt, A.; Stromqvist, M.; Egelrud, T. Primary Substrate Specificity of Recombinant Human Stratum Corneum Chymotryptic Enzyme. Biochem. Biophys. Res. Commun. 1995, 211, 586–589. [Google Scholar] [CrossRef] [PubMed]
  56. Oliveira, J.P.C.; Freitas, R.F.; De Melo, L.S.; Barros, T.G.; Santos, J.A.N.; Juliano, M.A.; Pinheiro, S.; Blaber, M.; Juliano, L.; Muri, E.M.F.; et al. Isomannide-Based Peptidomimetics as Inhibitors for Human Tissue Kallikreins 5 and 7. ACS Med. Chem. Lett. 2013, 5, 128–132. [Google Scholar] [CrossRef] [Green Version]
  57. Arama, D.P.; Soualmia, F.; Lisowski, V.; Longevial, J.-F.; Bosc, E.; Maillard, L.T.; Martinez, J.; Masurier, N.; El Amri, C. Pyrido-imidazodiazepinones as a new class of reversible inhibitors of human kallikrein 7. Eur. J. Med. Chem. 2015, 93, 202–213. [Google Scholar] [CrossRef] [Green Version]
  58. Tan, X.; Soualmia, F.; Furio, L.; Renard, J.-F.; Kempen, I.; Qin, L.; Pagano, M.; Pirotte, B.; El Amri, C.; Hovnanian, A.; et al. Toward the First Class of Suicide Inhibitors of Kallikreins Involved in Skin Diseases. J. Med. Chem. 2014, 58, 598–612. [Google Scholar] [CrossRef]
  59. Jendrny, C.; Beck-Sickinger, A.G. Inhibition of Kallikrein-Related Peptidases 7 and 5 by Grafting Serpin Reactive-Center Loop Sequences onto Sunflower Trypsin Inhibitor-1 (SFTI-1). ChemBioChem 2016, 17, 719–726. [Google Scholar] [CrossRef]
  60. De Veer, S.J.; Furio, L.; Swedberg, J.E.; Munro, C.A.; Brattsand, M.; Clements, J.A.; Hovnanian, A.; Harris, J.M. Selective Substrates and Inhibitors for Kallikrein-Related Peptidase 7 (KLK7) Shed Light on KLK Proteolytic Activity in the Stratum Corneum. J. Investig. Dermatol. 2017, 137, 430–439. [Google Scholar] [CrossRef] [Green Version]
  61. Murafuji, H.; Sakai, H.; Goto, M.; Imajo, S.; Sugawara, H.; Muto, T. Discovery and structure–activity relationship study of 1,3,6-trisubstituted 1,4-diazepane-7-ones as novel human kallikrein 7 inhibitors. Bioorganic Med. Chem. Lett. 2017, 27, 5272–5276. [Google Scholar] [CrossRef]
  62. De Souza, A.S.; Pacheco, B.D.C.; Pinheiro, S.; Muri, E.M.F.; Dias, L.R.S.; Lima, C.H.S.; Garrett, R.; de Moraes, M.B.M.; de Souza, B.E.G.; Puzer, L. 3-Acyltetramic acids as a novel class of inhibitors for human kallikreins 5 and 7. Bioorg. Med. Chem. Lett. 2019, 29, 1094–1098. [Google Scholar] [CrossRef]
  63. Murafuji, H.; Muto, T.; Goto, M.; Imajo, S.; Sugawara, H.; Oyama, Y.; Minamitsuji, Y.; Miyazaki, S.; Murai, K.; Fujioka, H. Discovery and structure-activity relationship of imidazolinylindole derivatives as kallikrein 7 inhibitors. Bioorganic Med. Chem. Lett. 2019, 29, 334–338. [Google Scholar] [CrossRef]
  64. Chen, Q.-Y.; Luo, D.; Seabra, G.M.; Luesch, H. Ahp-Cyclodepsipeptides as tunable inhibitors of human neutrophil elastase and kallikrein 7: Total synthesis of tutuilamide A, serine protease selectivity profile and comparison with lyngbyastatin7. Bioorganic Med. Chem. 2020, 28, 115756. [Google Scholar] [CrossRef] [PubMed]
  65. Hanke, S.; Tindall, C.A.; Pippel, J.; Ulbricht, D.; Pirotte, B.; Ravaux, M.R.-; Heiker, J.T.; Sträter, N. Structural Studies on the Inhibitory Binding Mode of Aromatic Coumarinic Esters to Human Kallikrein-Related Peptidase 7. J. Med. Chem. 2020, 63, 5723–5733. [Google Scholar] [CrossRef] [PubMed]
  66. Laureano, A.F.S.; Zani, M.B.; Sant’Ana, A.M.; Tognato, R.C.; Lombello, C.B.; Nascimento, M.H.M.D.; Helmsing, S.; Fühner, V.; Hust, M.; Puzer, L. Generation of recombinant antibodies against human tissue kallikrein 7 to treat skin diseases. Bioorganic Med. Chem. Lett. 2020, 30, 127626. [Google Scholar] [CrossRef] [PubMed]
Figure 1. Body weight development and body composition of Klk7−/− deficient mice under chow and high fat diet. (A,B) Body weight gain under chow and HFD for Klk7−/− (n = 8/5 chow/HFD) and control mice (n = 8/9 chow/HFD). Weight gain is significantly reduced for Klk7−/− mice under both diets. (C,D) MRI scans reveal a significant reduction in total fat mass (presented as % of body weight) for Klk7−/− mice beginning at an age of 10 weeks and independent of the diet. (E,F) Determination of relative organ weights show that Klk7−/− mice under chow diet exhibit decreased eWAT fat mass compared to chow-fed control mice, while HFD-fed Klk7−/− mice have both reduced eWAT and iWAT fat mass compared to obese controls. Data are presented as means ± SEM; significance was tested by two-way ANOVA with correction for multiple testing (Sidak; A,B) or multiple t-tests with correction for multiple testing (Holm–Sidak; CF); * p < 0.05; ** p < 0.01; *** p < 0.001.
Biomedicines 09 00131 g001
Figure 2. Indirect calorimetry of Klk7−/− mice under chow and high fat diet. (A,D) Oxygen consumption (VO2 in mL/kg/h, means during light and dark phase), (B,E) energy expenditure (EE in kcal/kg/h; left panel: time course over 48 h; right panel: means during light and dark phase) and (C,F) respiratory exchange ratio (RER, as means during light and dark phase) were recorded for a period of 60 h in control and Klk7−/− mice fed chow diet (AC) or HFD (DF). (G) Food intake (g/g body weight) during light and dark phase over a period of 60 h in mice fed a chow diet. (H) Food intake (g/g body weight) per day over a period of 60 h in HFD-fed mice. Data are presented as means ± SEM; significance was tested by two-way ANOVA and Fisher’s LSD test (B,E) or multiple t-tests without correction for multiple testing (summarized data in AF) or Student’s t-test (GH).* p < 0.05.
Biomedicines 09 00131 g002
Figure 3. WAT and BAT histology, adipocyte hypertrophy and browning in HFD-fed Klk7−/− mice. Histological analyses (Hematoxylin and Eosin staining) of epigonadal WAT (A) and inguinal WAT (C) show highly reduced adipocyte hypertrophy in Klk7−/− mice with smaller adipocyte diameter (shown for eWAT in (B)) and adipocyte area (shown for iWAT in (D)). (E) Expression of thermogenic genes in iWAT of HFD-fed Klk7−/− mice is not changed. (F) BAT whitening after HFD feeding in less pronounced in Klk7−/− mice and genes related to BAT activity (G) such as Dio2 and Prdm16 are higher expressed in Klk7−/− mice compared to controls. (H,I) Expression of genes related to thermogenesis and WAT-browning in iWAT and BAT of chow-fed mice shows increased expression of Elovl3 in both AT depots and highly induced Ucp1 expression in iWAT of Klk7−/− mice. (J) Western blot analysis of mitochondrial proteins and UCP1 in differentiated primary brown adipocytes from Klk7−/− mice. Data are presented as means ± SEM; significance was tested by t-tests (D) or multiple t-tests with correction for multiple testing; * p < 0.05, ** p < 0.01, *** p < 0.001.
Biomedicines 09 00131 g003
Figure 4. Body temperature, thyroid hormone levels and thyroid gland characterization of chow-fed Klk7−/− mice. (A) Core body temperature was significantly lower in Klk7−/− mice (n = 10/8, controls and Klk7−/−). (BD) Circulating total serum thyroid-stimulating hormone (TSH), thyroxine (TT4) and free triiodothyronine (fT3) levels were measured. fT3 levels were reduced in Klk7−/− mice (n = 8/6). (E) Expression of thyroid responsive genes Dio1, Pdk4 and Tbg in liver of Klk7−/− and control mice (n = 7/8). Expression of Pdk4 is lower and Tgb is significantly reduced. (F) Representative immunoblot analysis of cathepsin L expression (pro- (pro), single-chain (SC), heavy chain (HC)) and high molecular weight (HMW)) as well as tubulin (TUB) in thyroid tissue of control and Klk7−/− mice. Densitometric quantification is presented on the right and revealed no significant changes. (G) Thyroid proteins were separated by reducing and non-reducing SDS-PAGE and analyzed after silver-staining, revealing similar banding patterns for both genotypes. Western blot analysis of thyroglobulin expression in thyroid tissue of control and Klk7−/− mice did not show differences, as did (H) immunostaining of thyroglobulin in tissue sections. (I) Immunostaining of collagen IV and staining of cytoplasm with CellMask™ Orange (CMO) and nuclei using Draq5™ of thyroid tissue from control and Klk7−/− mice (left panels). Follicle size and distribution is similar, with larger follicles in the periphery (middle panels) and smaller follicles in the thyroid lobes’ center (right panels). Follicle area, lumen area, epithelial extensions, and cell counts per follicle area (right panels, respectively) appear comparable, again supporting unaltered thyroglobulin synthesis, deposition and solubilization in Klk7−/− mice. Data are presented as means ± SEM; significance was tested by Student’s t-test (AD), two-way ANOVA with correction for multiple testing (Tukey; (E)); * p < 0.05, ** p < 0.01.
Biomedicines 09 00131 g004
Figure 5. Glucose metabolism/homeostasis and insulin sensitivity in Klk7−/− mice are contrastingly affected under chow and high fat diet. (A) Fasted and fed blood glucose levels of chow-fed Klk7−/− mice were significantly higher than in controls (n = 8/8, controls and Klk7−/−). (B) Glucose tolerance tests (GTT) and are under the curve (a.u.c., presented in insert) in fasted chow-fed mice reveal impaired glucose tolerance for Klk7−/− mice (n = 8/8). (C) Insulin tolerance tests (ITT) in fed mice show significantly higher sensitivity to exogenous insulin for Klk7−/− mice compared to controls (n = 8/8). (D) Fasted and fed blood glucose levels of obese Klk7−/− and control mice are not different (n = 9/5). (E) GTT and a.u.c. (insert) in fasted obese mice are not affected by the genotype (n = 9/5). (F) ITT in fed obese animals indicate retained insulin sensitivity in obesity for Klk7−/− mice (n = 9/5). Data are presented as means ± SEM; significance was tested by one-way ANOVA with correction for multiple testing (Tukey; (A,D)), Student’s t-test ((B,E), a.u.c data), or by two-way ANOVA and Fisher’s LSD test (B,C,E,F); * p < 0.05, *** p < 0.001.
Biomedicines 09 00131 g005
Figure 6. Whole body and tissue insulin sensitivity in chow-fed Klk7−/− mice. (A) Leptin to adiponectin ratios for chow and HFD fed mice as proxy for adipose tissue function indicate improved metabolic state/health in lean and obese Klk7−/− mice compared to controls (chow n = 8/8, HFD n = 8/5, controls and Klk7−/−). (B) Glucose infusion rate (GIR in mg/kg/min) during clamp was not different in chow-fed KLK7−/− mice compared to controls mice (n = 6/3). (C) Hepatic glucose production (HGP) during clamp (as % from basal HGP) is not affected by the genotype (n = 6/3). (D) Tissue glucose uptake (dpm/g/mL) is significantly higher in hearts of Klk7−/− mice compared to controls (n = 6/3). (E) Insulin-induced AKT phosphorylation analyzed by Western blot in differentiated primary adipocytes from eWAT (left) and iWAT (right) from three animals per genotype. Densitometric quantification of bands is presented next to the blots. Phosphorylation of AKT by insulin is significantly dampened in all primary adipocytes from Klk7−/− mice. Data are presented as means ± SEM; significance was tested by Student’s t-test (AC), uncorrected multiple t-tests (D) or two-way ANOVA with correction for multiple testing (Tukey; (E)); * p < 0.05, ** p < 0.01, *** p < 0.001.
Biomedicines 09 00131 g006
Figure 7. Analysis of proteome expression changes induced in iWAT of AT-specific Klk7−/− mice. (A,B) Volcano plots of differentially expressed proteins in iWAT of ATKlk7−/− mice under chow (A) and HFD (B) conditions. Protein expression data in the volcano plot are displayed as log2 fold change (FC) versus the log10 of the limma adjusted p-value. Proteins with significant differences in expression compared to controls are shown in green. Thresholds are shown as dashed lines. The top five differentially expressed genes (sorted by log-odds) are labelled with corresponding gene symbols. (C,D) Enriched GO terms related to biological processes in chow- (upper panel) and HFD-fed (lower panel) animals. Vertical bars represent the GO terms; the horizontal axis indicates −log10 (p-value). Significantly enriched GO terms are labelled in blue.
Biomedicines 09 00131 g007
Table 1. Anthropometric and metabolic parameters in male chow and HFD-fed Klk7−/− and control mice.
ChowHFD
Control
(n)
Klk7−/−
(n)
Control
(n)
Klk7−/−
(n)
Body weight (g)29.25 ± 0.62 (8)26.83 ± 0.73 (8) *39.97 ± 1.38 (9)34.24 ± 0.89 (5) *
Body length (cm)9.95 ± 0.73 (8)9.76 ± 0.11 (8)9.86 ± 0.09 (9)10.00 ± 0.10 (5)
Body temp. (°C) 35.81 ± 0.37 (10)34.09 ± 0.71 (8) *
Serum lipids
Triglycerides (mmol/L)1.10 ± 0.05 (8)1.27 ± 0.14 (3)1.48 ± 0.05 (9)1.34 ± 0.11 (5)
Cholesterol (mmol/L)2.32 ± 0.04 (8)2.33 ± 0.08 (3)4.60 ± 0.28 (9)4.14 ± 0.24 (5)
FFA (mmol/L)1.71 ± 0.10 (8)2.06 ± 0.23 (3)2.39 ± 0.05 (9)2.84 ± 0.20 (5) *
Glycerol (nmol/mL)670.21 ± 30.49 (8)722.59 ± 51.94 (7)889.81 ± 44.83 (7)848.92 ± 29.95 (2)
Adipokines
Adiponectin (µg/mL)47.68 ± 1.22 (8)54.77 ± 1.96 (7) **48.49 ± 1.02 (8)49.52 ± 1.39 (5)
Leptin (ng/mL)13.90 ± 2.69 (8)6.16 ± 2.41 (7) **178.59 ± 28.59 (8)49.45 ± 19.48 (5) *
Vaspin (pg/mL)65.18 ± 11.15 (7)58.65 ± 6.18 (8)122.17 ± 22.57 (4)136.91 ± 16.43 (4)
Chemerin (ng/mL)128.52 ± 6.58 (7)111.56 ± 4.89 (6)168.69 ± 15.21 (7)156.29 ± 14.45 (4)
MCP-1 (pg/mL)215.90 ± 43.91 (7)141.52 ± 19.81 (8) *147.35 ± 18.90 (6)108.55 ± 18.53 (4)
All results are expressed as means ± SEM. Numbers of animals is given in parentheses. Significantly different values are presented in bold, * p < 0.05, ** p < 0.01.
Publisher’s Note: MDPI stays neutral with regard to jurisdictional claims in published maps and institutional affiliations.