
Energy Metabolism and Intracellular pH Alteration in Neural Spheroids Carrying Down Syndrome

 , , , ,
Abstract
:1. Introduction
2. Materials and Methods
2.1. Cell Culture and Differentiation
2.2. Obtaining of Spheroids
2.3. Immunofluorescent Staining
2.4. RT-PCR
2.5. Analysis of Spheroids Metabolic Activity by Multiphoton Fluorescence Microscopy and FLIM
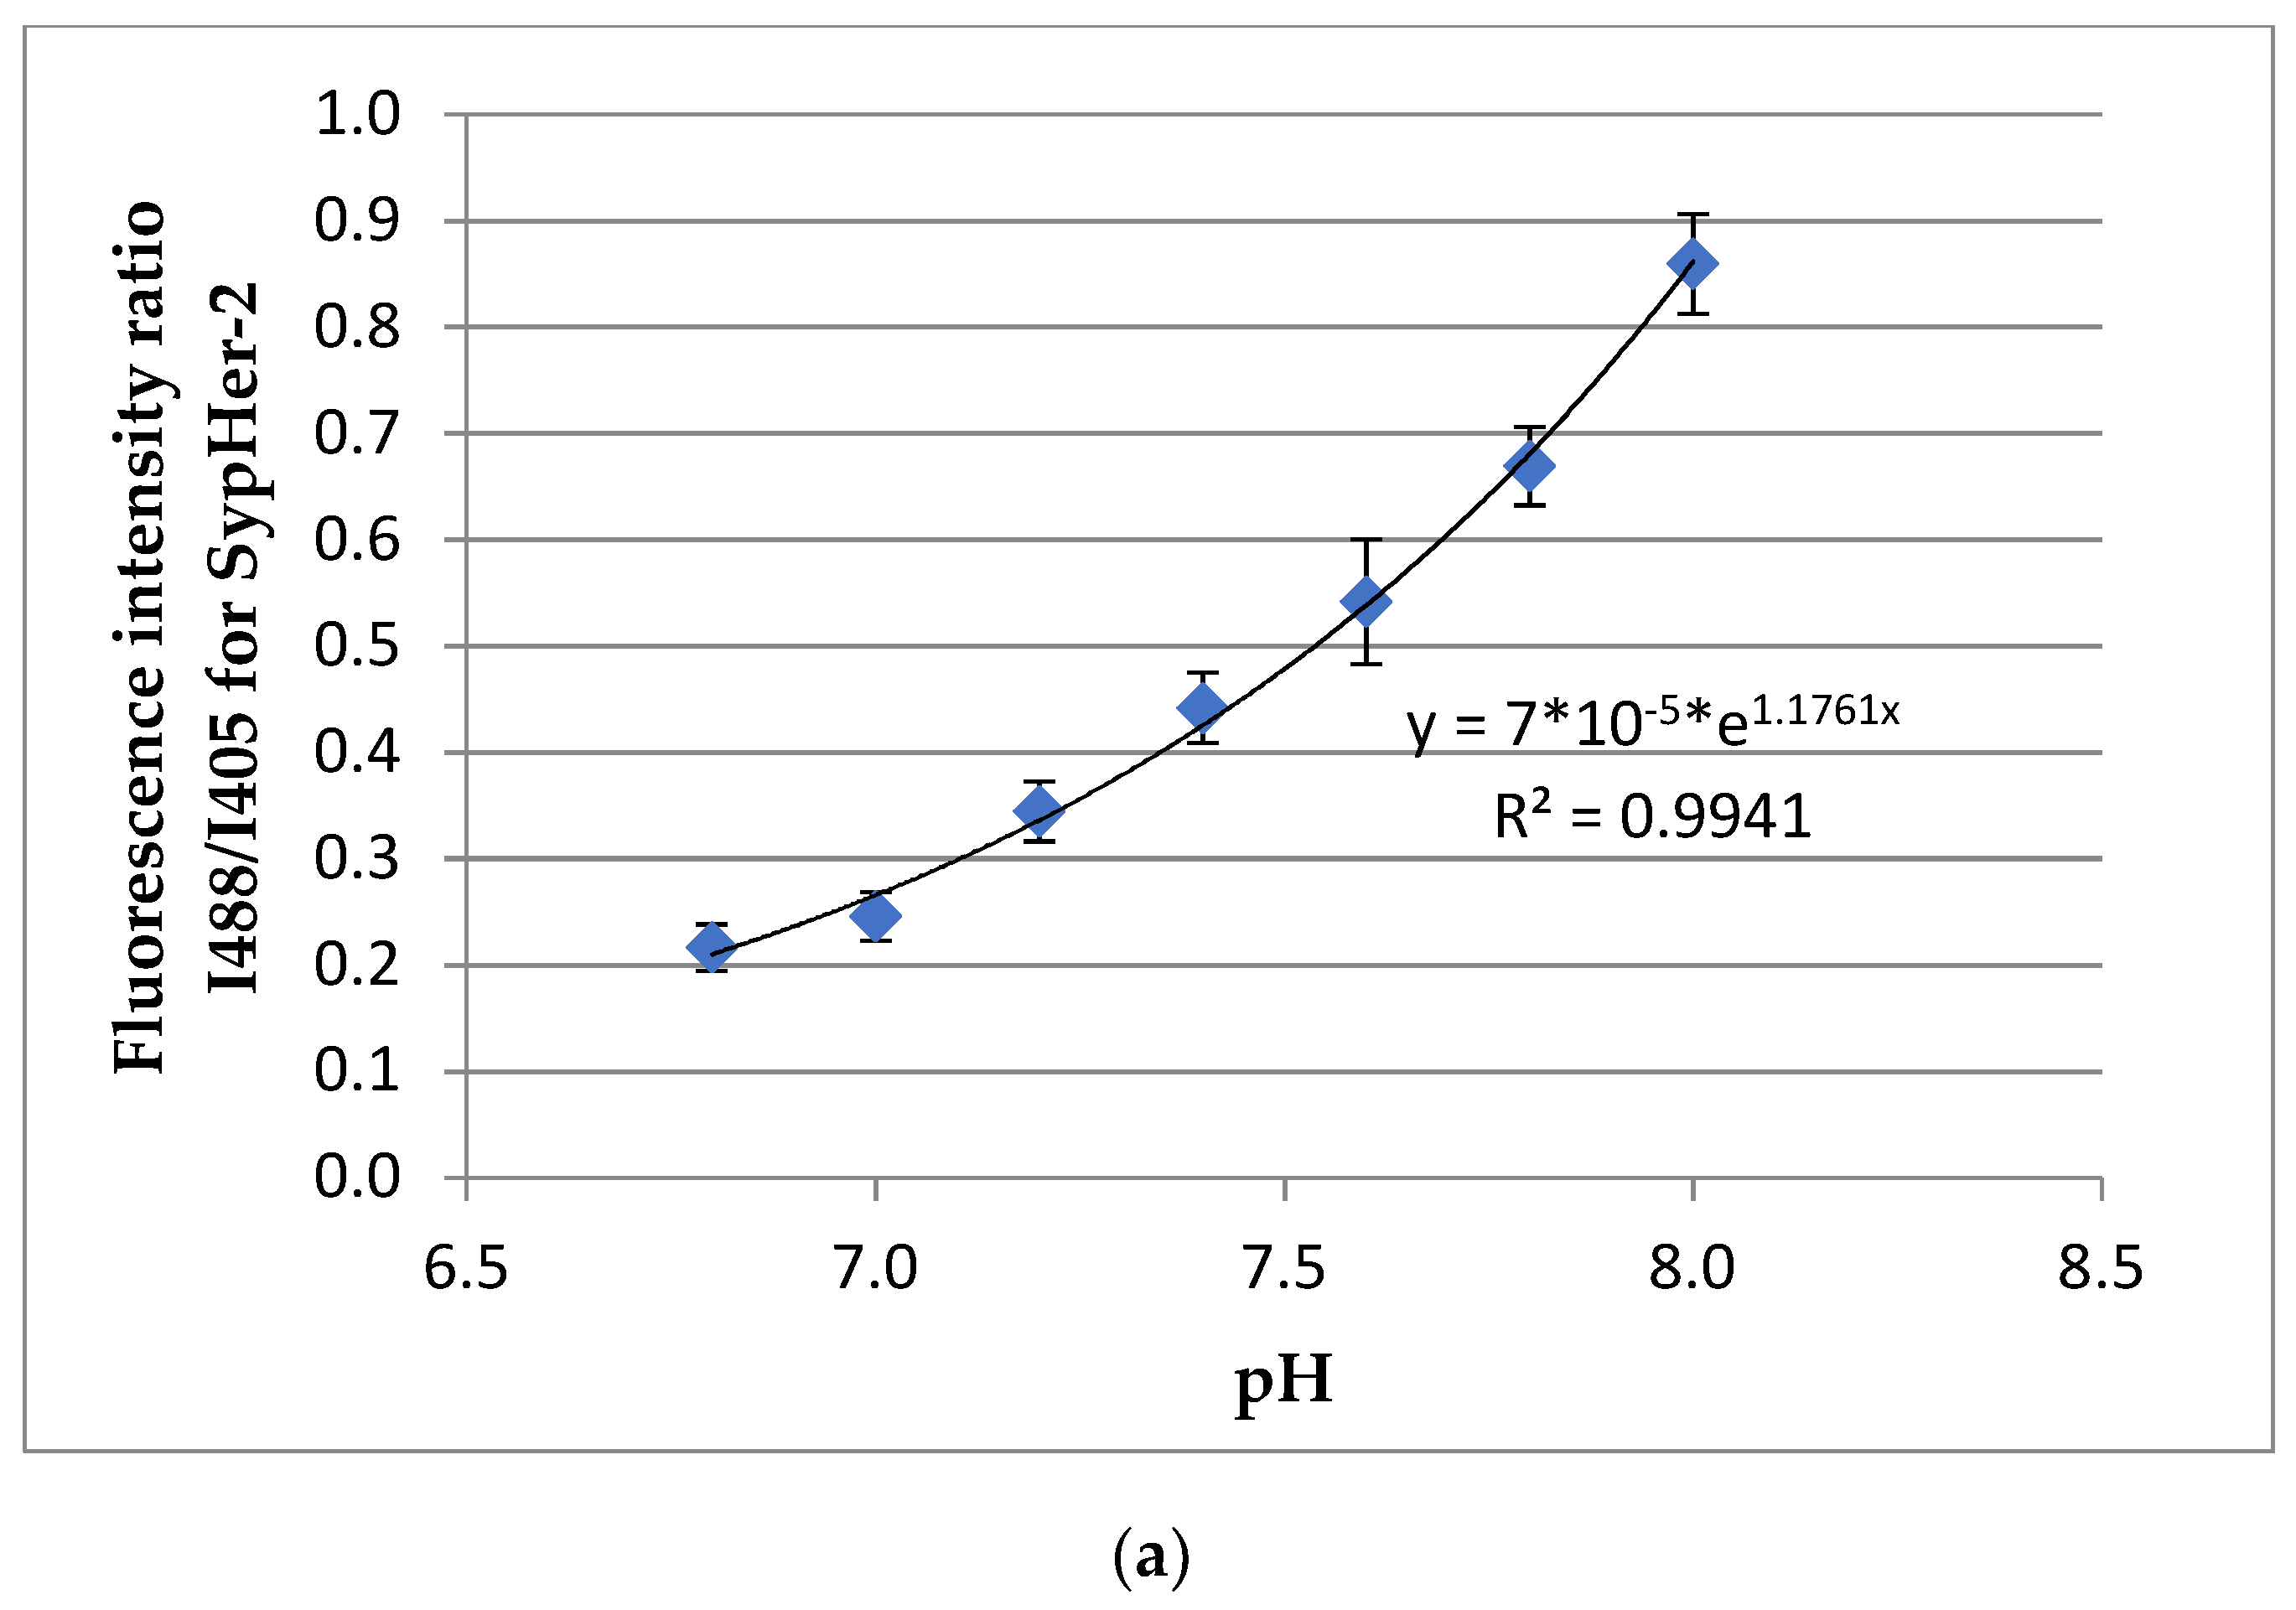
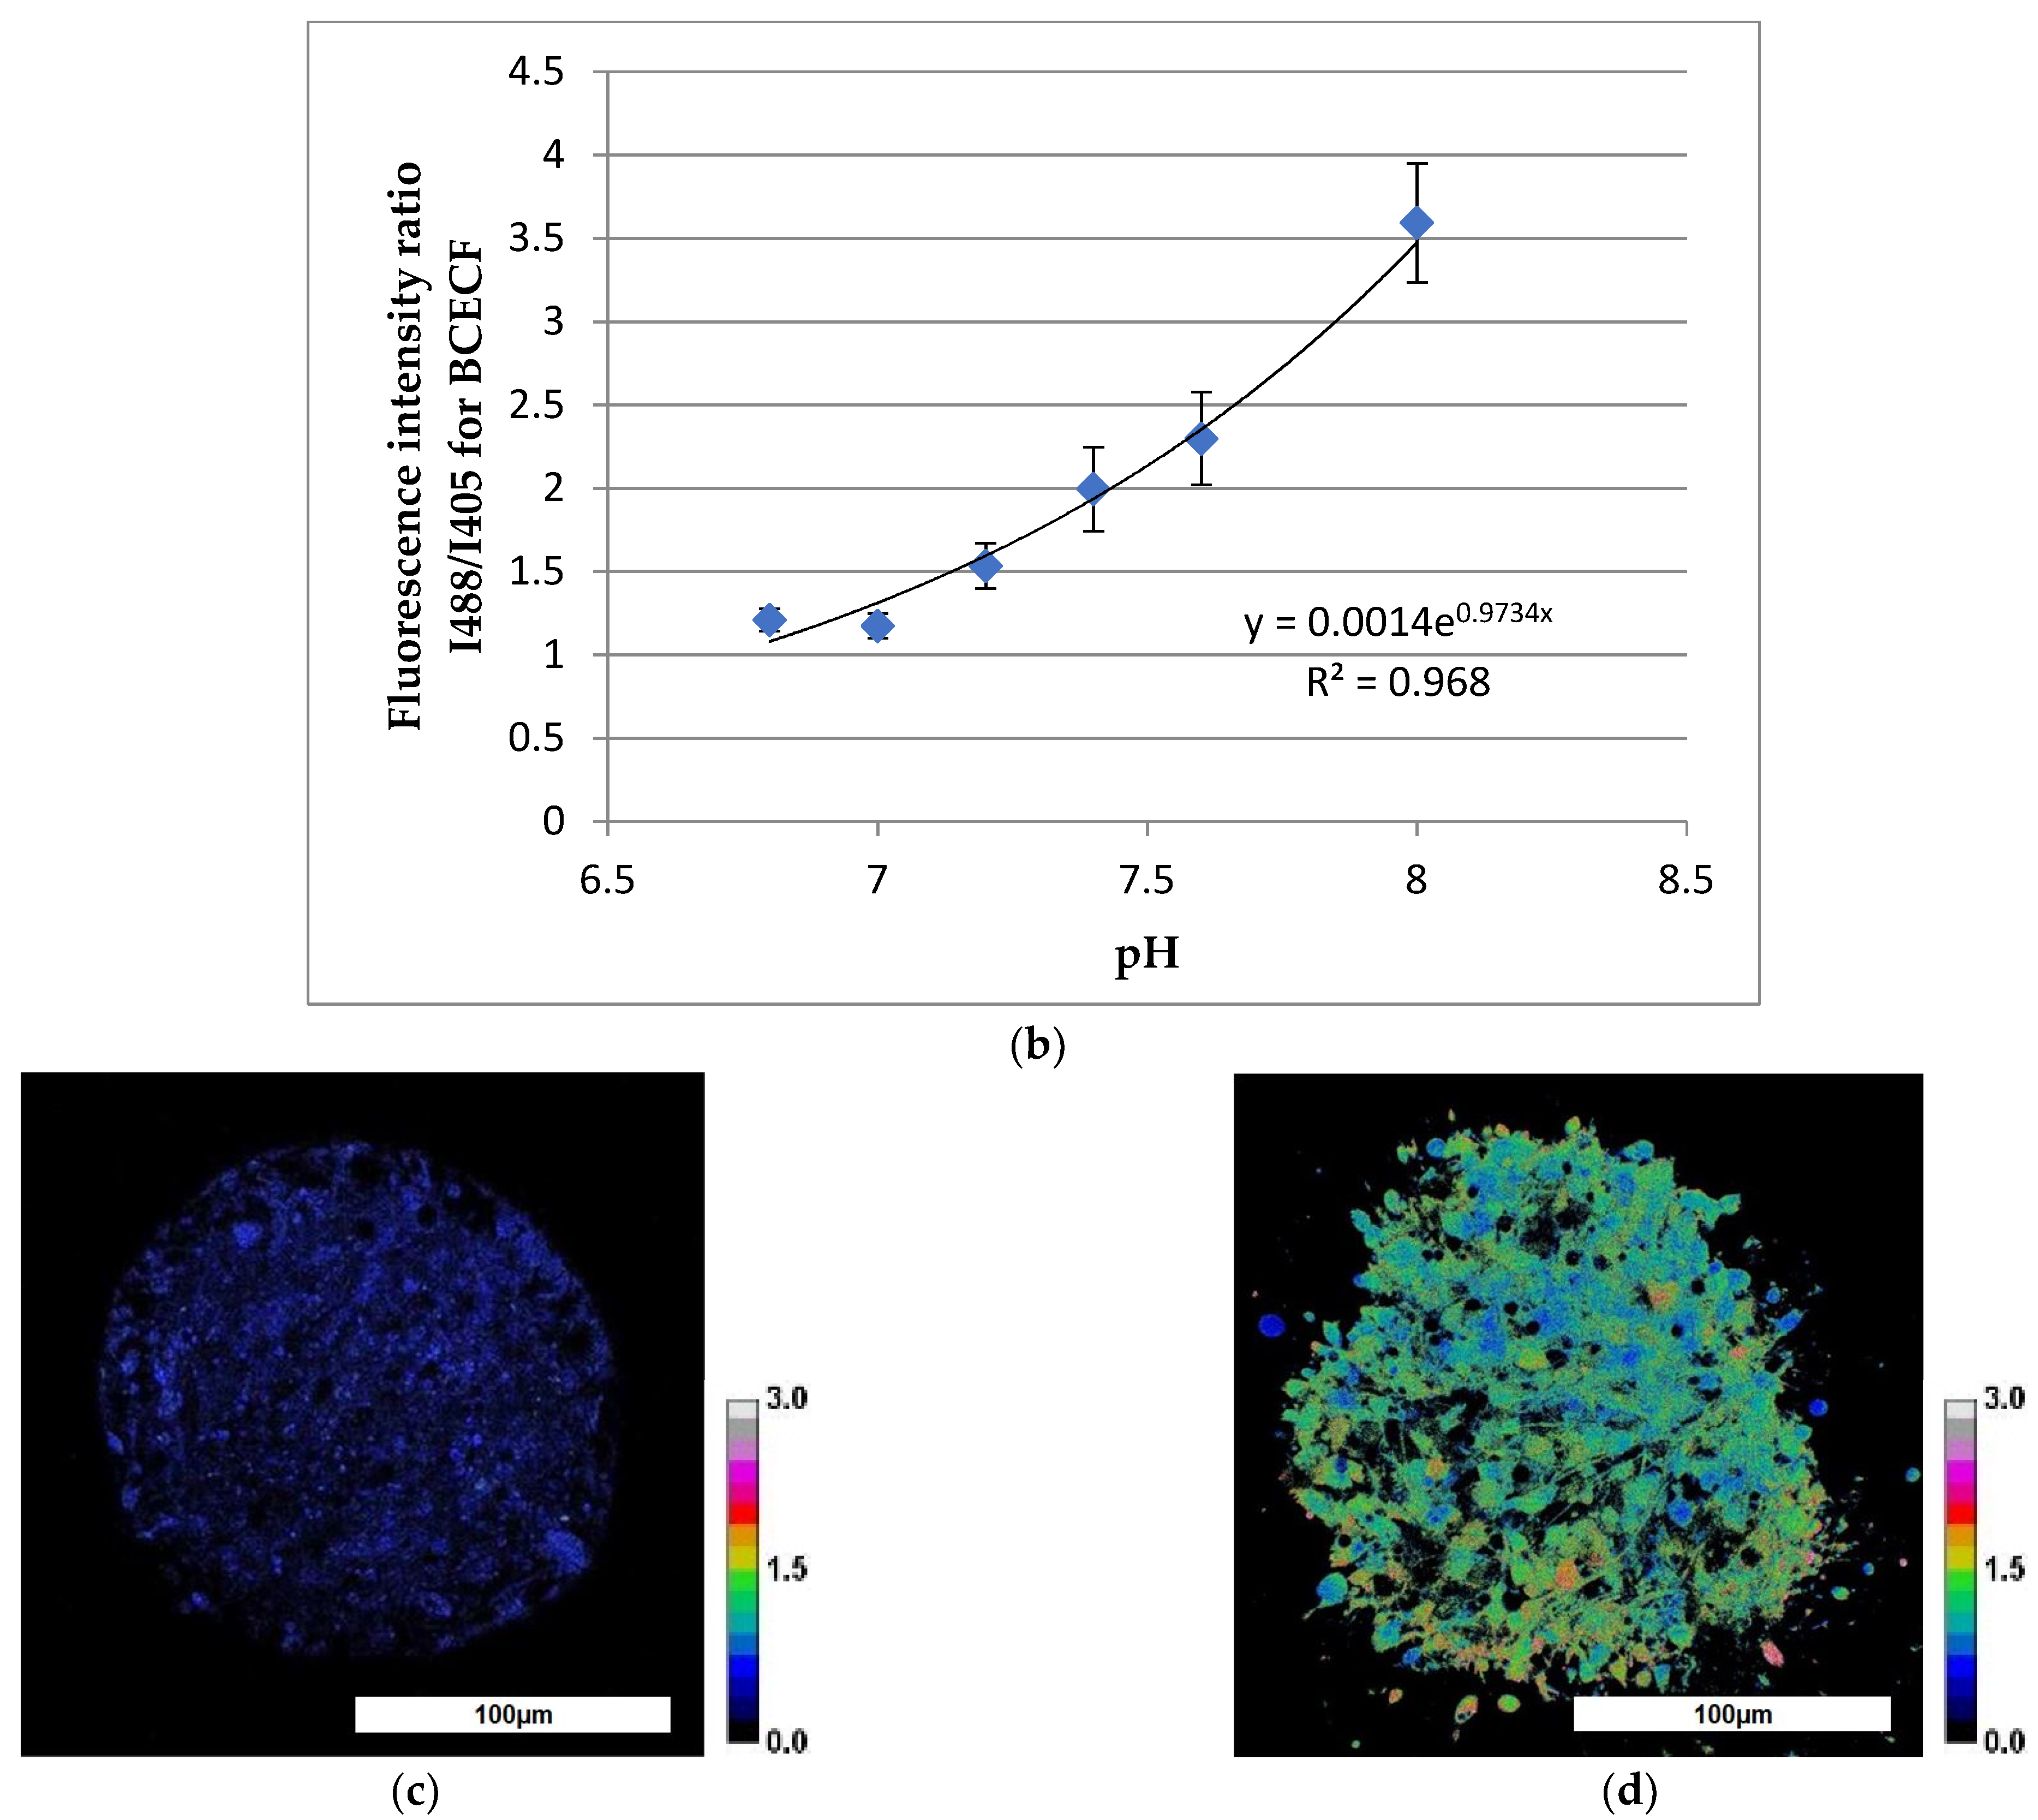
2.6. Analysis of Spheroids Intracellular pH Using Multiphoton Fluorescence Microscopy
2.7. Statistical Analysis
3. Results
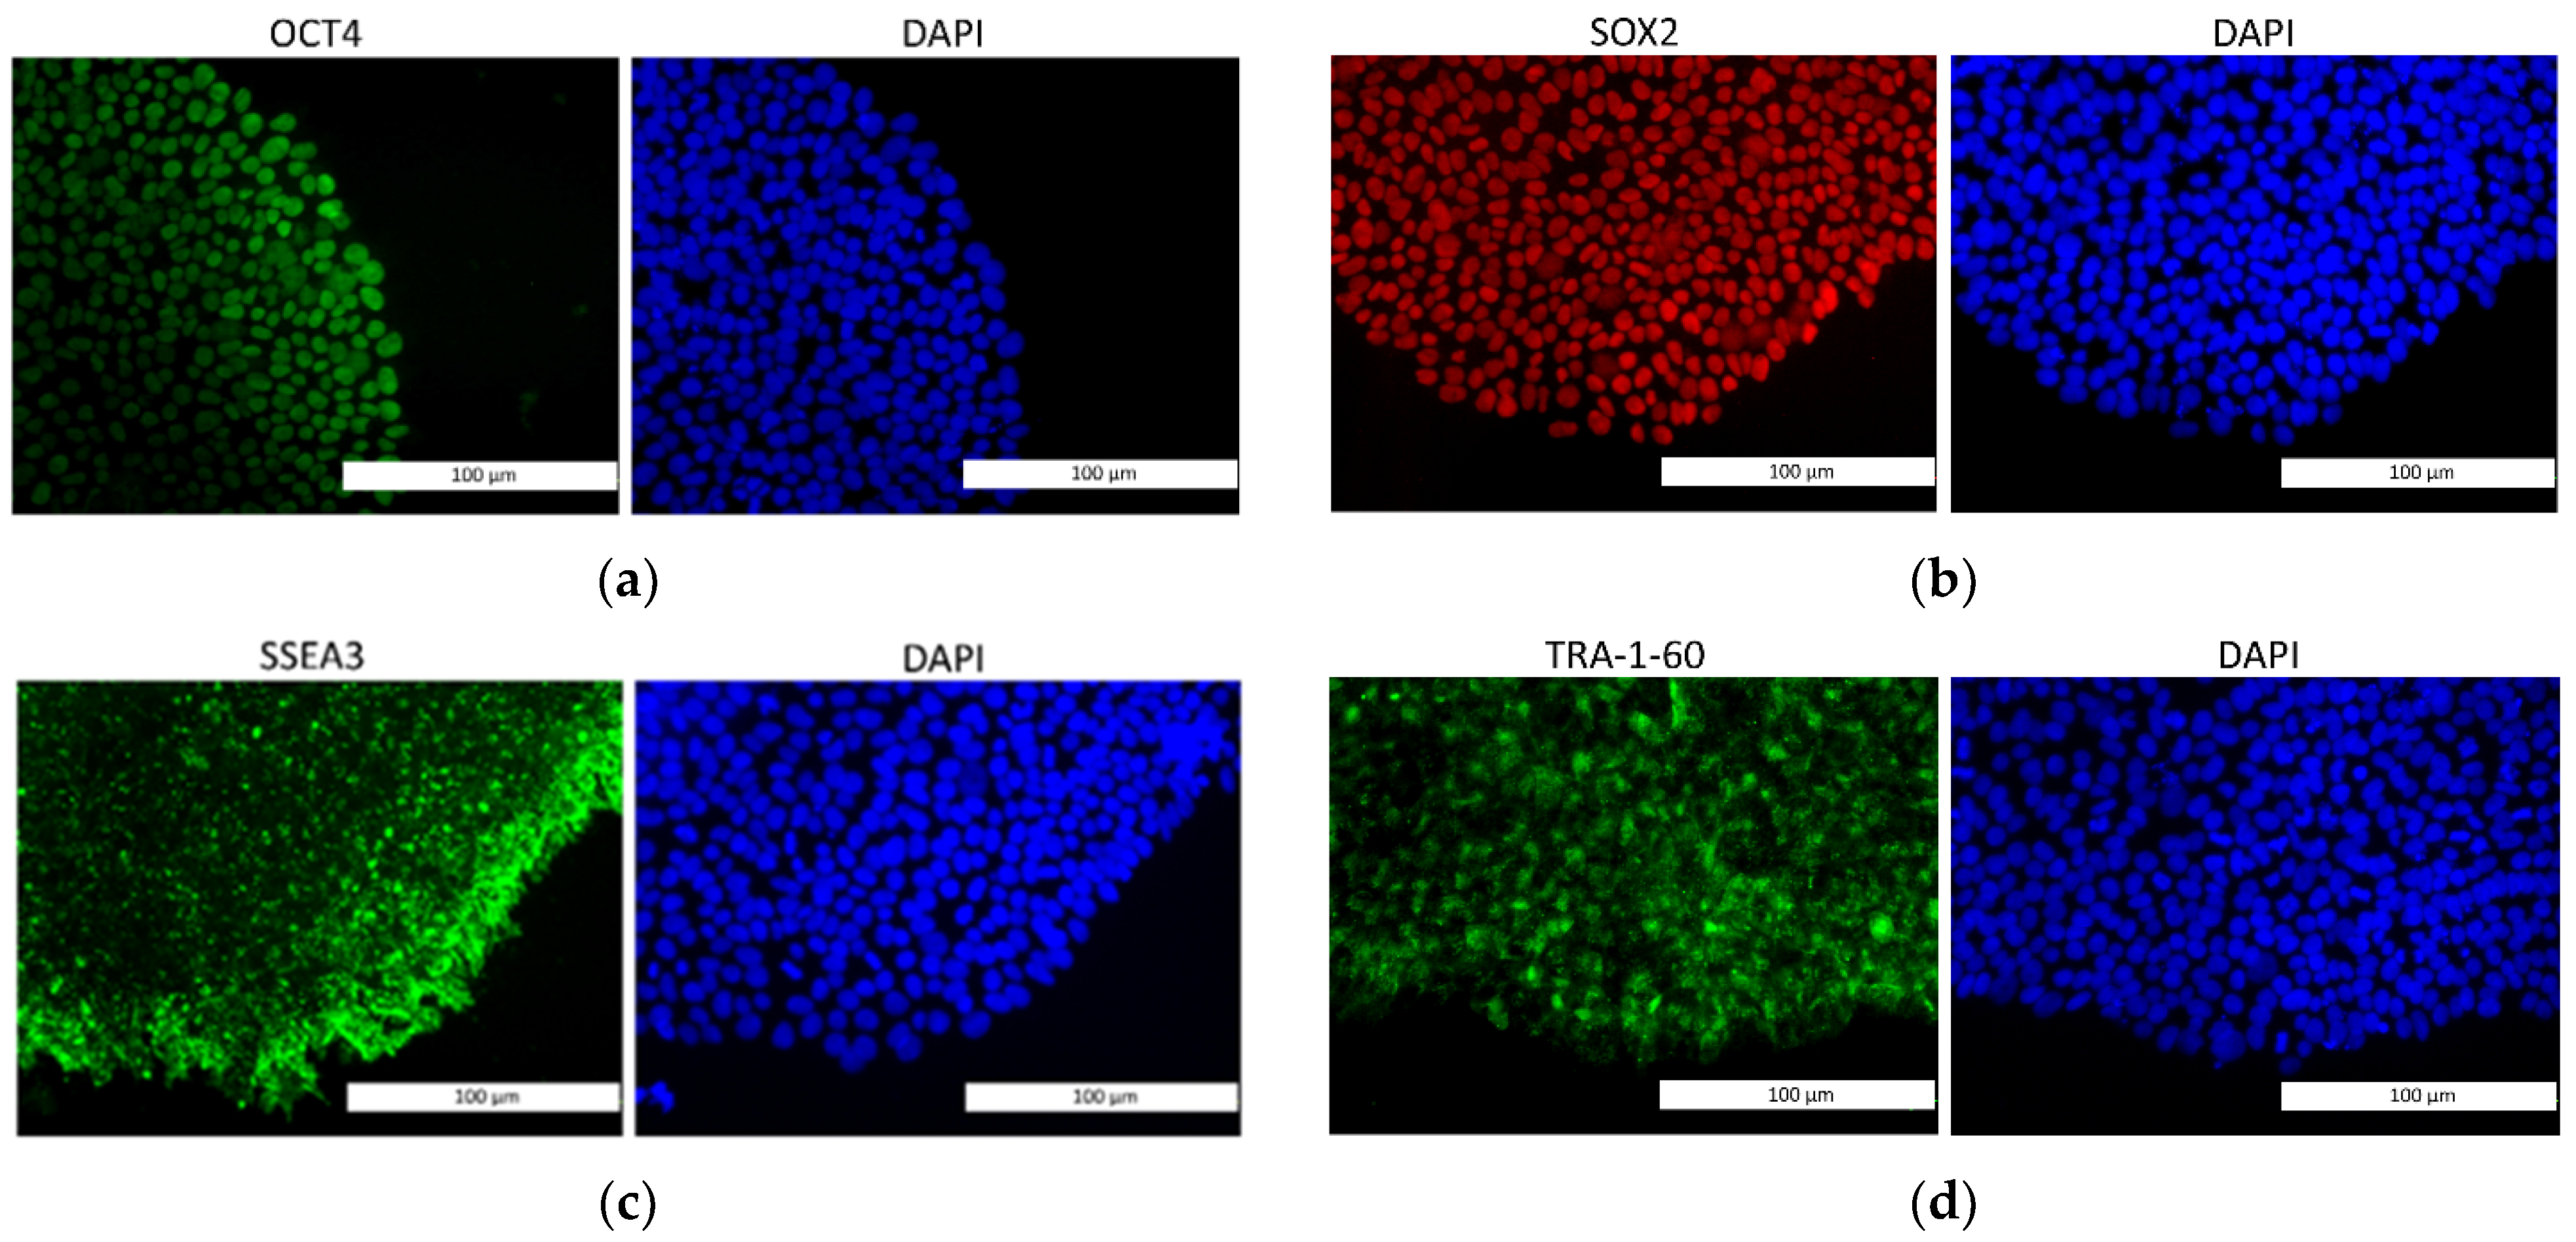
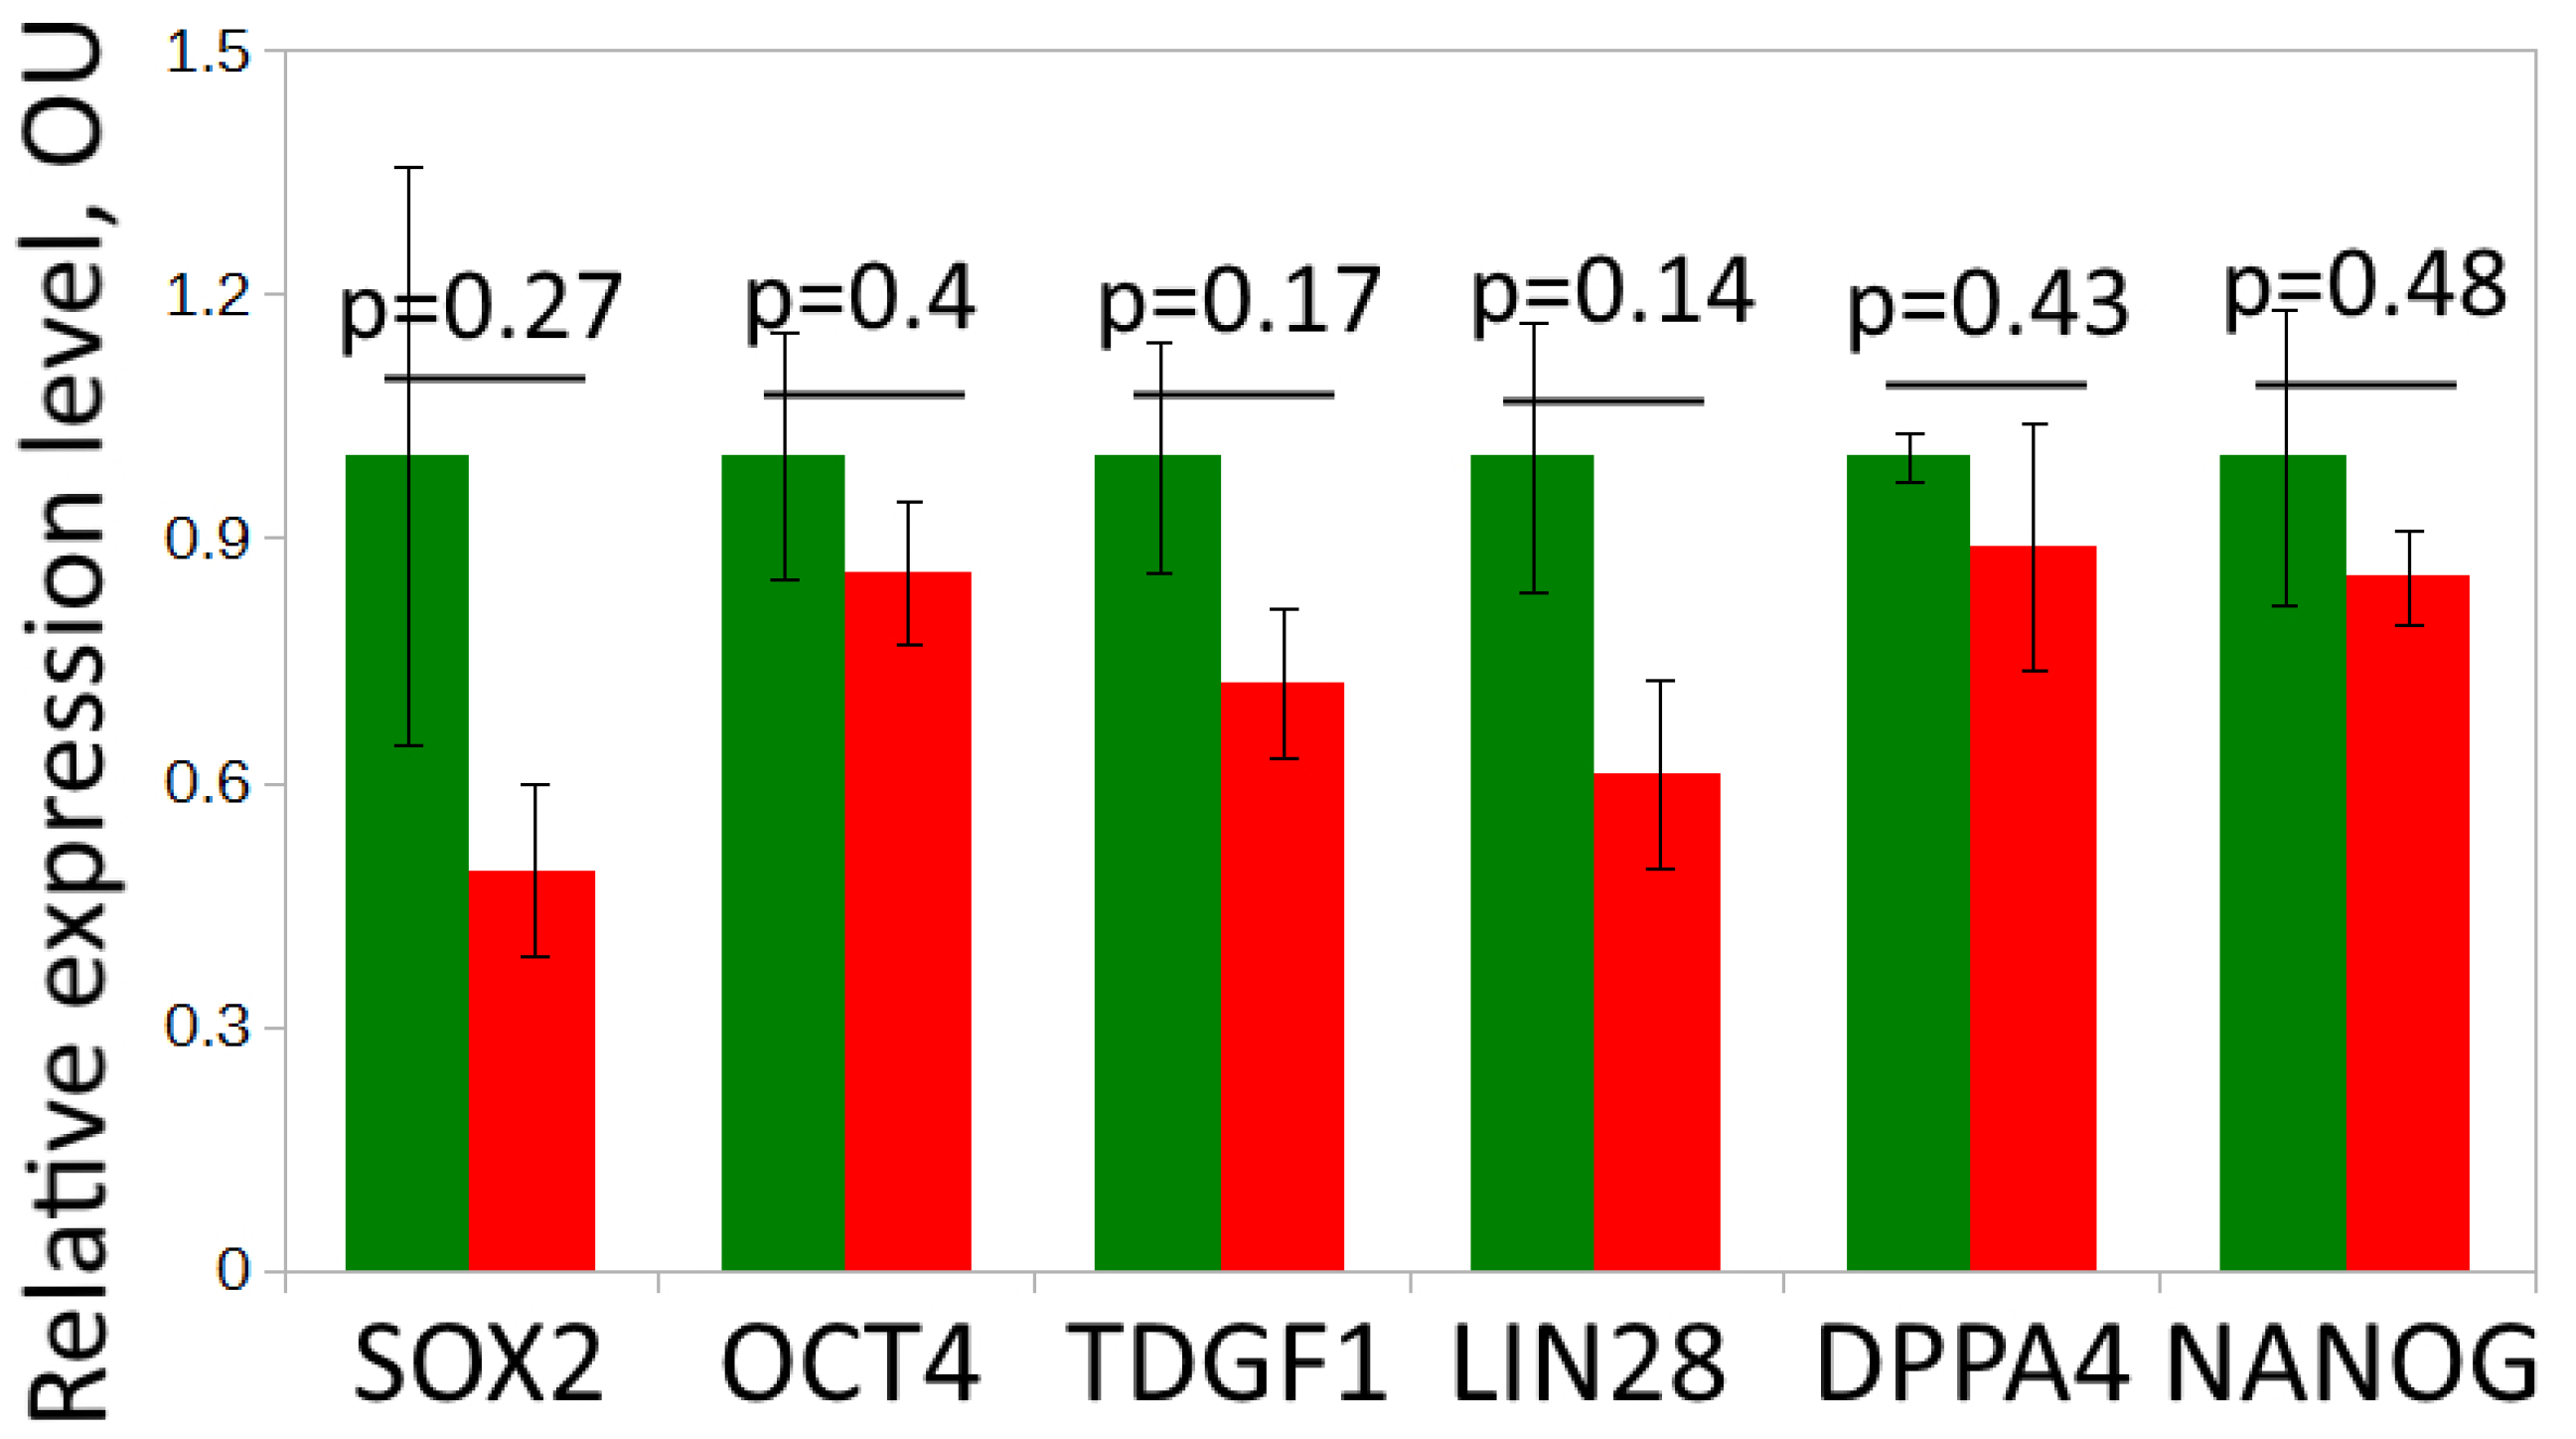
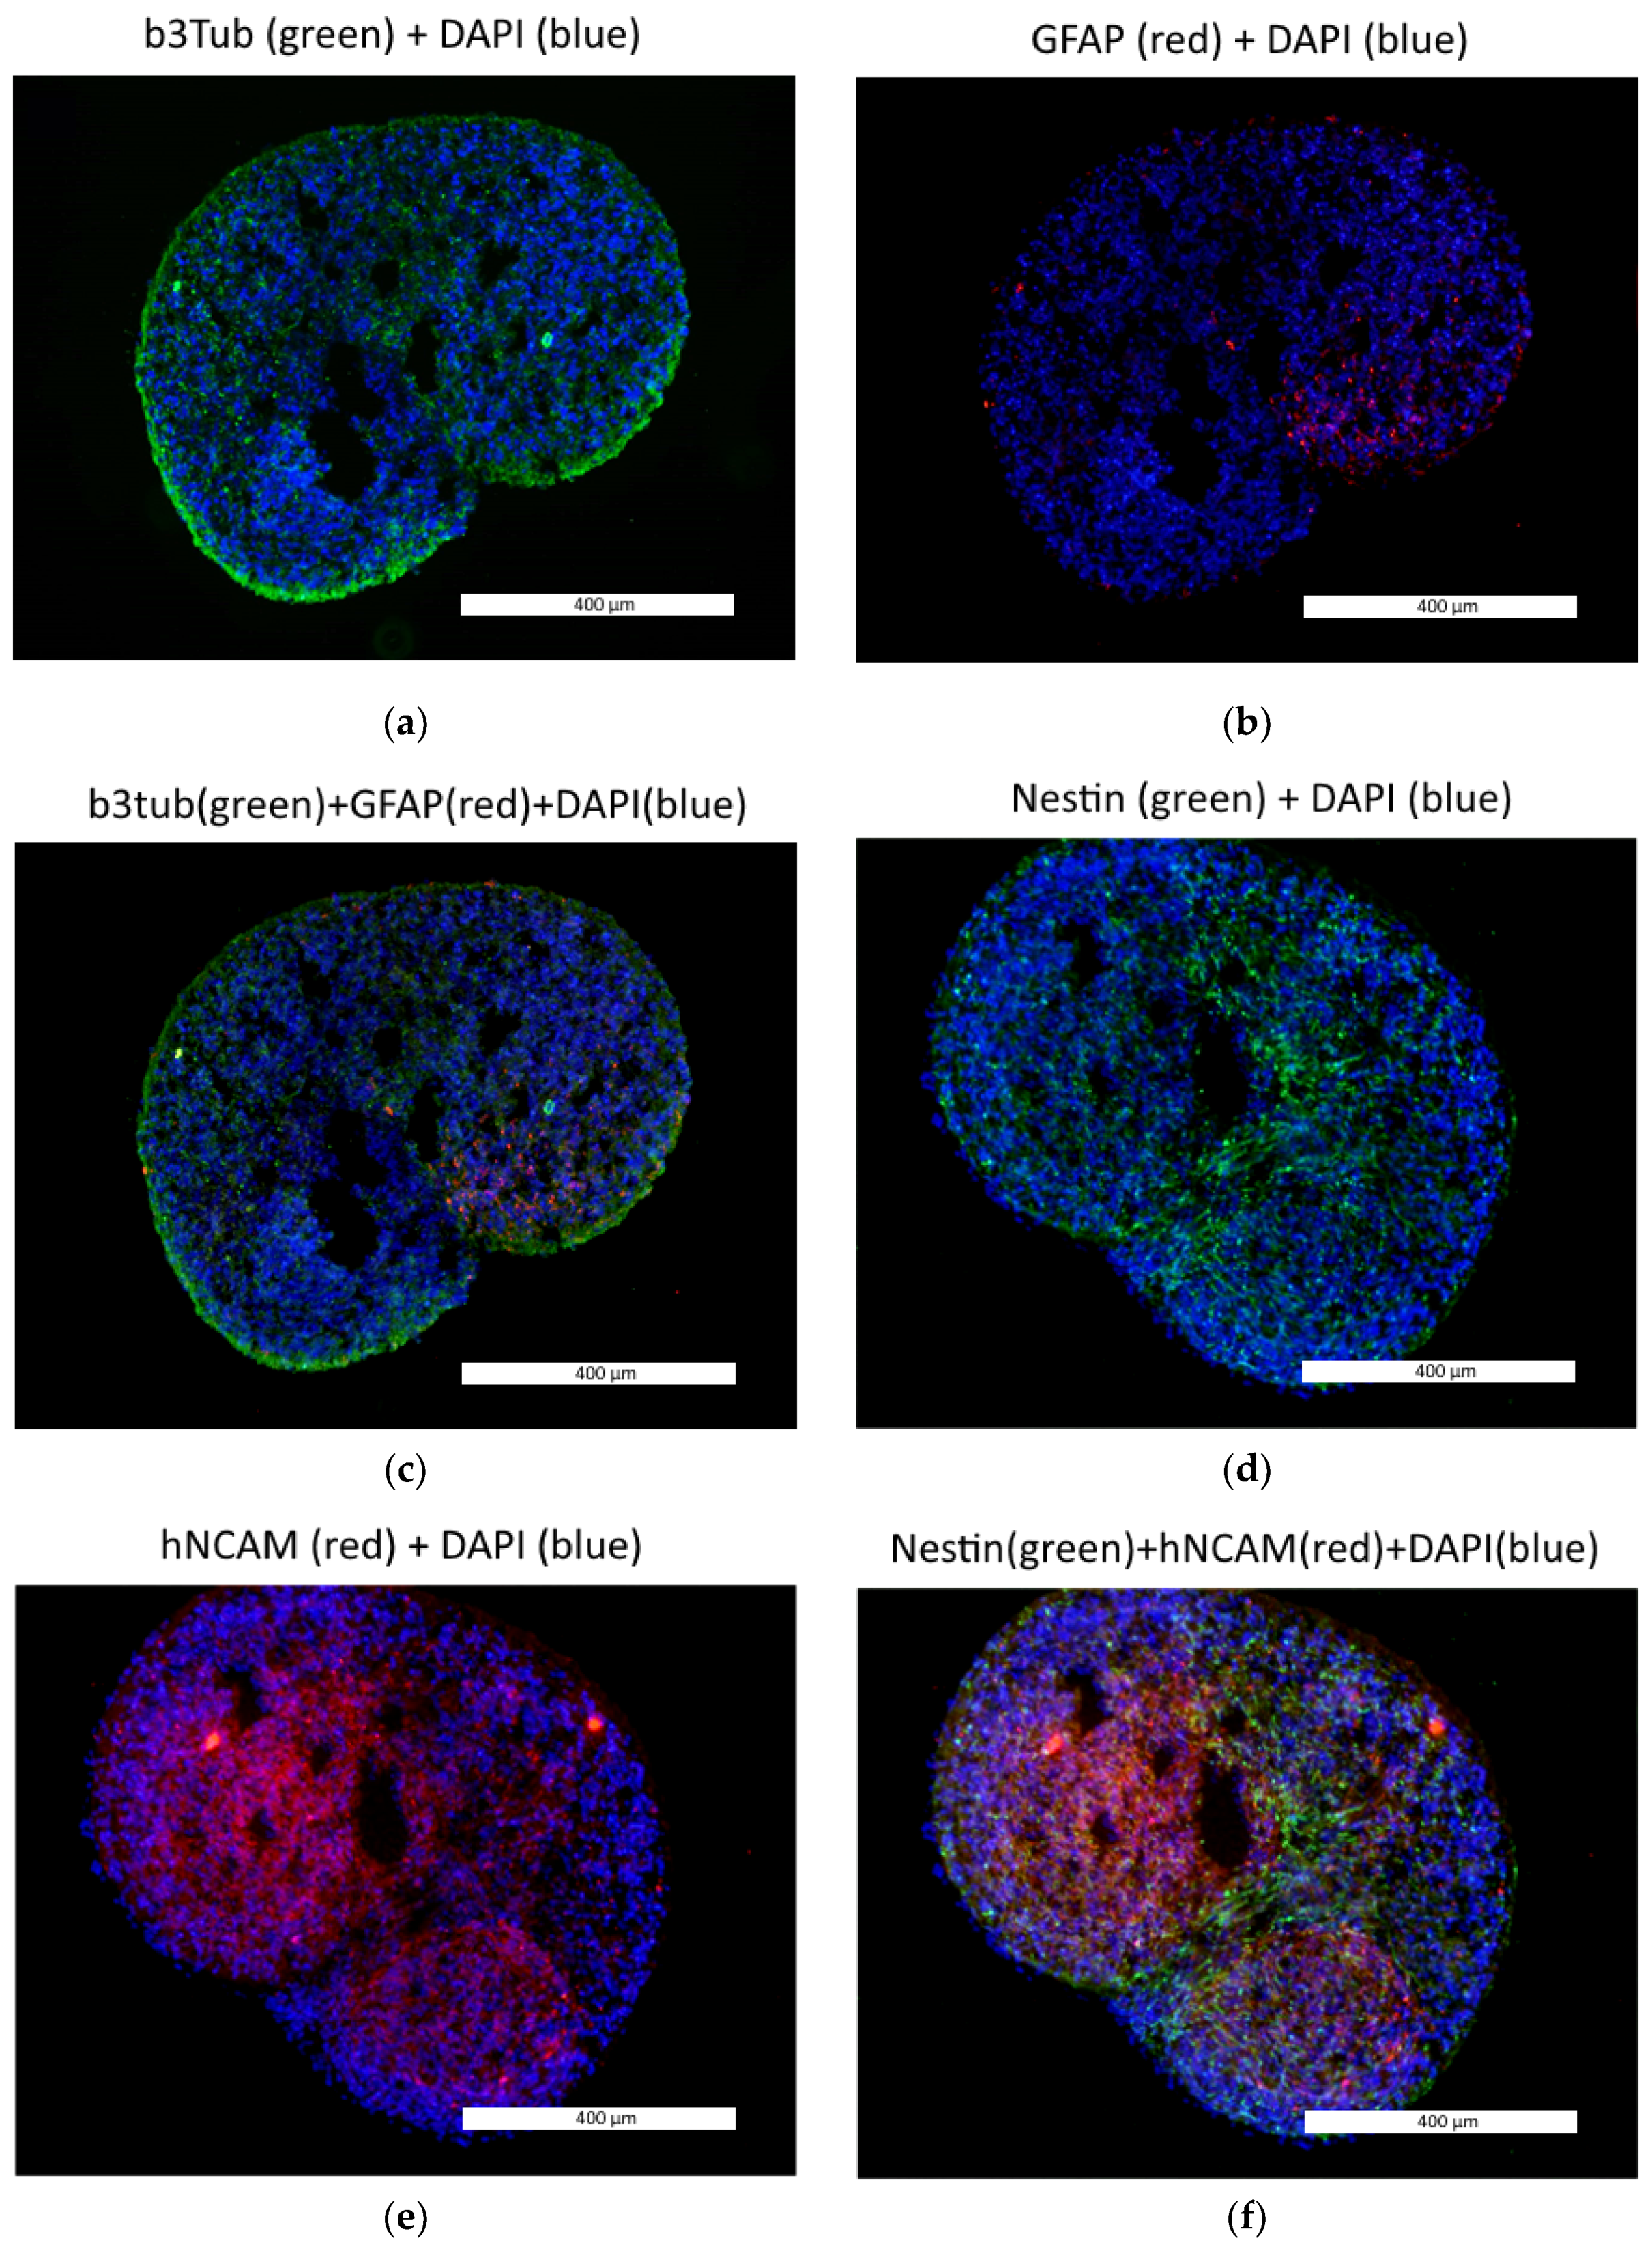
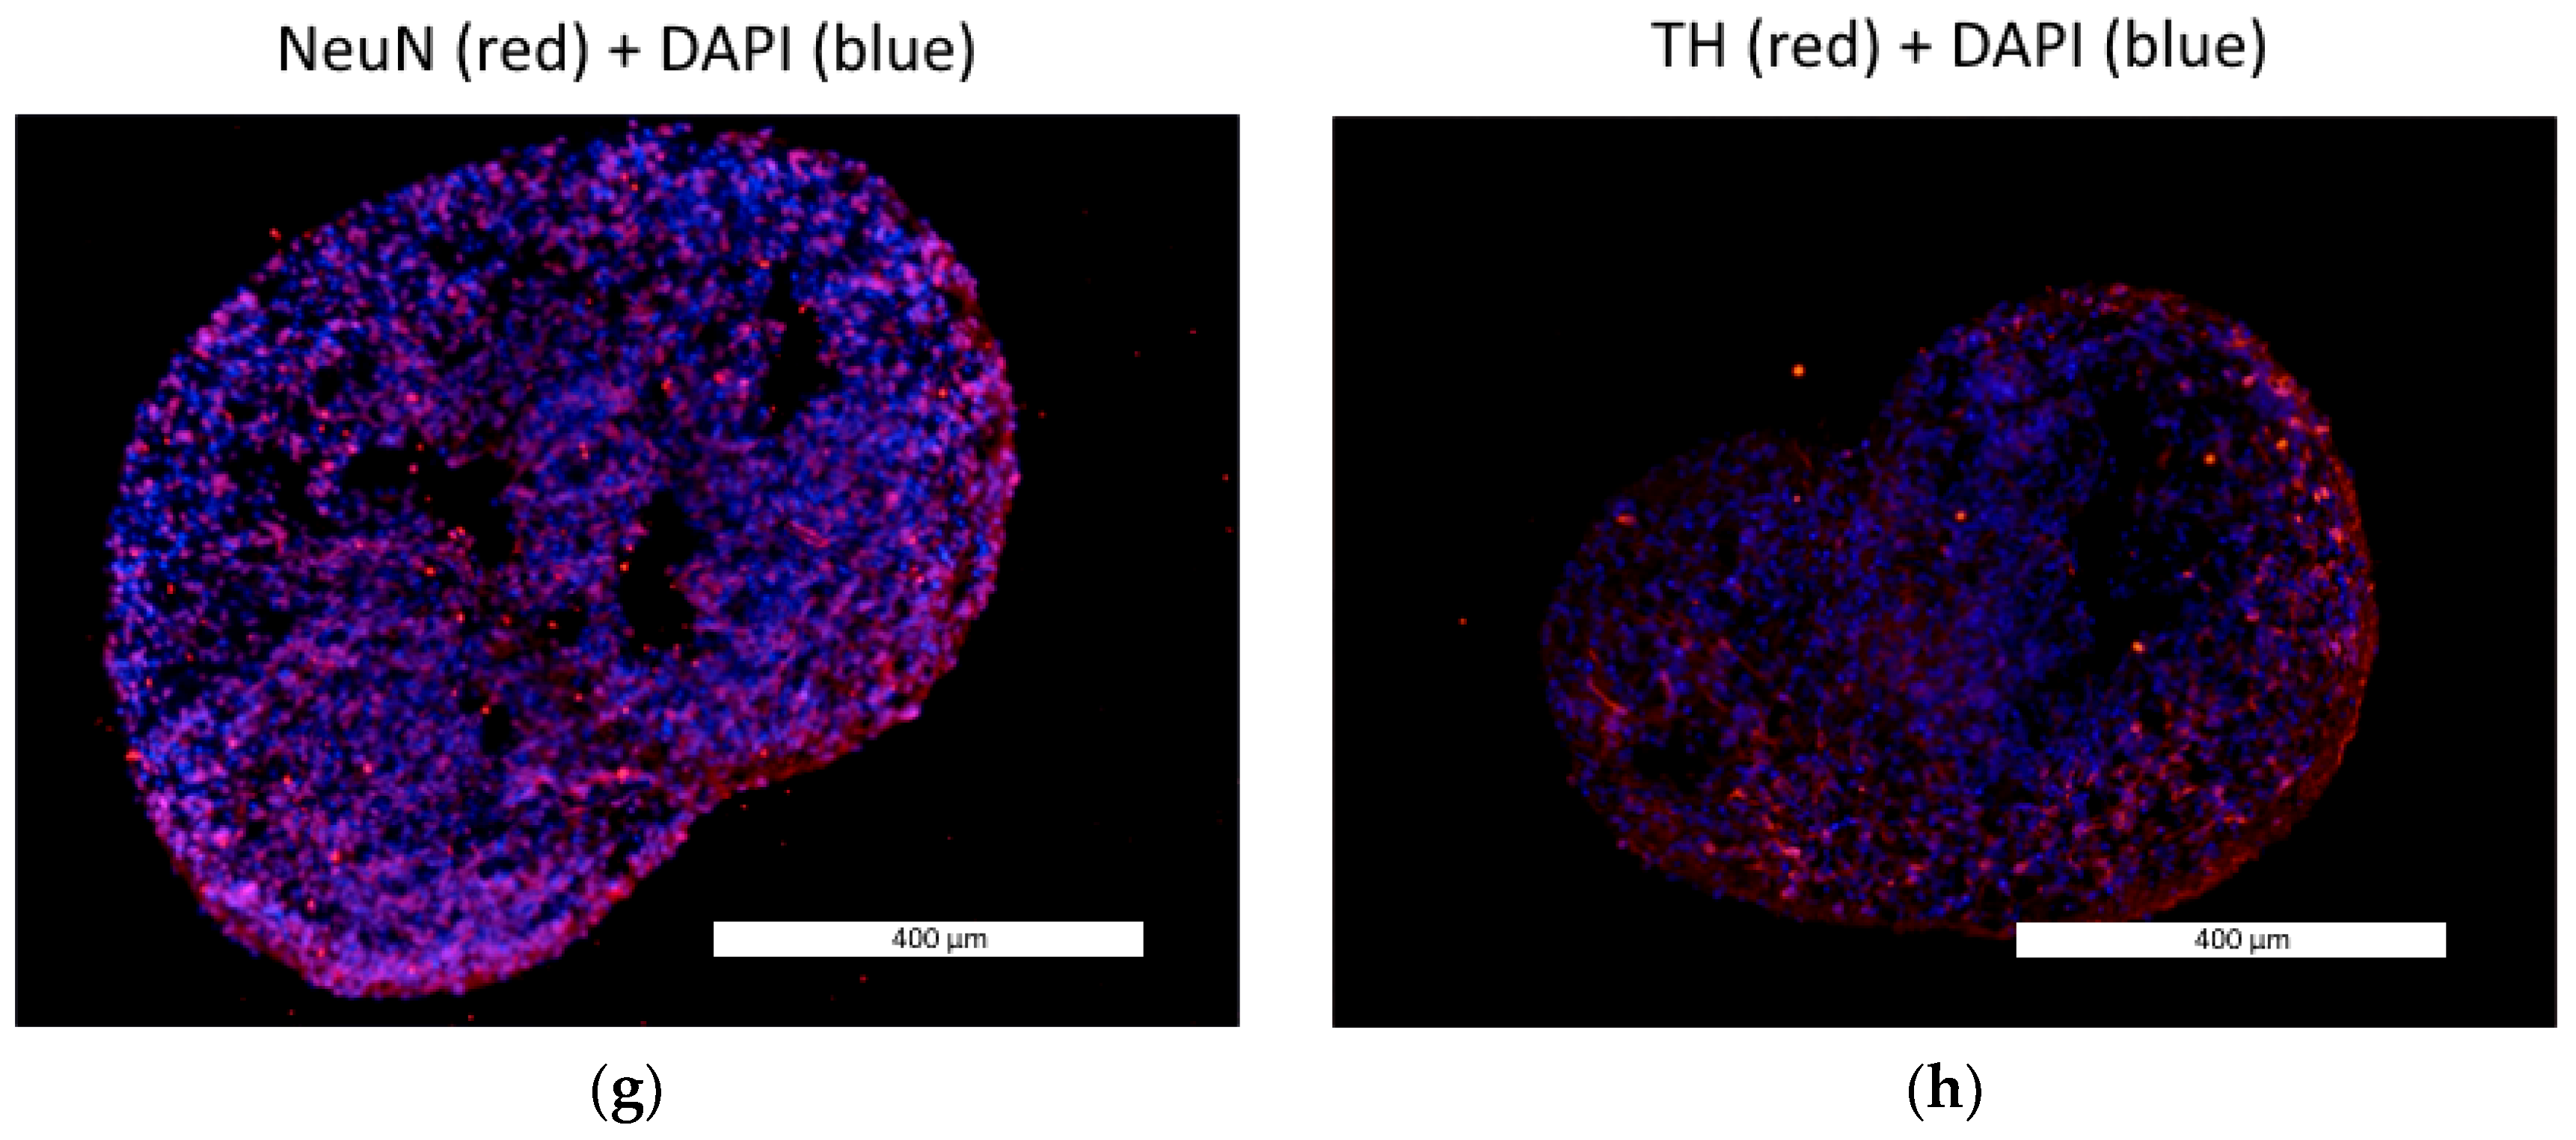
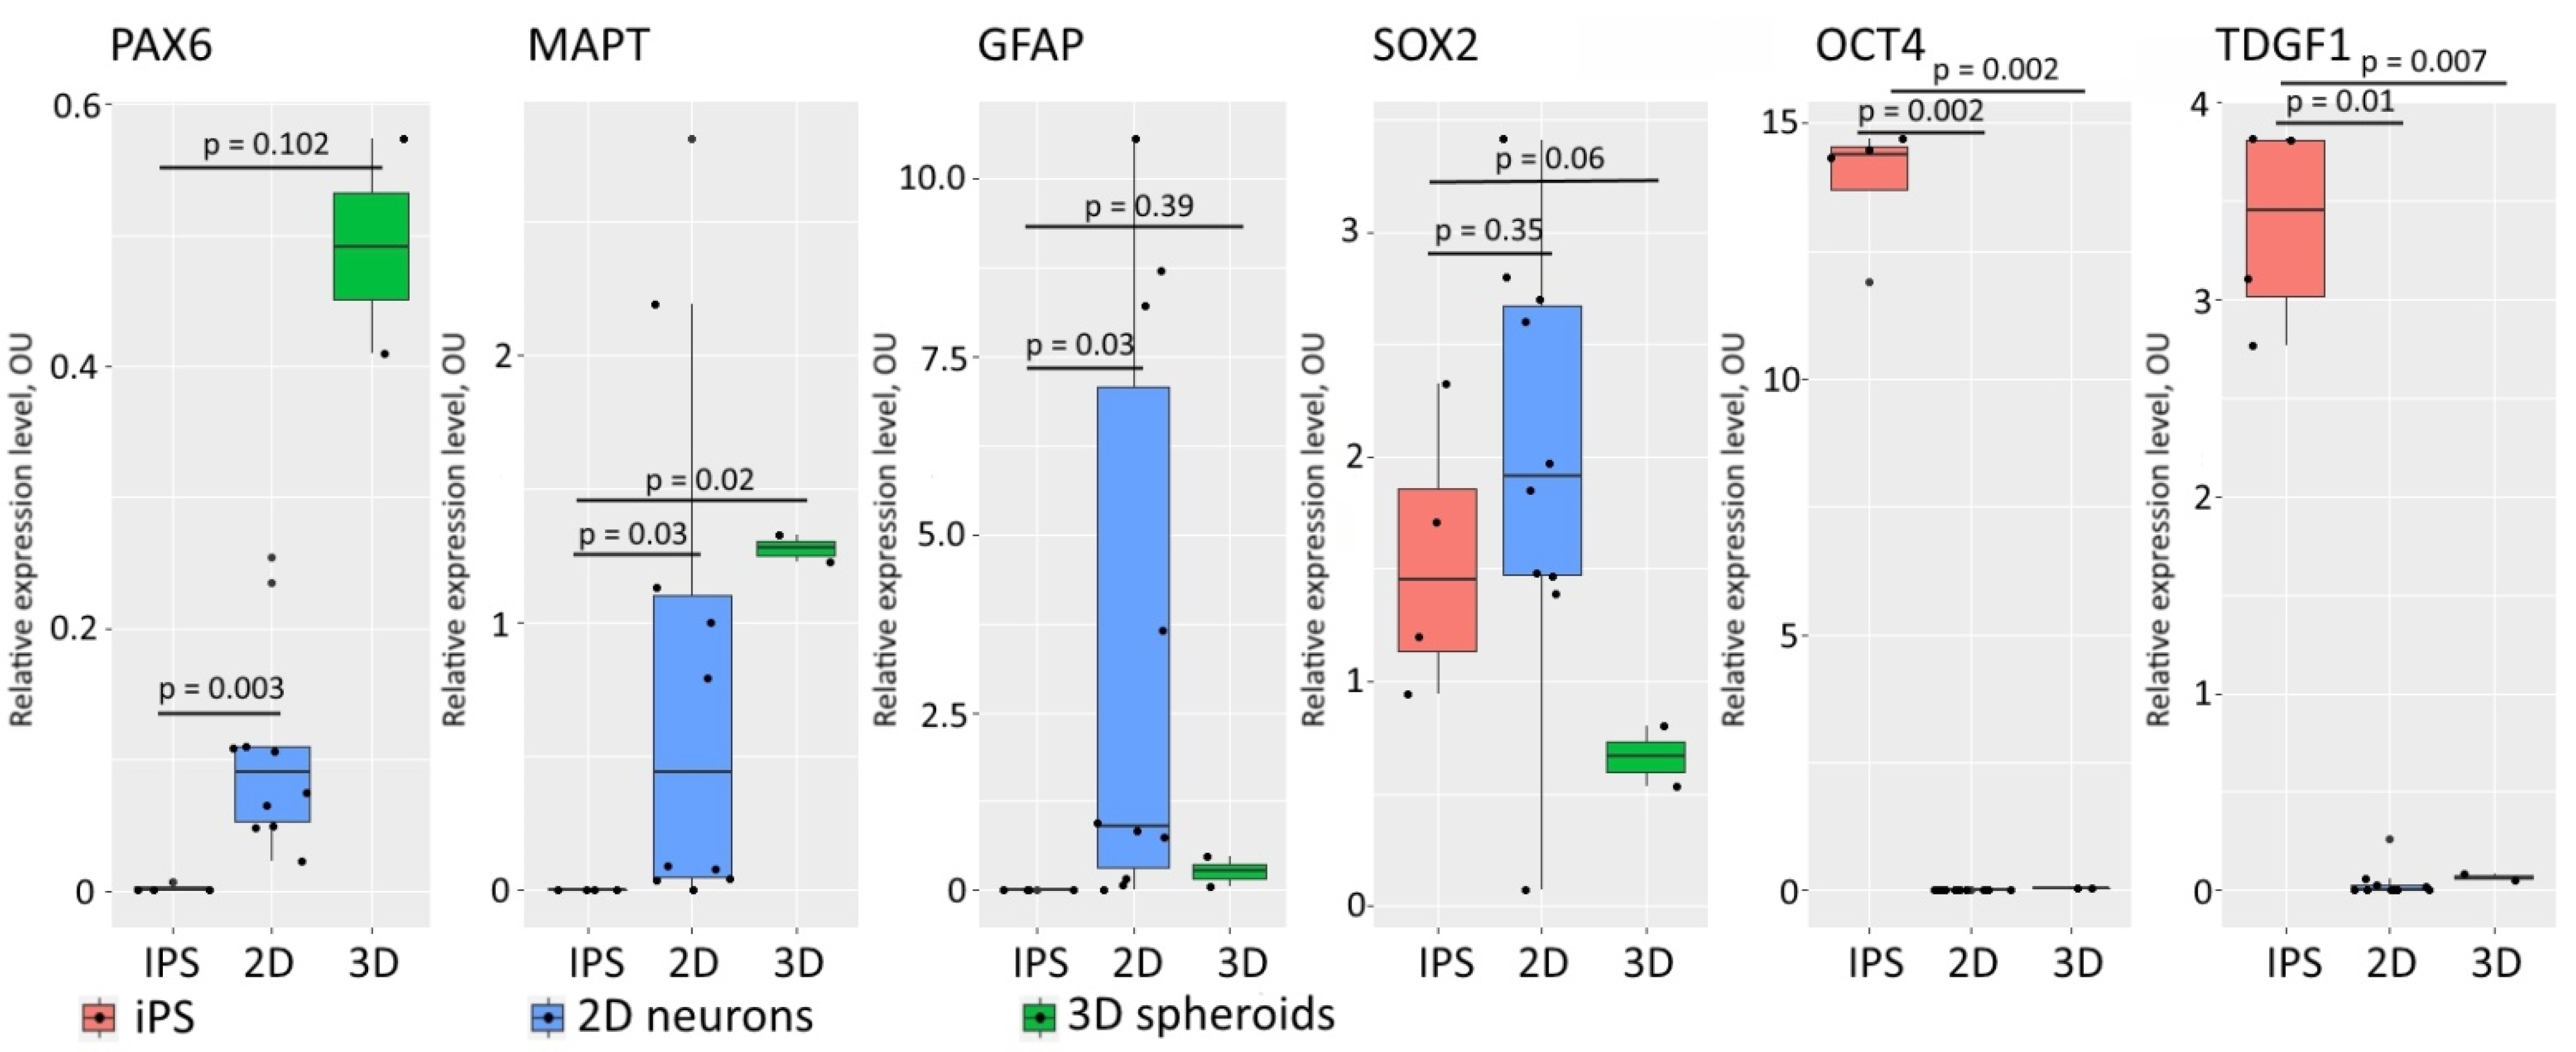
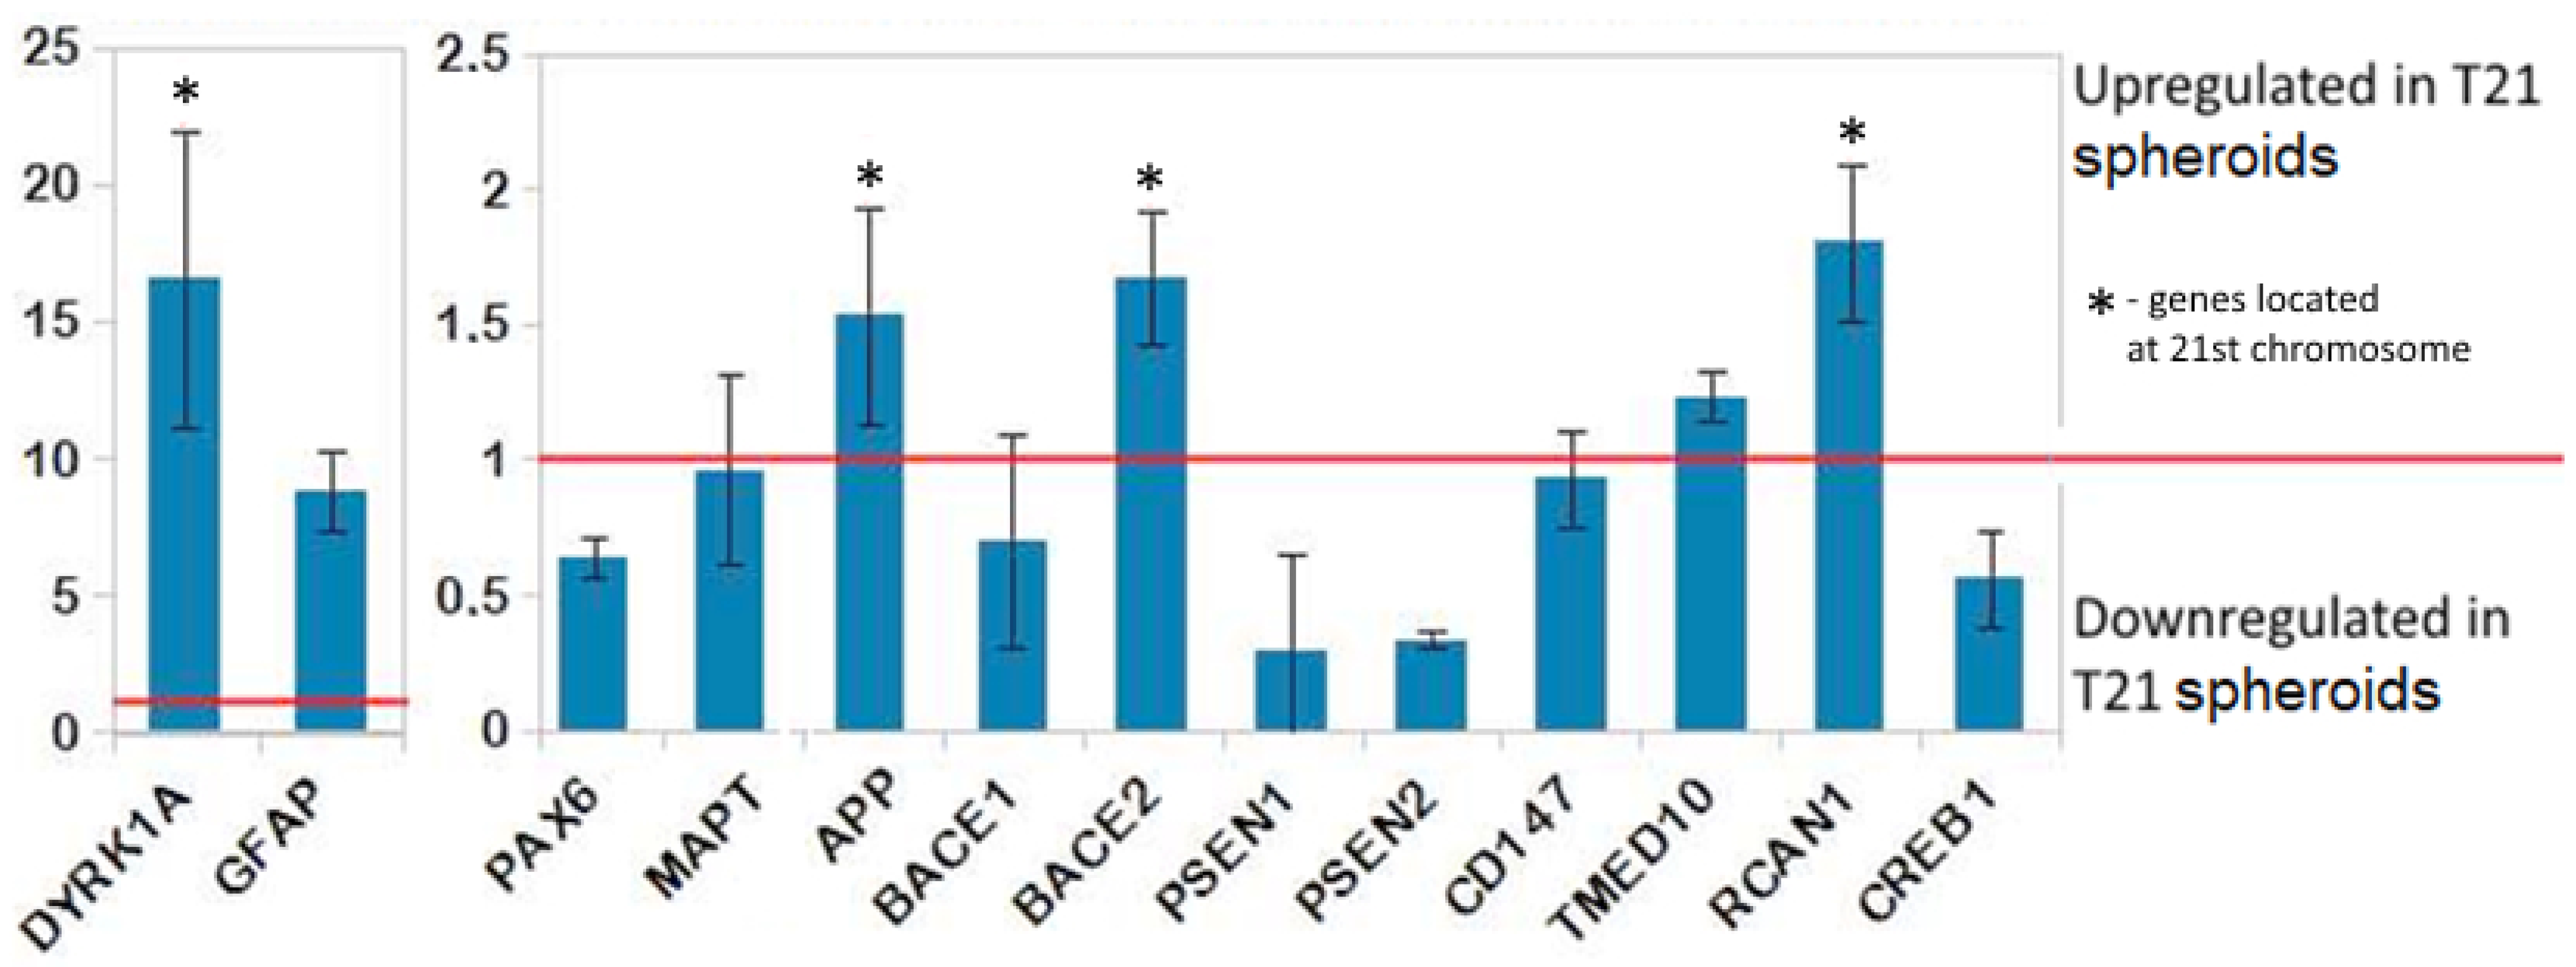
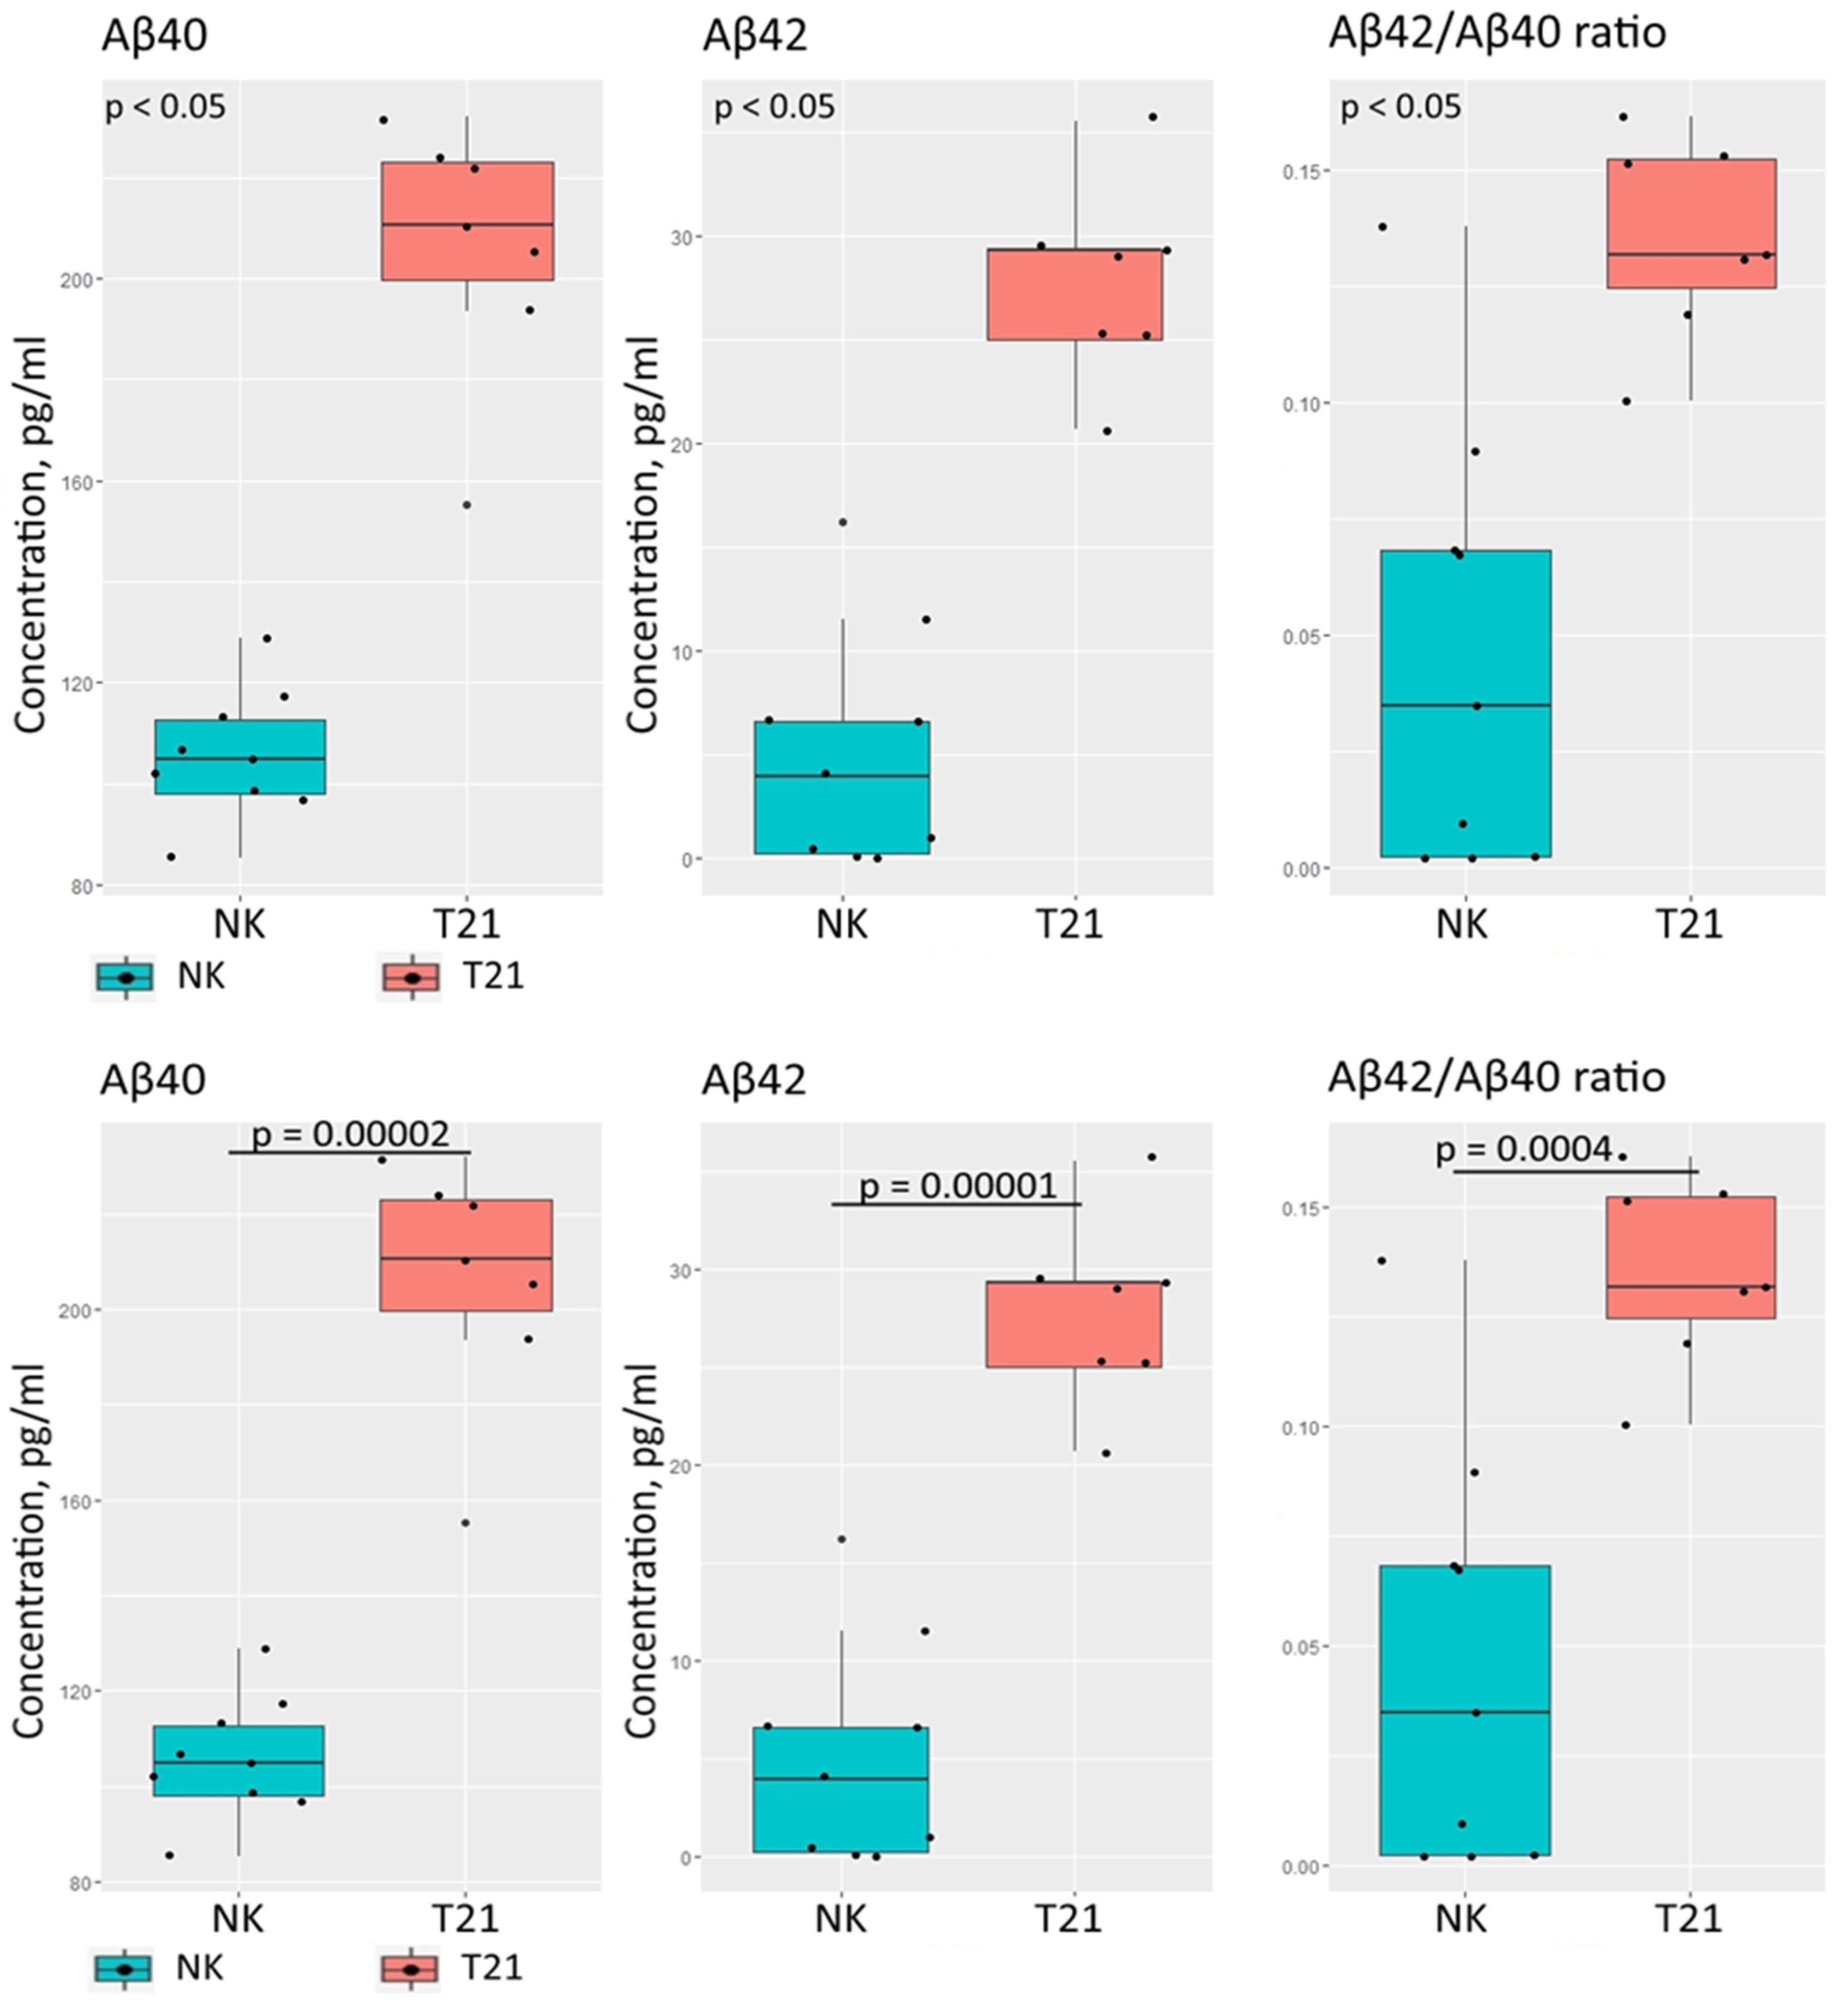
3.1. Neural Differentiation in 2D and 3D Conditions, Formation of TS21 and NK Spheroids
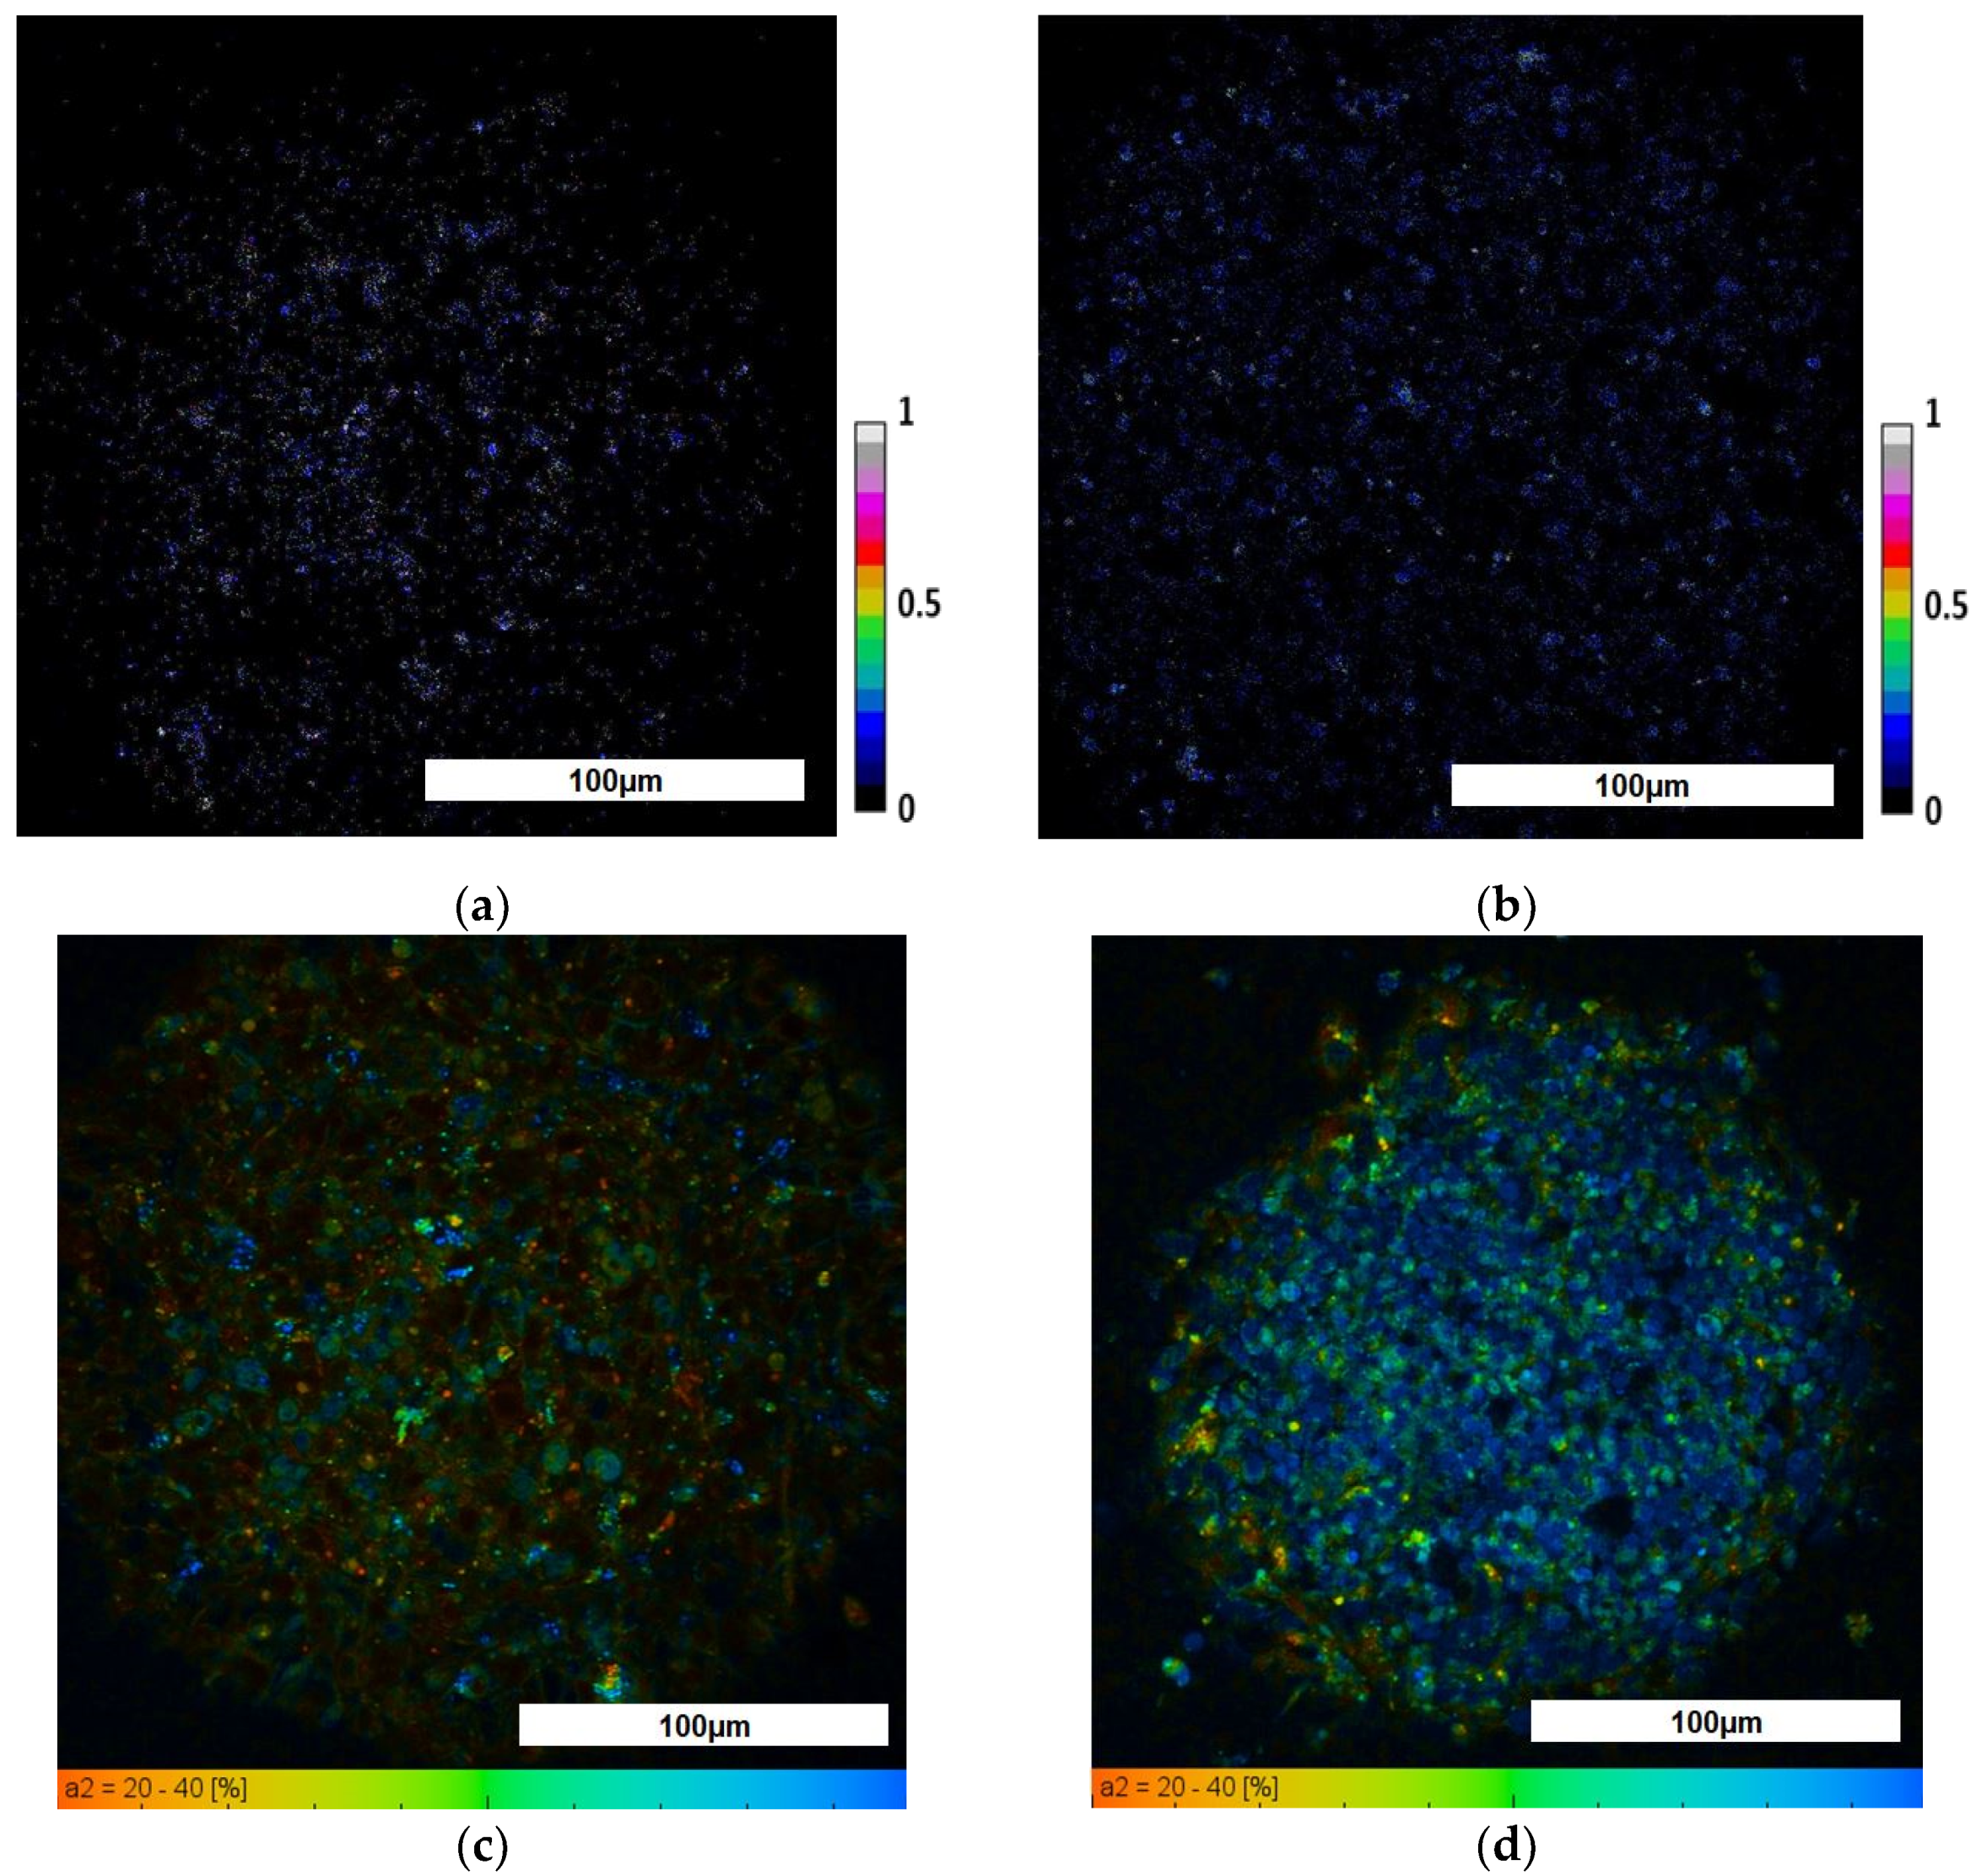
3.2. Evaluation of TS21 Spheroid Metabolic Activity Using FLIM
3.3. Evaluation of TS21 Spheroid Intracellular pH Using Fluorescence Microscopy
4. Discussion
5. Conclusions
Author Contributions
Funding
Institutional Review Board Statement
Informed Consent Statement
Data Availability Statement
Acknowledgments
Conflicts of Interest
References
- Chamberlain, S.J.; Li, X.J.; Lalande, M. Induced pluripotent stem (iPS) cells as in vitro models of human neurogenetic disorders. Neurogenetics 2008, 9, 227–235. [Google Scholar] [CrossRef] [PubMed]
- Sinnecker, D.; Goedel, A.; Dorn, T.; Dirschinger, R.J.; Moretti, A.; Laugwitz, K.-L. Modeling long-QT syndromes with iPS cells. J. Cardiovasc. Transl. Res. 2013, 6, 31–36. [Google Scholar] [CrossRef]
- Mungenast, A.E.; Siegert, S.; Tsai, L.H. Modeling Alzheimer’s disease with human induced pluripotent stem (iPS) cells. Mol. Cell. Neurosci. 2016, 73, 13–31. [Google Scholar] [CrossRef] [Green Version]
- Dashinimaev, E.B.; Artyuhov, A.S.; Bolshakov, A.P.; Vorotelyak, E.A.; Vasiliev, A.V. Neurons Derived from Induced Pluripotent Stem Cells of Patients with Down syndrome Reproduce Early Stages of Alzheimer’s Disease Type Pathology in vitro. J. Alzheimer’s Dis. 2017, 56, 835–847. [Google Scholar] [CrossRef] [PubMed]
- Cobb, M.M.; Ravisankar, A.; Skibinski, G.; Finkbeiner, S. iPS cells in the study of PD molecular pathogenesis. Cell Tissue Res. 2018, 373, 61–77. [Google Scholar] [CrossRef] [PubMed]
- Izzo, A.; Mollo, N.; Nitti, M.; Paladino, S.; Calì, G.; Genesio, R.; Bonfiglio, F.; Cicatiello, R.; Barbato, M.; Sarnataro, V.; et al. Mitochondrial dysfunction in Down syndrome: Molecular mechanisms and therapeutic targets. Mol. Med. 2018, 24, 2. [Google Scholar] [CrossRef] [Green Version]
- Lee, S.E.; Duran-Martinez, M.; Khantsis, S.; Bianchi, D.W.; Guedj, F. Challenges and opportunities for translation of therapies to improve cognition in Down syndrome. Trends Mol. Med. 2020, 26, 150–169. [Google Scholar] [CrossRef] [Green Version]
- Valenti, D.; de Bari, L.; de Rasmo, D.; Signorile, A.; Henrion-Caude, A.; Contestabile, A.; Vacca, R.A. The polyphenols resveratrol and epigallocatechin-3-gallate restore the severe impairment of mitochondria in hippocampal progenitor cells from a Down syndrome mouse model. Biochim. Biophys. Acta 2016, 1862, 1093–1104. [Google Scholar] [CrossRef]
- Piccoli, C.; Izzo, A.; Scrima, R.; Bonfiglio, F.; Manco, R.; Negri, R.; Quarato, G.; Cela, O.; Ripoli, M.; Prisco, M.; et al. Chronic pro-oxidative state and mitochondrial dysfunctions are more pronounced in fibroblasts from Down syndrome foeti with congenital heart defects. Curr. Hypertens. Rep. 2014, 16, 452. [Google Scholar] [CrossRef] [Green Version]
- Hall, C.N.; Klein-Flügge, M.C.; Howarth, C.; Attwell, D. Oxidative phosphorylation, not glycolysis, powers presynaptic and postsynaptic mechanisms underlying brain information processing. J. Neurosci. 2012, 32, 8940–8951. [Google Scholar] [CrossRef]
- Khacho, M.; Clark, A.; Svoboda, D.S.; MacLaurin, J.G.; Lagace, D.C.; Park, D.S.; Slack, R.S. Mitochondrial dysfunction underlies cognitive defects as a result of neural stem cell depletion and impaired neurogenesis. Hum. Mol. Genet. 2017, 26, 3327–3341. [Google Scholar] [CrossRef] [PubMed] [Green Version]
- Khacho, M.; Harris, R.; Slack, R.S. Mitochondria as central regulators of neural stem cell fate and cognitive function. Nat. Rev. Neurosci. 2019, 20, 34–48. [Google Scholar] [CrossRef]
- Hatakeyama, H.; Goto, Y. Concise review: Heteroplasmic mitochondrial DNA mutations and mitochondrial diseases: Toward iPSC-based disease modeling, drug discovery, and regenerative therapeutics. Stem Cell 2016, 34, 801–808. [Google Scholar] [CrossRef] [PubMed]
- Lorenz, C.; Prigione, A. Mitochondrial dysfunction underlies cognitive defects as a result of neural stem cell depletion and impaired neurogenesis. Curr. Opin. Cell Biol. 2017, 49, 71–76. [Google Scholar] [CrossRef] [PubMed] [Green Version]
- Yokota, M.; Hatakeyama, H.; Ono, Y.; Kanazawa, M.; Goto, Y.I. Mitochondrial respiratory dysfunction disturbs neuronal and cardiac lineage commitment of human iPSCs. Cell Death Dis. 2017, 8, e2551. [Google Scholar] [CrossRef]
- Mariani, J.; Simonini, M.V.; Palejev, D.; Tomasini, L.; Coppola, G.; Szekely, A.M.; Horvath, T.L.; Vaccarino, F.M. Modeling human cortical development in vitro using induced pluripotent stem cells. Proc. Natl. Acad. Sci. USA 2012, 109, 12770–12775. [Google Scholar] [CrossRef] [Green Version]
- Wörsdörfer, P.; Dalda, N.; Kern, A.; Krüger, S.; Wagner, N.; Kwok, C.K.; Henke, E.; Ergün, S. Generation of complex human organoid models including vascular networks by incorporation of mesodermal progenitor cells. Sci. Rep. 2019, 9, 15663. [Google Scholar] [CrossRef] [Green Version]
- Itoh, M.; Umegaki-Arao, N.; Guo, Z.; Liu, L.; Higgins, C.A.; Christiano, A.M. Generation of 3D skin equivalents fully reconstituted from human induced pluripotent stem cells (iPSCs). PLoS ONE 2013, 8, e77673. [Google Scholar] [CrossRef] [Green Version]
- Zhou, W.; Zhao, T.; Du, J.; Ji, G.; Li, X.; Ji, S.; Tian, W.; Wang, X.; Hao, A. TIGAR promotes neural stem cell differentiation through acetyl-CoA-mediated histone acetylation. Cell Death Dis. 2019, 10, 198. [Google Scholar] [CrossRef]
- Okkelman, I.A.; Neto, N.; Papkovsky, D.B.; Monaghan, M.G.; Dmitriev, R.I. A deeper understanding of intestinal organoid metabolism revealed by combining fluorescence lifetime imaging microscopy (FLIM) and extracellular flux analyses. Redox Biol. 2020, 30, 101420. [Google Scholar] [CrossRef]
- Blacker, T.S.; Duchen, M.R. Investigating mitochondrial redox state using NADH and NADPH autofluorescence. Free Radic. Biol. Med. 2016, 100, 53–65. [Google Scholar] [CrossRef] [Green Version]
- Meleshina, A.V.; Dudenkova, V.V.; Bystrova, A.S.; Kuznetsova, D.S.; Shirmanova, M.V.; Zagaynova, E.V. Two-photon FLIM of NAD(P)H and FAD in mesenchymal stem cells undergoing either osteogenic or chondrogenic differentiation. Stem Cell Res. Ther. 2017, 8, 15. [Google Scholar] [CrossRef] [PubMed] [Green Version]
- Meleshina, A.V.; Dudenkova, V.V.; Shirmanova, M.V.; Shcheslavskiy, V.I.; Becker, W.; Bystrova, A.S.; Cherkasova, E.I.; Zagaynova, E.V. Probing metabolic states of differentiating stem cells using two-photon FLIM. Sci. Rep. 2016, 6, 21853. [Google Scholar] [CrossRef] [PubMed] [Green Version]
- Stringari, C.; Edwards, R.A.; Pate, K.T.; Waterman, M.L.; Donovan, P.J.; Gratton, E. Metabolic trajectory of cellular differentiation in small intestine by Phasor Fluorescence Lifetime Microscopy of NADH. Sci. Rep. 2012, 2, 568. [Google Scholar] [CrossRef] [PubMed] [Green Version]
- Rodimova, S.A.; Meleshina, A.V.; Kalabusheva, E.P.; Dashinimaev, E.B.; Reunov, D.G.; Torgomyan, H.G.; Vorotelyak, E.A.; Zagaynova, E.V. Metabolic activity and intracellular pH in induced pluripotent stem cells differentiating in dermal and epidermal directions. Methods Appl. Fluoresc. 2019, 7, 44002. [Google Scholar] [CrossRef] [PubMed]
- Kobayashi, S.; Tanaka, Y.; Kiyono, M.; Chino, M.; Chikuma, T.; Hoshi, K.; Ikeshima, H. Dependence pH and proposed mechanism for aggregation of Alzheimer’s disease-related amyloid-beta(1–42) protein. J. Mol. Struct. 2015, 1094, 109–117. [Google Scholar] [CrossRef]
- Zhou, H.; Feng, R.; Liang, Q.; Su, X.; Deng, L.; Yang, L.; Ma, L.J. A sensitive pH fluorescent probe based on triethylenetetramine bearing double dansyl groups in aqueous solutions and its application in cells. Spectrochim. Acta Part A Mol. Biomol. Spectrosc. 2020, 229, 117881. [Google Scholar] [CrossRef]
- Zhuang, Q.; Si, X.; Li, L.; Zeng, H.; Ding, Y. A self-adaptive multi-color fluorescent pH probe with the ability of whole cell imaging. Talanta 2020, 208, 119780. [Google Scholar] [CrossRef]
- Martynov, V.I.; Pakhomov, A.A.; Deyev, I.E.; Petrenko, A.G. Genetically encoded fluorescent indicators for live cell pH imaging. Biochim. Biophys. Acta Gen. Subj. 2018, 1862, 2924–2939. [Google Scholar] [CrossRef]
- Vandesompele, J.; De Preter, K.; Pattyn, F.; Poppe, B.; Van Roy, N.; De Paepe, A.; Speleman, F. Accurate normalization of real-time quantitative RT-PCR data by geometric averaging of multiple internal control genes. Genome Biol. 2002, 3, research0034.1. [Google Scholar] [CrossRef] [Green Version]
- Artyukhov, A.S.; Dashinimaev, E.B.; Tsvetkov, V.O.; Bolshakov, A.P.; Konovalova, E.V.; Kolbaev, S.N.; Vorotelyak, E.A.; Vasiliev, A.V. New genes for accurate normalization of qRT-PCR results in study of iPS and iPS-derived cells. Gene 2017, 626, 234–240. [Google Scholar] [CrossRef] [PubMed]
- Matlashov. M.E.; Bogdanova, Y.A.; Ermakova, G.V.; Mishina, N.M.; Ermakova, Y.G.; Nikitin, E.S.; Balaban, P.M.; Okabe, S.; Lukyanov, S.; Enikolopov, G.; Zaraisky, A.G.; et al. Fluorescent ratiometric pH indicator SypHer2: Applications in neuroscience and regenerative biology. Biochim. Biophys. Acta 2015, 1850, 2318–2328. [Google Scholar]
- Boyer, L.A.; Lee, T.I.; Cole, M.F.; Johnstone, S.E.; Levine, S.S.; Zucker, J.P.; Guenther, M.G.; Kumar, R.M.; Murray, H.L.; Jenner, R.G.; et al. Core transcriptional regulatory circuitry in human embryonic stem cells. Cell 2005, 122, 947–956. [Google Scholar] [CrossRef] [PubMed] [Green Version]
- Babaie, Y.; Herwig, R.; Greber, B.; Brink, T.C.; Wruck, W.; Groth, D.; Lehrach, H.; Burdon, T.; Adjaye, J. Analysis of Oct4-dependent transcriptional networks regulating self-renewal and pluripotency in human embryonic stem cells. Stem Cells 2007, 25, 500–510. [Google Scholar] [CrossRef] [Green Version]
- Von Bohlen Und Halbach, O. Immunohistological markers for staging neurogenesis in adult hippocampus. Cell Tissue Res. 2007, 329, 409–420. [Google Scholar] [CrossRef]
- Von Bohlen Und Halbach, O. Immunohistological markers for proliferative events, gliogenesis, and neurogenesis within the adult hippocampus. Cell Tissue Res. 2011, 345, 1–19. [Google Scholar] [CrossRef]
- Quinn, K.P.; Sridharan, G.V.; Hayden, R.S.; Kaplan, D.L.; Lee, K.; Georgakoudi, I. Quantitative metabolic imaging using endogenous fluorescence to detect stem cell differentiation. Sci. Rep. 2013, 3, 3432. [Google Scholar] [CrossRef] [Green Version]
- Stringari, C.; Wang, H.; Geyfman, M.; Crosignani, V.; Kumar, V.; Takahashi, J.S.; Andersen, B.; Gratton, E. In vivo single-cell detection of metabolic oscillations in stem cells. Cell Rep. 2015, 10, 1–7. [Google Scholar] [CrossRef]
- Rodimova, S.; Kuznetsova, D.; Bobrov, N.; Elagin, V.; Shcheslavskiy, V.; Zagainov, V.; Zagaynova, E. Mapping metabolism of liver tissue using two-photon FLIM. Biomed. Opt. Express 2020, 11, 4458–4470. [Google Scholar] [CrossRef]
- Beevers, J.E.; Caffrey, T.M.; Wade-Martins, R. Induced pluripotent stem cell (iPSC)-derived dopaminergic models of Parkinson’s disease. Biochem. Soc. Trans. 2013, 41, 1503–1508. [Google Scholar] [CrossRef] [Green Version]
- Jacob, F.; Pather, S.R.; Huang, W.K.; Zhang, F.; Wong, S.Z.H.; Zhou, H.; Cubitt, B.; Fan, W.; Chen, C.Z.; Xu, M.; et al. Human pluripotent stem cell-derived neural cells and brain organoids reveal SARS-CoV-2 neurotropism predominates in choroid plexus epithelium. Cell Stem Cell 2020, 27, 937–950.e9. [Google Scholar] [CrossRef]
- Krefft, O.; Jabali, A.; Iefremova, V.; Koch, P.; Ladewig, J. Generation of standardized and reproducible forebrain-type cerebral organoids from human induced pluripotent stem cells. J. Vis. Exp. 2018, 131, 56768. [Google Scholar] [CrossRef] [PubMed] [Green Version]
- Qian, X.; Jacob, F.; Song, M.M.; Nguyen, H.N.; Song, H.; Ming, G.L. Generation of human brain region–Specific organoids using a miniaturized spinning bioreactor. Nat. Protoc. 2018, 13, 565–580. [Google Scholar] [CrossRef] [PubMed]
- Muguruma, K. Self-organization of polarized cerebellar tissue in 3D culture of human pluripotent stem cells. Cell Rep. 2015, 10, 537–550. [Google Scholar] [CrossRef] [PubMed] [Green Version]
- Jo, J.; Xiao, Y.; Sun, A.X.; Cukuroglu, E.; Tran, H.D.; Göke, J.; Tan, Z.Y.; Saw, T.Y.; Tan, C.P.; Lokman, H.; et al. Midbrain-like organoids from human pluripotent stem cells contain functional dopaminergic and neuromelanin-producing neurons. Cell Stem Cell 2016, 19, 248–257. [Google Scholar] [CrossRef] [PubMed] [Green Version]
- Monzel, A.S.; Smits, L.M.; Hemmer, K.; Hachi, S.; Moreno, E.L.; van Wuellen, T.; Jarazo, J.; Walter, J.; Brüggemann, I.; Boussaad, I.; et al. Derivation of human midbrain-specific organoids from neuroepithelial stem cells. Stem Cell Rep. 2017, 8, 1144–1154. [Google Scholar] [CrossRef]
- Lancaster, M.A.; Renner, M.; Martin, C.A.; Wenzel, D.; Bicknell, L.S.; Hurles, M.E.; Homfray, T.; Penninger, J.M.; Jackson, A.P.; Knoblich, J.A. Cerebral organoids model human brain development and microcephaly. Nature 2013, 501, 373–379. [Google Scholar] [CrossRef]
- Kadoshima, T.; Sakaguchi, H.; Nakano, T.; Soen, M.; Ando, S.; Eiraku, M.; Sasai, Y. Self-organization of axial polarity, inside-out layer pattern, and species-specific progenitor dynamics in human ES cell-derived neocortex. Proc. Natl. Acad. Sci. USA 2013, 110, 20284–20289. [Google Scholar] [CrossRef] [Green Version]
- Xiang, Y.; Tanaka, Y.; Patterson, B.; Kang, Y.J.; Govindaiah, G.; Roselaar, N.; Cakir, B.; Kim, K.Y.; Lombroso, A.P.; Hwang, S.M.; et al. Fusion of regionally specified hPSC-derived organoids models human brain development and interneuron migration. Cell Stem Cell 2017, 21, 383–398. [Google Scholar] [CrossRef] [Green Version]
- Paşca, A.M.; Sloan, S.A.; Clarke, L.E.; Tian, Y.; Makinson, C.D.; Huber, N.; Kim, C.H.; Park, J.Y.; O’Rourke, N.A.; Nguyen, K.D.; et al. Functional cortical neurons and astrocytes from human pluripotent stem cells in 3D culture. Nat. Methods 2015, 12, 671–678. [Google Scholar] [CrossRef] [Green Version]
- Lancaster, M.A.; Knoblich, J.A. Organogenesisin a dish: Modeling development and disease using organoid technologies. Science 2014, 345, 1247125. [Google Scholar] [CrossRef] [PubMed]
- Grenier, K.; Kao, J.; Diamandis, P. Three-dimensional modeling of human neurodegeneration: Brain organoids coming of age. Mol. Psychiatry 2020, 25, 254–274. [Google Scholar] [CrossRef] [PubMed]
- Mohyeldin, A.; Garzón-Muvdi, T.; Quiñones-Hinojosa, A. Oxygen in stem cell biology: A critical component of the stem cell niche. Cell Stem Cell 2010, 7, 150–161. [Google Scholar] [CrossRef] [PubMed] [Green Version]
- Kalinina, S.; Breymayer, J.; Schäfer, P.; Calzia, E.; Shcheslavskiy, V.; Becker, W.; Rück, A. Correlative NAD(P)H-FLIM and oxygen sensing-PLIM for metabolic mapping. J. Biophotonics 2016, 9, 800–811. [Google Scholar] [CrossRef]
- Lopes, C.; Rego, A.C. Revisiting mitochondrial function and metabolism in pluripotent stem cells: Where do we stand in neurological diseases? Mol. Neurobiol. 2017, 54, 1858–1873. [Google Scholar] [CrossRef]
- Vlassenko, A.G.; Gordon, B.A.; Goyal, M.S.; Su, Y.; Blazey, T.M.; Durbin, T.J.; Couture, L.E.; Christensen, J.J.; Jafri, H.; Morris, J.C.; et al. Aerobic glycolysis and tau deposition in preclinical Alzheimer’s disease. Neurobiol. Aging 2018, 67, 95–98. [Google Scholar] [CrossRef]
- Smith, A.M.; Depp, C.; Ryan, B.J.; Johnston, G.I.; Alegre-Abarrategui, J.; Evetts, S.; Rolinski, M.; Baig, F.; Ruffmann, C.; Simon, A.K.; et al. Mitochondrial dysfunction and increased glycolysis in prodromal and early Parkinson’s blood cells. Mov. Disord. 2018, 33, 1580–1590. [Google Scholar] [CrossRef]
- Vallée, A.; Lecarpentier, Y.; Guillevin, R.; Vallée, J.N. Aerobic glycolysis in amyotrophic lateral sclerosis and Huntington’s disease. Rev. Neurosci. 2018, 29, 547–555. [Google Scholar] [CrossRef]
- Valbuena, G.N.; Rizzardini, M.; Cimini, S.; Siskos, A.P.; Bendotti, C.; Cantoni, L.; Keun, H.C. Metabolomic analysis reveals increased aerobic glycolysis and amino acid deficit in a cellular model of amyotrophic lateral sclerosis. Mol. Neurobiol. 2016, 53, 2222–2240. [Google Scholar] [CrossRef] [Green Version]
- Karbowski, M.; Neutzner, A. Neurodegeneration as a consequence of failed mitochondrial maintenance. Acta Neuropathol. 2012, 123, 157–171. [Google Scholar] [CrossRef] [Green Version]
- Keshavan, N.; Rahman, S. Natural history of mitochondrial disorders: A systematic review. Essays Biochem. 2018, 62, 423–442. [Google Scholar] [PubMed]
- Knight, A.L.; Yan, X.; Hamamichi, S.; Ajjuri, R.R.; Mazzulli, J.R.; Zhang, M.W.; Daigle, J.G.; Zhang, S.; Borom, A.R.; Roberts, L.R.; et al. The glycolytic enzyme, GPI, is a functionally conserved modifier of dopaminergic neurodegeneration in Parkinson’s models. Cell Metab. 2014, 20, 145–157. [Google Scholar] [CrossRef] [PubMed] [Green Version]
- Besson, M.T.; Dupont, P.; Fridell, Y.W.; Liévens, J.C. Increased energy metabolism rescues glia-induced pathology in a Drosophila model of Huntington’s disease. Hum. Mol. Genet. 2010, 19, 3372–3382. [Google Scholar] [CrossRef] [PubMed] [Green Version]
- Cai, R.; Zhang, Y.; Simmering, J.E.; Schultz, J.L.; Li, Y.; Fernandez-Carasa, I.; Consiglio, A.; Raya, A.; Polgreen, P.M.; Narayanan, N.S.; et al. Enhancing glycolysis attenuates Parkinson’s disease progression in models and clinical databases. J. Clin. Investig. 2019, 129, 4539–4549. [Google Scholar] [CrossRef] [Green Version]
- Pokusa, M.; Kráľová Trančíková, A. FLIM analysis of intracellular markers associated with the development of Parkinson’s disease in cellular model. Physiol. Res. 2018, 67, 673–683. [Google Scholar] [CrossRef]
- Sameni, S.; Syed, A.; Marsh, J.L.; Digman, M.A. The phasor-FLIM fingerprints reveal shifts from OXPHOS to enhanced glycolysis in Huntington Disease. Sci. Rep. 2016, 6, 34755. [Google Scholar] [CrossRef] [Green Version]
- Okkelman, I.A.; Foley, T.; Papkovsky, D.B.; Dmitriev, R.I. Multi-Parametric Imaging of Hypoxia and Cell Cycle in Intestinal Organoid Culture. Adv. Exp. Med. Biol. 2017, 1035, 85–103. [Google Scholar]
- Okkelman, I.A.; Puschhof, J.; Papkovsky, D.B.; Dmitriev, R.I. Visualization of stem cell niche by fluorescence lifetime imaging microscopy. Methods Mol. Biol. 2020, 2171, 65–97. [Google Scholar]
- Browne, A.W.; Arnesano, C.; Harutyunyan, N.; Khuu, T.; Martinez, J.C.; Pollack, H.A.; Koos, D.S.; Lee, T.C.; Fraser, S.E.; Moats, R.A.; et al. Structural and functional characterization of human stem-cell-derived retinal organoids by live imaging. Investig. Ophthalmol. Vis. Sci. 2017, 58, 3311–3318. [Google Scholar]
- Brechenmacher, C.; Rodeau, J.-L. Intracellular pH regulation in ventral horn neurones cultured from embryonic rat spinal cord. Mol. Membr. Biol. 2000, 17, 101–108. [Google Scholar]
- Dietl, K.; Renner, K.; Dettmer, K.; Timischl, B.; Eberhart, K.; Dorn, C.; Hellerbrand, C.; Kastenberger, M.; Kunz-Schughart, L.A.; Oefner, P.J.; et al. Lactic acid and acidification inhibit TNF secretion and glycolysis of human monocytes. J. Immunol. 2010, 184, 1200–1209. [Google Scholar] [CrossRef] [PubMed]
- Counillon, L.; Pouysségur, J. The expanding family of eucaryotic Na(+)/H(+) exchangers. J. Biol. Chem. 2000, 275, 1–4. [Google Scholar] [CrossRef] [PubMed] [Green Version]
- Parks, S.K.; Pouyssegur, J. The Na(+)/HCO3(−) co-transporter SLC4A4 plays a role in growth and migration of colon and breast cancer cells. J. Cell. Physiol. 2015, 230, 1954–1963. [Google Scholar] [CrossRef]
- Andersen, A.P.; Flinck, M.; Oernbo, E.K.; Pedersen, N.B.; Viuff, B.M.; Pedersen, S.F. Roles of acid-extruding ion transporters in regulation of breast cancer cell growth in a 3-dimensional microenvironment. Mol. Cancer 2016, 15, 45. [Google Scholar] [CrossRef] [PubMed] [Green Version]
- Erlichman, J.S.; Cook, A.; Schwab, M.C.; Budd, T.W.; Leiter, J.C. Heterogeneous patterns of pH regulation in glial cells in the dorsal and ventral medulla. Am. J. Physiol. Regul. Integr. Comp. Physiol. 2004, 286, 289–302. [Google Scholar] [CrossRef] [PubMed]
- Zagaynova, E.V.; Druzhkova, I.N.; Mishina, N.M.; Ignatova, N.I.; Dudenkova, V.V.; Shirmanova, M.V. Imaging of Intracellular pH in Tumor Spheroids Using Genetically Encoded Sensor SypHer2. Adv. Exp. Med. Biol. 2017, 1035, 105–119. [Google Scholar]
- Druzhkova, I.; Lukina, M.; Dudenkova, V.; Ignatova, N.; Snopova, L.; Gavrina, A.; Shimolina, L.; Belousov, V.; Zagaynova, E.; Shirmanova, M. Tracing of intracellular pH in cancer cells in response to Taxol treatment. Cell Cycle 2021, 20, 1540–1551. [Google Scholar] [CrossRef]

| Antibodies Names | Producer (cat. №) |
|---|---|
| Anti-Oct4 | Millipore (MAB4401) |
| Ati-Sox2 | Cell Signaling Technology (3579) |
| Anti-SSEA3 | Abcam (ab16286) |
| Anti-TRA-1-60 | Abcam (ab16288) |
| Anti-TUBB3 | Millipore (MAB1637) |
| Anti-GFAP | Millipore (04-1031) |
| Anti-Nestin | Millipore (MAB5326) |
| Anti-hNCAM | Abcam (ab75813) |
| Anti-NeuN | Abcam (ab104225) |
| Anti-TH | Abcam (ab75875) |
| Primer Target | Primer Sequence (5′→3′) |
|---|---|
| SOX2 | Forward Primer-TGCGAGCGCTGCACAT |
| Reverse Primer-GCAGCGTGTACTTATCCTTCTTCA | |
| OCT4 | Forward Primer-ACCCACACTGCAGCAGATCA |
| Reverse Primer-CACACTCGGACCACATCCTTCT | |
| Nanog | Forward Primer-ACAACTGGCCGAAGAATAGCA |
| Reverse Primer-GGTTCCCAGTCGGGTTCAC | |
| Lin28 | Forward Primer-AGTCAGCCAAGGGTCTGGAAT |
| Reverse Primer-CCGCCTCTCACTCCCAATA | |
| DPPA4 | Forward Primer-GACCTCCACAGAGAAGTCGAG |
| Reverse Primer-TGCCTTTTTCTTAGGGCAGAG | |
| TDGF1 | Forward Primer-TTTGAACTGGGATTAGTTGCCG |
| Reverse Primer-GGGGCCAAATGCTGTCATCT | |
| GFAP | Forward Primer-AGGTCCATGTGGAGCTTGAC |
| Reverse Primer-GCCATTGCCTCATACTGCGT | |
| MAPT | Forward Primer-TTTGGTGGTGGTTAGAGATATGC |
| Reverse Primer-CCGAGGTGCGTGAAGAAATG | |
| PAX6 | Forward Primer-AGTGCCCGTCCATCTTTGC |
| Reverse Primer-CGCTTGGTATGTTATCGTTGGT | |
| DYRK1A | Forward Primer-AAGAAGCGAAGACACCAACAG |
| Reverse Primer-TTTCGTAACGATCCATCCACTTT | |
| APP | Forward Primer-CAAGCAGTGCAAGACCCATC |
| Reverse Primer-AGAAGGGCATCACTTACAAACTC | |
| BACE1 | Forward Primer-TCTGTCGGAGGGAGCATGAT |
| Reverse Primer-GCAAACGAAGGTTGGTGGT | |
| BACE2 | Forward Primer-TGCCTGGGATTAAATGGAATGG |
| Reverse Primer-CAGGGAGTCGAAGAAGGTCTC | |
| PSEN1 | Forward Primer-ACAGGTGCTATAAGGTCATCCA |
| Reverse Primer-CAGATCAGGAGTGCAACAGTAAT | |
| PSEN2 | Forward Primer-TCACTCTGTGCATGATCGTGG |
| Reverse Primer-GTGAATGGCGTGTAGATGAGC | |
| CD147 | Forward Primer-CTCCCAGAGTGAAGGCTGTG |
| Reverse Primer-ACTCTGACTTGCAGACCAGC | |
| TMED10 | Forward Primer-TGGAGGCGAAAAATTACGAAGA |
| Reverse Primer-CTAGGCGTCGCAGCTCTAC | |
| RCAN1 | Forward Primer-GCGTGGTGGTCCATGTATGT |
| Reverse Primer-TGAGGTGGATCGGCGTGTA | |
| CREB1 | Forward Primer-CCACTGTAACGGTGCCAACT |
| Reverse Primer-GCTGCATTGGTCATGGTTAATGT |
| Type of Spheroids | Redox Ratio | τm (ps) | τ1 (ps) | τ2 (ps) | α2, % | |
|---|---|---|---|---|---|---|
| NK | 0.13 ± 0.02 | 1301.21 ± 54.06 | 462.74 ± 31.76 | 2373.12 ± 67.03 | 31.33 ± 1.42 | |
| TS21 | periphery | 0.05 ± 0.01 | 939.39 ± 65.16 | 407.72 ± 17.16 | 2528.2 ± 77.14 | 27.18 ± 1.12 |
| center | 0.07 ± 0.01 |
Publisher’s Note: MDPI stays neutral with regard to jurisdictional claims in published maps and institutional affiliations. |
© 2021 by the authors. Licensee MDPI, Basel, Switzerland. This article is an open access article distributed under the terms and conditions of the Creative Commons Attribution (CC BY) license (https://creativecommons.org/licenses/by/4.0/).
Share and Cite
Kashirina, A.; Gavrina, A.; Kryukov, E.; Elagin, V.; Kolesova, Y.; Artyuhov, A.; Momotyuk, E.; Abdyyev, V.; Meshcheryakova, N.; Zagaynova, E.; et al. Energy Metabolism and Intracellular pH Alteration in Neural Spheroids Carrying Down Syndrome. Biomedicines 2021, 9, 1741. https://doi.org/10.3390/biomedicines9111741
Kashirina A, Gavrina A, Kryukov E, Elagin V, Kolesova Y, Artyuhov A, Momotyuk E, Abdyyev V, Meshcheryakova N, Zagaynova E, et al. Energy Metabolism and Intracellular pH Alteration in Neural Spheroids Carrying Down Syndrome. Biomedicines. 2021; 9(11):1741. https://doi.org/10.3390/biomedicines9111741
Chicago/Turabian StyleKashirina, Alena, Alena Gavrina, Emil Kryukov, Vadim Elagin, Yuliya Kolesova, Alexander Artyuhov, Ekaterina Momotyuk, Vepa Abdyyev, Natalia Meshcheryakova, Elena Zagaynova, and et al. 2021. "Energy Metabolism and Intracellular pH Alteration in Neural Spheroids Carrying Down Syndrome" Biomedicines 9, no. 11: 1741. https://doi.org/10.3390/biomedicines9111741
APA StyleKashirina, A., Gavrina, A., Kryukov, E., Elagin, V., Kolesova, Y., Artyuhov, A., Momotyuk, E., Abdyyev, V., Meshcheryakova, N., Zagaynova, E., Dashinimaev, E., & Kashina, A. (2021). Energy Metabolism and Intracellular pH Alteration in Neural Spheroids Carrying Down Syndrome. Biomedicines, 9(11), 1741. https://doi.org/10.3390/biomedicines9111741