
New Insights on the Relationship between Leptin, Ghrelin, and Leptin/Ghrelin Ratio Enforced by Body Mass Index in Obesity and Diabetes

 , , , and
Abstract
1. Introduction
2. Materials and Methods
3. Results
4. Discussion
5. Conclusions
Author Contributions
Funding
Institutional Review Board Statement
Informed Consent Statement
Conflicts of Interest
Abbreviations
| BMI | Body mass index |
| WC | Waist circumference |
| IDF | International Diabetes Federation |
| HOMA index | Homeostatic model assessment index |
| MetS | Metabolic syndrome |
| HDL-cholesterol | HDL-C = high-density lipoprotein cholesterol |
| LDL-cholesterol | LDL-C = low-density lipoprotein cholesterol |
| Total-C | Total cholesterol |
| DM | Diabetes mellitus |
| AUROC | Area under the receiver operating characteristic |
| MuHOB | Metabolically UnHealthy Obesity |
| MONW | Metabolically Obese Normal Weight (MONW |
| MHOB | Metabolically Healthy Obesity |
| SD | Standard deviation |
References
- Atas, U.; Erin, N.; Tazegul, G.; Elpek, G.O.; Yildirim, B. Changes in ghrelin, substance P and vasoactive intestinal peptide levels in the gastroduodenal mucosa of patients with morbid obesity. Neuropeptides 2021, 89, 2–7. [Google Scholar] [CrossRef] [PubMed]
- Cozma, A.; Sitar-Taut, A.; Urian, L.; Fodor, A.; Suharoschi, R.; Muresan, C.; Negrean, V.; Sampelean, D.; Zdrenghea, D.; Pop, D.; et al. Unhealthy lifestyle and the risk of metabolic syndrome—The Romanian experience. JMMS 2018, 5, 218–229. [Google Scholar] [CrossRef]
- Ahima, R.S.; Lazar, M.A. The health risk of obesity—Better metrics imperative. Science 2013, 341, 856–858. [Google Scholar] [CrossRef] [PubMed]
- Internation Diabetes Federation. IDF Diabetes Atlas Ninth. In Atlas de la Diabetes de la FID 2019; Internation Diabetes Federation: Bruselas, Belgium, 2019; ISBN 9782930229874. [Google Scholar]
- Romacho, T.; Elsen, M.; Röhrborn, D.; Eckel, J. Adipose tissue and its role in organ crosstalk. Acta Physiol. 2014, 210, 733–753. [Google Scholar] [CrossRef] [PubMed]
- Poher, A.L.; Tschöp, M.H.; Müller, T.D. Ghrelin regulation of glucose metabolism. Peptides 2018, 100, 236–242. [Google Scholar] [CrossRef]
- Landecho, M.F.; Tuero, C.; Valentí, V.; Bilbao, I.; de la Higuera, M.; Frühbeck, G. Relevance of leptin and other adipokines in obesity-associated cardiovascular risk. Nutrients 2019, 11, 2664. [Google Scholar] [CrossRef]
- Frühbeck, G.; Toplak, H.; Woodward, E.; Yumuk, V.; Maislos, M.; Oppert, J.M. Obesity: The gateway to ill health—An EASO position statement on a rising public health, clinical and scientific challenge in Europe. Obes. Facts 2013, 6, 117–120. [Google Scholar] [CrossRef]
- Fodor, A.; Cozma, A.; Suharoschi, R.; Sitar-Taut, A.; Roman, G. Clinical and genetic predictors of diabetes drug’s response. Drug Metab. Rev. 2019, 51, 408–427. [Google Scholar] [CrossRef]
- Chait, A.; den Hartigh, L.J. Adipose Tissue Distribution, Inflammation and Its Metabolic Consequences, Including Diabetes and Cardiovascular Disease. Front. Cardiovasc. Med. 2020, 7, 22. [Google Scholar] [CrossRef]
- Budak, E.; Fernández Sánchez, M.; Bellver, J.; Cerveró, A.; Simón, C.; Pellicer, A. Interactions of the hormones leptin, ghrelin, adiponectin, resistin, and PYY3-36 with the reproductive system. Fertil. Steril. 2006, 85, 1563–1581. [Google Scholar] [CrossRef]
- Derosa, G.; Catena, G.; Gaudio, G.; D’Angelo, A.; Maffioli, P. Adipose tissue dysfunction and metabolic disorders: Is it possible to predict who will develop type 2 diabetes mellitus? Role of markers in the progression of dIabetes in obese patients (The RESISTIN trial). Cytokine 2020, 127, 154947. [Google Scholar] [CrossRef]
- Vecchié, A.; Dallegri, F.; Carbone, F.; Bonaventura, A.; Liberale, L.; Portincasa, P.; Frühbeck, G.; Montecucco, F. Obesity phenotypes and their paradoxical association with cardiovascular diseases. Eur. J. Intern. Med. 2018, 48, 6–17. [Google Scholar] [CrossRef] [PubMed]
- Catoi, A.; Parvu, A.; Andreicut, A.; Mironiuc, A.; Craciun, A.; Catoi, C.; Pop, I. Metabolically Healthy versus Unhealthy Morbidly Obese: Chronic Inflammation, Nitro-Oxidative Stress, and Insulin Resistance. Nutrients 2018, 10, 1199. [Google Scholar] [CrossRef]
- Kyrou, I.; Mattu, H.S.; Chatha, K.; Randeva, H.S. Fat Hormones, Adipokines. In Endocrinology of the Heart in Health and Disease; Academic Press: Cambridge, MA, USA, 2017; ISBN 9780128031117. [Google Scholar]
- Unamuno, X.; Gómez-Ambrosi, J.; Rodríguez, A.; Becerril, S.; Frühbeck, G.; Catalán, V. Adipokine dysregulation and adipose tissue inflammation in human obesity. Eur. J. Clin. Investig. 2018, 48, 1–11. [Google Scholar] [CrossRef]
- Adamska-Patruno, E.; Ostrowska, L.; Goscik, J.; Pietraszewska, B.; Kretowski, A.; Gorska, M. The relationship between the leptin/ghrelin ratio and meals with various macronutrient contents in men with different nutritional status: A randomized crossover study. Nutr. J. 2018, 17, 1–7. [Google Scholar] [CrossRef] [PubMed]
- Flehmig, G.; Scholz, M.; Kloting, N.; Fasshauer, M.; Tonjes, A.; Stumvoll, M.; Youn, B.S.; Bluher, M. Identification of adipokine clusters related to the parameters of fat mass, insulin sensitivity and inflammation. PLoS ONE 2014, 9, e99785. [Google Scholar]
- Abd El-Kader, S.M.; Al-Jiffri, O.H. Impact of weight reduction on insulin resistance, adhesive molecules and adipokines dysregulation among obese type 2 diabetic patients. Afr. Health Sci. 2018, 18, 873–883. [Google Scholar] [CrossRef]
- Alzaim, I.; Hammoud, S.H.; Al-Koussa, H.; Ghazi, A.; Eid, A.H.; El-Yazbi, A.F. Adipose tissue immunomodulation: A novel therapeutic approach in cardiovascular and metabolic diseases. Front. Cardiovasc. Med. 2020, 7, 1–40. [Google Scholar] [CrossRef]
- Feijóo-Bandín, S.; Aragón-Herrera, A.; Moraña-Fernández, S.; Anido-Varela, L.; Tarazón, E.; Roselló-Lletí, E.; Portolés, M.; Moscoso, I.; Gualillo, O.; González-Juanatey, J.R.; et al. Adipokines and inflammation: Focus on cardiovascular diseases. Int. J. Mol. Sci. 2020, 21, 7711. [Google Scholar] [CrossRef]
- Recinella, L.; Orlando, G.; Ferrante, C.; Chiavaroli, A.; Brunetti, L.; Leone, S. Adipokines: New Potential Therapeutic Target for Obesity and Metabolic, Rheumatic, and Cardiovascular Diseases. Front. Physiol. 2020, 11, 578966. [Google Scholar] [CrossRef]
- Collazo, P.; Martínez-Sánchez, N.; Milbank, E.; Contreras, C. Incendiary leptin. Nutrients 2020, 12, 472. [Google Scholar] [CrossRef]
- Kim, W.K.; Bae, K.-H.; Lee, S.C.; Oh, K.-J. The Latest Insights into Adipokines in Diabetes. J. Clin. Med. 2019, 8, 1874. [Google Scholar] [CrossRef]
- Kojta, I.; Chacińska, M.; Błachnio-Zabielska, A. Obesity, Bioactive Lipids, and Adipose Tissue Inflammation in Insulin Resistance. Nutrients 2020, 12, 1305. [Google Scholar] [CrossRef] [PubMed]
- Arabi, Y.M.; Jawdat, D.; Al-Dorzi, H.M.; Tamim, H.; Tamimi, W.; Bouchama, A.; Sadat, M.; Afesh, L.; Abdullah, M.L.; Mashaqbeh, W.; et al. Leptin, ghrelin, and leptin/ghrelin ratio in critically ill patients. Nutrients 2020, 12, 36. [Google Scholar] [CrossRef]
- Miljković, M.; Šaranac, L.; Bašić, J.; Ilić, M.; Djindjić, B.; Stojiljković, M.; Kocić, G.; Cvetanović, G.; Dimitrijević, N. Evaluation of ghrelin and leptin levels in obese, lean and undernourished children. Vojnosanit. Pregl. 2017, 74, 963–969. [Google Scholar] [CrossRef]
- Al-Amodi, H.S.; Abdelbasit, N.A.; Fatani, S.H.; Babakr, A.T.; Mukhtar, M.M. The effect of obesity and components of metabolic syndrome on leptin levels in Saudi women. Diabetes Metab. Syndr. Clin. Res. Rev. 2018, 12, 357–364. [Google Scholar] [CrossRef]
- Pico, C.; Palou, M.; Pomar, C.; Rodriguez, A.; Palou, A. Leptin as a key regulator of the adipose organ. Rev. Endocr. Metab. Disord. 2021. online ahead of print. [Google Scholar] [CrossRef] [PubMed]
- Ouerghi, N.; Feki, M.; Bragazzi, N.L.; Knechtle, B.; Hill, L.; Nikolaidis, P.T.; Bouassida, A. Ghrelin Response to Acute and Chronic Exercise: Insights and Implications from a Systematic Review of the Literature. Sport. Med. 2021, 51, 2389–2410. [Google Scholar] [CrossRef] [PubMed]
- Singh, P.; Zhang, Y.; Sharma, P.; Covassin, N.; Soucek, F. Statins decrease leptin expression in human white adipocytes. Physiological reports 2018, 6, 1–8. [Google Scholar] [CrossRef] [PubMed]
- Takahash, Y.; Satoh, M.; Tabuchi, T.; Nakamura, M. Prospective, randomized, single-blind comparison of effects of 6 months’ treatment with atorvastatin versus pravastatin on leptin and angiogenic factors in patients with coronary artery disease. Heart Vessel. 2012, 27, 337–343. [Google Scholar] [CrossRef] [PubMed]
- Al-Azzam, S.I.; Alkhateeb, A.M.; Alzoubi, K.H.; Alzayadeen, R.N.; Ababneh, M.A.; Khabour, O.F. Atorvastatin treatment modulates the interaction between leptin and adiponectin, and the clinical parameters in patients with type II diabetes. Exp. Ther. Med. 2013, 6, 1565–1569. [Google Scholar] [CrossRef] [PubMed]
- Szotowska, M.; Czerwienska, B.; Adamczak, M.; Chudek, J.; Wiecek, A. Effect of low-dose atorvastatin on plasma concentrations of adipokines in patients with metabolic syndrome. Kidney Blood Press. Res. 2012, 35, 226–232. [Google Scholar] [CrossRef] [PubMed]
- Sahebkar, A.; Giua, R.; Pedone, C. Impact of Statin Therapy on Plasma Leptin Concentrations: A Systematic Review and Meta-Analysis of Randomized Placebo-Controlled Trials. Br. J. Clin. Pharmacol. 2016, 82, 1674–1684. [Google Scholar] [CrossRef]
- Yorulmaz, H.; Ozkok, E.; Erguven, M.; Ates, G.; Aydın, I.; Tamer, S. Effect of simvastatin on mitochondrial enzyme activities, ghrelin, hypoxia-inducible factor 1α in hepatic tissue during early phase of sepsis. Int. J. Clin. Exp. Med. 2015, 8, 3640–3650. [Google Scholar] [PubMed]
- Gruzdeva, O.; Uchasova, E.; Dyleva, Y.; Akbasheva, O.; Karetnikova, V.; Shilov, A.; Barbarash, O. Effect of different doses of statins on the development of type 2 diabetes mellitus in patients with myocardial infarction. Diabetes Metab. Syndr. Obes. Targets Ther. 2017, 10, 481–489. [Google Scholar] [CrossRef] [PubMed][Green Version]
- Pothiwala, P.; Jain, S.K.; Subhashini, Y. Metabolic syndrome and cancer. Metab. Syndr. Relat. Disord. 2009, 7, 279–287. [Google Scholar] [CrossRef]
- Catalán, V.; Gómez-Ambrosi, J.; Rodríguez, A.; Frühbeck, G. Adipose tissue immunity and cancer. Front. Physiol. 2013, 4, 1–13. [Google Scholar] [CrossRef]
- Alexescu, T.G.; Cozma, A.; Sitar-Tăut, A.; Negrean, V.; Handru, M.I.; Motocu, M.; Tohănean, N.; Lencu, C.; Para, I. Cardiac Changes in Overweight and Obese Patients. Rom. J. Intern. Med. 2016, 54, 161–172. [Google Scholar] [CrossRef] [PubMed]
- Cooper, I.; Brookler, K.; Crofts, C. Rethinking Fragility Fractures in Type 2 Diabetes: The Link between Hyperinsulinaemia and Osteofragilitas. Biomedicines 2021, 9, 1165. [Google Scholar] [CrossRef]
- Sitar Taut, A.V.; Pop, D.; Zdrenghea, D.T. NT-proBNP values in elderly heart failure patients with atrial fibrillation and diabetes. J. Diabetes Complicat. 2015, 29, 1119–1123. [Google Scholar] [CrossRef]
- Dadarlat-Pop, A.; Sitar-Taut, A.-V.; Zdrenghea, D.; Caloian, B.; Tomoaia, R.; Pop, D.; Buzoianu, A. Profile of Obesity and Comorbidities in Elderly Patients with Heart Failure. Clin. Interv. Aging 2020, 15, 547–556. [Google Scholar] [CrossRef] [PubMed]
- Ernst, M.C.; Sinal, C.J. Chemerin: At the crossroads of inflammation and obesity. Trends Endocrinol. Metab. 2010, 21, 660–667. [Google Scholar] [CrossRef] [PubMed]
- Gateva, A.; Assyov, Y.; Tsakova, A.; Kamenov, Z. Classical (adiponectin, leptin, resistin) and new (chemerin, vaspin, omentin) adipocytokines in patients with prediabetes. Horm. Mol. Biol. Clin. Investig. 2018, 34, 1–9. [Google Scholar] [CrossRef] [PubMed]
- Calabrò, P.; Golia, E.; Maddaloni, V.; Malvezzi, M.; Casillo, B.; Marotta, C.; Calabrò, R.; Golino, P. Adipose tissue-mediated inflammation: The missing link between obesity and cardiovascular disease? Intern. Emerg. Med. 2009, 4, 25–34. [Google Scholar] [CrossRef] [PubMed]
- Reddy, P.; Lent-Schochet, D.; Ramakrishnan, N.; McLaughlin, M.; Jialal, I. Metabolic syndrome is an inflammatory disorder: A conspiracy between adipose tissue and phagocytes. Clin. Chim. Acta 2019, 496, 35–44. [Google Scholar] [CrossRef]
- Weinstein, A.R.; Sesso, H.D.; Lee, I.M.; Cook, N.R.; Manson, J.A.E.; Buring, J.E.; Gaziano, J.M. Relationship of physical activity vs body mass index with type 2 diabetes in women. J. Am. Med. Assoc. 2004, 292, 1188–1194. [Google Scholar] [CrossRef] [PubMed]
- Minciună, I.A.; Orășan, O.H.; Minciună, I.; Lazar, A.L.; Sitar-Tăut, A.V.; Oltean, M.; Tomoaia, R.; Puiu, M.; Sitar-Tăut, D.A.; Pop, D.; et al. Assessment of subclinical diabetic cardiomyopathy by speckle-tracking imaging. Eur. J. Clin. Investig. 2021, 51, e13475. [Google Scholar] [CrossRef] [PubMed]
- Capparelli, R.; Iannelli, D. Role of epigenetics in type 2 diabetes and obesity. Biomedicines 2021, 9, 977. [Google Scholar] [CrossRef]
- Kim, K.S.; Lee, J.S.; Park, J.H.; Lee, E.Y.; Moon, J.S.; Lee, S.K.; Lee, J.S.; Kim, J.H.; Kim, H.S. Identification of novel biomarker for early detection of diabetic nephropathy. Biomedicines 2021, 9, 457. [Google Scholar] [CrossRef]
- Fringu, F.; Sitar-Taut, A.; Caloian, B.; Zdrenghea, D.; Comsa, D.; Gusetu, G.; Pop, D. The role of NT pro-BNP in the evaluation of diabetic patients with heart failure. Endocr. Care 2020, XVI, 183–191. [Google Scholar] [CrossRef]
- Sitar-Taut, D.-A.; Mocean, L.; Sitar-Taut, A.-V. Research about implementing E-PROCORD—New medical and modeling approaches in IT & C age applied on cardiovascular profile evaluation at molecular level. J. Appl. Quant. Methods 2009, 4, 175–189. [Google Scholar]
- Crujeiras, A.B.; Díaz-Lagares, A.; Abete, I.; Goyenechea, E.; Amil, M.; Martínez, J.A.; Casanueva, F.F. Pre-treatment circulating leptin/ghrelin ratio as a non-invasive marker to identify patients likely to regain the lost weight after an energy restriction treatment. J. Endocrinol. Investig. 2014, 37, 119–126. [Google Scholar] [CrossRef]
- Perakakis, N.; Farr, O.M.; Mantzoros, C.S. Leptin in Leanness and Obesity. J. Am. Coll. Cardiol. 2021, 77, 745–760. [Google Scholar] [CrossRef] [PubMed]
- Lee, M.-W.; Lee, M.; Oh, K.-J. Adipose Tissue-Derived Signatures for Obesity and Type 2 Diabetes: Adipokines, Batokines and MicroRNAs. J. Clin. Med. 2019, 8, 854. [Google Scholar] [CrossRef] [PubMed]
- Friedman, J.M. Leptin and the endocrine control of energy balance. Nat. Metab. 2019, 1, 754–764. [Google Scholar] [CrossRef] [PubMed]
- Dadarlat-Pop, A.; Pop, D.; Procopciuc, L.; Sitar-Taut, A.; Zdrenghea, D.; Bodizs, G.; Tomoaia, R.; Gurzau, D.; Fringu, F.; Susca-Hojda, S.; et al. Leptin, galectin-3 and angiotensin II type 1 receptor polymorphism in overweight and obese patients with heart failure—Role and functional interplay. Int. J. Gen. Med. 2021, 14, 1727–1737. [Google Scholar] [CrossRef] [PubMed]
- Wozniak, S.E.; Gee, L.L.; Wachtel, M.S.; Frezza, E.E. Adipose tissue: The new endocrine organ? A review article. Dig. Dis. Sci. 2009, 54, 1847–1856. [Google Scholar] [CrossRef]
- Hajimohammadi, M.; Shab-Bidar, S.; Neyestani, T.R. Consumption of vitamin D-fortified yogurt drink increased leptin and ghrelin levels but reduced leptin to ghrelin ratio in type 2 diabetes patients: A single blind randomized controlled trial. Eur. J. Nutr. 2017, 56, 2029–2036. [Google Scholar] [CrossRef]
- Daghestani, M.H.; Daghestani, M.; Daghistani, M.; El-Mazny, A.; Bjørklund, G.; Chirumbolo, S.; Al Saggaf, S.H.; Warsy, A. A study of ghrelin and leptin levels and their relationship to metabolic profiles in obese and lean Saudi women with polycystic ovary syndrome (PCOS). Lipids Health Dis. 2018, 17, 1–9. [Google Scholar] [CrossRef]
- Sitar-Taut, A.-V.; Coste, S.C.; Tarmure, S.; Orasan, O.H.; Fodor, A.; Negrean, V.; Pop, D.; Zdrenghea, D.; Login, C.; Tiperciuc, B.; et al. Diabetes and Obesity-Cumulative or Complementary Effects On Adipokines, Inflammation, and Insulin Resistance. J. Clin. Med. 2020, 9, 2767. [Google Scholar] [CrossRef]
- Yamada, C. Relationship between orexigenic peptide ghrelin signal, gender difference and disease. Int. J. Mol. Sci. 2021, 22, 3763. [Google Scholar] [CrossRef] [PubMed]
- Alamri, B.N.; Shin, K.; Chappe, V.; Anini, Y. The role of ghrelin in the regulation of glucose homeostasis. Horm. Mol. Biol. Clin. Investig. 2016, 26, 3–11. [Google Scholar] [CrossRef] [PubMed]
- Kadoglou, N.P.E.; Lampropoulos, S.; Kapelouzou, A.; Gkontopoulos, A.; Theofilogiannakos, E.K.; Fotiadis, G.; Kottas, G. Serum levels of apelin and ghrelin in patients with acute coronary syndromes and established coronary artery disease-KOZANI STUDY. Transl. Res. 2010, 155, 238–246. [Google Scholar] [CrossRef] [PubMed]
- Lv, Y.; Liang, T.; Wang, G.; Li, Z. Ghrelin, a gastrointestinal hormone, regulates energy balance and lipid metabolism. Biosci. Rep. 2018, 38, BSR20181061. [Google Scholar] [CrossRef]
- Tuero, C.; Valenti, V.; Rotellar, F.; Landecho, M.F.; Cienfuegos, J.A.; Frühbeck, G. Revisiting the Ghrelin Changes Following Bariatric and Metabolic Surgery. Obes. Surg. 2020, 30, 2763–2780. [Google Scholar] [CrossRef]
- Rodríguez, A. Novel molecular aspects of ghrelin and leptin in the control of adipobiology and the cardiovascular system. Obes. Facts 2014, 7, 82–95. [Google Scholar] [CrossRef]
- Pop, D.; Peter, P.; Dădârlat, A.; Sitar-Tăut, A.; Zdrenghea, D. Serum ghrelin level is associated with cardiovascular risk score. Rom. J. Intern. Med. 2015, 53, 140–145. [Google Scholar] [CrossRef] [PubMed]
- Poykko, S. Ghrelin, Metabolic Risk Factors and Carotid Artery Atherosclerosis; University of Oulu: Oulu, Finland, 2005; ISBN 9514276558. [Google Scholar]
- Poykko, S.; Kellokoski, E.; Horkko, S.; Kauma, H.; Kesaniemi, Y.; Ukkola, O. Low plasma ghrelin is associated with insulin resistance, hypertension and the prevalence of type 2 diabetes. Diabetes 2003, 52, 2546–2553. [Google Scholar] [CrossRef]
- Razzaghy-Azar, M.; Nourbakhsh, M.; Pourmoteabed, A.; Nourbakhsh, M.; Ilbeigi, D.; Khosravi, M. An Evaluation of Acylated Ghrelin and Obestatin Levels in Childhood Obesity and Their Association with Insulin Resistance, Metabolic Syndrome, and Oxidative Stress. J. Clin. Med. 2016, 5, 61. [Google Scholar] [CrossRef]
- Verdeş, G.; Duţă, C.C.; Popescu, R.; Mituleţu, M.; Ursoniu, S.; Lazăr, O.F. Correlation between leptin and ghrelin expression in adipose visceral tissue and clinical-biological features in malignant obesity. Rom. J. Morphol. Embryol. 2017, 58, 923–929. [Google Scholar]
- Korek, E.; Krauss, H.; Gibas-Dorna, M.; Kupsz, J.; Piątek, M.; Piątek, J. Fasting and postprandial levels of ghrelin, leptin and insulin in lean, obese and anorexic subjects. Prz. Gastroenterol. 2013, 8, 383–389. [Google Scholar] [CrossRef] [PubMed]
- Mohamed, W.S.; Hassanien, M.; Abokhosheim, K. Role of Ghrelin, Leptin and Insulin Resistance in Development of Metabolic Syndrome in Obese Patients. Endocrinol. Metab. Syndr. 2014, 3, 1–6. [Google Scholar] [CrossRef]
- Dzaja, A.; Dalal, M.A.; Himmerich, H.; Uhr, M.; Pollmächer, T.; Schuld, A. Sleep enhances nocturnal plasma ghrelin levels in healthy subjects. Am. J. Physiol. Endocrinol. Metab. 2004, 286, 963–967. [Google Scholar] [CrossRef]
- Motivala, S.J.; Tomiyama, A.J.; Ziegler, M.; Khandrika, S.; Irwin, M.R. Nocturnal levels of ghrelin and leptin and sleep in chronic insomnia. Psychoneuroendocrinology 2009, 34, 540–545. [Google Scholar] [CrossRef] [PubMed]
- Lindqvist, A.; Shcherbina, L.; Prasad, R.B.; Miskelly, M.G.; Abels, M.; Martínez-Lopéz, J.A.; Fred, R.G.; Nergård, B.J.; Hedenbro, J.; Groop, L.; et al. Ghrelin suppresses insulin secretion in human islets and type 2 diabetes patients have diminished islet ghrelin cell number and lower plasma ghrelin levels. Mol. Cell. Endocrinol. 2020, 511, 110835. [Google Scholar] [CrossRef] [PubMed]
- Labayen, I.; Ortega, F.B.; Ruiz, J.R.; Lasa, A.; Simón, E.; Margareto, J. Role of baseline leptin and ghrelin levels on body weight and fat mass changes after an energy-restricted diet intervention in obese women: Effects on energy metabolism. J. Clin. Endocrinol. Metab. 2011, 96, 996–1000. [Google Scholar] [CrossRef] [PubMed]
- Pickhardt, P.J.; Graffy, P.M.; Zea, R.; Lee, S.J.; Liu, J.; Sandfort, V.; Summers, R.M. Utilizing fully automated abdominal CT-based biomarkers for opportunistic screening for metabolic syndrome in adults without symptoms. Am. J. Roentgenol. 2021, 216, 85–92. [Google Scholar] [CrossRef] [PubMed]
- Yoon, J.H.; Park, J.K.; Oh, S.S.; Lee, K.H.; Kim, S.K.; Cho, I.J.; Kim, J.K.; Kang, H.T.; Ahn, S.G.; Lee, J.W.; et al. The ratio of serum leptin to adiponectin provides adjunctive information to the risk of metabolic syndrome beyond the homeostasis model assessment insulin resistance: The Korean Genomic Rural Cohort Study. Clin. Chim. Acta 2011, 412, 2199–2205. [Google Scholar] [CrossRef]
- Cozma, A.; Fodor, A.; Orăsan, O.H.; Suharoschi, R.; Muresan, C.; Vulturar, R.; Sampelean, D.; Negrean, V.; Pop, D.; Sitar-Tăut, A. A comparison between insulin resistance scores parameters in identifying patients with metabolic syndrome. Stud. Univ. Babes-Bolyai Chem. 2019, 64, 147–159. [Google Scholar] [CrossRef]
- Blum, M.R.; Popat, R.A.; Nagy, A.; Cataldo, N.A.; McLaughlin, T.L. Using metabolic markers to identify insulin resistance in premenopausal women with and without polycystic ovary syndrome. J. Endocrinol. Investig. 2021, 44, 2123–2130. [Google Scholar] [CrossRef]


| Normal Weight | Overweight | Obese | p-Value | MetS− | MetS+ | p*-Value | ||
|---|---|---|---|---|---|---|---|---|
| Patients | 12 (20) | 31 (51.7) | 17 (28.3) | 17 (28.3) | 43 (71.7) | |||
| Age | 64.58 ± 8.09 | 63.29 ± 10.79 | 57.41 ± 9.01 | p = 0.08 | 59.88 ± 9.17 | 62.67 ± 10.42 | p = 0.33 | |
| Gender | Female | 10 (83.33) | 22 (70.96) | 12 (70.58) | p = 0.48 | 14 (82.35) | 30 (69.76) | p = 0.50 |
| Male | 2 (16.66) | 9 (29.03) | 5 (29.41) | 3 (17.64) | 13 (30.23) | |||
| WC | 85.16 ± 9.59 | 97.48 ± 7.16 | 107.70 ± 6.88 | p < 0.001 | 91.76 ± 11.73 | 100.34 ± 9.5 | p = 0.0046 | |
| BMI (kg/m2) | 23.22 ± 1.89 | 27.68 ± 1.52 | 33.59 ± 2.35 | p < 0.001 | 25.98 ± 3.99 | 29.44 ± 3.75 | p = 0.0025 | |
| Systolic blood pressure | 126.25 ± 17.46 (120) | 133.22 ± 16.66 (130) | 134.41 ± 17.84 130) | p = 0.40 | 120.58 ± 14.45 | 136.74 ± 16.03 | p = 0.0006 | |
| Diastolic blood pressure * | 75.41 ± 5.82 (80) | 86.45 ± 20.46 (80) | 84.41 ± 13.67 (80) | p = 0.049 | 77.94 ± 10.16 (80) | 85.93 ± 18.62 (80) | p = 0.072 | |
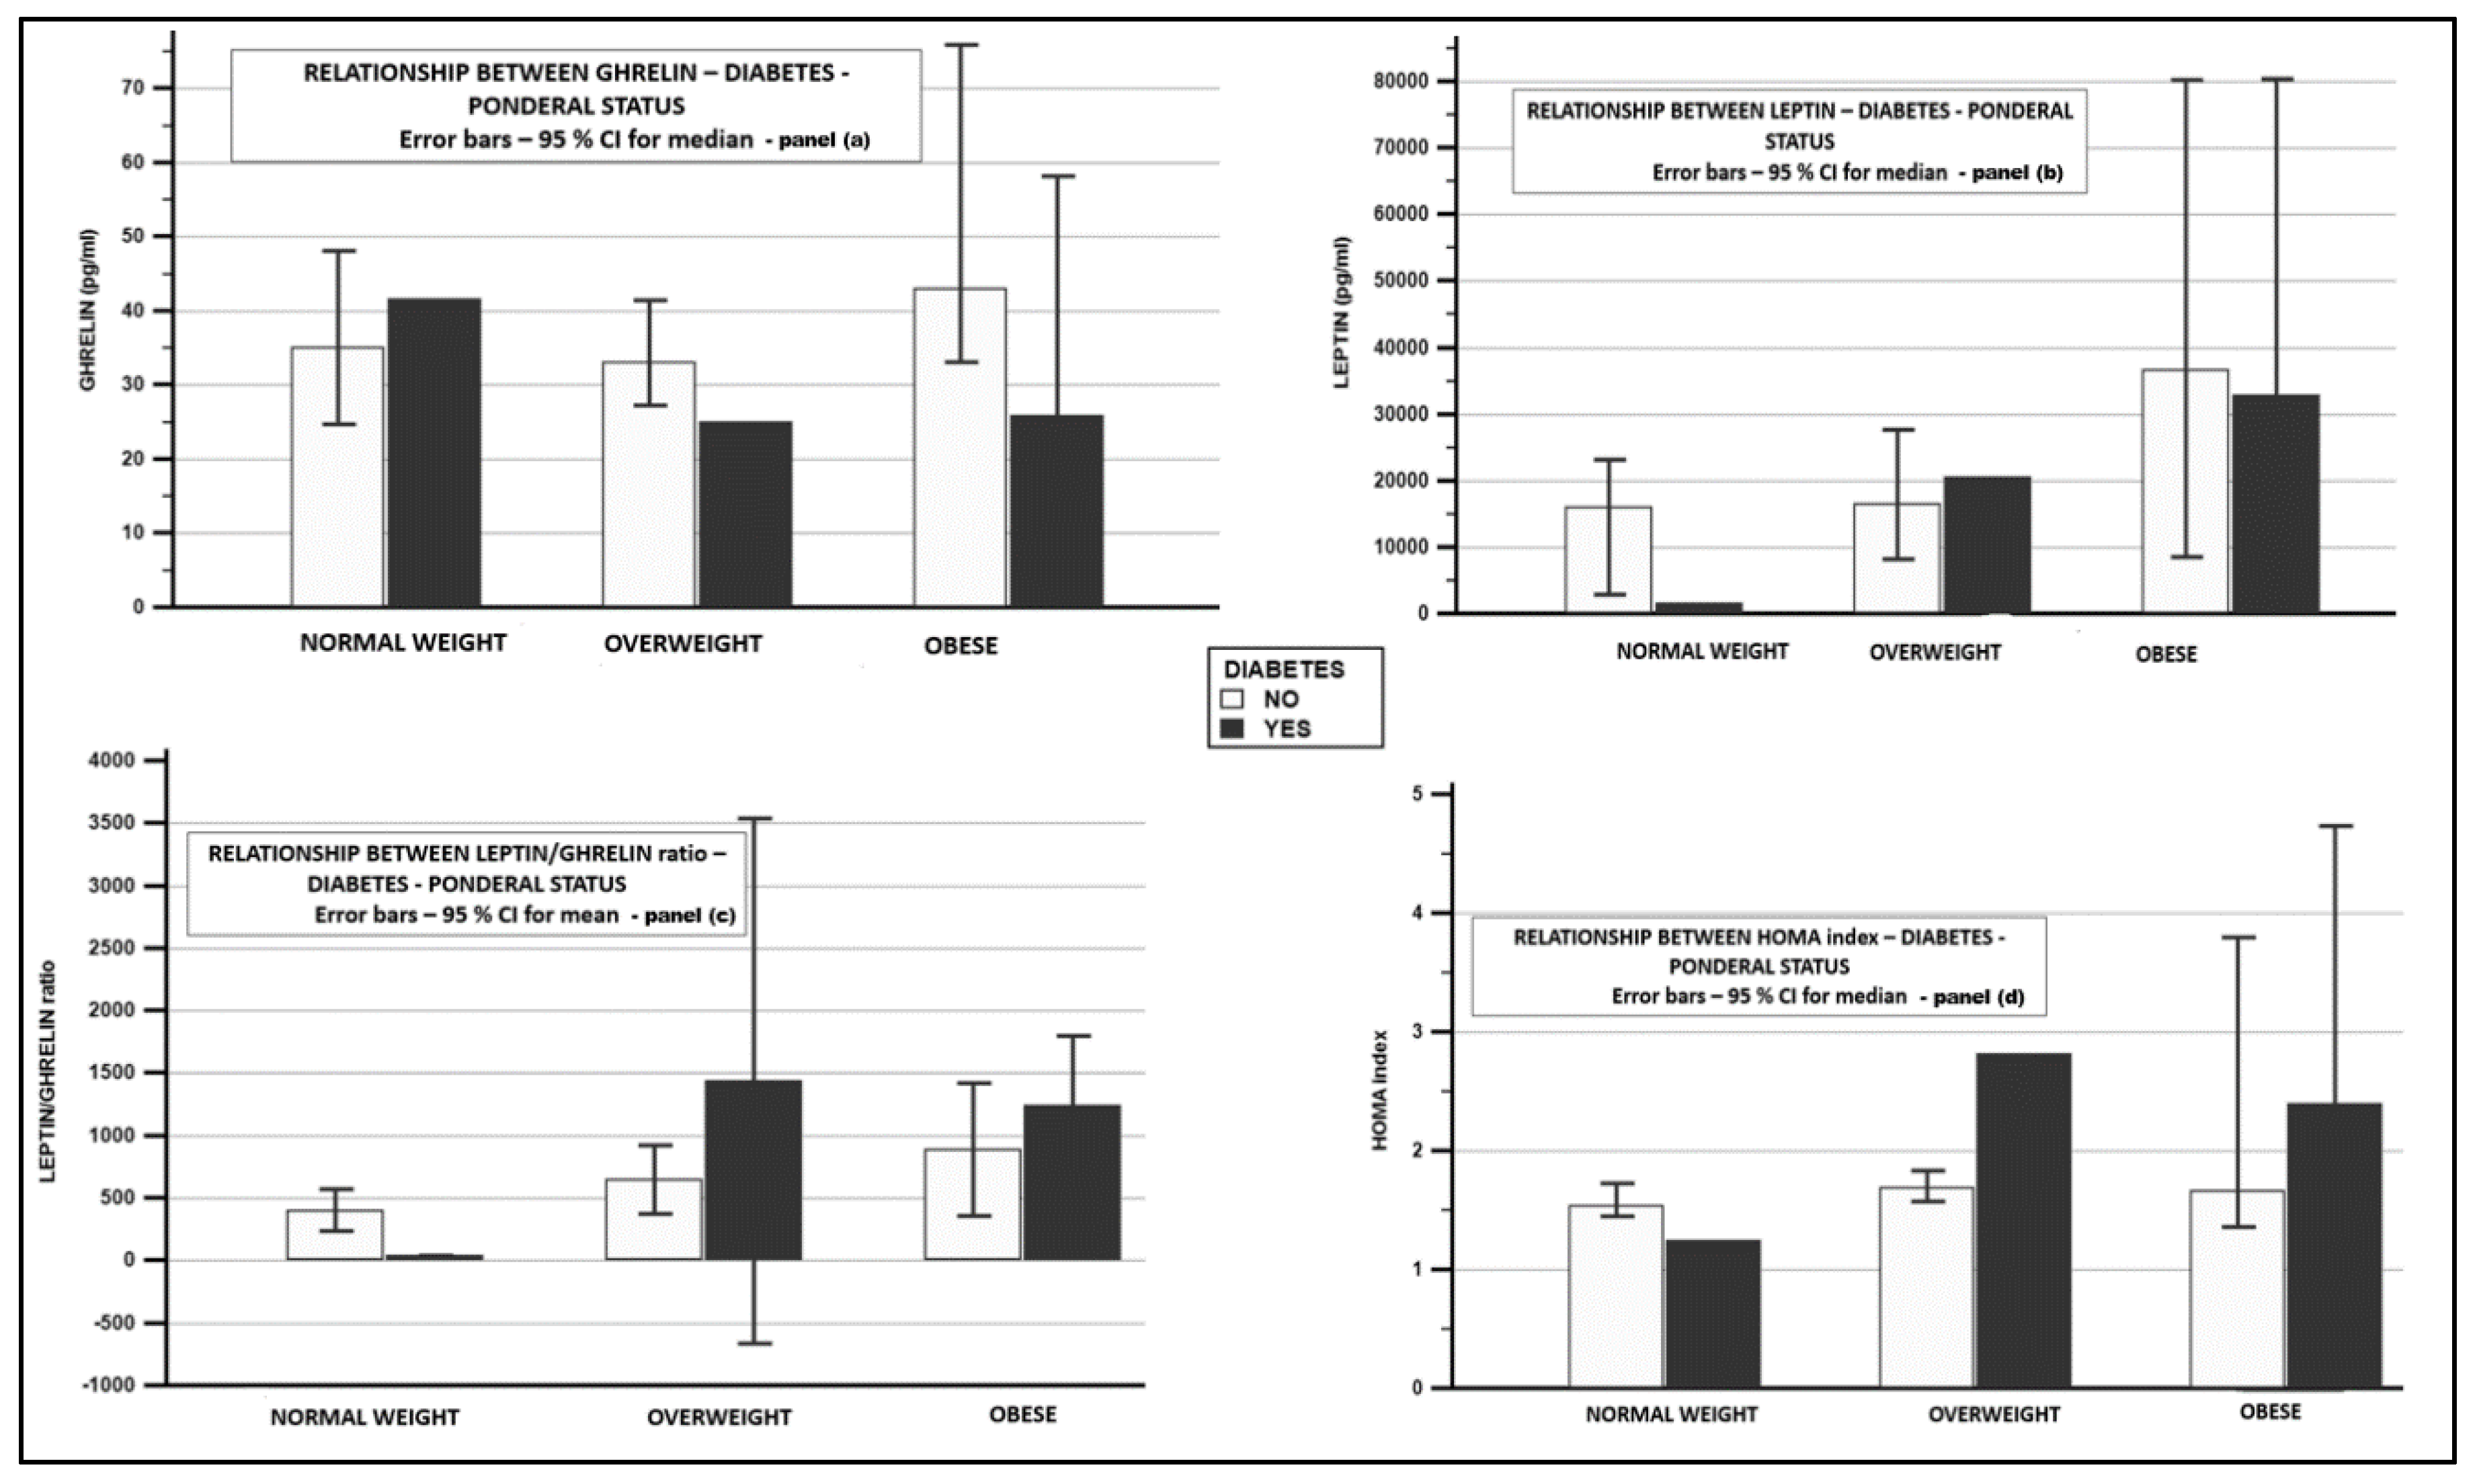
| Diabetes | Yes | 1(8.33) | 5 (16.12) | 8 (47.05) | p = 0.0099 | 0 (0) | 14 (32.55) | p = 0.0189 |
| No | 11 (91.66) | 26 (83.87) | 9(52.94) | 17 (100) | 29 (67.44) | |||
| Hypertension | Yes | 7 (58.33) | 25 (80.64) | 15 (88.23) | p = 0.06 | 8 (47.05) | 39 (90.69) | p = 0.0008 |
| No | 5(41.66) | 6 (19.35) | 2 (11.76) | 9 (52.94) | 4 (9.3) | |||
| Current smokers | Yes | 2 (16.66) | 5 (16.12) | 4 (23.52) | p = 0.60 | 3 (17.64) | 8 (18.60) | p = 0.77 |
| No | 10 (83.33) | 26 (83.87) | 13 (76.47) | 14 (82.35) | 35 (81.39) | |||
| Glycemia * (mg/dL) | 86.50 ± 6.54 (86) | 101.12 ± 45.77 (91) | 110.76 ± 30.31 (105) | p = 0.016 | 85.94 ± 8.09 (86) | 106.86 ± 42.48 (97) | p = 0.005 | |
| Dyslipidemia | Yes | 9 (75) | 20 (64.51) | 12 (70.58) | p = 0.86 | 12 (70.58) | 29 (67.44) | p = 0.94 |
| No | 3 (25) | 11 (35.48) | 5 (29.41) | 5 (29.41) | 14 (32.55) | |||
| Total-C (mg/dL) | 224.5 ± 51.60 | 207.83 ± 40.86 | 210.82 ± 61 | p = 0.60 | 220.94 ± 41.63 | 208.48 ± 51.58 | p = 0.37 | |
| LDL-C (mg/dL) | 146 ± 42.13 | 134.67 ± 30.87 | 129.58 ± 47.03 | p = 0.52 | 143.76 ± 35.84 | 132.23 ± 38.81 | p = 0.29 | |
| Triglycerides (mg/dL) | 165.08 ± 68.23 | 149.77 ± 67.05 | 171.70 ± 89.11 | p = 0.59 | 122.76 ± 47.64 | 173.39 ± 77.37 | p = 0.003 | |
| HDL-C (mg/dL) | 45.50 ± 8.67 | 43.22 ± 10.42 | 40.82 ± 9.37 | p = 0.44 | 52.70 ± 8.32 | 39.16 ± 7.41 | p < 0.0001 | |
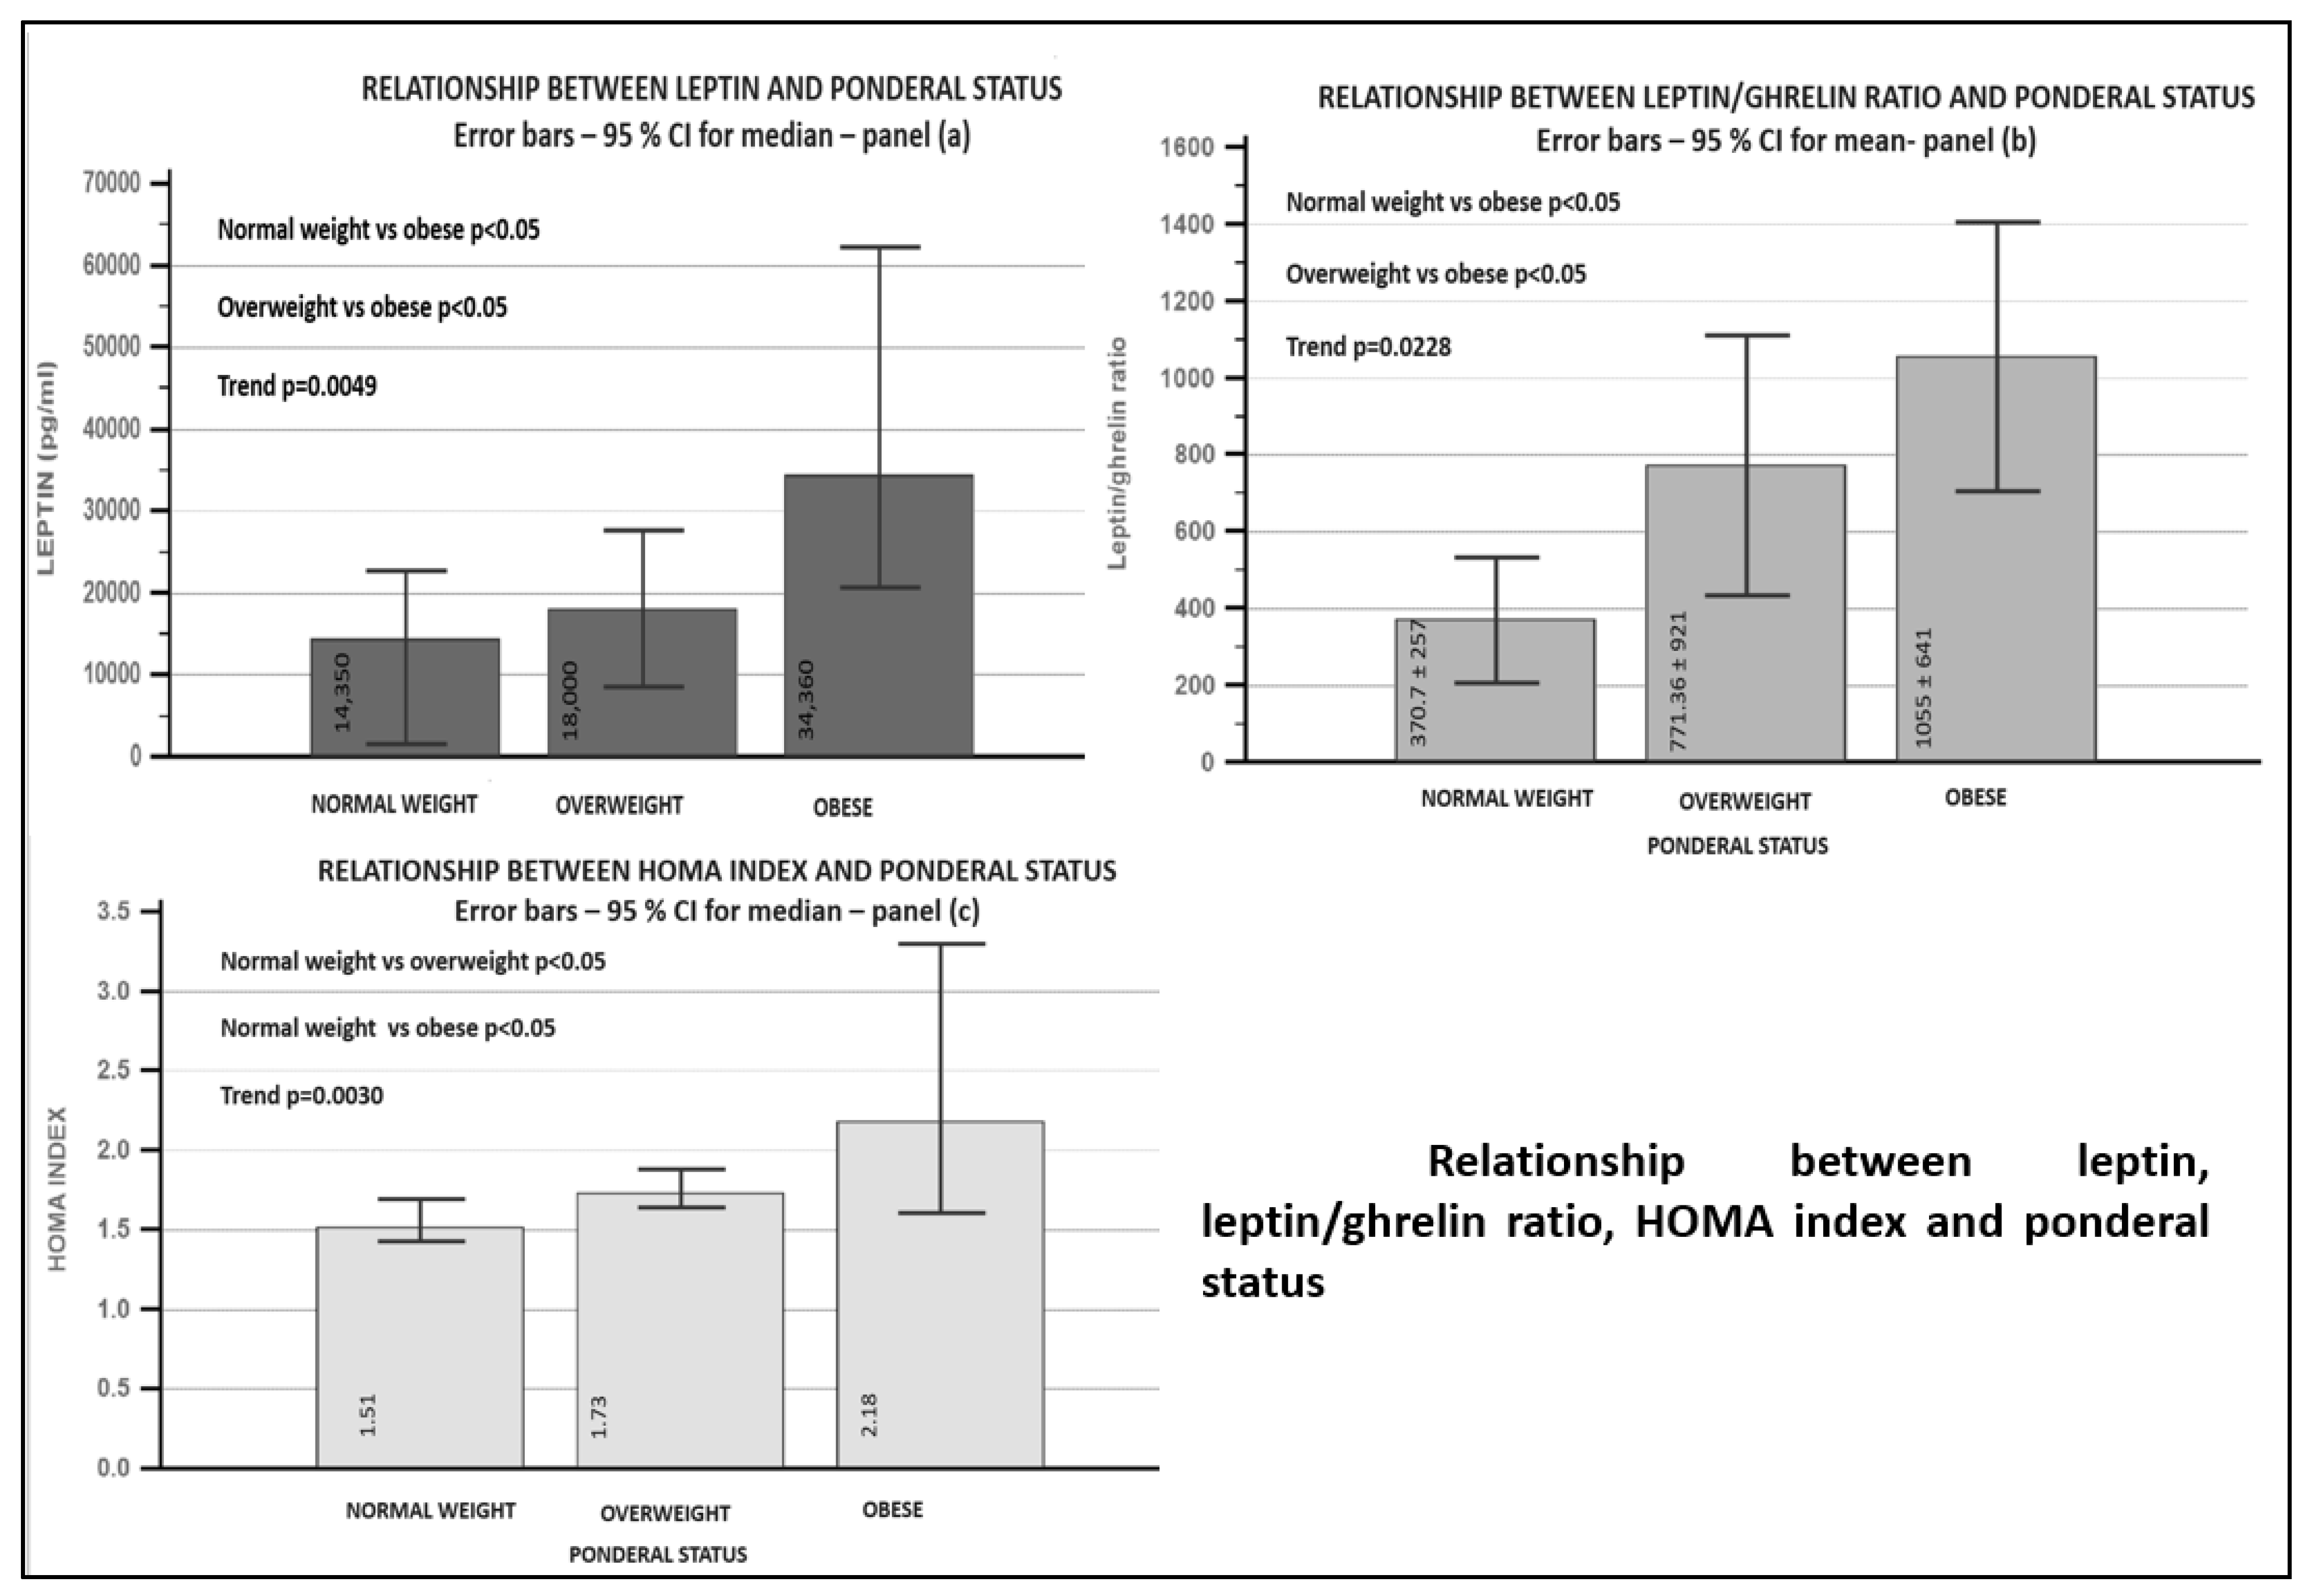
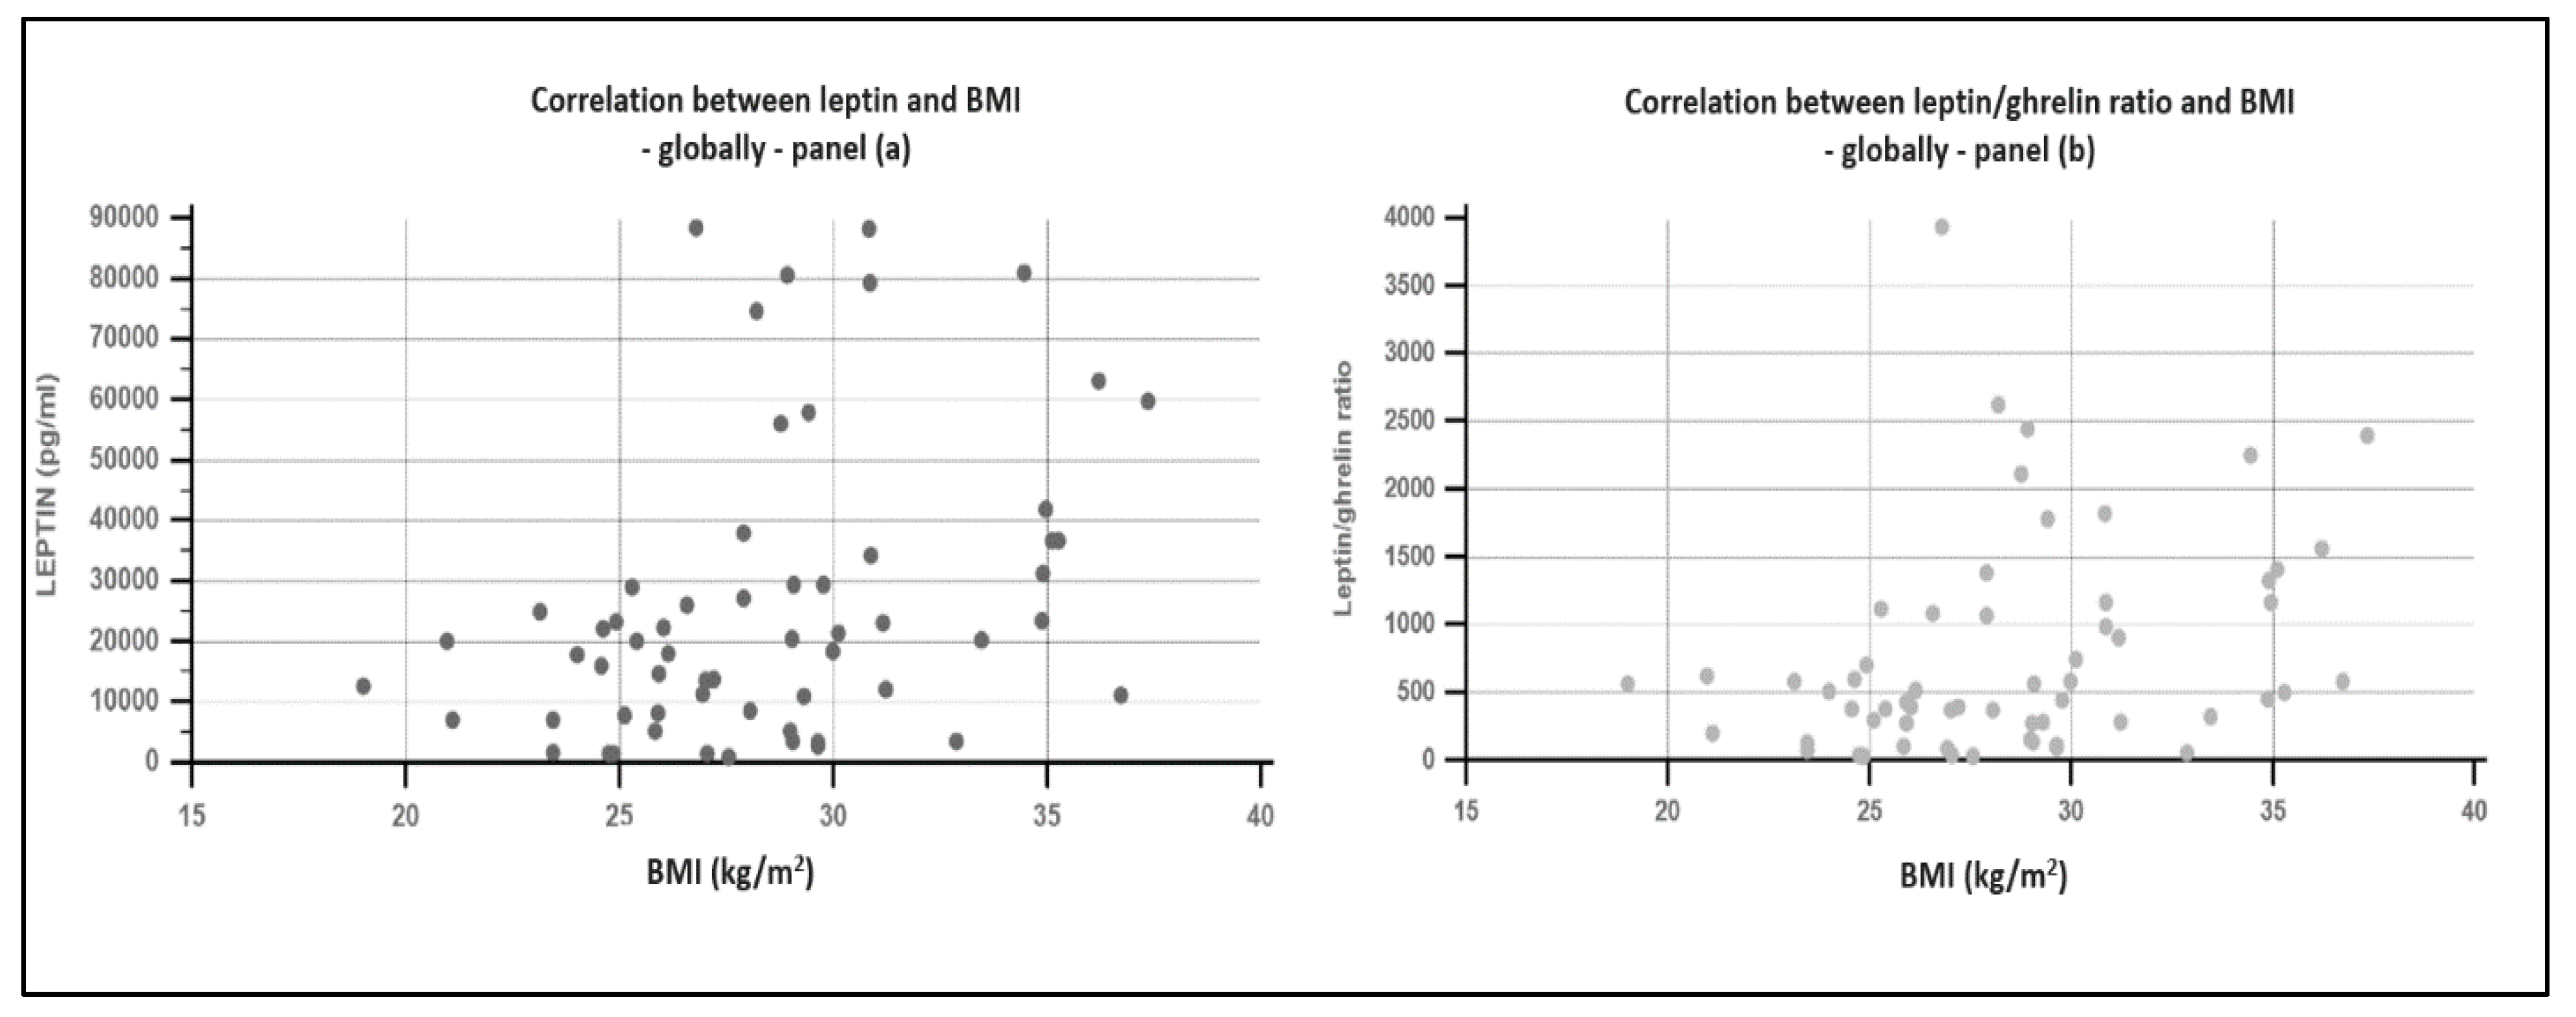
| Leptin * (pg/mL) | 13,004 ± 8955 (14,350) | 24,134 ± 23,769 (18,000) | 39,284 ± 26,063 (34,360) | p = 0.0049 | 19,132 ± 19,904 (13,640) | 28,995 ± 25,027 (21,500) | p = 0.11 | |
| Insulin (μU/mL) * | 7.19 ± 0.28 (7.05) | 7.97 ± 1.35 (7.4) | 9.02 ± 3.43 (7.5) | p = 0.008 | 7.35 ± 0.41 (7.3) | 8.41 ± 2.45 (7.4) | p = 0.08 | |
| HOMA index * | 1.53 ± 0.15 (1.51) | 2.06 ± 1.41 (1.73) | 2.46 ± 1.07 (2.18) | p = 0.003 | 1.56 ± 0.19 (1.57) | 2.27 ± 1.36 (1.83) | p = 0.0040 | |
| Ghrelin * (pg/mL) | 37.16 ± 9.49 (36) | 39.11 ± 21.81 (33) | 42.02 ± 18.76 (36) | p = 0.70 | 42.91 ± 25.07 (36) | 38.22 ± 15.99 (33) | p = 0.37 | |
| Leptin/ghrelin ratio | 370.70 ± 257 (448) | 771.36 ± 921 (396.46) | 1055.31 ± 681.64 (985) | p = 0.0228 | 525.03 ± 584.30 (368) | 869.19 ± 845 (564) | p = 0.0797 |
| DM + | DM− | p Global | p Women | p Men | |||||
|---|---|---|---|---|---|---|---|---|---|
| Global | Women | Men | Global | Women | Men | ||||
| 14 (23.3%) patients | 9 | 5 | 46 (76.7%) patients | 35 | 11 | ||||
| Leptin * (pg/mL) | 36,309 ± 30,848 (27,190) | 51,488 ± 28,168 (36,650) | 8986 ± 7366 (8500) | 23,124 ± 20,867 (18,270) | 27,942 ± 21,395 (22,200) | 7797.27 ± 7971 (5150) | p = 0.13 | p = 0.0074 | p = 0.58 |
| Insulin (μU/mL) * | 9.2 ± 3.28 (7.75) | 10.17 ± 3.79 (9.3) | 7.44 ± 0.35 (7.5) | 7.78 ± 1.55 (7.4) | 7.93 ± 1.75 (7.4) | 7.32 ± 0.40 (7.2) | p = 0.0253 | p = 0.0118 | p = 0.58 |
| HOMA index * | 3.06 ± 2.04 (2.39) | 3.62 ± 2.36 (2.69) | 2.04 ± 0.58 (2.12) | 1.77 ± 0.53 (1.64) | 1.79 ± 0.59 (1.64) | 1.71 ± 0.29 (1.67) | p = 0.0002 | p = 0.0002 | p = 0.26 |
| Ghrelin * (pg/mL) | 34.14 ± 16.54 (25.7) | 34.16 ± 16.92 (26) | 34.10 ± 17.79 (25) | 41.19 ± 19.42 (35.5) | 42.67 ± 21.35 (36) | 36.50 ± 10.79 (33) | p = 0.0409 | p = 0.0626 | p = 0.44 |
| Leptin/ghrelin ratio | 1224.71 ± 1114 (1035) | 1742.93 ± 1072 (1409) | 291.93 ± 213 (326.45) | 633.80 ± 615.7 (450.99) | 762.04 ± 644 (564) | 225.79 ± 228 (110) | p = 0.0131 | p = 0.0055 | p = 0.58 |
| Global | Normal Weight | Overweight | Obese | p | MetS− | MetS+ | p* | DM− | DM+ | p+ | |
|---|---|---|---|---|---|---|---|---|---|---|---|
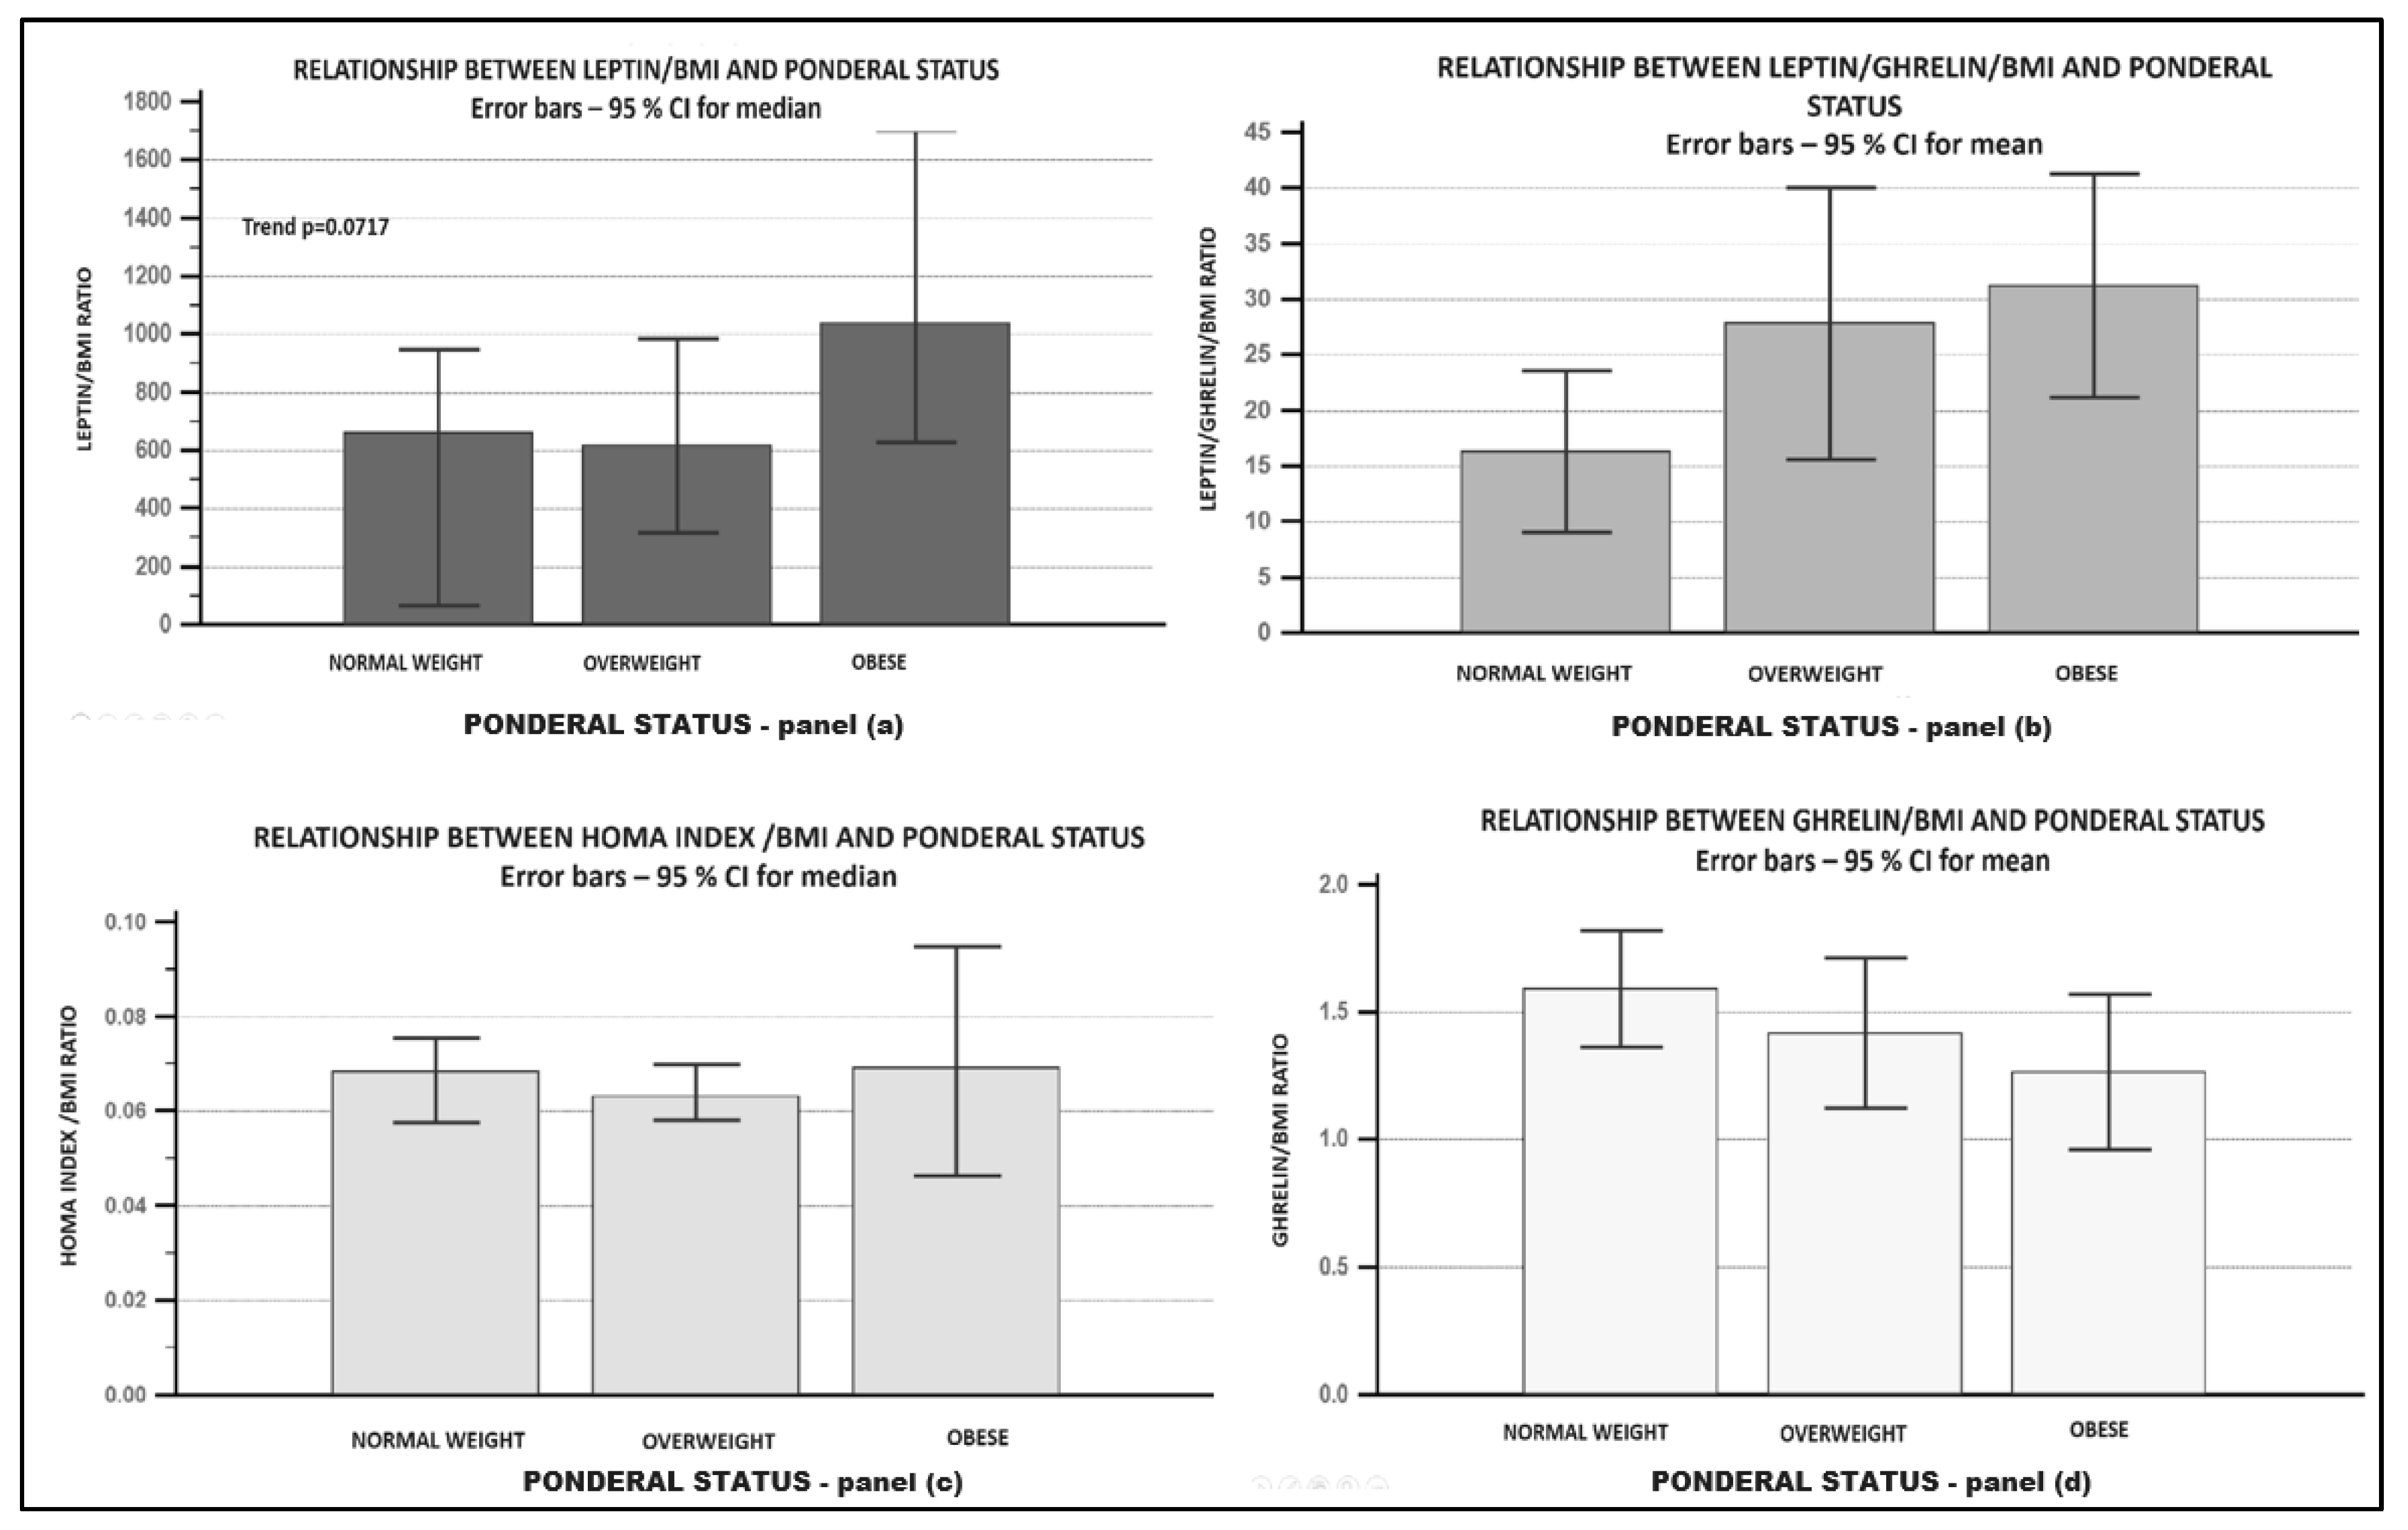
| L/BMI ratio * | 894.15 ± 781 (710) | 564.48 ± 381 (660.24) | 868.03 ± 845 (618.61) | 1174.49 ± 803 (1039.12) | p = 0.0717 | 687.47 ± 589 (570.82) | 975.86 ± 837 (741.97) | p = 0.25 | 808.3 ± 661 (680) | 1176 ± 1070 (818.96) | p=0.33 |
| G/BMI ratio | 1.41 ± 0.68 | 1.59 ± 0.35 | 1.41 ± 0.8 | 1.26 ± 0.58 | p = 0.44 | 1.66 ± 0.92 | 1.31 ± 0.53 | p = 0.07 | 1.49 ± 0.68 | 1.12 ± 0.57 | p = 0.06 |
| L/G/BMI ratio | 26.47 ± 26.83 | 16.28 ± 11.48 | 27.82 ± 33.3 | 31.20 ± 19.47 | p = 0.31 | 18.98 ± 17.84 | 29.43 ± 29.29 | p = 0.09 | 22.47 ± 20.5 | 39.62 ± 39.58 | p = 0.03 |
| Women | Men | |||||||
|---|---|---|---|---|---|---|---|---|
| AUROC | Se | Sp | Criterion | AUROC | Se | Sp | Criterion | |
| L/G ratio | 0.690 | 60 | 78.6 | >600.54 | 0.923 | 76.9 | 100 | >101.98 |
| L | 0.706 | 83.3 | 57.1 | >17,910 | 0.821 | 53.8 | 100 | >5150 |
| G | 0.536 | 53.3 | 71.4 | ≤33 | 0.718 | 84.6 | 66.7 | ≤43 |
| HOMA | 0.752 | 53.33 | 100 | 1.83 | 0.654 | 38.46 | 100 | 1.83 |
Publisher’s Note: MDPI stays neutral with regard to jurisdictional claims in published maps and institutional affiliations. |
© 2021 by the authors. Licensee MDPI, Basel, Switzerland. This article is an open access article distributed under the terms and conditions of the Creative Commons Attribution (CC BY) license (https://creativecommons.org/licenses/by/4.0/).
Share and Cite
Sitar-Tǎut, A.-V.; Cozma, A.; Fodor, A.; Coste, S.-C.; Orasan, O.H.; Negrean, V.; Pop, D.; Sitar-Tǎut, D.-A. New Insights on the Relationship between Leptin, Ghrelin, and Leptin/Ghrelin Ratio Enforced by Body Mass Index in Obesity and Diabetes. Biomedicines 2021, 9, 1657. https://doi.org/10.3390/biomedicines9111657
Sitar-Tǎut A-V, Cozma A, Fodor A, Coste S-C, Orasan OH, Negrean V, Pop D, Sitar-Tǎut D-A. New Insights on the Relationship between Leptin, Ghrelin, and Leptin/Ghrelin Ratio Enforced by Body Mass Index in Obesity and Diabetes. Biomedicines. 2021; 9(11):1657. https://doi.org/10.3390/biomedicines9111657
Chicago/Turabian StyleSitar-Tǎut, Adela-Viviana, Angela Cozma, Adriana Fodor, Sorina-Cezara Coste, Olga Hilda Orasan, Vasile Negrean, Dana Pop, and Dan-Andrei Sitar-Tǎut. 2021. "New Insights on the Relationship between Leptin, Ghrelin, and Leptin/Ghrelin Ratio Enforced by Body Mass Index in Obesity and Diabetes" Biomedicines 9, no. 11: 1657. https://doi.org/10.3390/biomedicines9111657
APA StyleSitar-Tǎut, A.-V., Cozma, A., Fodor, A., Coste, S.-C., Orasan, O. H., Negrean, V., Pop, D., & Sitar-Tǎut, D.-A. (2021). New Insights on the Relationship between Leptin, Ghrelin, and Leptin/Ghrelin Ratio Enforced by Body Mass Index in Obesity and Diabetes. Biomedicines, 9(11), 1657. https://doi.org/10.3390/biomedicines9111657