
CSF Heavy Neurofilament May Discriminate and Predict Motor Neuron Diseases with Upper Motor Neuron Involvement

 ,
, 

 ,
,  ,
, 
Abstract
:1. Introduction
2. Materials and Methods
2.1. Study Design, Standard Protocol Approval, and Recruitment
2.2. Participants
2.3. Sample Collection and Analysis
2.4. Statistics
3. Results
3.1. Patients Characteristics
3.2. CSF and Serum pNfH Concentrations in Different MND
3.3. Correlations of CSF and Serum pNfH Concentrations with Clinical Data and Disability Scores
3.4. Serum and CSF pNfH and Survival
4. Discussion
5. Conclusions
Author Contributions
Funding
Institutional Review Board Statement
Informed Consent Statement
Data Availability Statement
Acknowledgments
Conflicts of Interest
References
- Statland, J.M.; Barohn, R.J.; McVey, A.L.; Katz, J.S.; Dimachkie, M.M. Patterns of Weakness, Classification of Motor Neuron Disease, and Clinical Diagnosis of Sporadic Amyotrophic Lateral Sclerosis. Neurol. Clin. 2015, 33, 735–748. [Google Scholar] [CrossRef] [PubMed] [Green Version]
- Turner, M.R.; Barohn, R.J.; Corcia, P.; Fink, J.K.; Harms, M.B.; Kiernan, M.C.; Ravits, J.; Silani, V.; Simmons, Z.; Statland, J.; et al. Primary lateral sclerosis: Consensus diagnostic criteria. J. Neurol. Neurosurg. Psychiatry 2020, 91, 373–377. [Google Scholar] [CrossRef] [Green Version]
- Chiò, A.; Calvo, A.; Moglia, C.; Mazzini, L.; Mora, G.; PARALS Study Group. Phenotypic heterogeneity of amyotrophic lateral sclerosis: A population based study. J. Neurol. Neurosurg. Psychiatry 2011, 82, 740–746. [Google Scholar] [CrossRef]
- Finegan, E.; Chipika, R.H.; Shing, S.L.H.; Doherty, M.A.; Hengeveld, J.C.; Vajda, A.; Donaghy, C.; McLaughlin, R.L.; Pender, N.; Hardiman, O.; et al. The clinical and radiological profile of primary lateral sclerosis: A population-based study. J. Neurol. 2019, 266, 2718–2733. [Google Scholar] [CrossRef]
- Giudice, T.L.; Lombardi, F.; Santorelli, F.M.; Kawarai, T.; Orlacchio, A. Hereditary spastic paraplegia: Clinical-genetic characteristics and evolving molecular mechanisms. Exp. Neurol. 2014, 261, 518–539. [Google Scholar] [CrossRef]
- Brugman, F.; Veldink, J.H.; Franssen, H.; de Visser, M.; de Jong, J.M.B.; Faber, C.G.; Kremer, B.H.P.; Schelhaas, H.J.; van Doorn, P.A.; Verschuuren, J.J.G.M.; et al. Differentiation of Hereditary Spastic Paraparesis From Primary Lateral Sclerosis in Sporadic Adult-Onset Upper Motor Neuron Syndromes. Arch. Neurol. 2009, 66, 509–514. [Google Scholar] [CrossRef] [Green Version]
- Verber, N.S.; Shepheard, S.; Sassani, M.; McDonough, H.E.; Moore, S.A.; Alix, J.J.P.; Wilkinson, I.D.; Jenkins, T.; Shaw, P.J. Biomarkers in Motor Neuron Disease: A State of the Art Review. Front. Neurol. 2019, 10, 291. [Google Scholar] [CrossRef] [Green Version]
- Zucchi, E.; Bedin, R.; Fasano, A.; Fini, N.; Gessani, A.; Vinceti, M.; Mandrioli, J. Cerebrospinal Fluid Neurofilaments May Discriminate Upper Motor Neuron Syndromes: A Pilot Study. Neurodegener. Dis. 2018, 18, 255–261. [Google Scholar] [CrossRef]
- Yuan, A.; Rao, M.V.; Veeranna; Nixon, R.A. Neurofilaments and Neurofilament Proteins in Health and Disease. Cold Spring Harb. Perspect. Biol. 2017, 9, a018309. [Google Scholar] [CrossRef] [Green Version]
- Moore, S.R.; Gresham, L.S.; Bromberg, M.B.; Kasarkis, E.J.; Smith, R.A. A self report measure of affective lability. J. Neurol. Neurosurg. Psychiatry 1997, 63, 89–93. [Google Scholar] [CrossRef] [Green Version]
- Quinn, C.; Edmundson, C.; Dahodwala, N.; Elman, L. Reliable and efficient scale to assess upper motor neuron disease burden in amyotrophic lateral sclerosis. Muscle Nerve 2019, 61, 508–511. [Google Scholar] [CrossRef] [PubMed]
- Strong, M.; Abrahams, S.; Goldstein, L.; Woolley, S.; Mclaughlin, P.; Snowden, J.; Mioshi, E.; Roberts-South, A.; Benatar, M.; Hortobágyi, T.; et al. Amyotrophic lateral sclerosis—frontotemporal spectrum disorder (ALS-FTSD): Revised diagnostic criteria. Amyotroph. Lateral Scler. Front. Degener. 2017, 18, 153–174. [Google Scholar] [CrossRef]
- Tremolizzo, L.; Susani, E.; Aliprandi, A.; Salmaggi, A.; Ferrarese, C.; Appollonio, I. Muscle ultrasonography for detecting fasciculations in frontotemporal dementia. Amyotroph. Lateral Scler. Front. Degener. 2014, 15, 546–550. [Google Scholar] [CrossRef]
- Ma, J.; Wen, Q.; Pang, X.; Huang, S.; Zhang, J.; Wang, J.; Chang, X.; Guo, J.; Zhang, W. Fasciculation score: A sensitive biomarker in amyotrophic lateral sclerosis. Neurol. Sci. 2021, 42, 4657–4666. [Google Scholar] [CrossRef]
- Rooney, J.; Burke, T.; Vajda, A.; Heverin, M.; Hardiman, O. What does the ALSFRS-R really measure? A longitudinal and survival analysis of functional dimension subscores in amyotrophic lateral sclerosis. J. Neurol. Neurosurg. Psychiatry 2016, 88, 381–385. [Google Scholar] [CrossRef]
- Kimura, F.; Fujimura, C.; Ishida, S.; Nakajima, H.; Furutama, D.; Uehara, H.; Shinoda, K.; Sugino, M.; Hanafusa, T. Progression rate of ALSFRS-R at time of diagnosis predicts survival time in ALS. Neurology 2006, 66, 265–267. [Google Scholar] [CrossRef]
- Lu, C.-H.; Macdonald-Wallis, C.; Gray, E.; Pearce, N.; Petzold, A.; Norgren, N.; Giovannoni, G.; Fratta, P.; Sidle, K.; Fish, M.; et al. Neurofilament light chain: A prognostic biomarker in amyotrophic lateral sclerosis. Neurology 2015, 84, 2247–2257. [Google Scholar] [CrossRef] [Green Version]
- Zucchi, E.; Bonetto, V.; Sorarù, G.; Martinelli, I.; Parchi, P.; Liguori, R.; Mandrioli, J. Neurofilaments in motor neuron disorders: Towards promising diagnostic and prognostic biomarkers. Mol. Neurodegener. 2020, 15, 58. [Google Scholar] [CrossRef]
- Willemse, E.A.J.; Teunissen, C.E. Biobanking of Cerebrospinal Fluid for Biomarker Analysis in Neurological Diseases. Adv. Exp. Med. Biol. 2015, 864, 79–93. [Google Scholar] [CrossRef]
- Wilke, C.; Rattay, T.W.; Hengel, H.; Zimmermann, M.; Brockmann, K.; Schöls, L.; Kuhle, J.; Schüle, R.; Synofzik, M. Serum neurofilament light chain is increased in hereditary spastic paraplegias. Ann. Clin. Transl. Neurol. 2018, 5, 876–882. [Google Scholar] [CrossRef] [PubMed]
- Verde, F.; Zaina, G.; Bodio, C.; Borghi, M.O.; Soranna, D.; Peverelli, S.; Ticozzi, N.; Morelli, C.; Doretti, A.; Messina, S.; et al. Cerebrospinal fluid phosphorylated neurofilament heavy chain and chitotriosidase in primary lateral sclerosis. J. Neurol. Neurosurg. Psychiatry 2020, 92, 221–223. [Google Scholar] [CrossRef]
- Falzone, Y.M.; Domi, T.; Agosta, F.; Pozzi, L.; Schito, P.; Fazio, R.; Del Carro, U.; Barbieri, A.; Comola, M.; Leocani, L.; et al. Serum phosphorylated neurofilament heavy-chain levels reflect phenotypic heterogeneity and are an independent predictor of survival in motor neuron disease. J. Neurol. 2020, 267, 2272–2280. [Google Scholar] [CrossRef]
- Boylan, K.B.; Glass, J.D.; Crook, J.E.; Yang, C.; Thomas, C.S.; Desaro, P.; Johnston, A.; Overstreet, K.; Kelly, C.; Polak, M.; et al. Phosphorylated neurofilament heavy subunit (pNF-H) in peripheral blood and CSF as a potential prognostic biomarker in amyotrophic lateral sclerosis. J. Neurol. Neurosurg. Psychiatry 2012, 84, 467–472. [Google Scholar] [CrossRef]
- De Schaepdryver, M.; Jeromin, A.; Gille, B.; Claeys, K.; Herbst, V.; Brix, B.; Van Damme, P.; Poesen, K. Comparison of elevated phosphorylated neurofilament heavy chains in serum and cerebrospinal fluid of patients with amyotrophic lateral sclerosis. J. Neurol. Neurosurg. Psychiatry 2017, 89, 367–373. [Google Scholar] [CrossRef]
- Lu, C.-H.; Petzold, A.; Topping, J.; Allen, K.; Macdonald-Wallis, C.; Clarke, J.; Pearce, N.; Kuhle, J.; Giovannoni, G.; Fratta, P.; et al. Plasma neurofilament heavy chain levels and disease progression in amyotrophic lateral sclerosis: Insights from a longitudinal study. J. Neurol. Neurosurg. Psychiatry 2014, 86, 565–573. [Google Scholar] [CrossRef]
- Puentes, F.; Topping, J.; Kuhle, J.; Van Der Star, B.J.; Douiri, A.; Giovannoni, G.; Baker, D.; Amor, S.; Malaspina, A. Immune reactivity to neurofilament proteins in the clinical staging of amyotrophic lateral sclerosis. J. Neurol. Neurosurg. Psychiatry 2013, 85, 274–278. [Google Scholar] [CrossRef]
- Wilke, C.; Pujol-Calderón, F.; Barro, C.; Stransky, E.; Blennow, K.; Michalak, Z.; Deuschle, C.; Jeromin, A.; Zetterberg, H.; Schüle, R.; et al. Correlations between serum and CSF pNfH levels in ALS, FTD and controls: A comparison of three analytical approaches. Clin. Chem. Lab. Med. 2019, 57, 1556–1564. [Google Scholar] [CrossRef] [Green Version]
- Gagliardi, D.; Meneri, M.; Saccomanno, D.; Bresolin, N.; Comi, G.P.; Corti, S. Diagnostic and Prognostic Role of Blood and Cerebrospinal Fluid and Blood Neurofilaments in Amyotrophic Lateral Sclerosis: A Review of the Literature. Int. J. Mol. Sci. 2019, 20, 4152. [Google Scholar] [CrossRef] [Green Version]
- Abu-Rumeileh, S.; Vacchiano, V.; Zenesini, C.; Polischi, B.; De Pasqua, S.; Fileccia, E.; Mammana, A.; Di Stasi, V.; Capellari, S.; Salvi, F.; et al. Diagnostic-prognostic value and electrophysiological correlates of CSF biomarkers of neurodegeneration and neuroinflammation in amyotrophic lateral sclerosis. J. Neurol. 2020, 267, 1699–1708. [Google Scholar] [CrossRef]
- Poesen, K.; De Schaepdryver, M.; Stubendorff, B.; Gille, B.; Muckova, P.; Wendler, S.; Prell, T.; Ringer, T.M.; Rhode, H.; Stevens, O.; et al. Neurofilament markers for ALS correlate with extent of upper and lower motor neuron disease. Neurology 2017, 88, 2302–2309. [Google Scholar] [CrossRef]
- Baek, S.-H.; Park, J.; Kim, Y.H.; Seok, H.Y.; Oh, K.-W.; Kim, H.-J.; Kwon, Y.-J.; Sim, Y.; Tae, W.-S.; Kim, S.H.; et al. Usefulness of diffusion tensor imaging findings as biomarkers for amyotrophic lateral sclerosis. Sci. Rep. 2020, 10, 5199. [Google Scholar] [CrossRef] [Green Version]
- Zoccolella, S.; Mastronardi, A.; Scarafino, A.; Iliceto, G.; D’Errico, E.; Fraddosio, A.; Tempesta, I.; Morea, A.; Scaglione, G.; Introna, A.; et al. Motor-evoked potentials in amyotrophic lateral sclerosis: Potential implications in detecting subclinical UMN involvement in lower motor neuron phenotype. J. Neurol. 2020, 267, 3689–3695. [Google Scholar] [CrossRef]
- Li, S.; Ren, Y.; Zhu, W.; Yang, F.; Zhang, X.; Huang, X. Phosphorylated neurofilament heavy chain levels in paired plasma and CSF of amyotrophic lateral sclerosis. J. Neurol. Sci. 2016, 367, 269–274. [Google Scholar] [CrossRef]
- Gille, B.; De Schaepdryver, M.; Goossens, J.; Dedeene, L.; De Vocht, J.; Oldoni, E.; Goris, A.; Bosch, L.V.D.; Depreitere, B.; Claeys, K.G.; et al. Serum neurofilament light chain levels as a marker of upper motor neuron degeneration in patients with Amyotrophic Lateral Sclerosis. Neuropathol. Appl. Neurobiol. 2018, 45, 291–304. [Google Scholar] [CrossRef]
- Khalil, M.; Teunissen, C.E.; Otto, M.; Piehl, F.; Sormani, M.P.; Gattringer, T.; Barro, C.; Kappos, L.; Comabella, M.; Fazekas, F.; et al. Neurofilaments as biomarkers in neurological disorders. Nat. Rev. Neurol. 2018, 14, 577–589. [Google Scholar] [CrossRef]
- Gray, E.; Oeckl, P.; Amador, M.D.M.; Andreasson, U.; An, J.; Blennow, K.; Bowser, R.; De Schaepdryver, M.; Heslegrave, A.; Kuhle, J.; et al. A multi-center study of neurofilament assay reliability and inter-laboratory variability. Amyotroph. Lateral Scler. Front. Degener. 2020, 21, 452–458. [Google Scholar] [CrossRef]


| ALS (n = 95) | UMNp ALS (n = 20) | PLS | hSP | p Value | |
|---|---|---|---|---|---|
| (n = 15) | (n = 13) | ||||
| Male sex | 59 (62.11) | 12 (60) | 7 (46.67) | 7 (53.85) | 0.680 |
| Age at sampling, years | 62.2 ± 12.1 | 53.02 ± 12.75 | 63.22 ± 9.50 | 51.60 ± 18.84 | 0.010 |
| BMI at sampling | 24.64 ± 4.29 | 23.78 ± 3.45 | 24.39 ± 3.24 | 22.26 ± 10.48 | 0.565 |
| Onset to sampling, months | 12.57 ± 10.57 | 16.46 ± 18.14 | 59.29 ± 63.80 | 133.76 ± 131.21 | <0.001 |
| Diagnostic latency, months | 14.23 ± 12.12 | 13.51 ± 10.88 | 47.61 ± 39.94 | 136.65 ± 130.24 | <0.001 |
| ALSFRS-R at sampling, total score | 40.94 ± 5.71 | 39.25 ± 10.13 | 40.85 ± 5.43 | 43.90 ± 2.13 | 0.857 |
| ALSFRS-R at sampling, bulbar score | 10.44 ± 2.16 | 10.69 ± 2.68 | 10.69 ± 2.39 | 11.80 ± 0.42 | 0.315 |
| ALSFRS-R at sampling, upper limbs subscore | 6.33 ± 1.81 | 6.69 ± 2.21 | 6.31 ± 1.65 | 7.80 ± 0.63 | 0.099 |
| ALSFRS-R at sampling, lower limbs subscore | 5.83 ± 2.25 | 4.06 ± 1.84 | 5.08 ± 1.38 | 4.60 ± 1.71 | 0.009 |
| ALSFRS-R at sampling, respiratory subscore | 11.36 ± 1.90 | 11.31 ± 2.75 | 12.00 ± 0.00 | 11.90 ± 0.32 | 0.575 |
| Progression rate at sampling, (points/month) | 0.98 ± 1.07 | 0.81 ± 0.88 | 0.18 ± 0.10 | 0.09 ± 0.09 | 0.004 |
| Progression rate at last observation, (points/month) | 1.11 ± 1.24 | 0.39 ± 0.30 | 0.23 ± 0.16 | 0.16 ± 0.16 | 0.002 |
| Time to generalization | 13.96 ± 15.01 | 18.50 ± 23.24 | 31.81 ± 21.01 | 192.03 ± 186.68 | <0.001 |
| ALS (n = 95) | UMNp ALS (n = 20) | PLS (n = 15) | hSP (n = 13) | p Value | |
|---|---|---|---|---|---|
| Pseudobulbar affect (presence) | 19 (19.38) | 5 (29.41) | 3 (20.00) | 0 (0) | 0.233 |
| Behavioural changes (presence) | 15 (15.30) | 0 (0) | 0 (0) | 0 (0) | 0.040 |
| Cognitive changes (presence) | 16 (16.32) | 1 (5.88) | 1 (6.67) | 0 (0) | 0.187 |
| Dementia (presence) | 14 (14.28) | 1 (5.88) | 0 (0) | 0 (0) | 0.130 |
| Palmomental reflex (presence) | 17 (17.34) | 1 (5.88) | 2 (11.11) | 0 (0) | 0.171 |
| Glabellar reflex (persistence) | 7 (7.14) | 0 (0) | 3 (20.00) | 0 (0) | 0.173 |
| Snout reflex (presence) | 21 (21.43) | 4 (23.53) | 4 (26.67) | 0 (0) | 0.321 |
| Masseter reflex (exaggerated) | 16 (16.32) | 4 (23.53) | 4 (26.67) | 0 (0) | 0.397 |
| Unilateral Hoffmann sign | 14 (14.29) | 2 (11.76) | 6 (40.00) | 1 (7.69) | 0.003 |
| Bilateral Hoffmann sign | 17 (17.34) | 9 (52.94) | 5 (33.33) | 3 (23.08) | |
| Unilateral Babinski sign | 20 (20.41) | 1 (5.88) | 2 (11.11) | 2 (15.38) | <0.001 |
| Bilateral Babinski sign | 13 (13.27) | 13 (76.47) | 9 (60.00) | 8 (61.54) | |
| Unilateral Achilles clonus | 6 (6.12) | 3 (17.65) | 3 (20.00) | 2 (15.38) | <0.001 |
| Bilateral Achilles clonus | 9 (9.18) | 8 (47.06) | 5 (33.33) | 5 (38.46) | |
| Penn UMN score, mean (SD) | 6.83 (5.5) | 16.7 (5.76) | 16.33 (7.70) | 12.57 (6.13) | <0.001 |
| Fasciculations, single | 19 (19.39) | 5 (29.41) | 2 (13.33) | 0 (0.00) | <0.001 |
| Fasciculations, focal continuous | 51 (52.04) | 10 (58.82) | 1 (6.67) | 0 (0.00) | |
| Fasciculations, multifocal continuous | 7 (7.14) | 0 (0.00) | 0 (0.00) | 0 (0.00) | |
| Cramps (presence) | 35 (35.71) | 8 (47.06) | 1 (6.67) | 2 (15.38) | 0.026 |
| Ashworth scale score at sampling | 0.58 ± 0.93 | 2.63 ± 0.62 | 2.67 ± 0.98 | 1.83 ± 0.82 | <0.001 |
| CS tract hyperintensity (MRI) (118 patients) | 14 (17.28) 1 | 7(63.63) 2 | 7 (46.67) 3 | 3 (27.27) 4 | 0.002 |
| Prolonged central motor conduction time (MEP) (114 patients) | 56 (74.67) 5 | 13 (100.00) 6 | 12(85.71) 7 | 10(83.33) 8 | 0.178 |
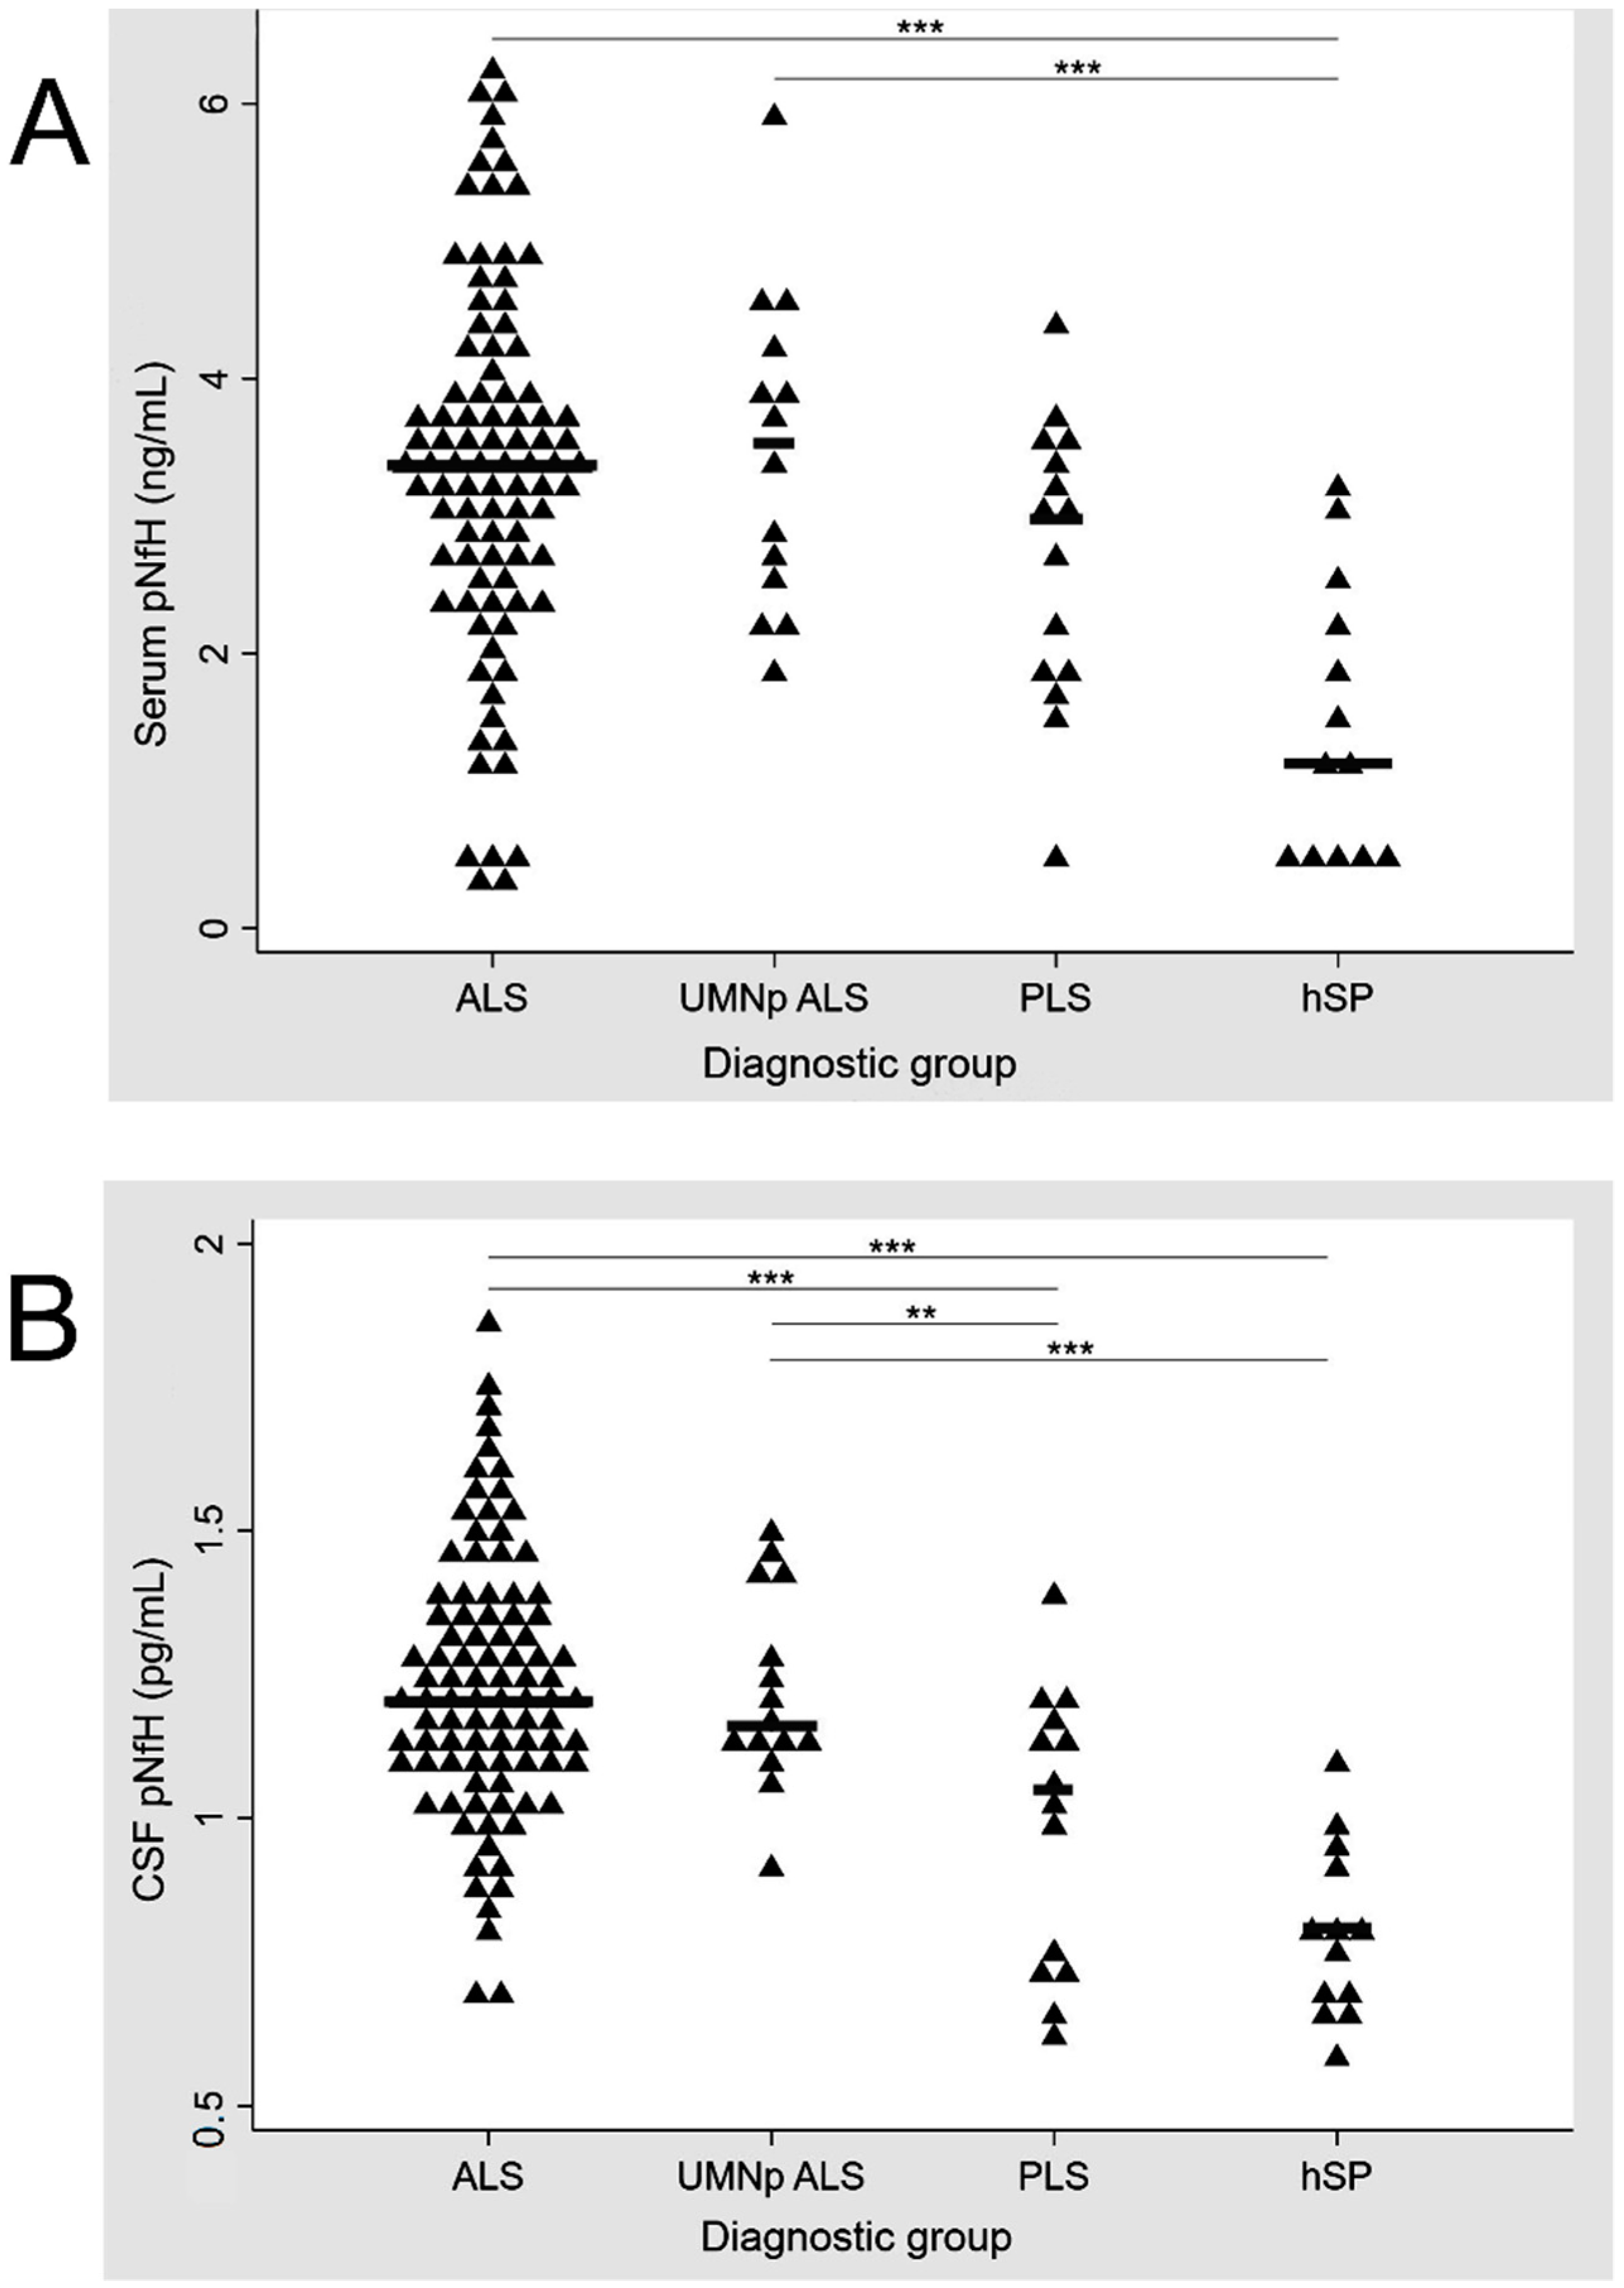
| pNfH | ALS (n = 95) | UMNp ALS (n = 20) | PLS (n = 15) | hSP (n = 13) |
|---|---|---|---|---|
| In CSF (ng/mL) | 2.09 [1.43–3.42] | 1.94 [1.62–3.65] ALS vs. UMNpALS: p = 0.827 | 1.20 [0.3–1.78] ALS vs. PLS: p < 0.001 UMNp vs PLS: p < 0.001 | 0.43 [0.22–0.71] ALS vs. hSP: p < 0.001 UMNp vs. hSP: p < 0.001 PLS vs. hSP: p < 0.030 |
| In serum (pg/mL) | 125.88 [43.89–283.63] | 137.77 [42.9–313.46] ALS vs. UMNpALS: p = 0.746 | 79.78 [10–148.95] ALS vs. PLS: p = 0.07 UMNp vs. PLS: p = 0.06 | 2.06 [0.1–22.7] ALS vs. hSP: p < 0.001 UMNp vs. hSP: p < 0.001 PLS vs. hSP: p < 0.013 |
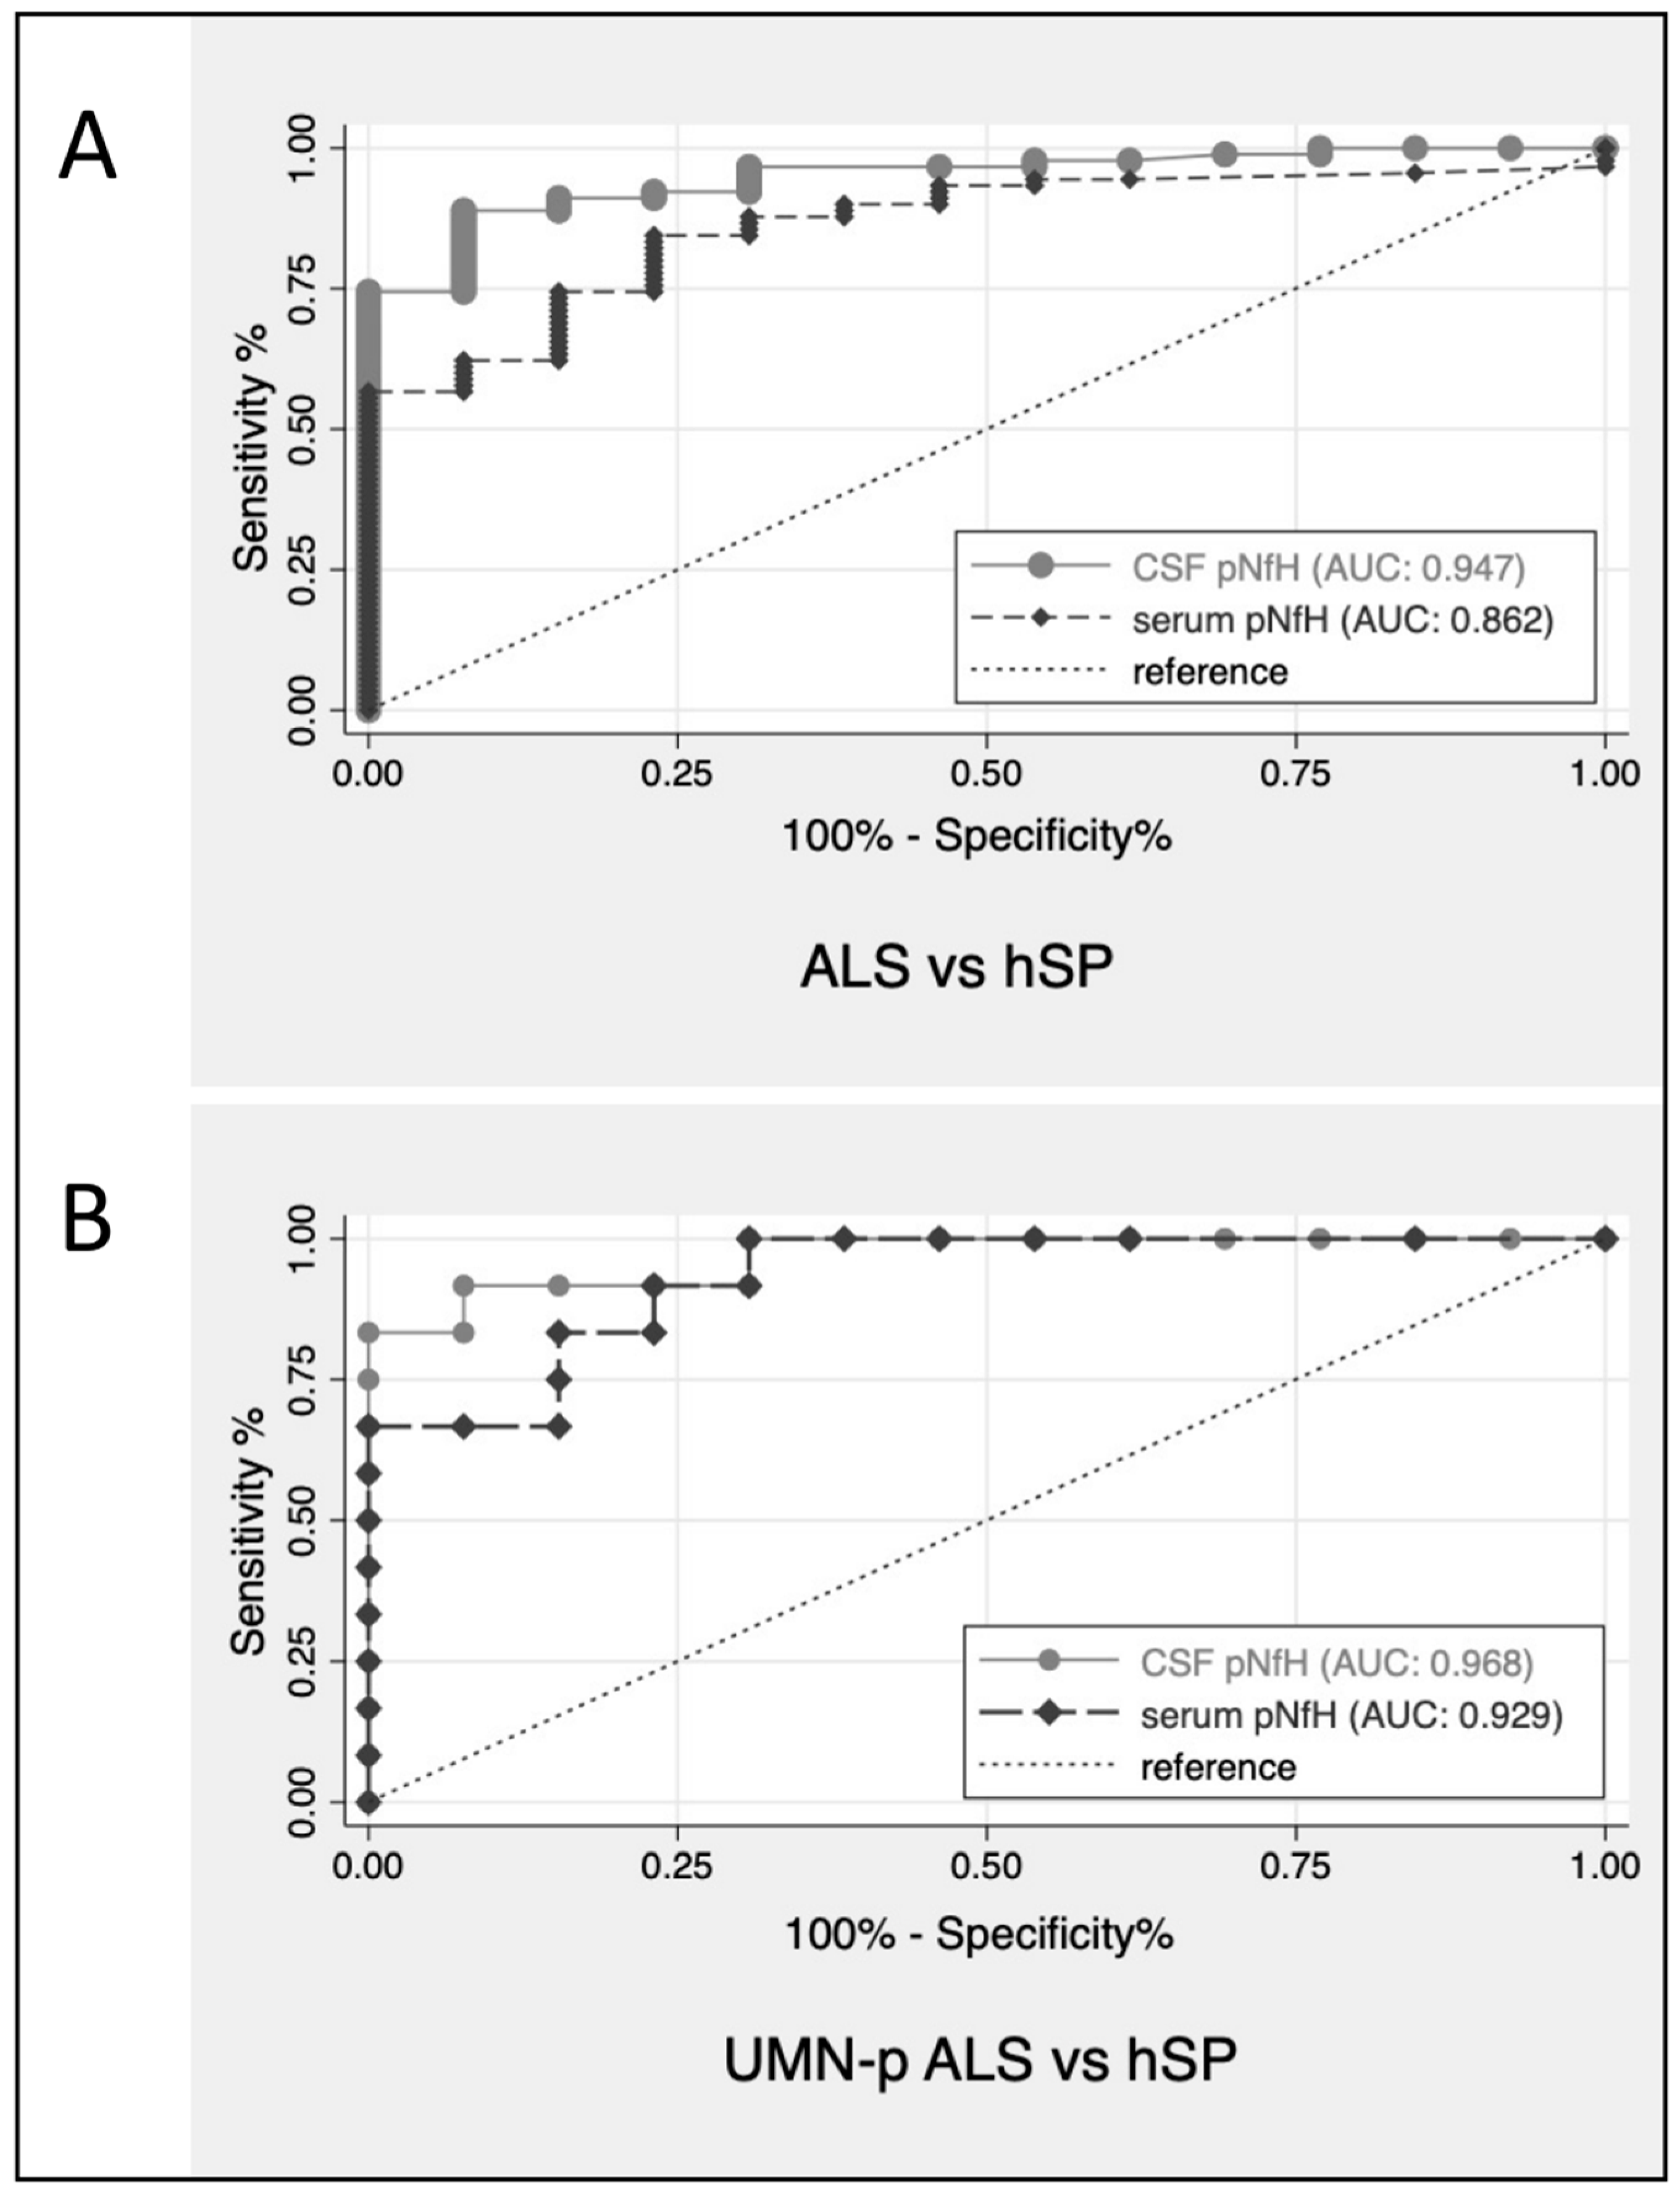
| pNfH 1 | ALS vs. PLS AUC (CI) | UMNp ALS vs. PLS AUC (CI) | ALS vs. hSP AUC (CI) | PLS vs. hSP AUC (CI) | UMNp ALS vs. hSP AUC (CI) |
|---|---|---|---|---|---|
| In CSF (ng/mL) | 0.75 (0.61–0.88) | 0.74 (0.61–0.89) | 0.95 (0.90–0.99) | 0.72 (0.52–0.93) | 0.97 (0.91–1.00) |
| In serum (pg/mL) | 0.66 (0.52–0.80) | 0.75 (0.56–0.94) | 0.86 (0.77–0.95) | 0.79 (0.62–0.97) | 0.93 (0.84–1.00) |
| Variable | HR | 95% CI | p > |z| |
|---|---|---|---|
| Sex (male/female) | 1.33 | 0.84–2.11 | 0.21 |
| Diagnostic delay (months) | 0.91 | 0.88–0.94 | <0.01 |
| Time from onset to sampling (months) | 0.94 | 0.91–0.96 | <0.01 |
| Age at sampling (years) | 1.00 | 0.99–1.02 | 0.39 |
| Site of onset (bulbar, upper limb, lower limb, respiratory) | 0.72 | 0.55–0.95 | 0.02 |
| Time to generalization (months) | 0.96 | 0.94–0.98 | <0.01 |
| BMI at sampling (kg/m2) | 1.01 | 0.96–1.05 | 0.66 |
| ALSFRS-R score at sampling (total score) | 0.97 | 0.94–1.00 | 0.04 |
| Ashworth score at sampling (total score) | 0.65 | 0.52–0.80 | <0.01 |
| Progression rate at sampling (points/month) | 2.26 | 1.83–2.78 | <0.01 |
| Clinical subgroups (hSP/PLS/UMNp ALS/ALS) | 0.24 | 0.14–0.41 | <0.01 |
| Dementia | 2.71 | 1.44–5.07 | <0.01 |
| Serum pNfH (1), pg/mL | 1.56 | 1.30–1.86 | <0.01 |
| CSF pNfH (1), ng/mL | 50.54 | 16.72–152.78 | <0.01 |
Publisher’s Note: MDPI stays neutral with regard to jurisdictional claims in published maps and institutional affiliations. |
© 2021 by the authors. Licensee MDPI, Basel, Switzerland. This article is an open access article distributed under the terms and conditions of the Creative Commons Attribution (CC BY) license (https://creativecommons.org/licenses/by/4.0/).
Share and Cite
Simonini, C.; Zucchi, E.; Bedin, R.; Martinelli, I.; Gianferrari, G.; Fini, N.; Sorarù, G.; Liguori, R.; Vacchiano, V.; Mandrioli, J. CSF Heavy Neurofilament May Discriminate and Predict Motor Neuron Diseases with Upper Motor Neuron Involvement. Biomedicines 2021, 9, 1623. https://doi.org/10.3390/biomedicines9111623
Simonini C, Zucchi E, Bedin R, Martinelli I, Gianferrari G, Fini N, Sorarù G, Liguori R, Vacchiano V, Mandrioli J. CSF Heavy Neurofilament May Discriminate and Predict Motor Neuron Diseases with Upper Motor Neuron Involvement. Biomedicines. 2021; 9(11):1623. https://doi.org/10.3390/biomedicines9111623
Chicago/Turabian StyleSimonini, Cecilia, Elisabetta Zucchi, Roberta Bedin, Ilaria Martinelli, Giulia Gianferrari, Nicola Fini, Gianni Sorarù, Rocco Liguori, Veria Vacchiano, and Jessica Mandrioli. 2021. "CSF Heavy Neurofilament May Discriminate and Predict Motor Neuron Diseases with Upper Motor Neuron Involvement" Biomedicines 9, no. 11: 1623. https://doi.org/10.3390/biomedicines9111623
APA StyleSimonini, C., Zucchi, E., Bedin, R., Martinelli, I., Gianferrari, G., Fini, N., Sorarù, G., Liguori, R., Vacchiano, V., & Mandrioli, J. (2021). CSF Heavy Neurofilament May Discriminate and Predict Motor Neuron Diseases with Upper Motor Neuron Involvement. Biomedicines, 9(11), 1623. https://doi.org/10.3390/biomedicines9111623