Next Article in Journal
Cellular Mechanisms and Therapies in Wound Healing: Looking toward the Future
Next Article in Special Issue
Complement and Coagulation System Crosstalk in Synaptic and Neural Conduction in the Central and Peripheral Nervous Systems
Previous Article in Journal
Examination of the TIGIT, CD226, CD112, and CD155 Immune Checkpoint Molecules in Peripheral Blood Mononuclear Cells in Women Diagnosed with Early-Onset Preeclampsia
 
 
biomedicines-logo
Article Menu

Article Menu

Article

Sex-Specific Metabolic Pathways Were Associated with Alzheimer’s Disease (AD) Endophenotypes in the European Medical Information Framework for AD Multimodal Biomarker Discovery Cohort

by
Jin Xu
1,2,
Rebecca Green
2,3,
Min Kim
4,†,
Jodie Lord
2,
Amera Ebshiana
1,
Sarah Westwood
5,
Alison L. Baird
5,
Alejo J. Nevado-Holgado
5,
Liu Shi
5,
Abdul Hye
2,
Stuart G. Snowden
1,‡,
Isabelle Bos
6,7,
Stephanie J. B. Vos
7,
Rik Vandenberghe
6,
Charlotte E. Teunissen
8,
Mara Ten Kate
6,8,
Philip Scheltens
6,
Silvy Gabel
9,10,11,
Karen Meersmans
10,11,
Olivier Blin
12,
Jill Richardson
13,
Ellen Elisa De Roeck
14,15,
Sebastiaan Engelborghs
15,16,
Kristel Sleegers
17,18,
Régis Bordet
19,
Lorena Rami
20,
Petronella Kettunen
21,
Magda Tsolaki
22,
Frans R. J. Verhey
7,
Daniel Alcolea
23,
Alberto Lleó
23,
Gwendoline Peyratout
24,
Mikel Tainta
25,
Peter Johannsen
26,
Yvonne Freund-Levi
27,28,
Lutz Frölich
29,
Valerija Dobricic
30,
Giovanni B. Frisoni
31,32,
José Luis Molinuevo
20,33,
Anders Wallin
21,
Julius Popp
34,35,
Pablo Martinez-Lage
36,
Lars Bertram
30,37,
Kaj Blennow
38,39,
Henrik Zetterberg
38,39,40,41,
Johannes Streffer
15,
Pieter Jelle Visser
6,7,
Simon Lovestone
2,5,42,
Petroula Proitsi
2,*,
Cristina Legido-Quigley
1,4,* and
on behalf of the European Medical Information Framework Consortium
§
add Show full author list remove Hide full author list
1
Institute of Pharmaceutical Science, King’s College London, London SE1 9NH, UK
2
Institute of Psychiatry, Psychology and Neuroscience, Maurice Wohl Clinical Neuroscience Institute, King’s College London, London SE5 9RT, UK
3
NIHR Maudsley Biomedical Research Centre, South London and Maudsley NHS Trust, London SE5 8AF, UK
4
Steno Diabetes Center, 2820 Gentofte, Denmark
5
Department of Psychiatry, University of Oxford, Oxford OX3 7JX, UK
6
Alzheimer Center, VU University Medical Center, 1081 HV Amsterdam, The Netherlands
7
Department of Psychiatry and Neuropsychology, School for Mental Health and Neuroscience, Alzheimer Centrum Limburg, Maastricht University, 6211 LK Maastricht, The Netherlands
8
Department of Radiology and Nuclear Medicine, VU University Medical Center, 1081 HV Amsterdam, The Netherlands
9
Department of Clinical Chemistry, Neurochemistry Laboratory, Amsterdam Neuroscience, Amsterdam University Medical Centers, Vrije Universiteit, 1081 HV Amsterdam, The Netherlands
10
Department of Neurosciences, Laboratory for Cognitive Neurology, KU Leuven, 3000 Leuven, Belgium
11
University Hospital Leuven, 3000 Leuven, Belgium
12
Clinical Pharmacology & Pharmacovigilance Department, Aix-Marseille University-CNRS, 13007 Marseille, France
13
Neurosciences Therapeutic Area, GlaxoSmithKline R&D, Stevenage SG1 2NY, UK
14
Center for Neurosciences, Vrije Universiteit Brussel, 1050 Brussels, Belgium
15
Reference Center for Biological Markers of Dementia (BIODEM), Institute Born-Bunge, University of Antwerp, 2000 Antwerp, Belgium
16
Department of Neurology and Center for Neurosciences (C4N), UZ Brussel and Vrije Universiteit Brussel (VUB), 1050 Brussels, Belgium
17
Department of Neurology and Memory Clinic, Hospital Network Antwerp (ZNA) Middelheim and Hoge Beuken, University of Antwerp, 2000 Antwerp, Belgium
18
Complex Genetics of Alzheimer’s Disease Group, VIB Center for Molecular Neurology, VIB, 2000 Antwerp, Belgium
19
Department of Medical Pharmacology, Université de Lille, 59000 Lille, France
20
Alzheimer’s Disease and Other Cognitive Disorders Unit, Hospital Clínic of Barcelona, August Pi Sunyer Biomedical Research Institute (IDIBAPS), 08036 Barcelona, Spain
21
Institute of Neuroscience and Physiology, Sahlgrenska Academy, University of Gothenburg, 405 30 Gothenburg, Sweden
22
1st Department of Neurology, AHEPA University Hospital, 546 21 Thessaloniki, Greece
23
Sant Pau Memory Unit, Department of Neurology, Hospital de la Santa Creu i Sant Pau, 08041 Barcelona, Spain
24
Lausanne University Hospital, 1011 Lausanne, Switzerland
25
Fundación CITA-Alzhéimer Fundazioa, 20009 San Sebastian, Spain
26
Danish Dementia Research Centre, Rigshospitalet, 2100 Copenhagen, Denmark
27
Department of Neurobiology, Caring Sciences and Society (NVS), Division of Clinical Geriatrics, Karolinska Institutet, Karolinska University Hospital Huddinge, 141 86 Stockholm, Sweden
28
Department of Old Age Psychiatry, Institute of Psychiatry, Psychology & Neuroscience, King’s College London, London SE5 8AF, UK
29
Department of Geriatric Psychiatry, Central Institute of Mental Health, Medical Faculty Mannheim, University of Heidelberg, 68167 Mannheim, Germany
30
Lübeck Interdisciplinary Platform for Genome Analytics, Institutes of Neurogenetics and Cardiogenetics, University of Lübeck, 23562 Lübeck, Germany
31
Laboratory of Neuroimaging of Aging (LANVIE), University of Geneva, 1205 Geneva, Switzerland
32
IRCCS Istituto Centro San Giovanni di Dio Fatebenefratelli, 25125 Brescia, Italy
33
Barcelona Beta Brain Research Center, Unversitat Pompeu Fabra, 08002 Barcelona, Spain
34
Old Age Psychiatry, Department of Psychiatry, University Hospital Lausanne, 1011 Lausanne, Switzerland
35
Department of Geriatric Psychiatry, University Hospital of Psychiatry Zürich, 8008 Zürich, Switzerland
36
Center for Research and Advanced Therapies, CITA-Alzheimer Foundation, 20009 San Sebastian, Spain
37
Department of Psychology, University of Oslo, 0315 Oslo, Norway
38
Clinical Neurochemistry Laboratory, Sahlgrenska University Hospital, 413 45 Mölndal, Sweden
39
Department of Psychiatry and Neurochemistry, Institute of Neuroscience and Physiology, Sahlgrenska Academy, University of Gothenburg, 415 45 Mölndal, Sweden
40
UK Dementia Research Institute at UCL, London WC1E 6BT, UK
41
Department of Neurodegenerative Disease, UCL Institute of Neurology, London WC1N 3BG, UK
42
Janssen-Cilag UK Ltd., Oxford HP12 4EG, UK
*
Authors to whom correspondence should be addressed.
Current address—Copenhagen Prospective Studies on Asthma in Childhood, Herlev and Gentofte Hospital, University of Copenhagen, 1165 Copenhagen, Denmark.
Current address—Department of Biological Sciences, Royal Holloway, University of London, London TW20 0EX, UK.
§
Partnership of the European Medical Information Framework consortium is provided in the Supplement document.
Biomedicines 2021, 9(11), 1610; https://doi.org/10.3390/biomedicines9111610
Submission received: 4 October 2021 / Revised: 22 October 2021 / Accepted: 25 October 2021 / Published: 3 November 2021
(This article belongs to the Special Issue Molecular Mechanisms and Treatments on Neurodegenerative Diseases)

Abstract

:
Background: physiological differences between males and females could contribute to the development of Alzheimer’s Disease (AD). Here, we examined metabolic pathways that may lead to precision medicine initiatives. Methods: We explored whether sex modifies the association of 540 plasma metabolites with AD endophenotypes including diagnosis, cerebrospinal fluid (CSF) biomarkers, brain imaging, and cognition using regression analyses for 695 participants (377 females), followed by sex-specific pathway overrepresentation analyses, APOE ε4 stratification and assessment of metabolites’ discriminatory performance in AD. Results: In females with AD, vanillylmandelate (tyrosine pathway) was increased and tryptophan betaine (tryptophan pathway) was decreased. The inclusion of these two metabolites (area under curve (AUC) = 0.83, standard error (SE) = 0.029) to a baseline model (covariates + CSF biomarkers, AUC = 0.92, SE = 0.019) resulted in a significantly higher AUC of 0.96 (SE = 0.012). Kynurenate was decreased in males with AD (AUC = 0.679, SE = 0.046). Conclusions: metabolic sex-specific differences were reported, covering neurotransmission and inflammation pathways with AD endophenotypes. Two metabolites, in pathways related to dopamine and serotonin, were associated to females, paving the way to personalised treatment.

1. Introduction

Alzheimer’s disease (AD) is the most common neurodegenerative dementia, making it a major source of global morbidity and mortality. Current clinical diagnosis of AD relies on a battery of cognitive tests combined with structural and functional imaging [1]. Studies on mechanisms and biomarkers of AD are attracting considerable interest due to the challenge of diagnosing cognitively normal people during the preclinical phase of the disease.
Biomarkers of AD can be described in the ATN (amyloid/tau/neurodegeneration) framework, grouped into those of β amyloid (Aβ) deposition, pathological tau, and neurodegeneration [2]. This ATN descriptive classification system is independent to clinically defined diagnostic criteria and eases the categorisation of multidomain biomarker findings at the individual level [3]. Aβ (measured by CSF Aβ42/40 or amyloid PET or CSF Aβ42) and tau (evaluated by CSF phosphorylated tau or tau PET) are being refined as the primary mediators of AD-related synaptic loss and eventual neuronal death [4]. AD neurodegeneration or neuronal injury can be quantitatively or topographically estimated by CSF t-tau, [18F] fluorodeoxyglucose-positron emission tomography (FDG-PET), or structural MRI [5]. Although there are challenges of measuring biomarkers for brain diseases in the blood (low concentrations and expression in non-cerebral tissues), blood-based biomarkers are easily accessible, minimally invasive and scalable for large scale use. Recently, success in detecting AD and predicting future disease progression has been achieved particularly for the application of glial fibrillary acidic protein (GFAP), plasma phospho-tau181and phospho-tau217 [6,7,8].
In addition to the above-mentioned biomarkers, AD risk factors include age, as well as genetic, environmental and modifiable lifestyle factors [9]. Sex-related differences in brain structure and function have also been widely discussed [10,11], and if we know more about whether sex-specific associations exist and the biological underpinnings of these relationships, this may help guide more personalised treatments [12]. Studies have suggested that females are at greater risk for developing AD when compared to males. The UK dementia report states that more females have AD and that this trend is likely to remain with a F:M ratio of approximately 2 to 1 in the projected dementia incidence for 2051 [13]. Although it has been recently reported that selective survival may contribute to sex/gender differences in dementia incidence, this does not preclude the additional contributions from biological mechanisms [14].
Our previous studies using smaller cohorts have shown that (1) plasma metabolites have the potential to match the AUC of well-established AD CSF biomarkers through machine learning approach (sample size N = 357), and (2) primary fatty amides were associated with AD endophenotypes (sample size N = 593) [15,16]. In the present study, we performed metabolomics in 102 additional participants to a total of 695 and aimed to explore whether sex modifies the association of plasma metabolites with AD endophenotypes. Linear and logistic regressions were performed to investigate the association of plasma metabolite levels with AD endophenotypes (CSF biomarkers, brain MRI, cognition measures and diagnosis) in the full cohort including a sex interaction term, followed by sex-stratified analyses and pathway analyses. Prediction models based on logistic and linear regression were then built to assess AD biomarker performance in each sex stratum. The study design is illustrated in Supplementary Figure S1.

2. Methods

2.1. Participants

This study included 695 participants consisting of 377 females and 318 males from the European Medical Information Framework for Alzheimer’s Disease Multimodal Biomarker Discovery (EMIF-AD MBD) [17]. There were 283 control (CTL) participants, 275 participants with mild cognitive impairment (MCI) and 137 AD dementia patients. Participants were included from three multicenter studies: EDAR (n = 84) [18], PharmaCog (n = 40) [19], DESCRIPA (n = 16) [20], and eight single center studies: Amsterdam (n = 147) [21], Antwerp (n = 133) [22], IDIBAPS (n = 93) [23], Leuven (n = 53) [24], San Sebastian GAP (n = 40) [25], Barcelona-Sant Pau (n = 35) [26], Gothenburg (n = 34) [27], Lausanne (n = 20) [28].

2.2. Clinical and Cognitive Data

Neuropsychological tests measuring five different cognitive domains were available. Briefly, these were memory (delayed and immediate), language, attention, executive function, and visuo-construction (Table 1). Hippocampal volume (left, right and sum, adjusted for intracranial volume ICV) and cortical thickness (average across the whole brain and in AD signature regions) were also available (Table 1). The definition of CTL was a normal performance on neuropsychological assessment (within 1.5 SD of the average for age, gender and education). MCI was defined as having cognitive complaints and performance below 1.5 SD of the average on at least one neuropsychological test but no dementia [29]. AD-type dementia diagnosis was made based on a clinical diagnosis, using the National Institute of Neurological and Communicative Disorders and Stroke—Alzheimer’s Disease and Related Disorders Association criteria [30]. Details on the neuropsychological test, amyloid (CSF Aβ42/40 ratio of the central analyses or the local CSF Aβ42 value or the standardized uptake value ratio (SUVR) on an amyloid-PET scan) and tau level measurements, magnetic resonance imaging (MRI) and genetic analyses can be found in Bos et al. [17].

2.3. Metabolomics Data

Relative levels of 665 plasma metabolites were measured in fasted blood samples by Metabolon, Inc. Metabolomics experiments were performed with an additional 102 participants, and details of the analytical method for all (N = 695) can be found in Kim et al. [16]. After removing metabolites with more than 20% missing values, 540 metabolites with known identity were included for further analyses. Log10 transformation and scaling (mean of zero and standard deviation of one) were applied to metabolomics data after missing values were imputed with the k-nearest neighbour algorithm (k = 10, “impute” package for R). Single outlying values beyond three standard deviations were further removed.

2.4. Statistical Analyses

Prior to statistical analyses, baseline characteristics were compared among the three diagnostic groups using the ANOVA for continuous variables and the Chi-square test for categorical variables (Table 1). The 15 AD endophenotypes were classified into four collections: CSF biomarkers (three continuous variables; Aβ, p-tau, t-tau), brain MRI measurements (five continuous variables; hippocampal left, right and sum volume, average cortical thickness in whole brain and AD regions), cognition measures (six continuous variables; attention, executive, language, memory delay, memory immediate, visuoconstruction) and diagnosis (one binary variable; AD versus CTL, MCI excluded).
Regression analyses evaluated the association between metabolites (predictors) and AD endophenotypes (outcomes). Linear regression was used for continuous AD variables and logistic regression was used for diagnosis. An interaction term between sex and metabolites was included in each model to test whether sex modified the association of metabolites with AD endophenotypes. All models were further sex-stratified when there was evidence of significant sex-metabolite interaction (p < 0.05). Each regression model was adjusted for age at sampling, years of education, batch and presence of the APOE ε4 allele (ε4 carrier versus no ε4 carrier). The analyses of APOE ε4 (+/−) -by-metabolite interaction effects were also conducted using the same approach described above where sex was included as a covariate instead (Supplementary methods and results). To account for the number of tests performed and the correlations between metabolites, a Bonferroni-adjusted significance threshold (p < 8.17 × 10⁴) was set as 0.05 divided by the number of independent metabolites (n = 61) from 230 metabolites used in sex-stratified analyses (“independent tests” package in Python https://github.com/hagax8/independent_tests, accessed on 27 March 2021). Exploratory pathway enrichment analyses were additionally performed (Supplementary methods and results).
Individual metabolites showing association with diagnosis (p < 8.17 × 10⁻⁴) were investigated as sex-specific biomarkers using prediction models (bootstrapped, n = 1000, “fbroc” package in R). To evaluate the prediction performance gained by adding sex-specific biomarkers to baseline AD predictors, a likelihood ratio test (“lmtest” package in R) was employed followed by net reclassification index (NRI) analysis (“nricens” package in R). The baseline model was built including both CSF biomarkers and covariates. Sex-specific markers were then added, and their performance was evaluated. The prevalence of AD in the dataset (excluding MCI) was utilised as the event rate and participants were categorised into two groups: below and above the event rate. The NRI categorized at the event rate, denoted NRI(p), is a robust measure to model miscalibration [31]. We calculated both event NRI and non-event NRI and took the sum as the final NRI(p) [32]. It has been reported that adding a variable/variables that has/have a moderate or large effect size (Cohen’s D equal to 0.5 or 0.8, respectively) can yield NRI(p) values between 0.018 and 0.197, depending on the discrimination of the initial model (AUC) [33]. To provide insight into the links between diagnosis and other AD endophenotypes, metabolites that were nominally associated with diagnosis and at least one other AD variable were studied further. All statistical analyses were performed using R Studio (version 1.3.1056) unless otherwise stated.

3. Results

3.1. Demographics

The characteristics of the study participants are presented in Table 1. There were no differences in sex distribution among the three diagnostic groups. AD and MCI participants were older compared to CTL participants. There were more APOE ε4 carriers in the AD group compared to the other two groups (p < 0.01). AD participants had lower CSF Aβ, p-tau, and t-tau z-score levels (p < 0.01) compared to the other two groups, which means lower CSF Aβ42 and CSF Aβ42/40 ratio. AD participants also had smaller hippocampal volumes (left, right, and sum) and on average smaller cortical thickness in AD signature regions (all, p < 0.01). No significant differences were observed for average cortical thickness across the whole brain between the three diagnostic groups (p ≥ 0.05).

3.2. Sex-Specific Association of Blood Metabolites with AD Endophenotypes

To identify whether sex modified the association between blood metabolites and the AD endophenotypes included in this study, we built multivariable linear and logistic regression models between each of the 540 metabolite and each of the 15 AD endophenotypes from four collections (CSF biomarkers, brain MRI measurements, cognition measures and diagnosis) by including an interaction term between sex and each metabolite. We found that sex modified the association of 230 metabolites with AD endophenotypes (Supplementary Table S1). Of these, 38 metabolites showed sex-interactions with CSF biomarkers, 152 with cognition measurements, 79 with brain MRI variables, and 30 with diagnosis (AD/CTL).
Metabolites that showed an interaction with sex at p < 0.05 were further investigated for associations with AD endophenotypes in sex-stratified regression analyses. Specifically, only metabolites that showed an interaction with sex in the full dataset, and that associated with the same endophenotype in our sex-stratified analyses, were listed. Stratifying participants by sex revealed that two metabolites, vanillylmandelate (VMA) and tryptophan betaine (Figure 1A,B), were associated with AD in females after Bonferroni correction (p < 8.17 × 10⁻⁴) (β = 0.77, 95% CI = 0.40 to 1.18, p = 1.14 × 10⁻⁴ and β = −0.73, 95% CI = −1.12 to −0.36, p = 1.48 × 10⁻⁴, respectively), and 116 of 230 metabolites at the nominal significance level. In parallel, one metabolite, kynurenate, was associated with AD in males after Bonferroni correction (p < 8.17 × 10⁻⁴) (β = −1.04, 95% CI = −1.58 to −0.54, p = 7.63 × 10⁻⁵) (Table 2) and 100 of 230 metabolites showed nominally significant associations in males (Supplementary Table S1).
In addition to the single metabolite analysis, pathway-based exploratory analysis was performed to provide more insights into these metabolites in AD at a systems level (Supplementary methods and results). We also investigated metabolites that showed sex-specific associations with diagnosis and at least one other AD phenotype (p < 0.05). As shown in Figure 2, five metabolites showed associations only in females. These included isovalerylcarnitine from ‘leucine, isoleucine and valine metabolism’ sub-pathway, carotene diol (1) and carotene diol (2) from ‘vitamin A metabolism’ sub-pathway, as well as phosphatidylcholine (p16:0/16:1), 1-linoleoyl glycerol and methyl 4-hydroxybenzoate sulfate. The above mentioned two sub-pathways were enriched for two collections of endophenotypes, cognition and diagnosis, respectively (Supplementary Table S4). Moreover, six metabolites showed associations in males: lysophosphocholine (18:2) (LPC 18:2), sphingomyelin (d38:0), 5-(galactosylhydroxy)-L-Lysine, kynurenate, N-acetylneuraminate and xanthurenate (Supplementary Figures S2–S12).

3.3. Interactive Effect of APOE ε4 and Sex

After investigating how sex exerts metabolite associations with AD endophenotypes, we also performed association analyses for all 540 metabolites with 15 AD endophenotypes from four categories, now stratified by APOE ε4 status and adjusted for sex (Supplementary methods and results). Supplementary Table S2 summarises the numbers of metabolites that showed association with each of the AD endophenotypes in the whole cohort and each APOE ε4 +/− stratum. To investigate potential relationships between sex and APOE ε4 status on the metabolomic level, we compared the metabolites identified in either sex group and APOE ε4 carrier stratification analyses (Supplementary Tables S1 and S2). There is no overlap of metabolite that associated with the same AD endophenotype between female/male and APOE ε4 + stratum observed at Bonferroni significance thresholds (Supplementary methods and results).

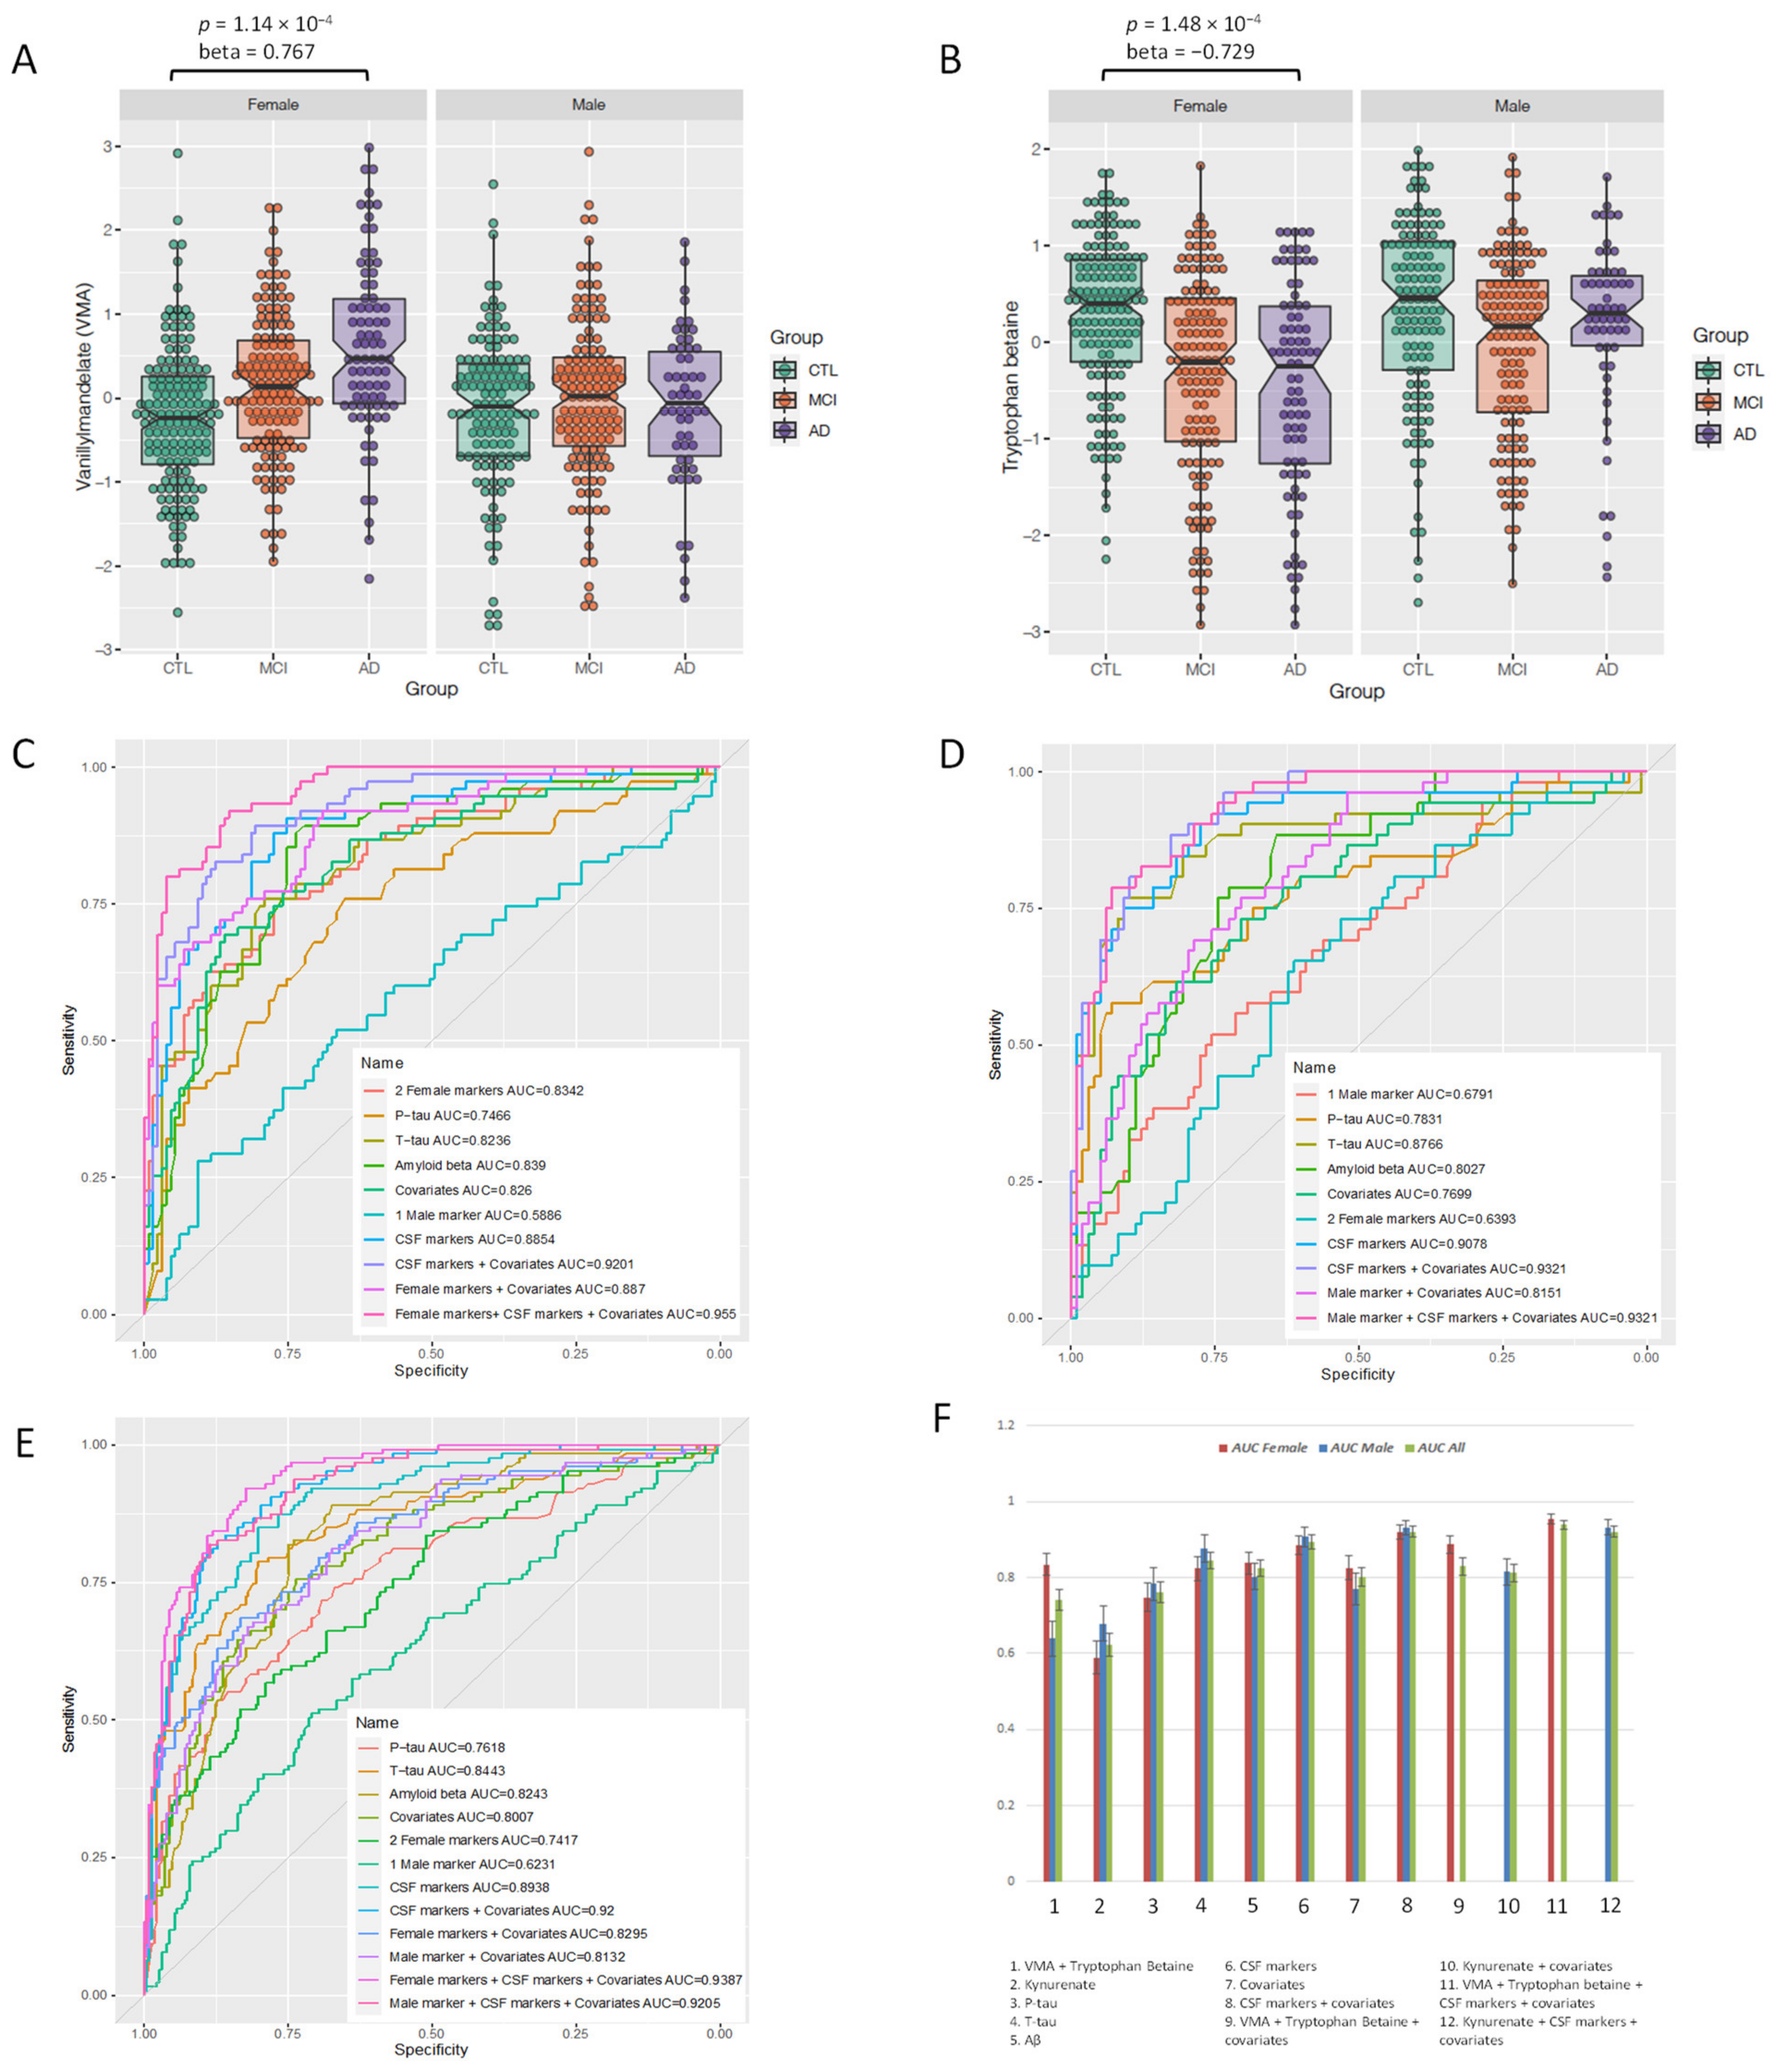
3.4. Sex-Specific Metabolites as Diagnostic Biomarkers

We further explored sex-specific metabolites, VMA, tryptophan betaine, and kynurenate, as diagnostic biomarkers, that were significant following Bonferroni correction in sex stratified regression analyses. In addition, we tested if these three metabolites were associated to drugs (n = 2, hydroquinone sulfate and salicylate, sample size n = 695), and AD medications (n = 2, acetyl -cholinesterase inhibitors or other AD drugs, sample size = 225). Regression models showed no associations between the three metabolites and drugs at p < 8.17 × 10⁻⁴ (data not shown).
In females, a receiver operating characteristic (ROC) curve (bootstrapped) for VMA and tryptophan betaine was built and is presented in Figure 1C (AUC = 0.83 for AD versus controls, SE = 0.029, 95% CI = 0.777 to 0.889). We then examined how well other AD endophenotypes would discriminate AD cases from controls. CSF biomarkers (Aβ, t-tau and p-tau) produced an AUC of 0.89 (SE = 0.025, 95% CI = 0.836 to 0.93), covariates (age at sampling, education years, sampling batch and APOE ε4 status) produced an AUC of 0.83 (SE = 0.031, 95% CI = 0.763 to 0.886), CSF biomarkers and covariates together produced AUC of 0.92 (SE = 0.019, 95% CI = 0.881 to 0.954). The combination of the two female-specific biomarkers, CSF biomarkers and covariates produced AUC of 0.96 (SE = 0.012, 95% CI = 0.93 to 0.978). Bootstrapping results of standard error and 95% confident interval for AUCs from the ROC curves are listed in Supplementary Table S5.
In the male cohort we then built a regression model followed by a ROC curve for kynurenate (Figure 1D). The resulting AUC was 0.68 (SE = 0.046, 95% CI = 0.593 to 0.765). This value was again compared to the CSF biomarkers (AUC = 0.91, SE = 0.026, 95% CI = 0.852 to 0.954), covariates (AUC = 0.77, SE = 0.042, 95% CI = 0.68 to 0.848), both CSF biomarkers & covariates (AUC = 0.932, SE = 0.019, 95% CI = 0.89 to 0.965), and the combination of kynurenate, CSF biomarkers and covariates (AUC = 0.93, SE = 0.02, 95% CI = 0.888 to 0.966). Furthermore, the AUC of CSF biomarkers, covariates, VMA and tryptophan betaine, kynurenate, and combinations of them were explored in the full dataset (males and females combined) (Figure 2E). An increase of AUC from 0.92 to 0.94 was observed when VMA and tryptophan betaine were added to the panel of CSF biomarkers and covariates, while the addition of kynurenate resulted in the same AUC of 0.92 in the full cohort.
Finally, the application of NRI to regression models revealed that, when examining the effect of VMA and tryptophan betaine together in the female sub-dataset, the event NRI, non-event NRI and NRI(p) were 0.04, 0.039, and 0.079 (all above the critical value 0), respectively (Supplementary Figure S13A). However, adding kynurenate to the model in the male sub-dataset yielded nil event NRI, non-event NRI and NRI(p) values (Supplementary Figure S13B). When investigating these sex-specific biomarkers in the full dataset, an NRI(p) of 0.0516 was observed for the two female-specific markers, albeit an NRI(p) of −0.0079 was seen for the male-specific marker (Supplementary Figure S13C,D).

4. Discussion

In this study, we measured 665 plasma metabolites in 695 participants: 377 females and 318 males. We used a combination of linear and logistic regression analyses as well as pathway enrichment analyses to investigate sex-specific associations between metabolites and AD endophenotypes. For a follow-up investigation, we found that none of the nine metabolites (four primary fatty acid amides, three amino acids, and two lipokines) demonstrating association with AD in our previous study [16] showed interaction with sex in this study which included an additional 102 participants. Overall, we identified ten sub-pathways that showed sex-specific associations in our exploratory pathway analysis (Supplementary methods and results). A number of metabolites demonstrated associations with clinical AD diagnosis and at least one additional AD clinical biomarker. Finally, we reported two metabolites, VMA and tryptophan betaine, which had added value to discriminate in females AD cases from controls and demonstrated improved prediction over traditional CSF biomarkers and covariates (AUC of metabolites = 0.834, AUC of CSF markers = 0.884, AUC of CSF markers & covariates = 0.92, AUC of metabolites & CSF makers & covariates = 0.955).

4.1. Metabolites Associated with AD and Other Endophenotypes

When we investigated metabolites associated with diagnosis and at least one other AD endophenotype, five out of 11 metabolites showed significant associations in females, namely isovalerylcarnitine, methyl-4-hydroxybenzoate sulfate, carotene diol (1), carotene diol (2), and 1-lindeoyl glycerol (Figure 2). Among these, isovalerylcarnitine, a short chain acylcarnitine, showed positive associations with cortical thickness in AD regions in females. Moreover, its concentration showed a gradual decrease from the cognitively normal group to MCI, and then AD patients. While previous studies have emphasized metabolite links to both sexes, our findings in females are consistent with studies in which sex was not stratified. In these studies, decreased levels of acylcarnitines in schizophrenia and AD were reported [34,35], although the opposite direction, higher levels of acylcarnitines in subjects with AD, have also been observed [36]. Carotene diols are unoxygenated carotenoids involved in vitamin A metabolism and we observed decreased levels in AD patients, while other studies have also shown that beta-carotene might protect against dementia [37].
Six metabolites associated with AD and at least one other AD endophenotype were found in males, namely xanthurenate, N-acetylneuraminate, LPC (18:2), kynurenate, 5-(galactosylhydroxy)-L-lysine, and SM(d38:0). While our study focused on novel metabolites with association to male sex, links to cognition and AD have been previously reported. Xanthurenate and kynurenate are formed in the kynurenine pathway by tryptophan degradation. They may play a physiological role in attentional and cognitive processes, as well as act as a potential trait marker for schizophrenia [38]. The importance of lipid dynamics has been studied as an area of investigation in AD [39]. In this regard, we observed significantly increased levels of LPC (18:2)—a glycerophospholipid—in males, although decreased plasma LPC (18:2) levels have been reported in a non-targeted AD study [40].

4.2. Sex-Specific Biomarkers

In this study, we found three metabolites, VMA, tryptophan betaine and kynurenine in the tyrosine and tryptophan pathways to be associated with AD in two sex strata. Kaddurah-Daouk et al. found that the level of VMA was elevated in AD versus controls in CSF [41], in accordance with our findings. VMA is an end product of catecholamine metabolism in the tyrosine-dopamine pathway (Supplementary Figure S14A) metabolized by catechol-O-methytransferase (COMT) and monoamine oxidase (MAO) [41]. Therefore, the observed increase in positive association with VMA could be the result of the upregulation COMT and/or MAO in female AD patients. Indeed, oestrogen turnover via COMT has been implicated in AD pathogenesis in an ApoE-dependent manner [42]. In addition, the activation of MAO-B, the alternative pathway to VMA metabolism, has been demonstrated in brains with AD [43].
Tryptophan betaine was the second female-specific AD marker in this study. An important finding of this study is that metabolites that can act via the gut-brain axis showed sex-specific associations. Tryptophan betaine is found in high fibre plants, and it is also linked to microbiota in fibre-enriched diets [44]. Koistinen et al. found that tryptophan betaine correlated negatively with several bacterial taxa which have earlier been associated with adverse effects in the gut and overall health in an in vitro model of the human gastrointestinal system [44]. It is an indole alkaloid composed of tryptophan and three methyls (Supplementary Figure S14B) and has been found to have neurological and glucose-lowering effects in rodents [45]. Interestingly, it has been also been reported as a sleep-inducing and anti-inflammatory compound when tested in animal models [45,46]. Furthermore, in females, our pathway analyses revealed enrichment in the tryptophan pathway for AD diagnosis (Supplementary methods and results).
Another metabolite in the same pathway and that was decreased in male AD patients specifically was kynurenate. It is produced via a secondary branch of the kynurenine pathway through tryptophan degradation (Supplementary Figure S14B). This is in agreement with studies with no sex-specific analyses, where kynurenine concentrations were decreased in AD plasma/serum [36,47]. In the past it has been reported as an endogenous excitatory amino acid receptor antagonist, as well as a neuroprotective compound [48]. Tryptophan is the parent metabolite in both the serotonin and kynurenine pathways. Kynurenate can lead to attenuated glutamate neurotransmission by antagonism of glutamate receptors and release, which consequently decreases glutamate-evoked dopamine release in the striatum [49].
Both pathways, tyrosine-dopamine and tryptophan, have been reported to be linked to inflammation in psychiatric disease [50]. The predictive abilities of the two female- and one male-specific biomarkers were initially evaluated by calculating the AUC, and further assessed by NRI when compared to existing baseline models. NRI(p) of 0.079 and 0.052 were observed for the two female-specific markers in the female dataset and the full dataset (Supplementary Figure S13A,C), respectively. With the baseline AUC over 0.9, it has been reported that the effect size (Cohen’s D) of adding the female-specific markers could reach 0.8 [33]. The increased AUC values, together with positive NRI, support the hypothesis that female-specific AD markers add value to precision medicine [31].

4.3. Limitations and Conclusions

A limitation of this study is that, although it is relatively large, the number of participants is still small, particularly after sex-stratification. Also, results of this study should be validated in an independent cohort. However, to avoid potential overfitting, all AUCs from ROC curves were bootstrapped 1000 times with 95% CIs and standard errors presented. In addition, an important finding of this study is the gut-brain axis link shown by the tryptophan betaine and VMA pathways in females, although no causal implications can be drawn from our study. Additional limitations include survival and selection bias inherent to observational studies. In summary, our study reports sex-specific metabolic differences in AD and highlights two metabolites, both involved in neurotransmission pathways as potential female-specific biomarkers in AD. This is the first report that highlights female-specific and modifiable metabolites associated with AD and as classifiers to discriminate AD cases from controls, paving the way to personalised treatment.

Supplementary Materials

The following are available online at https://www.mdpi.com/article/10.3390/biomedicines9111610/s1, Figure S1: Study workflow, Figure S2: Isovalerylcarnitine C5 showed significant association in the female group, Figure S3: Carotene diol (2) showed significant association in the female group, Figure S4: Carotene diol (1) showed significant association in the female group, Figure S5: Methyl 4-hydroxybenzoate sulfate showed significant association in the female group, Figure S6: 1-linoleoyl glycerol showed significant association in the female group, Figure S7: Xanthurenate showed significant association in the male group, Figure S8: N-acetylneuraminate showed significant association in the male group, Figure S9: LPC (18:2) showed significant association in the male group, Figure S10: Kynurenate showed significant association in the male group, Figure S11: 5-(galactosylhydroxy)-L-Lysine showed significant association in the male group, Figure S12: SM (d38:0) showed significant association in the male group, Figure S13: Net reclassification index table for sex-specific biomarkers, Figure S14: VMA, tryptophan betaine, and kynurenate were generated through tyrosine and tryptophan pathways, Figure S15: Box plots of metabolites stratified by sex and APOE ε4 status, Table S1: Number of metabolites showed association with each AD endophenotypes in the whole cohort and each sex stratum, Table S2: Number of metabolites showed association with AD endophenotypes in the whole cohort and each APOE ε4 +/− stratum, Table S3: Overlap of of metabolites showed association with AD endophenotypes in the stratification analyses between female/male group and APOE ε4 + group at nominal significance levels (p < 0.05), Table S4: The associations of the ten sub-pathways with four collections of AD endophenotypes in both sex strata, Table S5: Bootstrapping results of standard error (SE) and 95% confident interval for AUCs from ROC curves, Table S6: List of collaborators in European Medical Information Framework (EMIF) consortium.

Author Contributions

C.L.-Q., P.P. and J.X. conceived and designed the study; J.X., R.G. and M.K. analysed the data; S.J.B.V. provided medication data resources; R.G., M.K., J.L., A.E., S.W., A.L.B., A.J.N.-H., L.S., A.H., S.G.S., I.B., S.J.B.V., R.V., C.E.T., M.T.K., P.S., S.G., K.M., O.B., J.R., E.E.D.R., S.E., K.S., R.B., L.R., P.K., M.T. (Magda Tsolaki), F.R.J.V., D.A., A.L., G.P., M.T. (Mikel Tainta), P.J., Y.F.-L., L.F., V.D., G.B.F., J.L.M., A.W., J.P., P.M.-L., L.B., K.B., H.Z., J.S., P.J.V., S.L., P.P., C.L.-Q. and J.X. wrote and reviewed the manuscript. All authors have read and agreed to the published version of the manuscript.

Funding

The present study was conducted as part of the EMIF-AD project, which has received support from the Innovative Medicines Initiative Joint Undertaking under EMIF grant agreement no. 115372, EPAD grant no. 115736, and from the European Union’s Horizon 2020 research and innovation programme under grant agreement No. 666992. Resources of which are composed of financial contribution from the European Union’s Seventh Framework Program (FP7/2007-2013) and EFPIA companies’ in-kind contribution. The DESCRIPA study was funded by the European Commission within the fifth framework program (QLRT-2001-2455). The EDAR study was funded by the European Commission within the fifth framework program (contract no. 37670). The San Sebastian GAP study is partially funded by the Department of Health of the Basque Government (allocation 17.0.1.08.12.0000.2.454.01.41142.001.H). The Leuven cohort was funded by the Stichting voor Alzheimer Onderzoek (grant numbers #11020, #13007 and #15005). The SPIN cohort (Barcelona) has received funding from CIBERNED; Instituto de Salud Carlos III; jointly funded by Fondo Europeo de Desarrollo Regional (FEDER), Unión Europea, “Una manera de hacer Europa”; Generalitat de Catalunya; Fundació “La Marató TV3” Fundació Bancària Obra Social La Caixa; Fundación BBVA; Fundación Española para el Fomento de la Investigación de la Esclerosis Lateral Amiotrófica (FUNDELA); Global Brain Health Institute; Fundació Catalana Síndrome de Down; and Fundació Víctor Grífols i Lucas. Research at VIB-Antwerp was in part supported by the National Institute of Health (NIH), USA (grant #1R01AG068398-01) Antwerp Research Fund. H.Z. is a Wallenberg Scholar supported by grants from the Swedish Research Council (#2018-02532), the European Research Council (#681712), Swedish State Support for Clinical Research (#ALFGBG-720931), the Alzheimer Drug Discovery Foundation (ADDF), USA (#201809-2016862), the AD Strategic Fund and the Alzheimer’s Association (#ADSF-21-831376-C, #ADSF-21-831381-C and #ADSF-21-831377-C), the Olav Thon Foundation, the Erling-Persson Family Foundation, Stiftelsen för Gamla Tjänarinnor, Hjärnfonden, Sweden (#FO2019-0228), the European Union’s Horizon 2020 research and innovation programme under the Marie Skłodowska-Curie grant agreement No 860197 (MIRIADE), and the UK Dementia Research Institute at UCL. K.B. is supported by the Swedish Research Council (#2017-00915), the Alzheimer Drug Discovery Foundation (ADDF), USA (#RDAPB-201809-2016615), the Swedish Alzheimer Foundation (#AF-742881), Hjärnfonden, Sweden (#FO2017-0243), the Swedish state under the agreement between the Swedish government and the County Councils, the ALF-agreement (#ALFGBG-715986), the European Union Joint Program for Neurodegenerative Disorders (JPND2019-466-236), and the National Institute of Health (NIH), USA, (grant #1R01AG068398-01). P.K. is supported by the Swedish state under the agreement between the Swedish government and the County Councils, the ALF-agreement ALFGBG-724331 and A.W. by ALFGBG-720661. Y.F.-L. is supported by The Brain Foundation (Hjärnfonden FO2018-0315), Stohne’s Foundation (Stohnes Stiftelse), Gamla Tjänarinnor Stftelse, Stohnes Stiftelse, Särfond 31S Research Fund Region Örebro län Sweden, Familjen Kamprad Stiftelse (ref 20210034, AFA 200386). D.A. received support from Institute of Health Carlos III (ISCIII), Spain PI18/00435 and INT19/00016, and by the Department of Health Generalitat de Catalunya PERIS program SLT006/17/125. J.L. is funded by the van Geest endowment fund. R.G. is funded by the National Institute for Health Research (NIHR) Biomedical Research Centre. J.X. and C.L.-Q. thank Lundbeck Fonden for the support.

Institutional Review Board Statement

The experiments were done in accordance with the Helsinki Declaration of 1975 and the medical ethics committee at each site approved the study (Table S8).

Informed Consent Statement

Informed consent was obtained from all subjects involved in the study.

Data Availability Statement

The datasets generated and analyzed during the current study are available via the EMIF-AD Catalogue via submitted research questions which have to be approved by the data-owners from each parent cohort.

Acknowledgments

The authors thank the participants and families who took part in this research. The authors would also like to thank all people involved in data and sample collection and/or logistics across the different centres.

Conflicts of Interest

K.B. and H.Z. have served as consultants at scientific advisory boards, or at data monitoring committees for Abcam, Axon, Biogen, JOMDD/Shimadzu, Julius Clinical, Lilly, MagQu, NovartisEisai, Denali, Roche Diagnostics, and Wave, Samumed, Siemens Healthineers, Pinteon Therapeutics, Nervgen, AZTherapies and CogRx, have given lectures in symposia sponsored by Cellectricon, Fujirebio, Alzecure and Biogen, and are co-founders of Brain Biomarker Solutions in Gothenburg AB (BBS), which is a part of the GU Ventures Incubator Program (outside the submitted work). D.A. participated in advisory boards from Fujirebio-Europe and Roche Diagnostics and received speaker honoraria from Fujirebio-Europe, Roche Diagnostics, Nutricia, Krka Farmacéutica S.L. and Esteve Pharmaceuticals S.A.

References

  1. Scheltens, P.; de Strooper, B.; Kivipelto, M.; Holstege, H.; Chételat, G.; Teunissen, C.E.; Cummings, J.; van der Flier, W.M. Alzheimer’s disease. Lancet 2021, 397, 1577–1590. [Google Scholar] [CrossRef]
  2. Jack, C.R., Jr.; Bennett, D.A.; Blennow, K.; Carrillo, M.C.; Dunn, B.; Haeberlein, S.B.; Holtzman, D.M.; Jagust, W.; Jessen, F.; Karlawish, J.; et al. NIA-AA Research Framework: Toward a biological definition of Alzheimer’s disease. Alzheimers Dement. 2018, 14, 535–562. [Google Scholar] [CrossRef] [PubMed]
  3. Clifford, R.J., Jr.; Bennett, D.A.; Blennow, K.; Carrillo, M.C.; Feldman, H.H.; Frisoni, G.B.; Hampel, H.; Jagust, W.J.; Johnson, K.A.; Knopman, D.S.; et al. A/T/N: An unbiased descriptive classification scheme for Alzheimer disease biomarkers. Neurology 2016, 87, 539–547. [Google Scholar] [CrossRef]
  4. Vinters, H.V. Emerging Concepts in Alzheimer’s Disease. Annu. Rev. Pathol. Mech. Dis. 2015, 10, 291–319. [Google Scholar] [CrossRef]
  5. Pike, C.J. Sex and the development of Alzheimer’s disease. J. Neurosci. Res. 2017, 95, 671–680. [Google Scholar] [CrossRef] [Green Version]
  6. Karikari, T.K.; Pascoal, T.A.; Ashton, N.J.; Janelidze, S.; Benedet, A.L.; Rodriguez, J.L.; Chamoun, M.; Savard, M.; Kang, M.S.; Therriault, J.; et al. Blood phosphorylated tau 181 as a biomarker for Alzheimer’s disease: A diagnostic performance and prediction modelling study using data from four prospective cohorts. Lancet Neurol. 2020, 19, 422–433. [Google Scholar] [CrossRef]
  7. Palmqvist, S.; Janelidze, S.; Quiroz, Y.T.; Zetterberg, H.; Lopera, F.; Stomrud, E.; Su, Y.; Chen, Y.; Serrano, G.E.; Leuzy, A.; et al. Discriminative Accuracy of Plasma Phospho-tau217 for Alzheimer Disease vs Other Neurodegenerative Disorders. JAMA 2020, 324, 772–781. [Google Scholar] [CrossRef]
  8. Verberk, I.M.; Laarhuis, M.B.; van den Bosch, K.A.; Ebenau, J.L.; van Leeuwenstijn, M.; Prins, N.D.; Scheltens, P.; Teunissen, C.E.; van der Flier, W.M. Serum Markers Glial Fibrillary Acidic Protein and Neurofilament Light for Prognosis and Monitoring in Cognitively Normal Older People: A Prospective Memory Clinic-Based Cohort Study. Lancet Healthy Longev. 2021, 2, E87–E95. [Google Scholar] [CrossRef]
  9. Xu, W.; Tan, L.; Wang, H.-F.; Jiang, T.; Tan, M.-S.; Tan, L.; Zhao, Q.-F.; Li, J.-Q.; Wang, J.; Yu, J.-T. Meta-analysis of modifiable risk factors for Alzheimer’s disease. J. Neurol. Neurosurg. Psychiatry 2015, 86, 1299–1306. [Google Scholar] [CrossRef]
  10. Ruigrok, A.N.; Salimi-Khorshidi, G.; Lai, M.-C.; Baron-Cohen, S.; Lombardo, M.; Tait, R.J.; Suckling, J. A meta-analysis of sex differences in human brain structure. Neurosci. Biobehav. Rev. 2014, 39, 34–50. [Google Scholar] [CrossRef] [Green Version]
  11. Mielke, M.M. Sex and Gender Differences in Alzheimer’s Disease Dementia. Psychiatr. Times 2018, 35, 14–17. [Google Scholar]
  12. Ferretti, M.T.; Women’s Brain Project and the Alzheimer Precision Medicine Initiative; Iulita, M.F.; Cavedo, E.; Chiesa, P.A.; Dimech, A.S.; Chadha, A.S.; Baracchi, F.; Girouard, H.; Misoch, S.; et al. Sex differences in Alzheimer disease—The gateway to precision medicine. Nat. Rev. Neurol. 2018, 14, 457–469. [Google Scholar] [CrossRef]
  13. Dementia UK: Update [Internet]. Available online: https://www.alzheimers.org.uk/sites/default/files/migrate/downloads/dementia_uk_update.pdf (accessed on 28 August 2020).
  14. Shaw, C.; Hayes-Larson, E.; Glymour, M.M.; Dufouil, C.; Hohman, T.J.; Whitmer, R.A.; Kobayashi, L.C.; Brookmeyer, R.; Mayeda, E.R. Evaluation of Selective Survival and Sex/Gender Differences in Dementia Incidence Using a Simulation Model. JAMA Netw. Open 2021, 4, e211001. [Google Scholar] [CrossRef]
  15. Stamate, D.; Kim, M.; Proitsi, P.; Westwood, S.; Baird, A.; Nevado-Holgado, A.; Hye, A.; Bos, I.; Vos, S.J.; Vandenberghe, R.; et al. A metabolite-based machine learning approach to diagnose Alzheimer-type dementia in blood: Results from the European Medical Information Framework for Alzheimer disease biomarker discovery cohort. Alzheimers Dement. Transl. Res. Clin. Interv. 2019, 5, 933–938. [Google Scholar] [CrossRef]
  16. Kim, M.; Snowden, S.; Suvitaival, T.; Ali, A.; Merkler, D.J.; Ahmad, T.; Westwood, S.; Baird, A.; Proitsi, P.; Nevado-Holgado, A.; et al. Primary fatty amides in plasma associated with brain amyloid burden, hippocampal volume, and memory in the European Medical Information Framework for Alzheimer’s Disease biomarker discovery cohort. Alzheimers Dement. 2019, 15, 817–827. [Google Scholar] [CrossRef]
  17. Bos, I.; Vos, S.; Vandenberghe, R.; Scheltens, P.; Engelborghs, S.; Frisoni, G.; Molinuevo, J.L.; Wallin, A.; Lleó, A.; Popp, J.; et al. The EMIF-AD Multimodal Biomarker Discovery study: Design, methods and cohort characteristics. Alzheimers Res. Ther. 2018, 10, 64. [Google Scholar] [CrossRef] [Green Version]
  18. Reijs, B.L.; Ramakers, I.H.; Elias-Sonnenschein, L.; Teunissen, C.E.; Koel-Simmelink, M.; Tsolaki, M.; Wahlund, L.-O.; Waldemar, G.; Hausner, L.; Johannsen, P.; et al. Relation of Odor Identification with Alzheimer’s Disease Markers in Cerebrospinal Fluid and Cognition. J. Alzheimers Dis. 2017, 60, 1025–1034. [Google Scholar] [CrossRef]
  19. Galluzzi, S.; Marizzoni, M.; Babiloni, C.; Albani, D.; Antelmi, L.; Bagnoli, C.; Bartrés-Faz, D.; Cordone, S.; Didic, M.; Farotti, L.; et al. Clinical and biomarker profiling of prodromal Alzheimer’s disease in workpackage 5 of the Innovative Medicines Initiative PharmaCog project: A ‘European ADNI study’. J. Intern. Med. 2016, 279, 576–591. [Google Scholar] [CrossRef]
  20. Visser, P.; Verhey, F.; Boada, M.; Bullock, R.; De Deyn, P.; Frisoni, G.B.; Frölich, L.; Hampel, H.; Jolles, J.; Jones, R.; et al. Development of Screening Guidelines and Clinical Criteria for Predementia Alzheimer’s Disease. Neuroepidemiology 2008, 30, 254–265. [Google Scholar] [CrossRef] [Green Version]
  21. Van der Flier, W.M.; Pijnenburg, Y.A.L.; Prins, N.; Lemstra, A.W.; Bouwman, F.H.; Teunissen, C.E.; van Berckel, B.N.M.; Stam, C.J.; Barkhof, F.; Visser, P.J.; et al. Optimizing patient care and research: The Amsterdam Dementia Cohort. J. Alzheimers Dis. 2014, 41, 313–327. [Google Scholar] [CrossRef] [Green Version]
  22. Somers, C.; Struyfs, H.; Goossens, J.; Niemantsverdriet, E.; Luyckx, J.; De Roeck, N.; De Roeck, E.; De Vil, B.; Cras, P.; Martin, J.-J.; et al. A Decade of Cerebrospinal Fluid Biomarkers for Alzheimer’s Disease in Belgium. J. Alzheimers Dis. 2016, 54, 383–395. [Google Scholar] [CrossRef]
  23. Fortea, J.; Sala-Llonch, R.; Bartrés-Faz, D.; Bosch, B.; Lladó, A.; Bargalló, N.; Molinuevo, J.L.; Sánchez-Valle, R. Increased cortical thickness and caudate volume precede atrophy in PSEN1 mutation carriers. J. Alzheimers Dis. 2010, 22, 909–922. [Google Scholar] [CrossRef]
  24. Adamczuk, K.; Schaeverbeke, J.; Nelissen, N.; Neyens, V.; Vandenbulcke, M.; Goffin, K.; Lilja, J.; Hilven, K.; Dupont, P.; Van Laere, K.; et al. Amyloid imaging in cognitively normal older adults: Comparison between 18F-flutemetamol and 11C-Pittsburgh compound B. Eur. J. Nucl. Med. Mol. Imaging 2015, 43, 142–151. [Google Scholar] [CrossRef] [Green Version]
  25. Estanga, A.; Ecay-Torres, M.; Ibañez, A.; Izagirre, A.; Villanua, J.; Garcia-Sebastian, M.; Gaspar, M.T.I.; Otaegui-Arrazola, A.; Iriondo, A.; Clerigue, M.; et al. Beneficial effect of bilingualism on Alzheimer’s disease CSF biomarkers and cognition. Neurobiol. Aging 2017, 50, 144–151. [Google Scholar] [CrossRef]
  26. Alcolea, D.; Clarimón, J.; Carmona-Iragui, M.; Illán-Gala, I.; Morenas-Rodríguez, E.; Barroeta, I.; Ribosa-Nogué, R.; Sala, I.; Sánchez-Saudinós, M.B.; Videla, L.; et al. The Sant Pau Initiative on Neurodegeneration (SPIN) cohort: A data set for biomarker discovery and validation in neurodegenerative disorders. Alzheimers Dement. Transl. Res. Clin. Interv. 2019, 5, 597–609. [Google Scholar] [CrossRef]
  27. Wallin, A.; Nordlund, A.; Jonsson, M.; Blennow, K.; Zetterberg, H.; Öhrfelt, A.; Stalhammar, J.; Eckerström, M.; Carlsson, M.; Olsson, E.; et al. Alzheimer’s disease—Subcortical vascular disease spectrum in a hospital-based setting: Overview of results from the Gothenburg MCI and dementia studies. Br. J. Pharmacol. 2015, 36, 95–113. [Google Scholar] [CrossRef]
  28. Tautvydaitė, D.; Kukreja, D.; Antonietti, J.-P.; Henry, H.; Von Gunten, A.; Popp, J. Interaction between personality traits and cerebrospinal fluid biomarkers of Alzheimer’s disease pathology modulates cognitive performance. Alzheimers Res. Ther. 2017, 9, 6. [Google Scholar] [CrossRef] [Green Version]
  29. Petersen, R.C. Mild cognitive impairment as a diagnostic entity. J. Intern. Med. 2004, 256, 183–194. [Google Scholar] [CrossRef]
  30. McKhann, G.; Drachman, D.; Folstein, M.; Katzman, R.; Price, D.; Stadlan, E.M. Clinical diagnosis of Alzheimer’s disease: Report of the NINCDS-ADRDA Work Group under the auspices of Department of Health and Human Services Task Force on Alzheimer’s Disease. Neurology 1984, 34, 939–944. [Google Scholar] [CrossRef] [Green Version]
  31. Thomas, L.E.; O’Brien, E.C.; Piccini, J.P.; D’Agostino, R.B.; Pencina, M.J. Application of net reclassification index to non-nested and point-based risk prediction models: A review. Eur. Heart J. 2018, 40, 1880–1887. [Google Scholar] [CrossRef]
  32. Pencina, M.J.; D’Agostino, R.B.; D’Agostino, R.B.; Vasan, R.S. Evaluating the added predictive ability of a new marker: From area under the ROC curve to reclassification and beyond. Stat. Med. 2008, 27, 157–172. [Google Scholar] [CrossRef]
  33. Pencina, M.J.; Steyerberg, E.W.; D’Agostino Sr, R.B. Net reclassification index at event rate: Properties and relationships. Stat. Med. 2017, 36, 4455–4467. [Google Scholar] [CrossRef]
  34. Cristofano, A.; Sapere, N.; La Marca, G.; Angiolillo, A.; Vitale, M.; Corbi, G.; Scapagnini, G.; Intrieri, M.; Russo, C.; Corso, G.; et al. Serum Levels of Acyl-Carnitines along the Continuum from Normal to Alzheimer’s Dementia. PLoS ONE 2016, 11, e0155694. [Google Scholar] [CrossRef] [Green Version]
  35. Cao, B.; Wang, D.; Pan, Z.; Brietzke, E.; McIntyre, R.S.; Musial, N.; Mansur, R.B.; Subramanieapillai, M.; Zeng, J.; Huang, N.; et al. Characterizing Acyl-Carnitine Biosignatures for Schizophrenia: A Longitudinal Pre- and Post-Treatment Study. Transl. Psychiatry 2019, 9, 19. [Google Scholar] [CrossRef] [Green Version]
  36. Van der Velpen, V.; Teav, T.; Gallart-Ayala, H.; Mehl, F.; Konz, I.; Clark, C.; Oikonomidi, A.; Peyratout, G.; Henry, H.; Delorenzi, M.; et al. Systemic and central nervous system metabolic alterations in Alzheimer’s disease. Alzheimers Res. Ther. 2019, 11, 93. [Google Scholar] [CrossRef] [PubMed] [Green Version]
  37. Von Arnim, C.A.F.; Herbolsheimer, F.; Nikolaus, T.; Peter, R.; Biesalski, H.K.; Ludolph, A.C.; Riepe, M.; Nagel, G.; ActiFE Ulm Study Group. Dietary antioxidants and dementia in a population-based case-control study among older people in South Germany. J. Alzheimers Dis. 2012, 31, 717–724. [Google Scholar] [CrossRef] [PubMed] [Green Version]
  38. Giil, L.M.; Midttun, Ø.; Refsum, H.; Ulvik, A.; Advani, R.; Smith, A.D.; Ueland, P.M. Kynurenine Pathway Metabolites in Alzheimer’s Disease. J. Alzheimers Dis. 2017, 60, 495–504. [Google Scholar] [CrossRef] [PubMed]
  39. Wood, P.L. Lipidomics of Alzheimer’s disease: Current status. Alzheimers Res. Ther. 2012, 4, 5. [Google Scholar] [CrossRef] [Green Version]
  40. Li, N.-J.; Liu, W.-T.; Li, W.; Li, S.-Q.; Chen, X.-H.; Bi, K.-S.; He, P. Plasma metabolic profiling of Alzheimer’s disease by liquid chromatography/mass spectrometry. Clin. Biochem. 2010, 43, 992–997. [Google Scholar] [CrossRef]
  41. Kaddurah-Daouk, R.; Zhu, H.; Sharma, S.; Bogdanov, M.; Rozen, S.G.; Matson, W.; Oki, N.O.; Motsinger-Reif, A.A.; Churchill, E.; Lei, Z.; et al. Alterations in metabolic pathways and networks in Alzheimer’s disease. Transl. Psychiatry 2013, 3, e244. [Google Scholar] [CrossRef] [Green Version]
  42. Martínez, M.F.; Martín, X.E.; Alcelay, L.G.; Flores, J.C.; Valiente, J.M.U.; Juanbeltz, B.I.; Beldarraín, M.; Ángeles, G.; López, J.M.; Gonzalez-Fernández, M.C.; et al. The COMT Val158 Met polymorphism as an associated risk factor for Alzheimer disease and mild cognitive impairment in APOE 4 carriers. BMC Neurosci. 2009, 10, 125. [Google Scholar] [CrossRef] [Green Version]
  43. Gulyás, B.; Pavlova, E.; Kasa, P.; Gulya, K.; Bakota, L.; Várszegi, S.; Keller, É.; Horváth, M.C.; Nag, S.; Hermecz, I.; et al. Activated MAO-B in the brain of Alzheimer patients, demonstrated by [11C]-l-deprenyl using whole hemisphere autoradiography. Neurochem. Int. 2011, 58, 60–68. [Google Scholar] [CrossRef]
  44. Koistinen, V.M.; Kärkkäinen, O.; Borewicz, K.; Zarei, I.; Jokkala, J.; Micard, V.; Rosa-Sibakov, N.; Auriola, S.; Aura, A.-M.; Smidt, H.; et al. Contribution of gut microbiota to metabolism of dietary glycine betaine in mice and in vitro colonic fermentation. Microbiome 2019, 7, 103. [Google Scholar] [CrossRef]
  45. Aswad, M.; Rayan, M.; Abu-Lafi, S.; Falah, M.; Raiyn, J.; Abdallah, Z.; Rayan, A. Nature is the best source of anti-inflammatory drugs: Indexing natural products for their anti-inflammatory bioactivity. Inflamm. Res. 2018, 67, 67–75. [Google Scholar] [CrossRef]
  46. Sun, H.; Cai, W.; Wang, X.; Liu, Y.; Hou, B.; Zhu, X.; Qiu, L. Vaccaria hypaphorine alleviates lipopolysaccharide-induced inflammation via inactivation of NFκB and ERK pathways in Raw 264.7 cells. BMC Complement. Altern. Med. 2017, 17, 120. [Google Scholar] [CrossRef] [Green Version]
  47. Hartai, Z.; Juhász, A.; Rimanóczy, Á.; Janáky, T.; Donkó, T.; Dux, L.; Penke, B.; Tóth, G.K.; Janka, Z.; Kálmán, J. Decreased serum and red blood cell kynurenic acid levels in Alzheimer’s disease. Neurochem. Int. 2007, 50, 308–313. [Google Scholar] [CrossRef]
  48. Gulaj, E.; Pawlak, K.; Bien, B.; Pawlak, D. Kynurenine and its metabolites in Alzheimer’s disease patients. Adv. Med. Sci. 2010, 55, 204–211. [Google Scholar] [CrossRef]
  49. Poeggeler, B.; Rassoulpour, A.; Wu, H.-Q.; Guidetti, P.; Roberts, R.; Schwarcz, R. Dopamine receptor activation reveals a novel, kynurenate-sensitive component of striatal N-methyl-d-aspartate neurotoxicity. Neuroscience 2007, 148, 188–197. [Google Scholar] [CrossRef] [Green Version]
  50. Raison, C.L.; Rook, G.W.; Miller, A.H.; Begay, T.K. Chapter 26—Role of Inflammation in Psychiatric Disease. In Neurobiology of Brain Disorders; Zigmond, M.J., Rowland, L.P., Coyle, J.T., Eds.; Academic Press: San Diego, CA, USA, 2015; pp. 396–421. Available online: http://www.sciencedirect.com/science/article/pii/B9780123982704000264 (accessed on 12 January 2021).
Figure 1. Box plots of two female biomarkers (A) vanillylmandelate and (B) tryptophan betaine, the p value (below Bonferroni significance threshold) and the association coefficient (beta) for metabolites in relation to diagnosis (AD/CTL) are shown above the box plots; ROC graphs, comparing area under curve (AUC) in predictive models using sex-specific biomarkers, CSF biomarkers, covariates, and the combination of them in (C) the female sub-dataset; (D) the male sub-dataset; (E) the full cohort; (F) Bar plot summarises the AUC of the above mentioned ROC curves together with standard errors after bootstrapping.
Biomedicines 09 01610 g001
Figure 2. Eleven metabolites showed associations with AD and one other endophenotype. Five plasma metabolites (with brown grid), isovalerylcarnitine, methyl 4-, carotene diol (2), 1-linoleoyl glycerol and carotene diol (1), were significantly associated with diagnosis and the other AD endophenotypes in the female group only. Six other metabolites (with blue grid), xanturenate, N-acetylneuraminate, LPC (18:2), kynurenate, 5-(galactosylhydroxy)-L-lysine and SM (d38:0), showed associations with diagnosis and AD variables in the male group only.
Biomedicines 09 01610 g002
Table 1. Sample demographics.
Sample Size
(N Max)
CTLMCIADp-Value *
AgeAll (695)65 (7.9)70 (8.1)70 (8.49)6.52 × 10⁻¹⁴
Sex (f/m)All (377/318)155/128141/13481/563.13 × 10−1
APOE ε4 (+/−)All (348/347)111/172153/12284/537.30 × 10−6
Aβ z-score693−0.22 (1.11)−0.82 (0.99)−1.22
(0.64)
<2.00 × 10⁻¹⁶
p-tau z-score640−0.00087
(0.99)
−0.94 (1.38)−1.31
(1.66)
<2.00 × 10⁻¹⁶
t-tau z-score6370.032 (0.84)−0.98 (1.25)−1.65 (1.60)<2.00 × 10⁻¹⁶
Attention z-score6440.21 (1.13)−0.91 (1.63)−1.92 (1.99)<2.00 × 10⁻¹⁶
Executive z-score5260.16 (1.16)−0.79 (2.04)−2.26 (2.55)<2.00 × 10⁻¹⁶
Language z-score674−0.18 (0.99)−1.0 (1.25)−2.08 (1.27)<2.00 × 10⁻¹⁶
Memory delayed z-score551−0.037 (1.15)−1.52 (1.40)−2.40 (1.070<2.00 × 10⁻¹⁶
Memory immediate z-score637−0.50 (1.77)−1.57 (1.39)−2.34 (1.24)<2.00 × 10⁻¹⁶
Visuo-construction
z-score
436−0.20 (1.34)−0.14 (1.47)−1.36 (1.98)1.93 × 10⁻⁸
Hippocampal left4553761.21 (453.57)3272.52 (634.5703017.90 (487.63)<2.00 × 10⁻¹⁶
Hippocampal right4553878.12 (436.76)3388.14 (628.15)3146.17 (500.52)<2.00 × 10⁻¹⁶
Hippocampal sum4557639.32 (857.95)6660.69 (1210.53)6182.10 (913.81)<2.00 × 10⁻¹⁶
Cortical thickness in whole brain4202.30 (0.12)2.30 (0.11)2.28 (0.11)5.47 × 10⁻¹
Cortical thickness in AD regions4202.66 (0.16)2.63 (0.15)2.58 (0.17)1.95 × 10⁻⁴
Taking AChEI, yes/no76/1491/4050/7825/311.3 × 10−5
Taking other AD medications, yes/no23/2010/4116/1127/481.55 × 10−1
Results are mean (standard deviation) for continuous variables for columns of “CTL”, “MCI” and “AD”. Column “Sample size (N max)” represents the number of participants that the variables are available for. Aβ, amyloid beta; AChEI, acetylcholine esterase inhibitor; AD, Alzheimer’s disease; APOE ε4, apolipoproteinE ε4; MCI, mild cognitive impairment; MMSE, Mini-Mental State Examination; CTL, control; ROD, rate of cognitive decline. * Differences in the means/frequencies of clinical/demographic variables were tested using ANOVA or χ2 test.
Table 2. Association results for metabolites in relation to diagnosis (AD/CTL) in the full cohort and after stratification by sex.
MetaboliteInteraction
Effect
Interaction
p-Value
Female
Effect
Female
p-Value
95% CIMale
Effect
Male
p-Value
95% CI
VMA0.841.66 × 10−30.771.14 × 10−40.04 to 1.18−0.160.438
Tryptophan betaine−0.581.92 × 10−2−0.731.48 × 10−4−1.12 to 0.36−0.0150.934
Kynurenate0.692.35 × 10−20.370.043 −1.047.63 × 10−5−1.58 to 0.54
AD, Alzheimer’s disease; CTL, controls, VMA, vanillylmandelate.
Publisher’s Note: MDPI stays neutral with regard to jurisdictional claims in published maps and institutional affiliations.

