Orthosiphon stamineus Proteins Alleviate Pentylenetetrazol-Induced Seizures in Zebrafish

 and
and 
Abstract
1. Introduction
2. Experimental Section
2.1. Materials Chemicals and Apparatuses
2.2. Software and Equipment
2.3. Zebrafish Maintenance and Housing Conditions
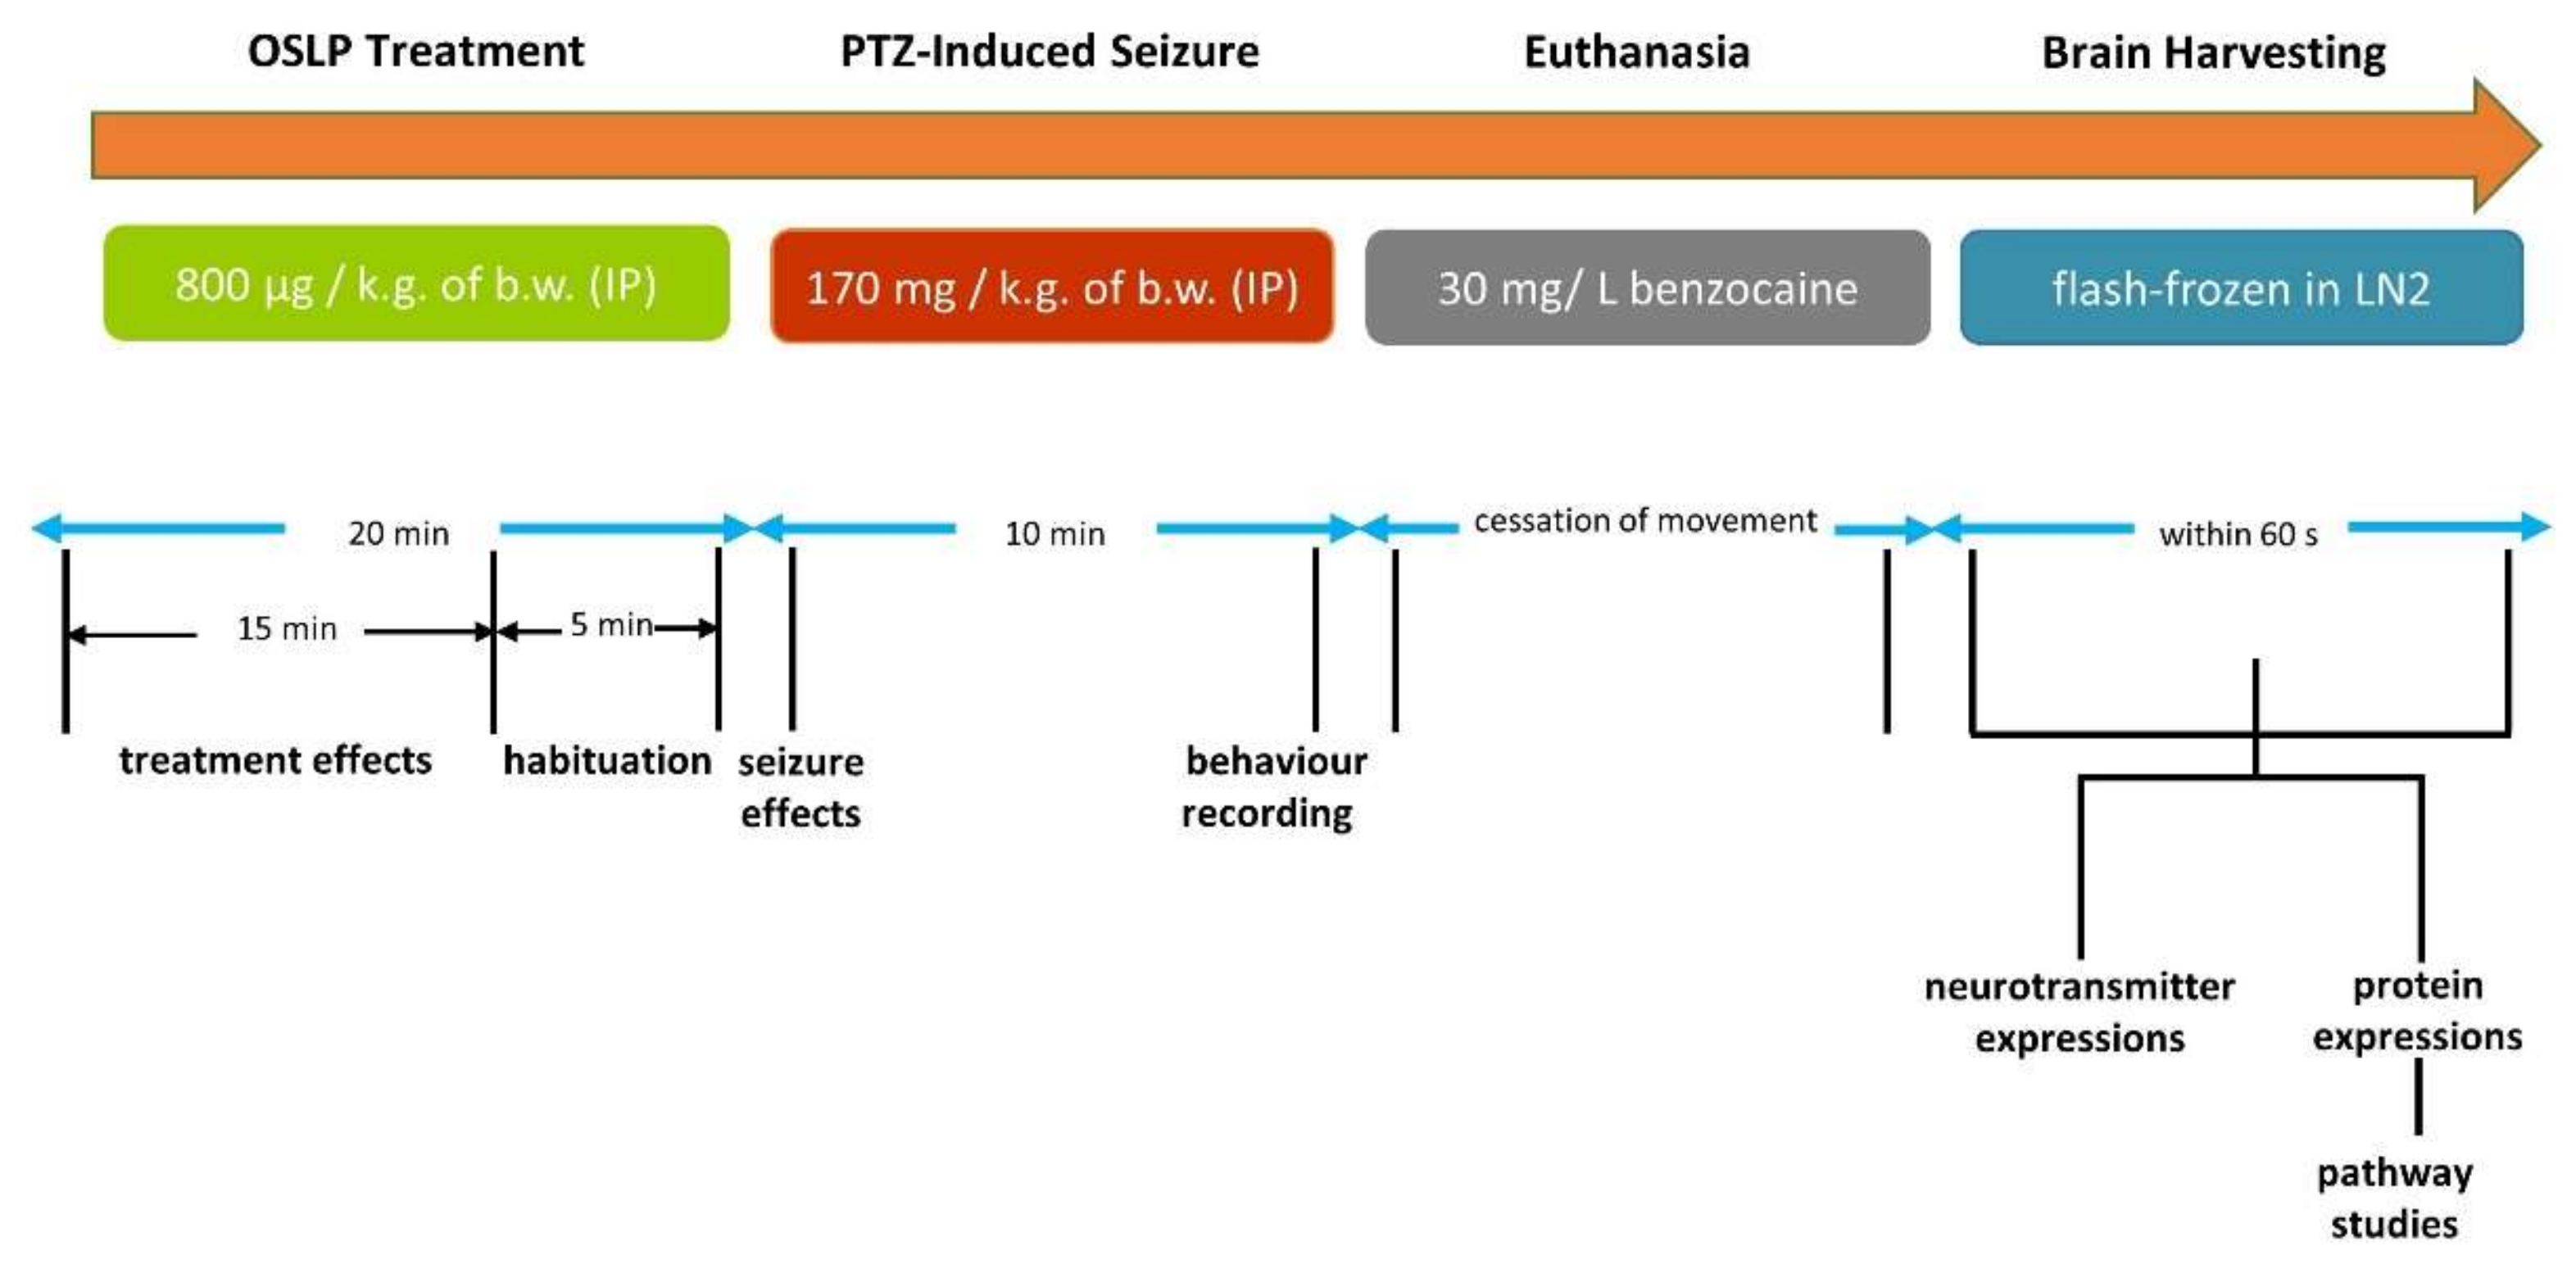
2.4. Experimental Design
2.4.1. OSLP Safety Study in Adult Zebrafish
2.4.2. Anticonvulsive Potential of OSLP in Adult Zebrafish
2.5. Extraction of Brains from Zebrafish
2.6. Brain Neurotransmitter Analysis Using Nanoflow Liquid Chromatography Coupled with Tandem Mass Spectrometry (Nanoflow-ESI-LC-MS/MS)
2.7. Protein Expression Profiling Using Mass Spectrometry-Based Label-Free Proteomic Quantification (LFQ)
2.7.1. Protein Extraction from Zebrafish Brain
2.7.2. In-Solution Digestion of Proteins
2.7.3. De-Salting of Proteins
2.7.4. Mass Spectrometry-Based Label-Free Proteomic Quantification (LFQ) Using Nanoflow-ESI-LCMS/MS
2.7.5. Brain Protein and Peptide Identification by Automated de Novo Sequencing and LFQ Analysis
2.8. Bioinformatics Analysis
2.9. Statistical Analysis
3. Results
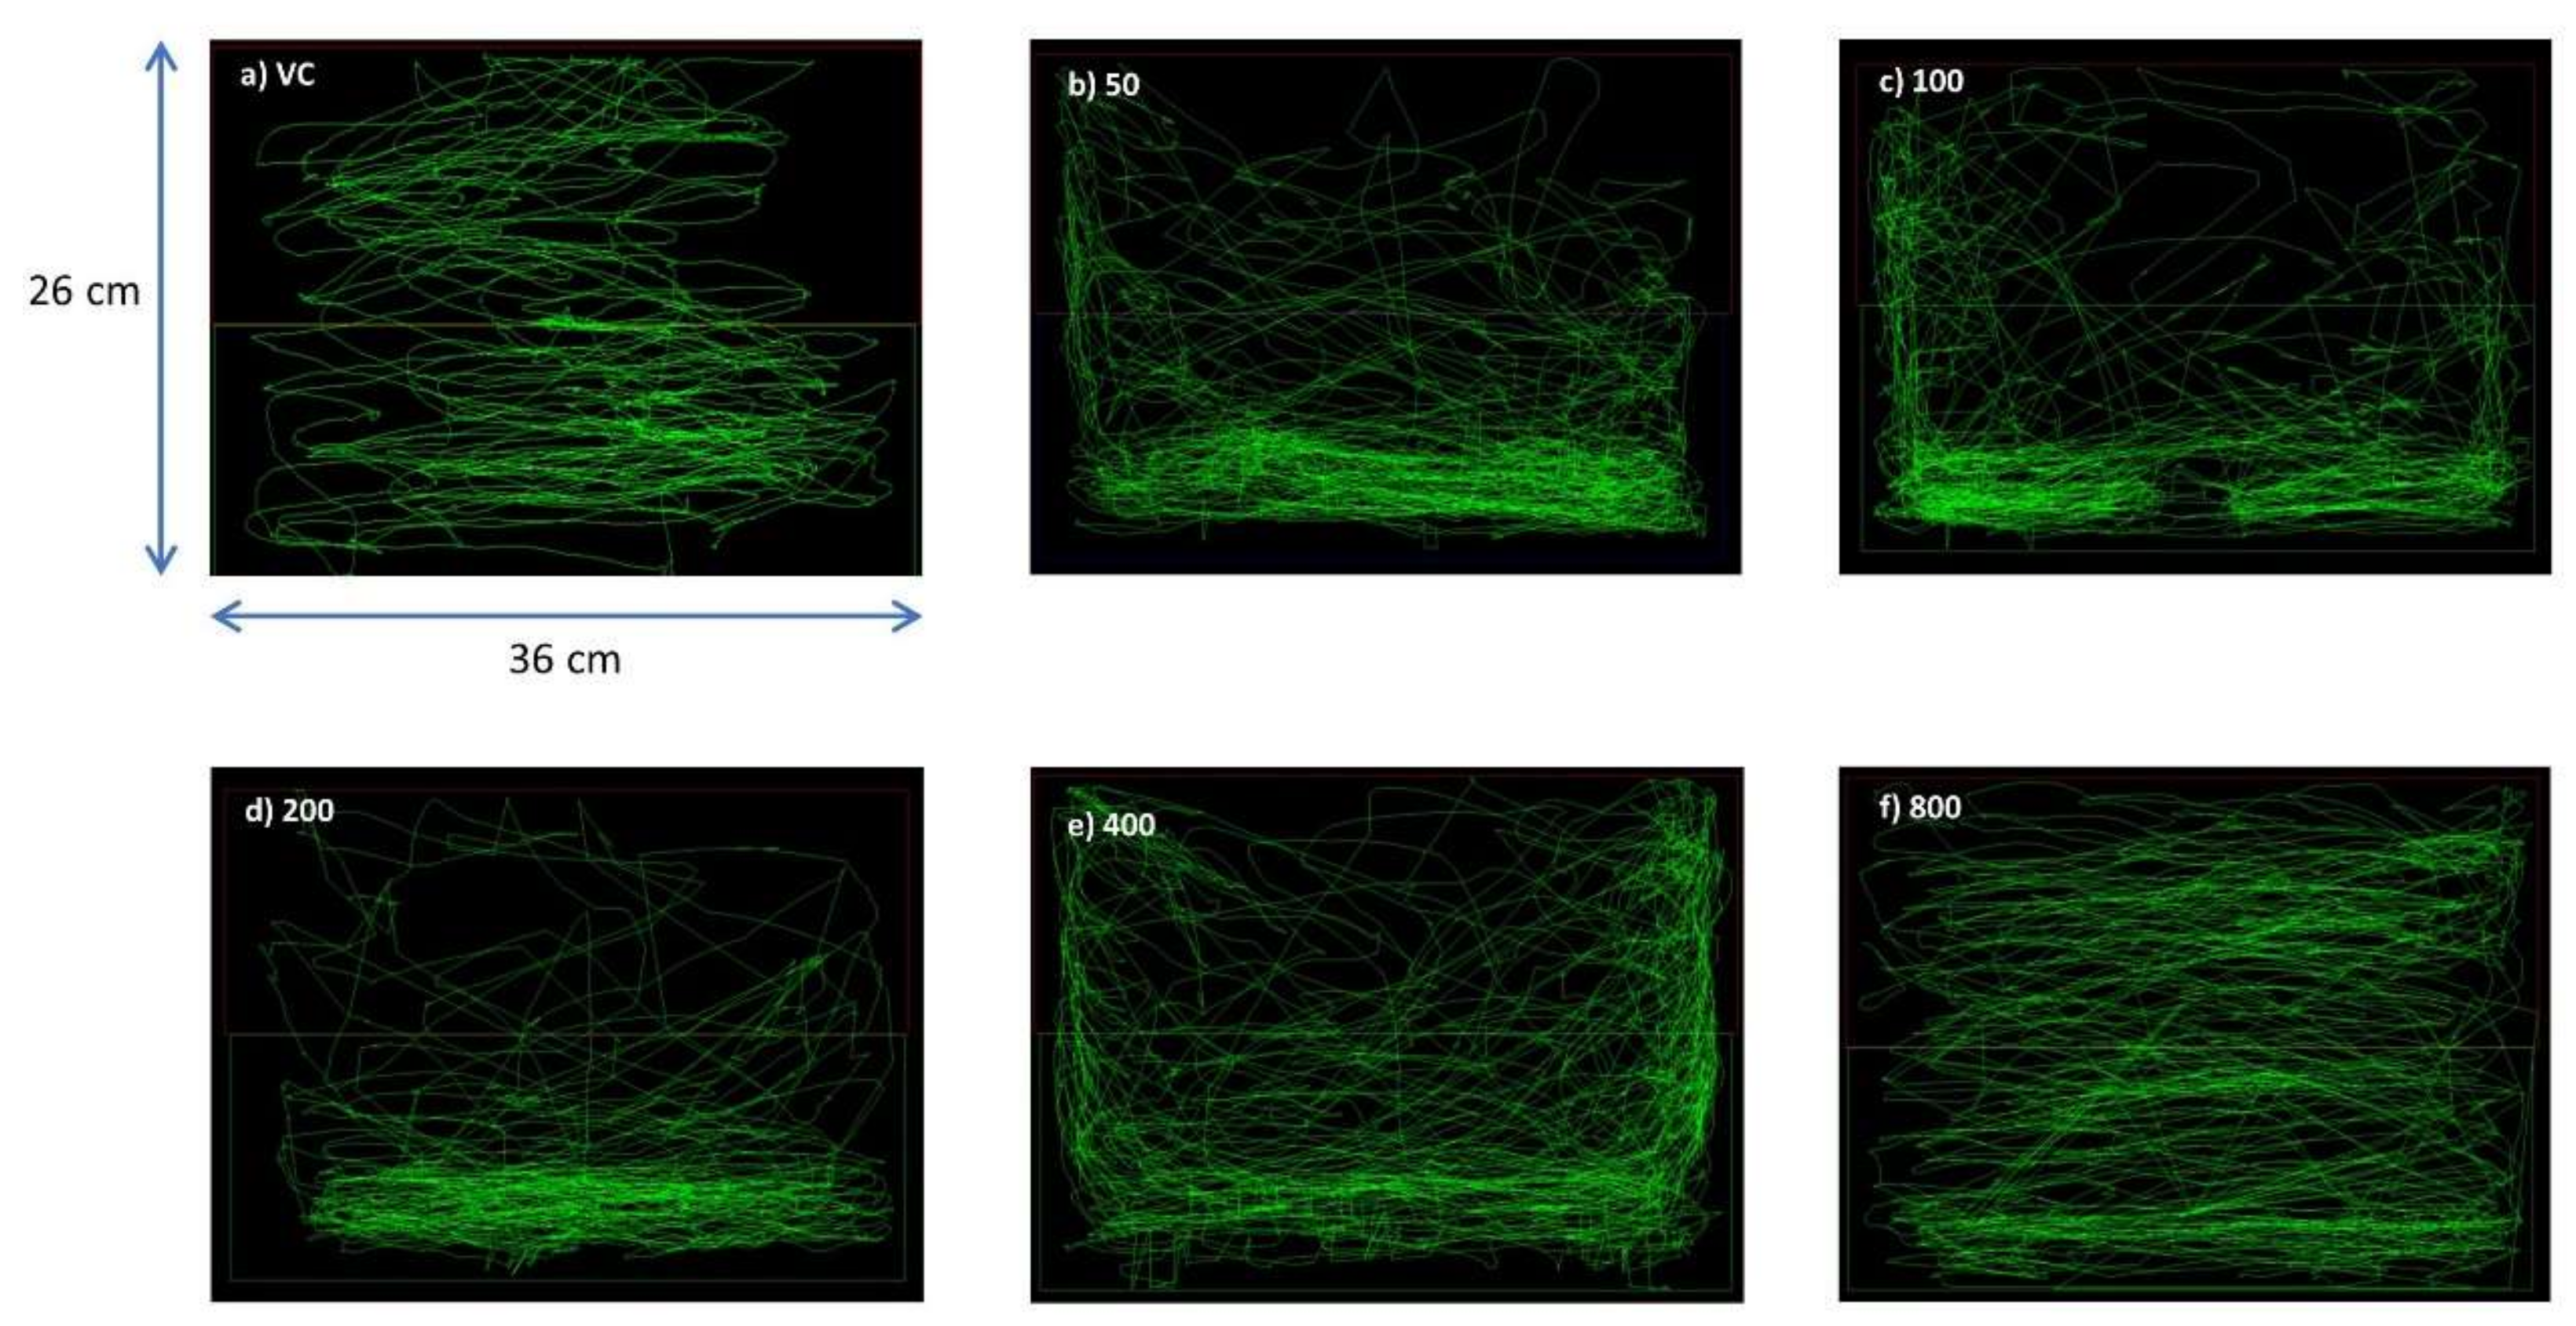
3.1. OSLP Safety Study in Adult Zebrafish
3.1.1. Behavioral Study
Swim Path Analysis
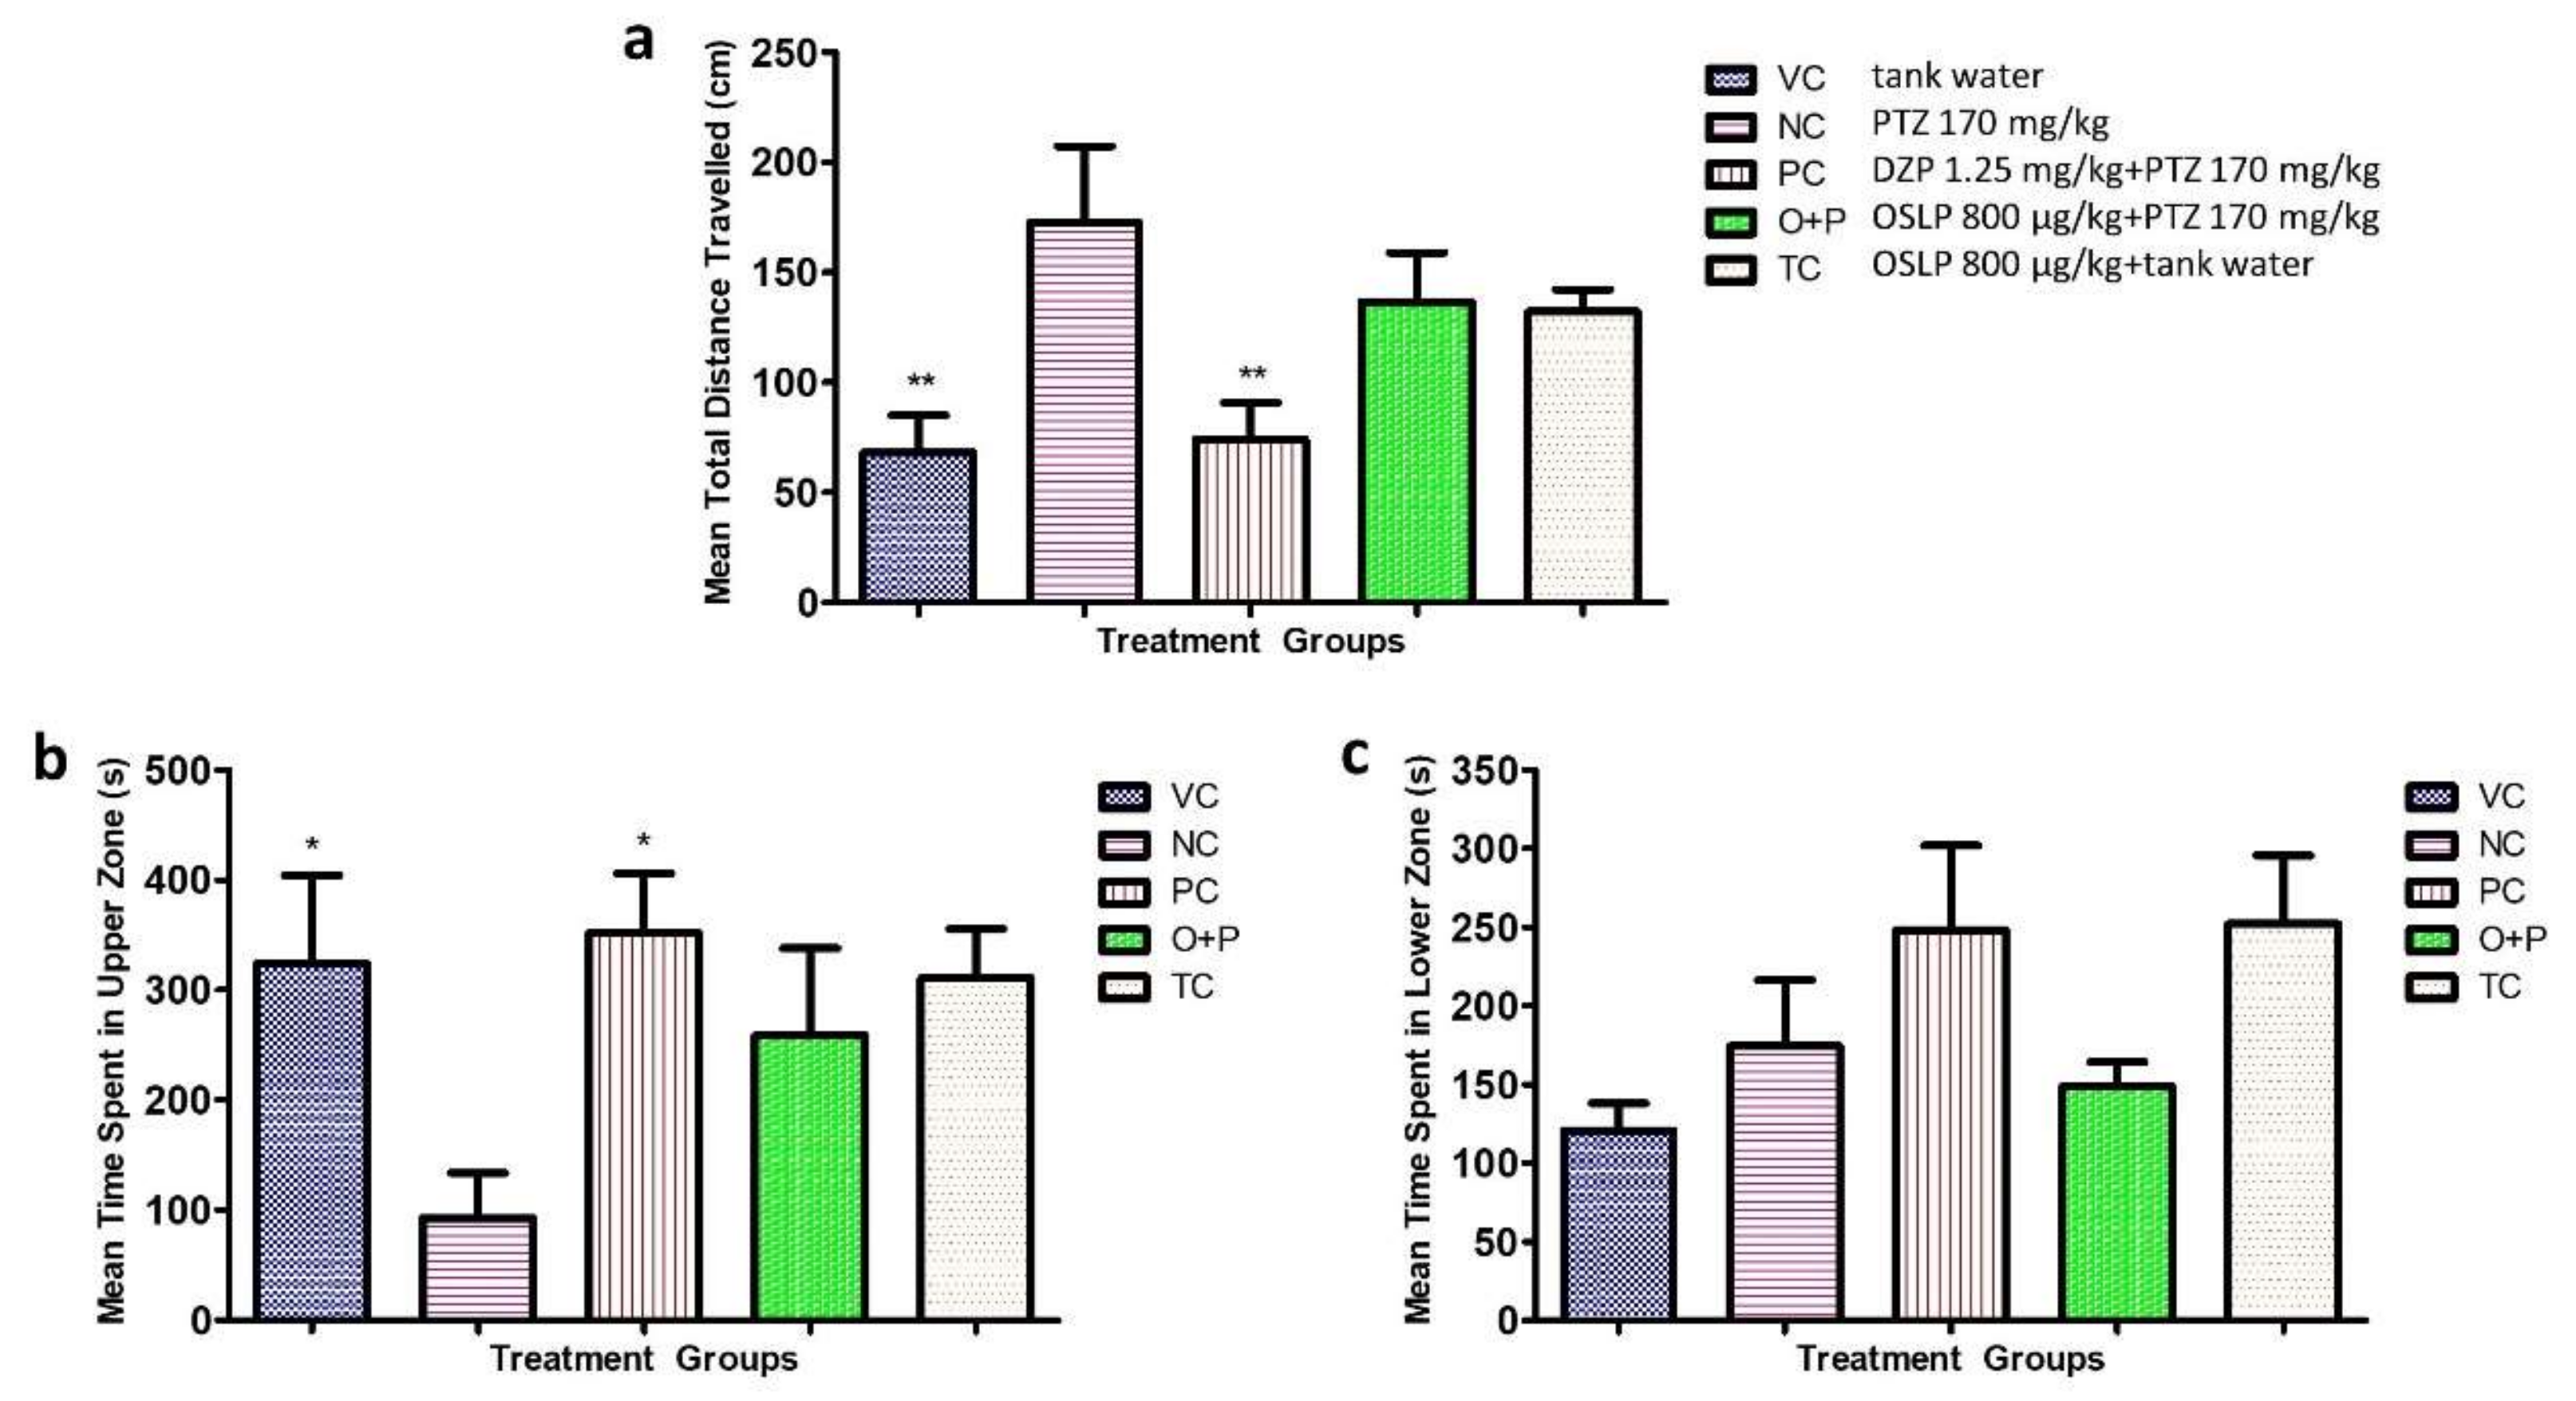
3.1.2. Locomotion Parameters
3.2. Evaluation of Anticonvulsive Potential of OSLP
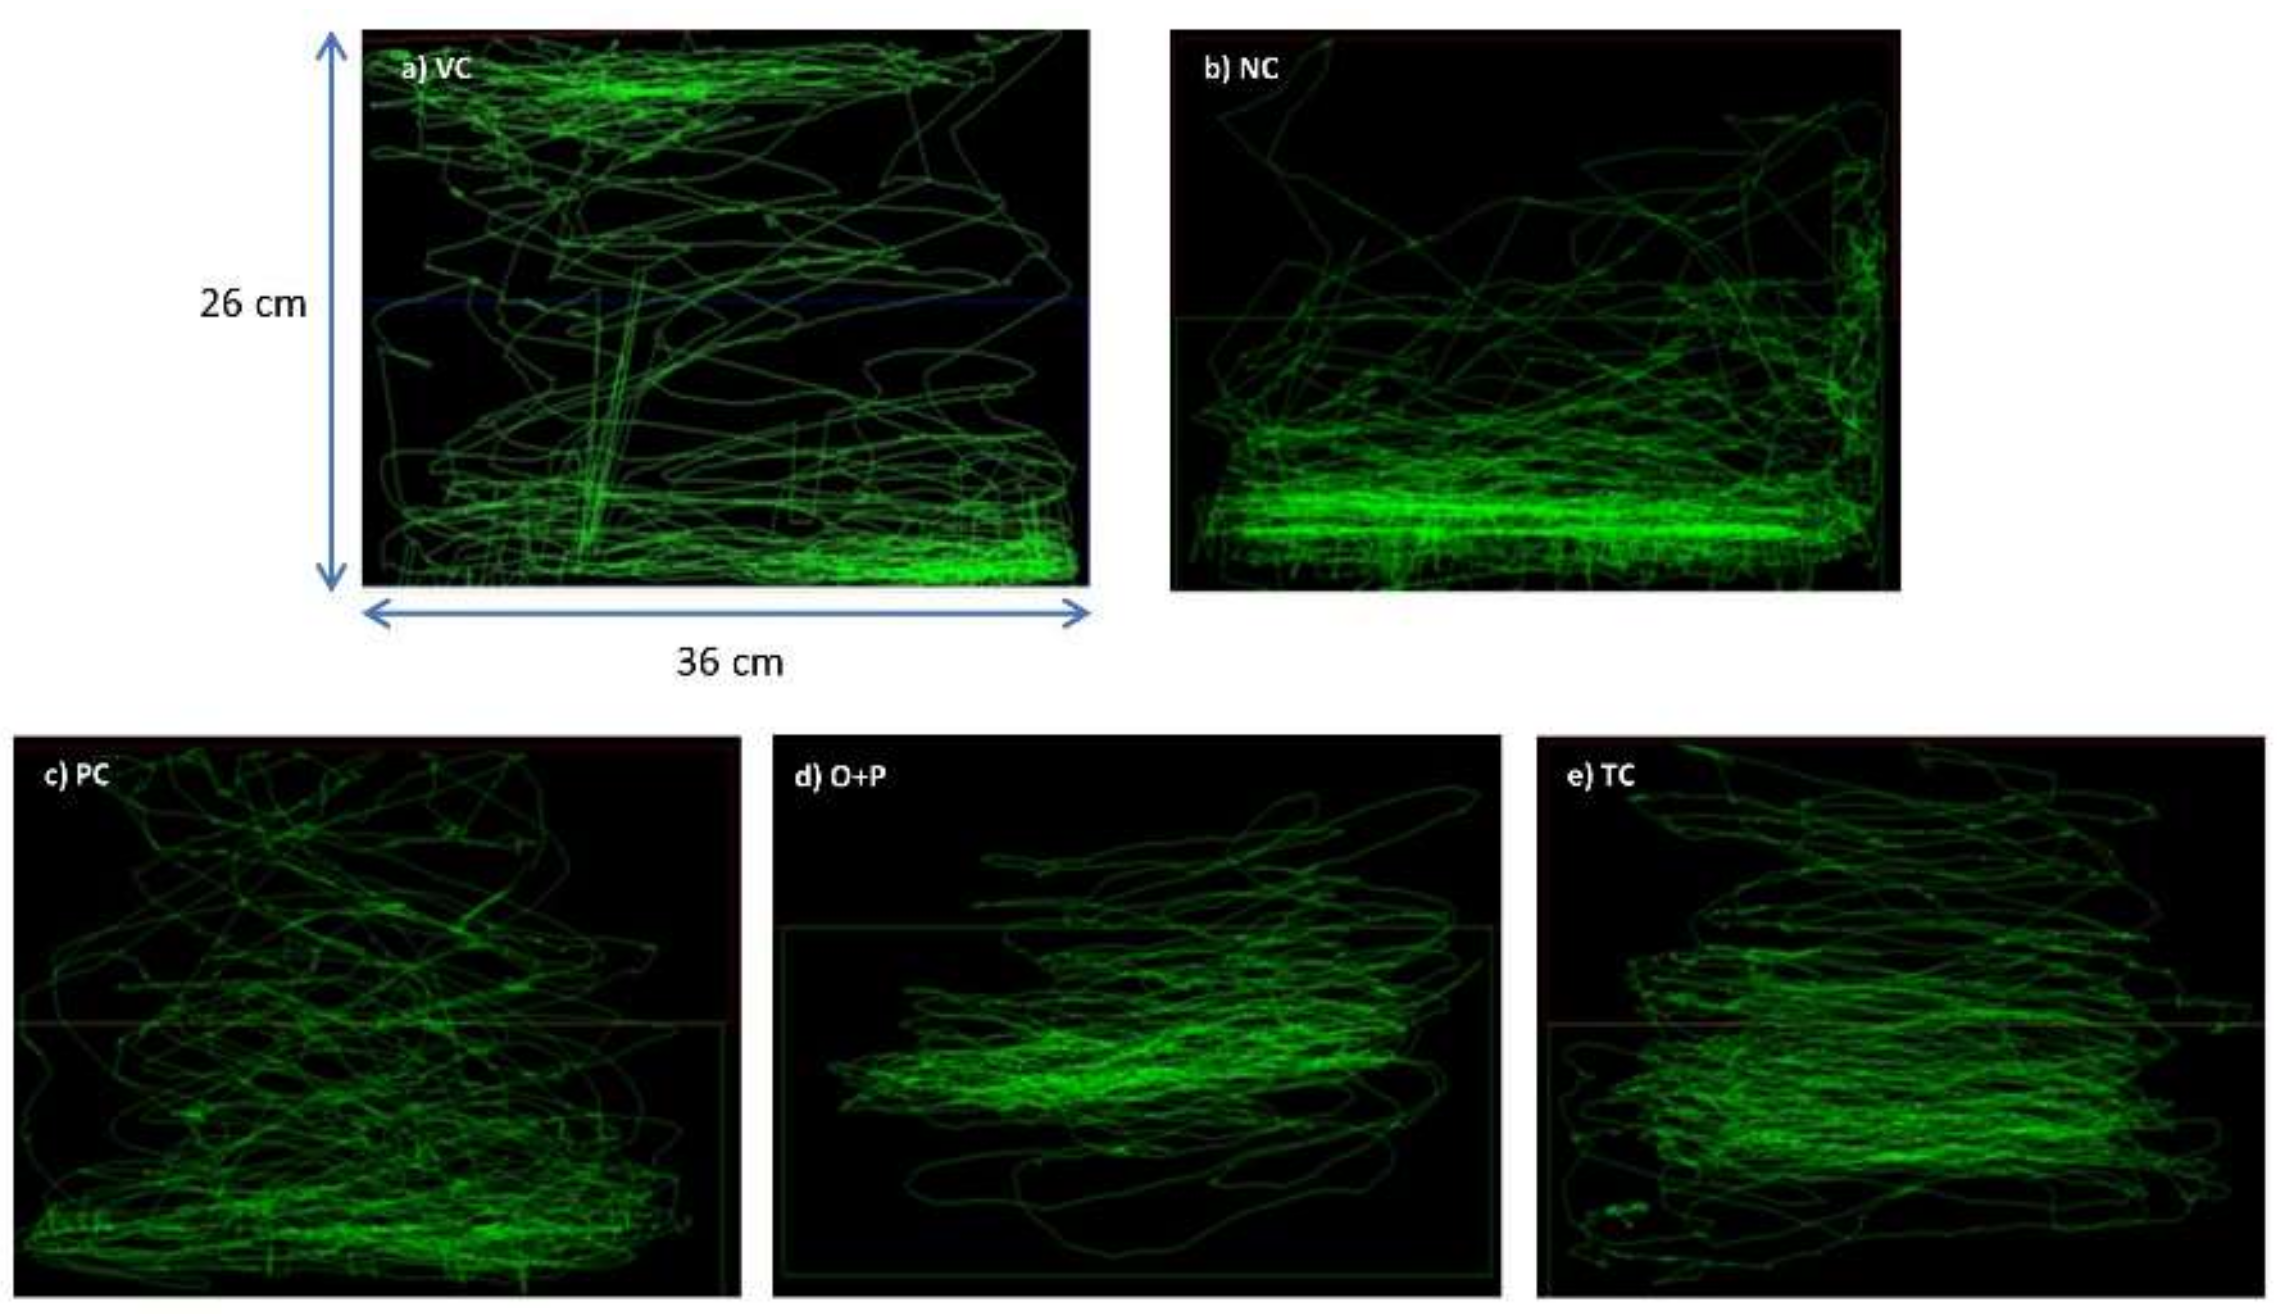
3.2.1. Behavioral Study
Swim Path Analysis
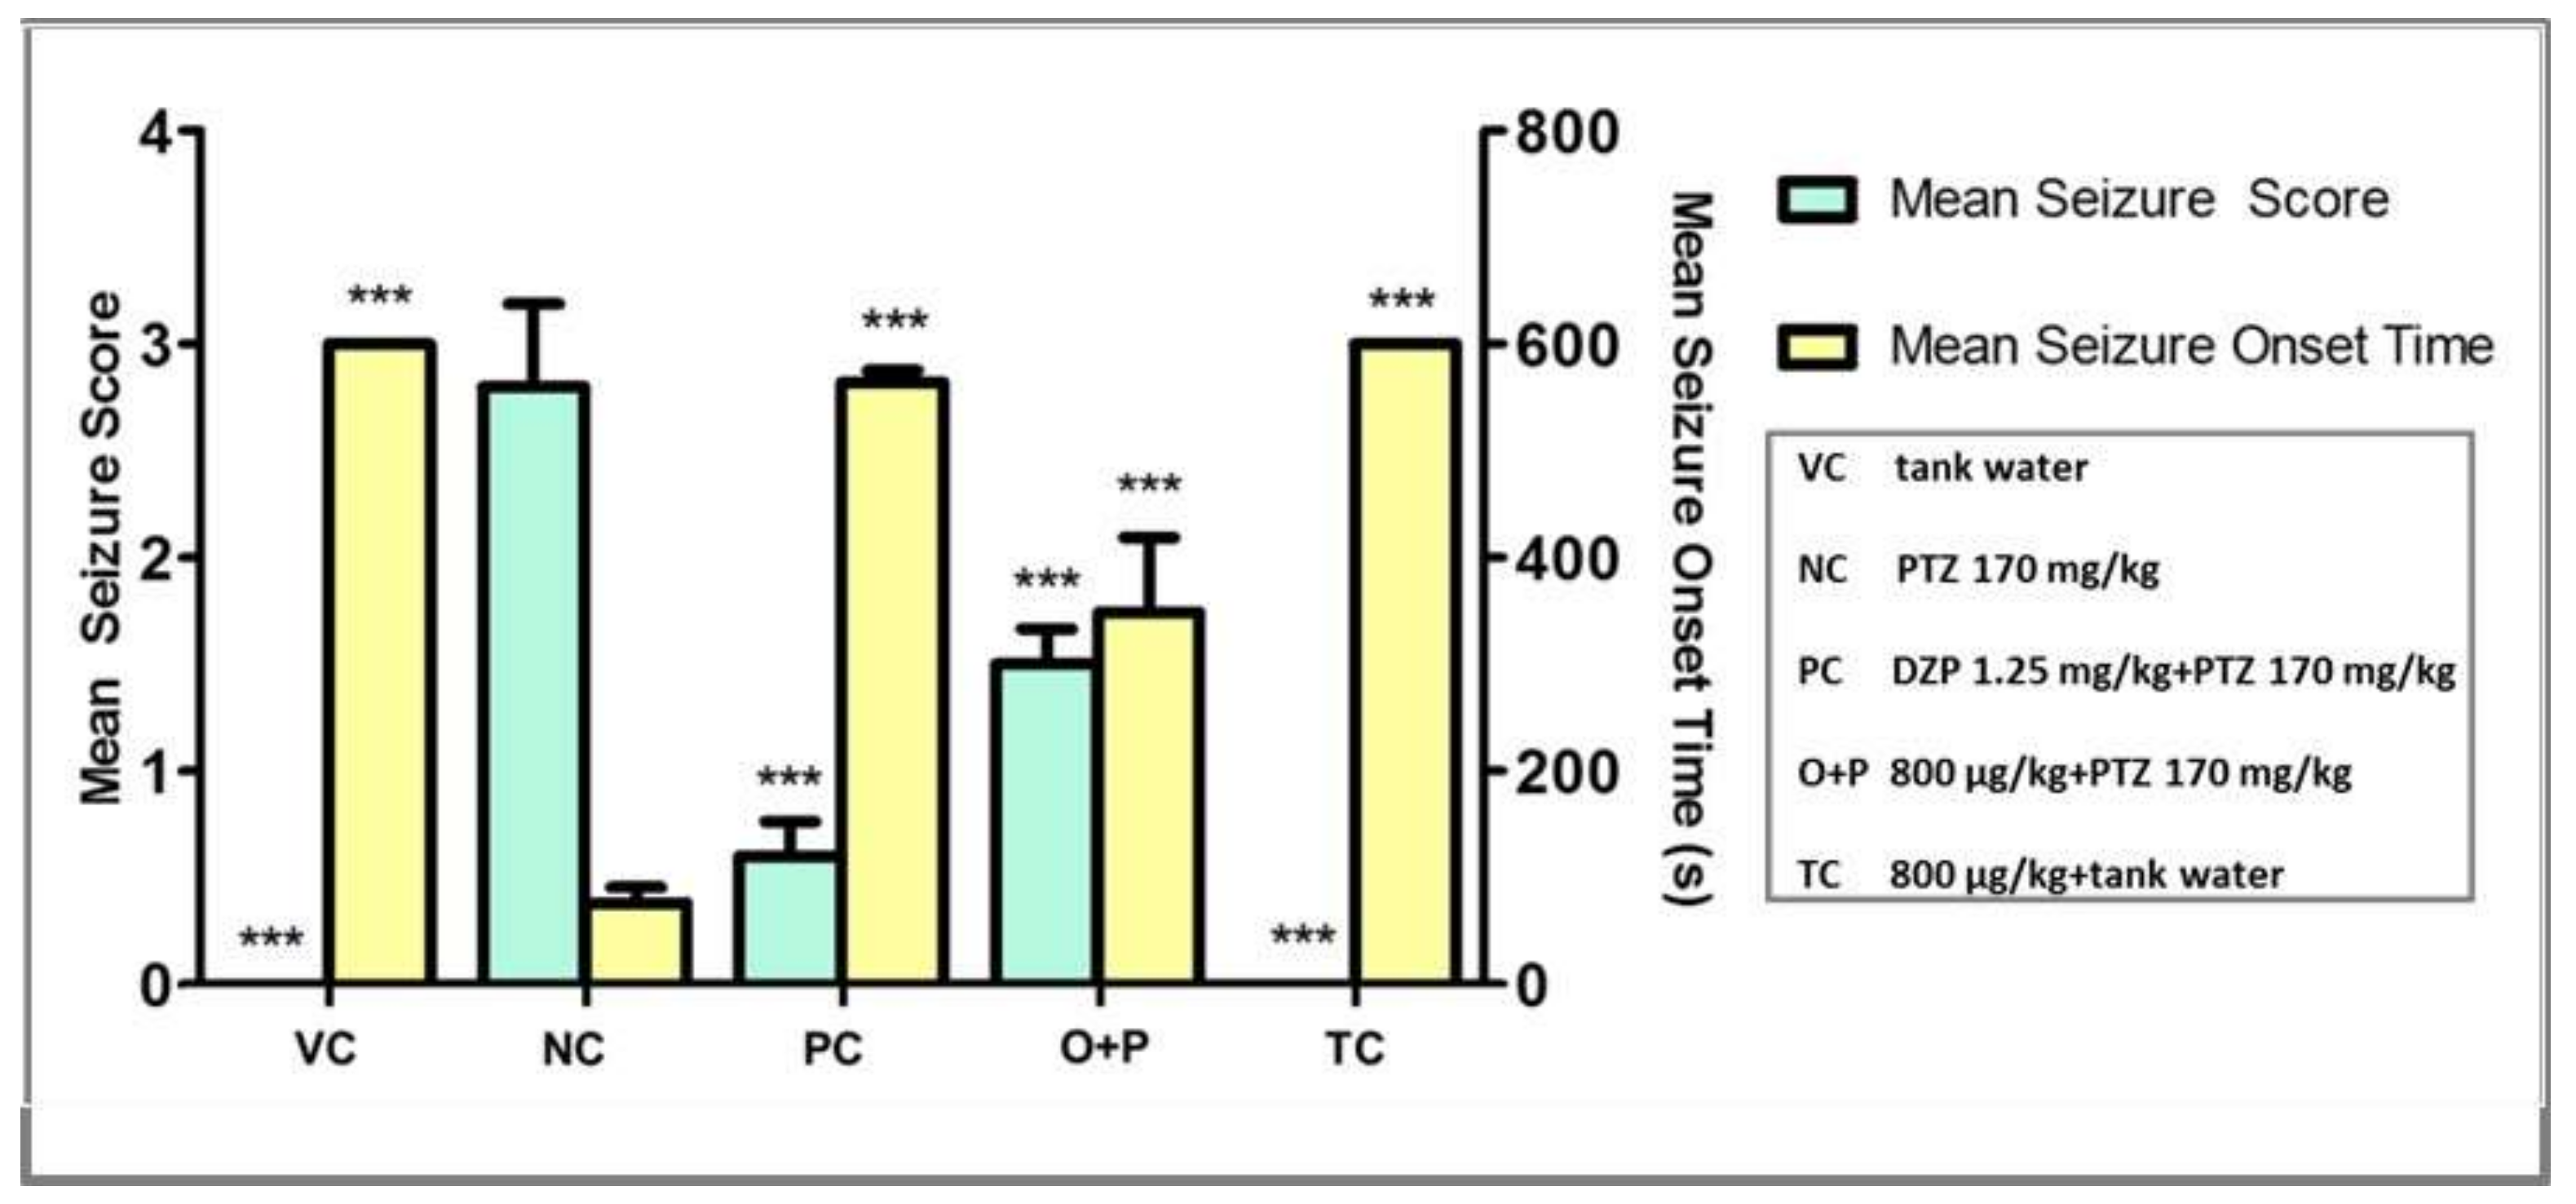
3.2.2. Seizure Score and Seizure Onset Time
3.2.3. Locomotion Parameters
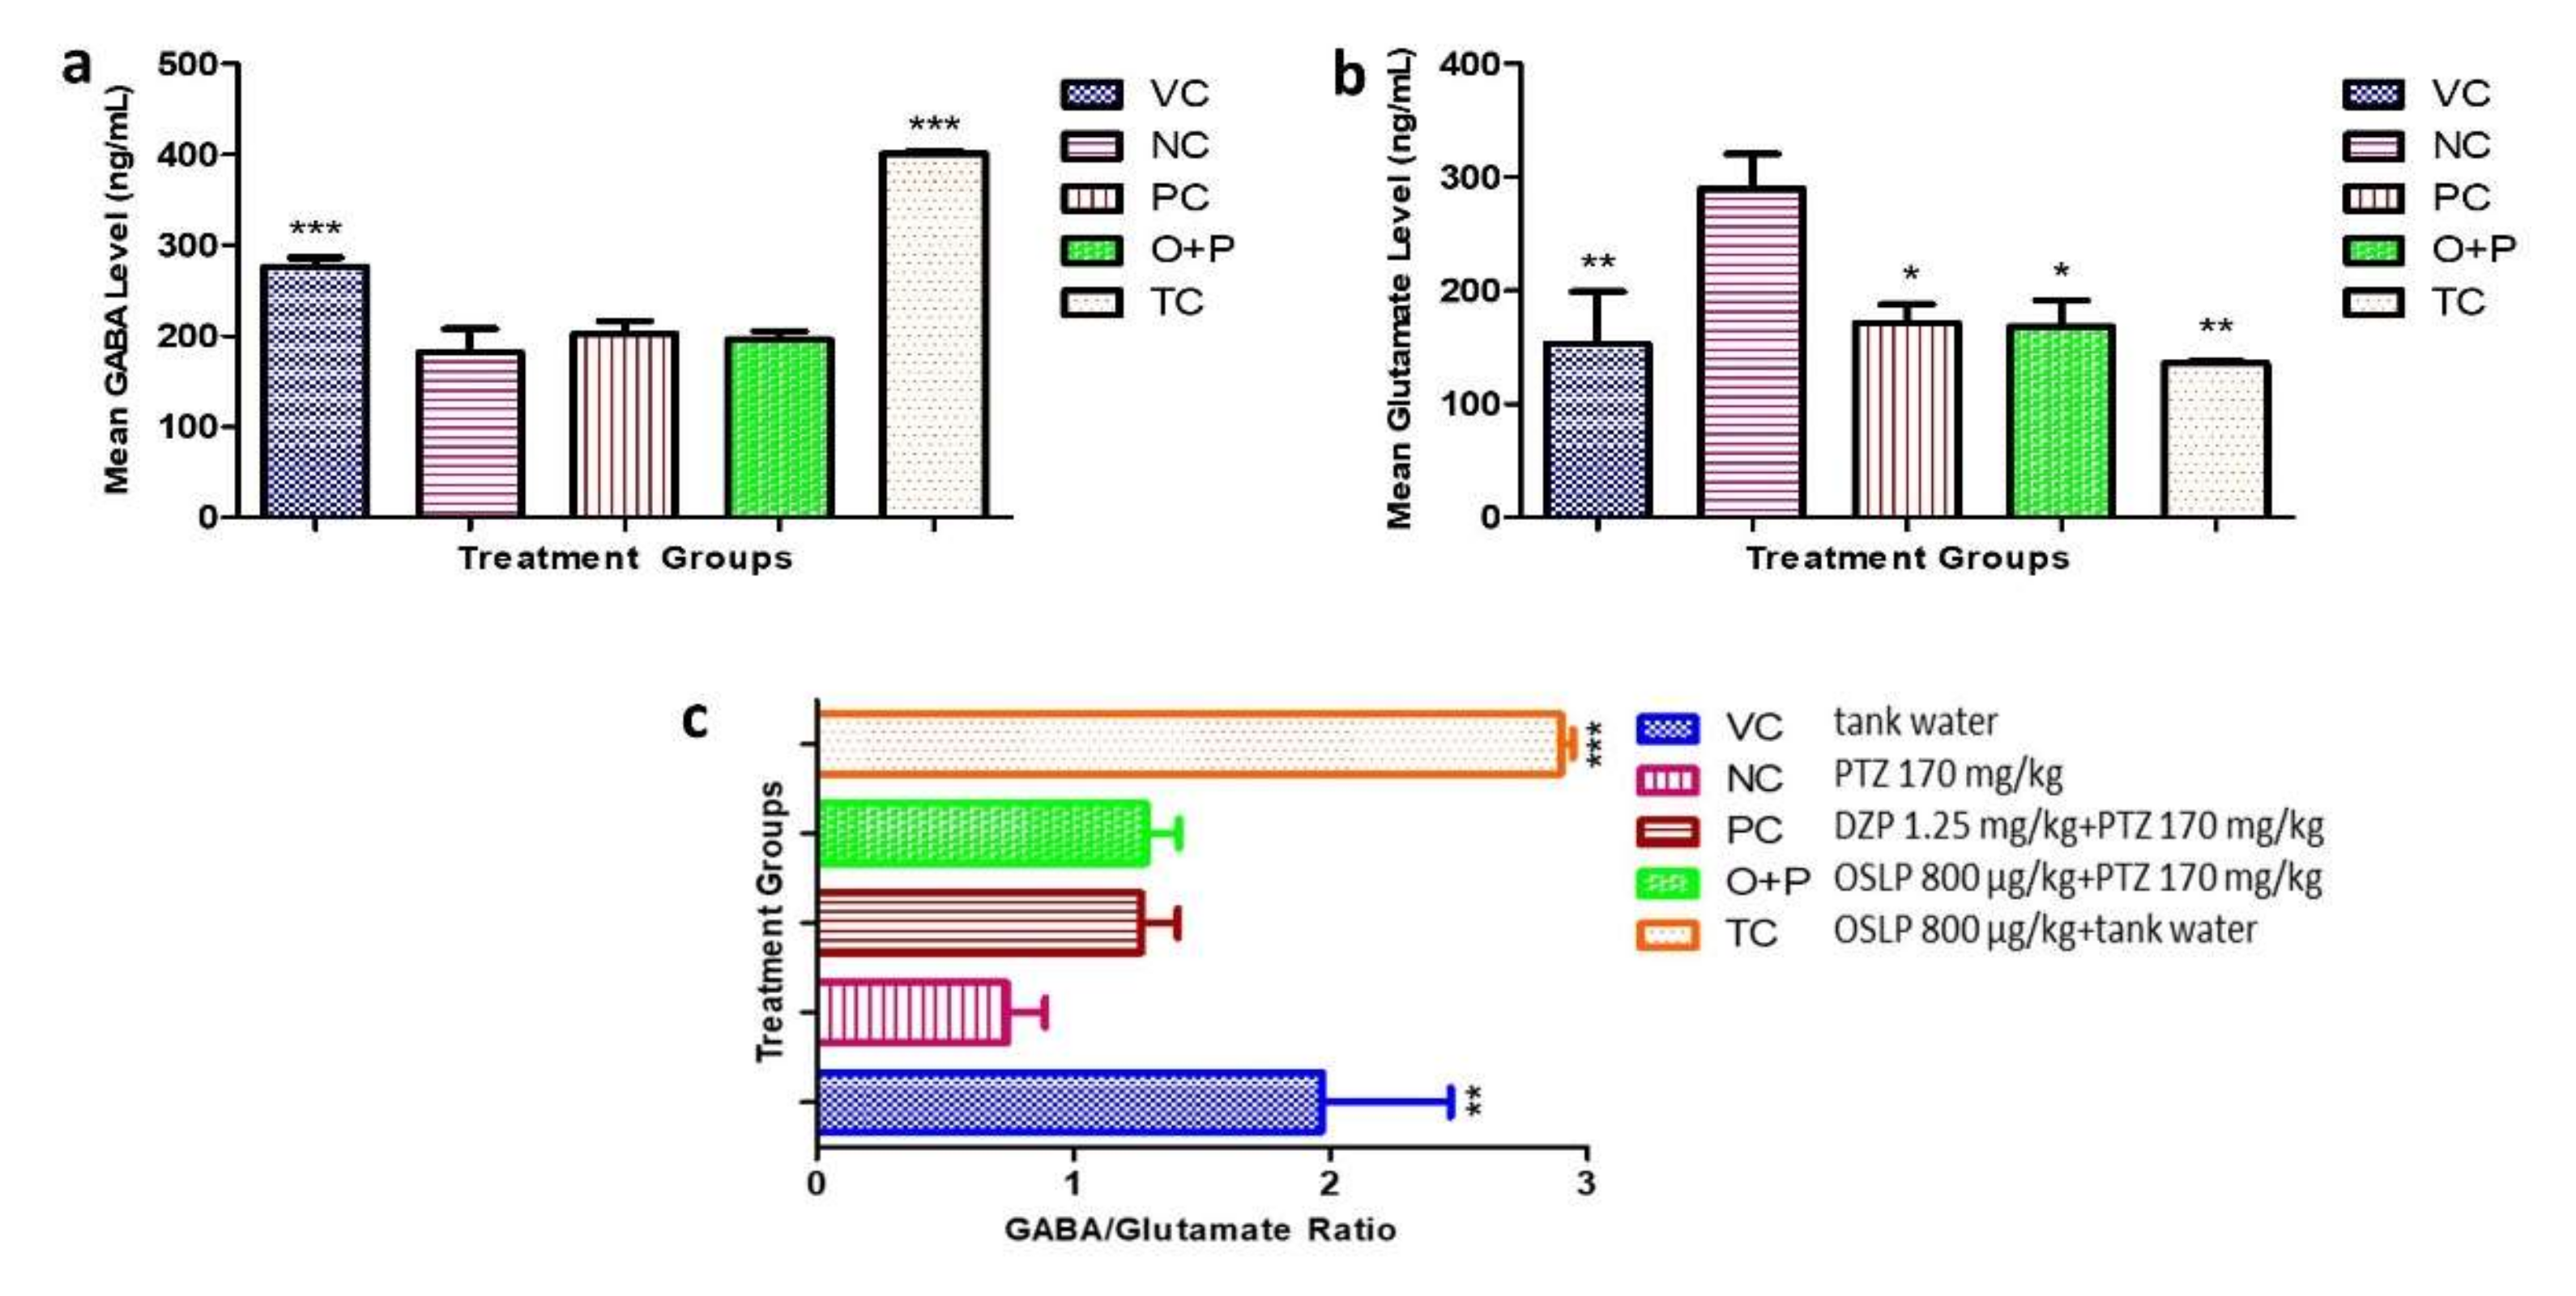
3.2.4. Neurotransmitter Study
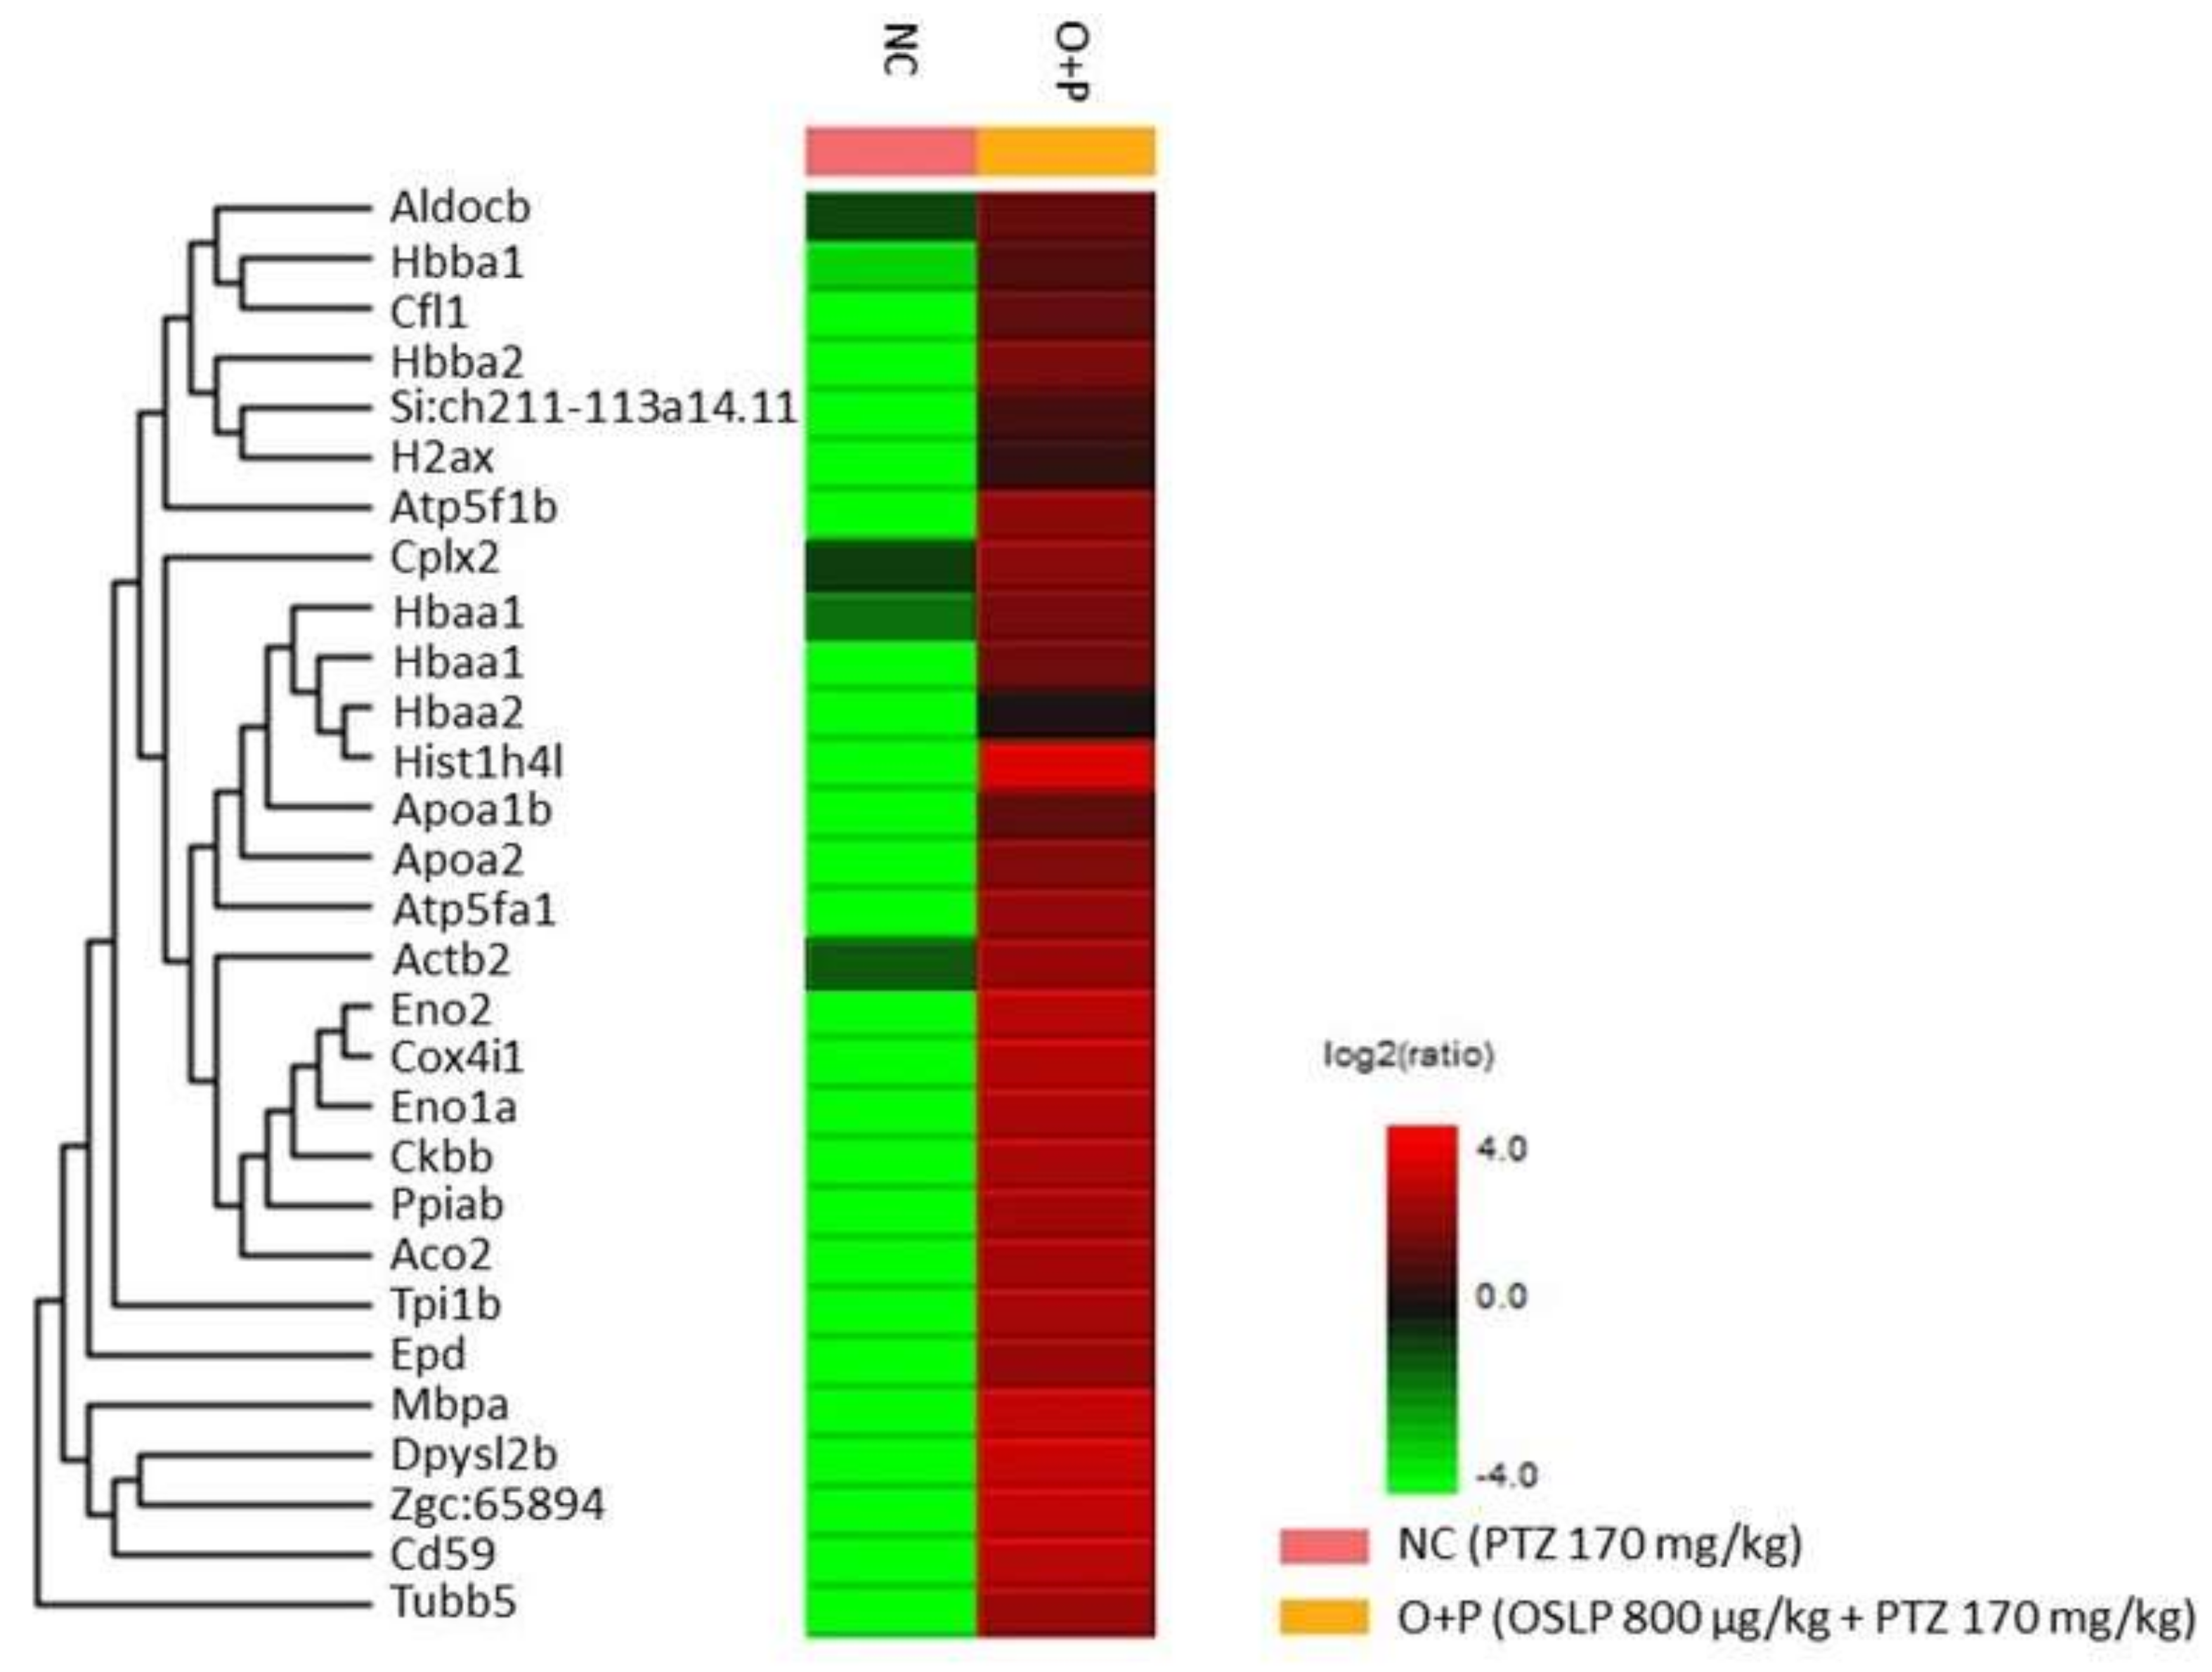
3.2.5. Proteins Expression Profiling Using Mass Spectrometry-Based Label-Free Proteomic Quantification (LFQ)
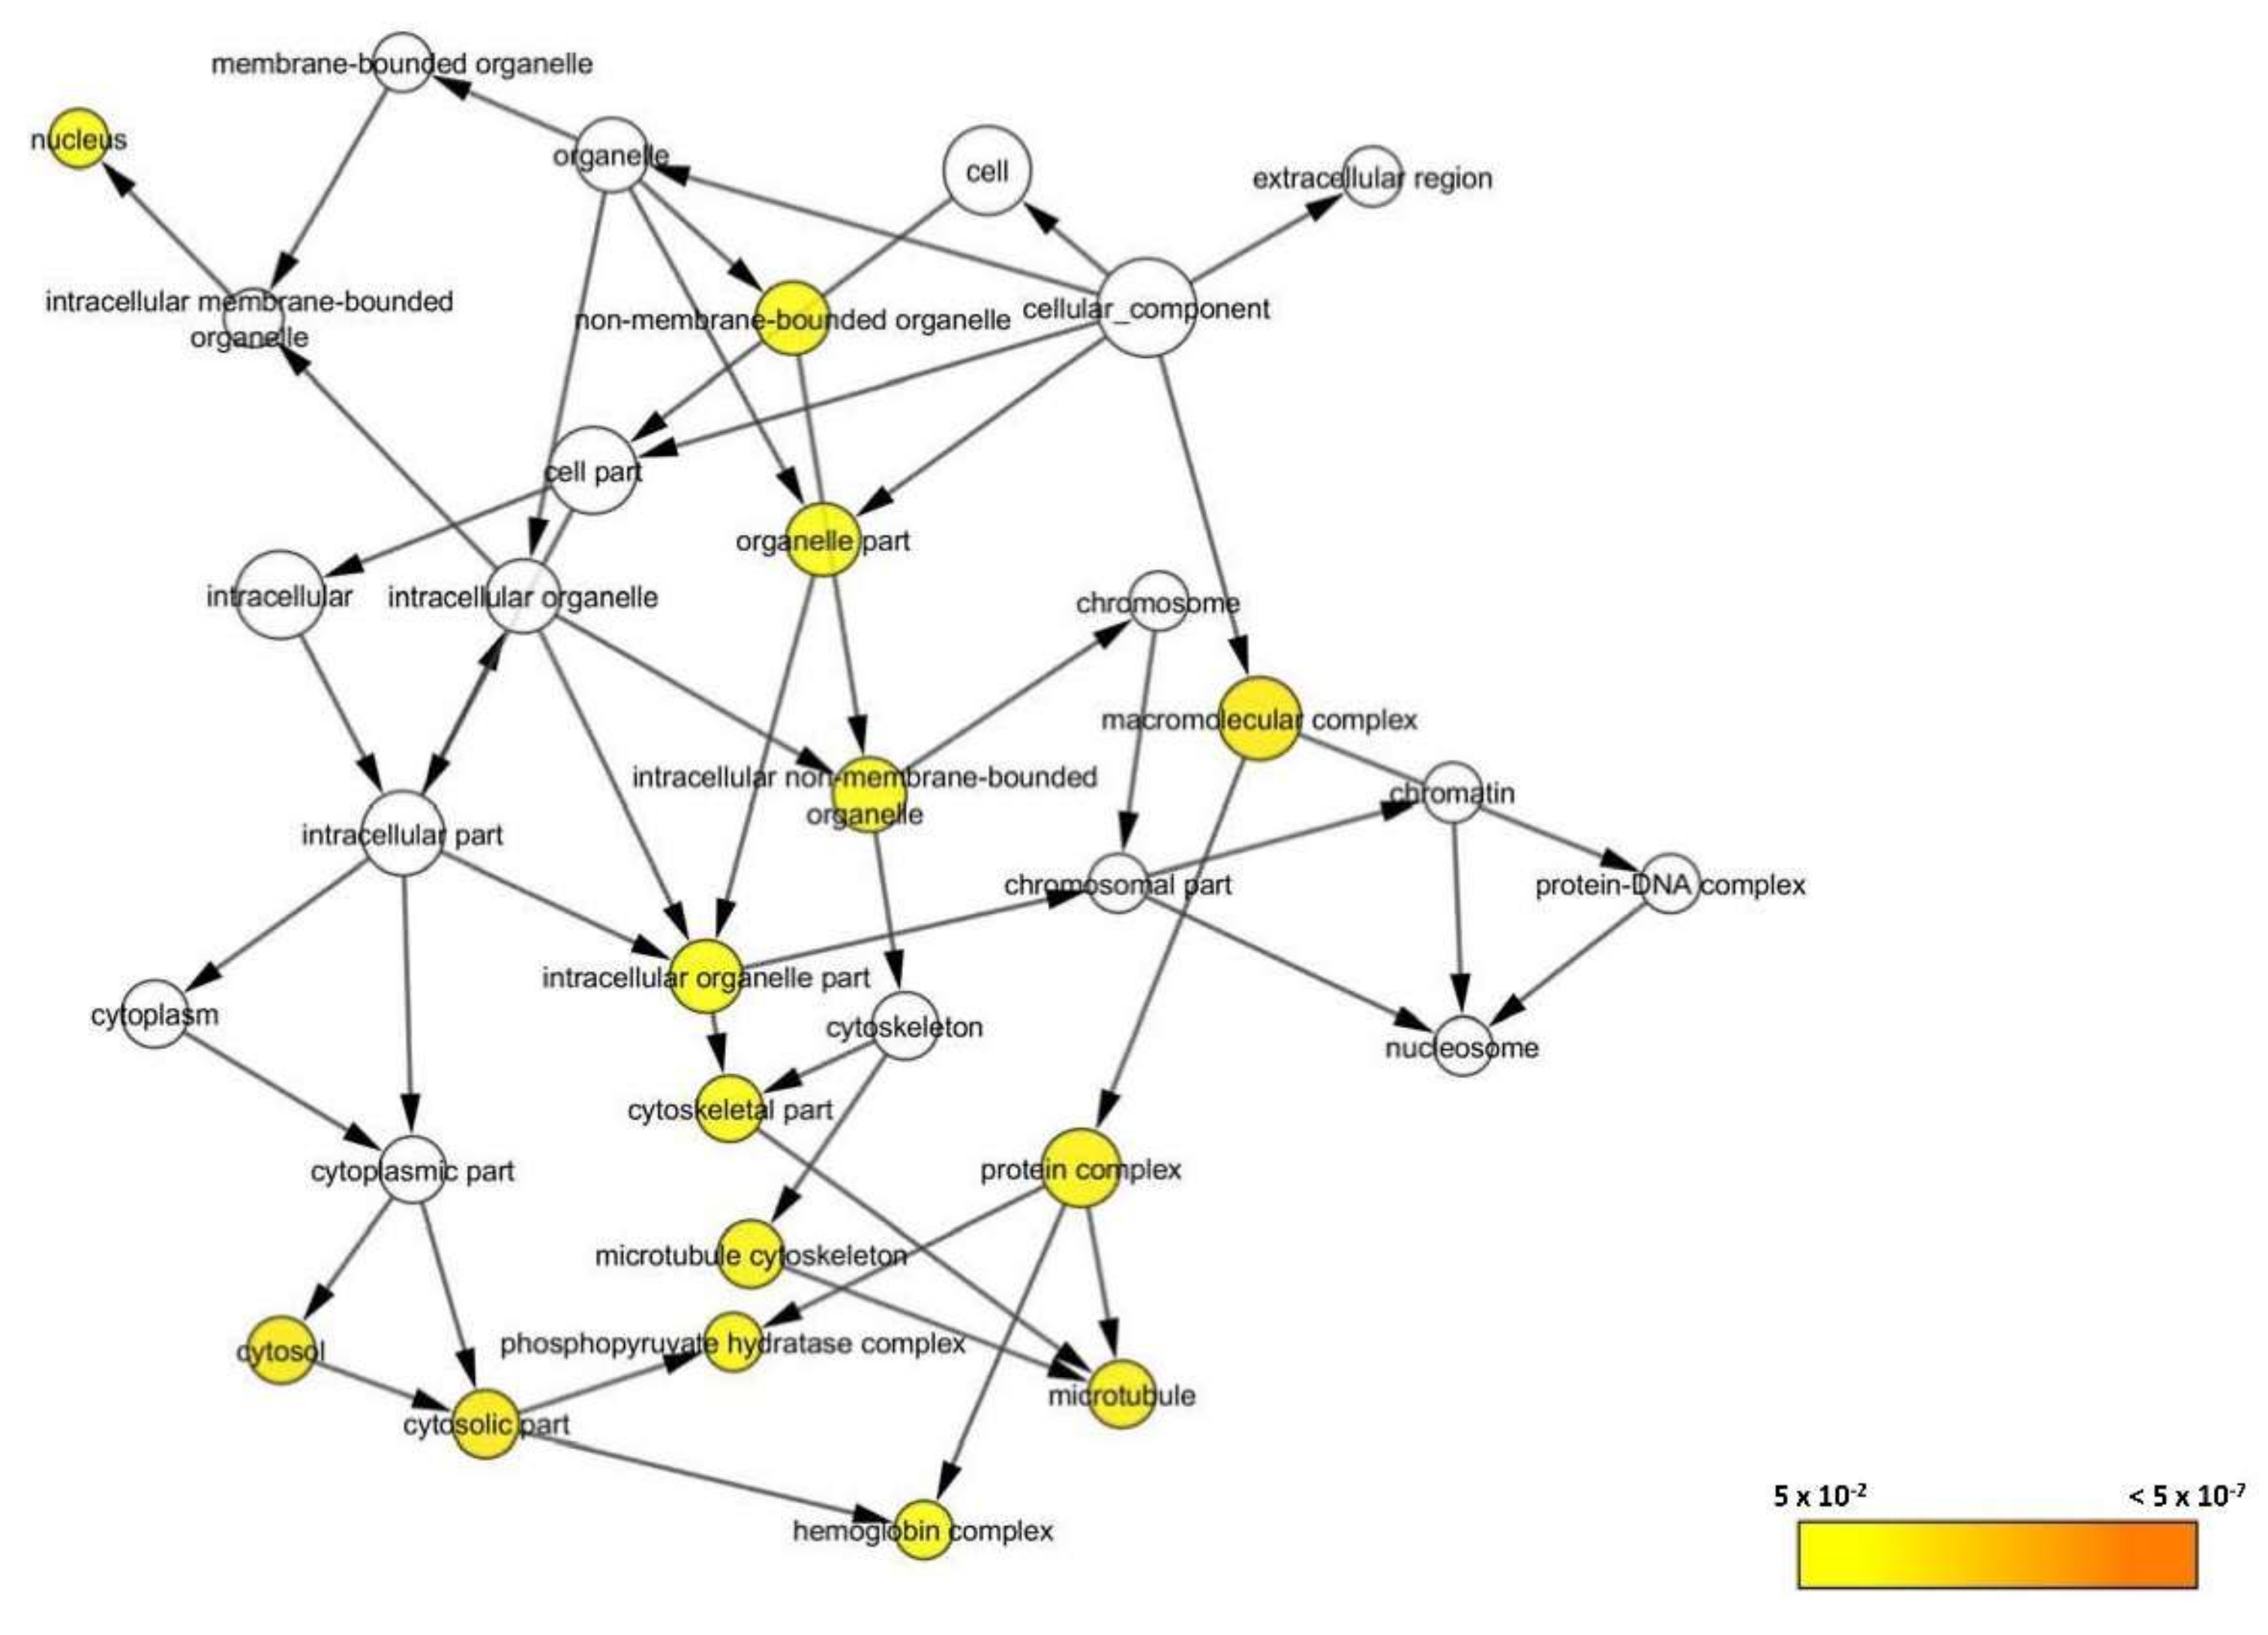
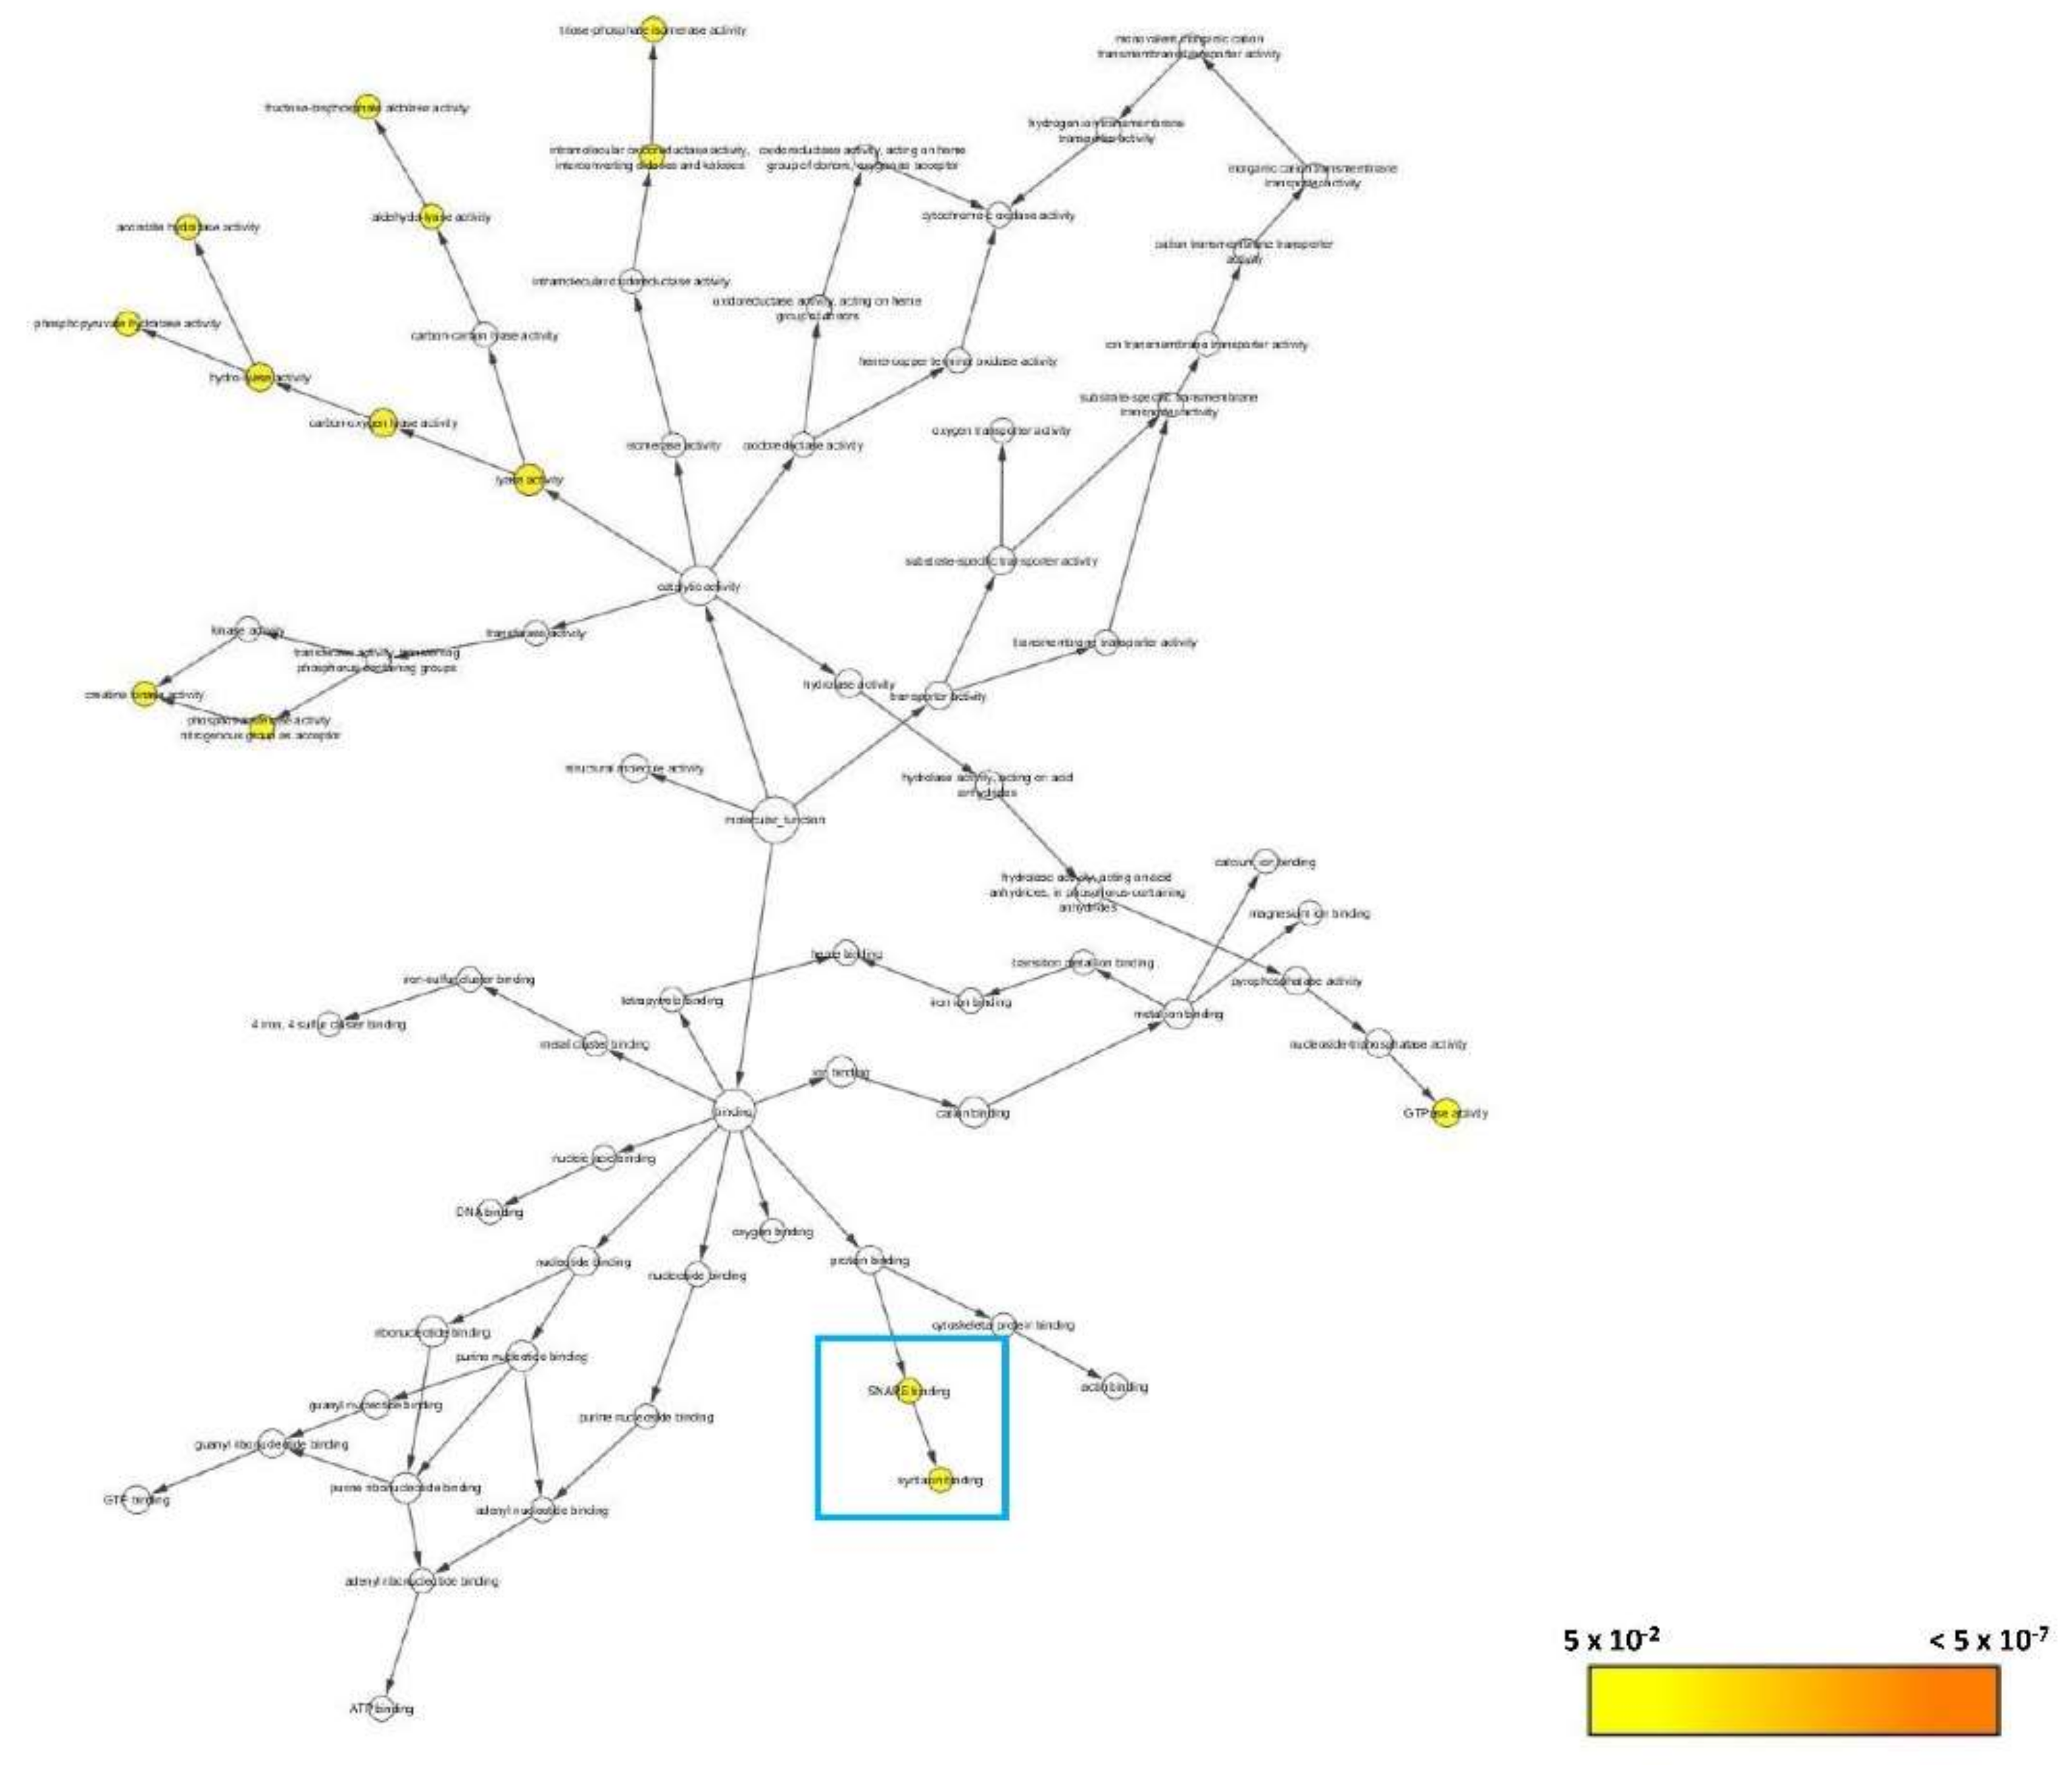
3.2.6. Bioinformatics Analysis
3.2.7. Systematic Pathway Enrichment Analysis
4. Discussion
5. Conclusions
Author Contributions
Funding
Acknowledgments
Conflicts of Interest
References
- World Health Organisation. Epilepsy: A Public Health Imperative: Summary; World Health Organization: Geneva, Switzerland, 2019. [Google Scholar]
- Jacob, S.; Nair, A.B. An updated overview on therapeutic drug monitoring of recent antiepileptic drugs. Drugs R D 2016, 16, 303–316. [Google Scholar] [CrossRef] [PubMed]
- Luft, J.G.; Steffens, L.; Morás, A.M.; Da Rosa, M.S.; Leipnitz, G.; Regner, G.G.; Pflüger, P.F.; Gonçalves, D.; Moura, D.J.; Pereira, P. Rosmarinic acid improves oxidative stress parameters and mitochondrial respiratory chain activity following 4-aminopyridine and picrotoxin-induced seizure in mice. Naunyn-Schmiedeberg’s Arch. Pharmacol. 2019, 392, 1347–1358. [Google Scholar] [CrossRef]
- Chen, Z.; Brodie, M.J.; Liew, D.; Kwan, P. Treatment outcomes in patients with newly diagnosed epilepsy treated with established and new antiepileptic drugs: A 30-year longitudinal cohort study. JAMA Neurol. 2018, 75, 279–286. [Google Scholar] [CrossRef]
- Helmstaedter, C.; Witt, J.-A. Chapter 28—Clinical neuropsychology in epilepsy: Theoretical and practical issues. In Handbook of Clinical Neurology; Stefan, H., Theodore, W.H., Eds.; Elsevier: Amsterdam, The Netherlands, 2012; Volume 107, pp. 437–459. [Google Scholar]
- World Health Organisation. WHO Traditional Medicine Strategy 2014–2023; World Health Organisation: Geneva, Switzerland, 2013. [Google Scholar]
- Zhu, H.-L.; Wan, J.-B.; Wang, Y.-T.; Li, B.-C.; Xiang, C.; He, J.; Li, P. Medicinal compounds with antiepileptic/anticonvulsant activities. Epilepsia 2014, 55, 3–16. [Google Scholar] [CrossRef] [PubMed]
- Rabiei, Z. Anticonvulsant effects of medicinal plants with emphasis on mechanisms of action. Asian Pac. J. Trop. Biomed. 2017, 7, 166–172. [Google Scholar] [CrossRef]
- Choo, B.K.M.; Kundap, U.P.; Kumari, Y.; Hue, S.-M.; Othman, I.; Shaikh, M.F. Orthosiphon stamineus leaf extract affects TNF-α and seizures in a zebrafish model. Front. Pharmacol. 2018, 9, 139. [Google Scholar] [CrossRef]
- Coelho, V.R.; Vieira, C.G.; De Souza, L.P.; Moysés, F.; Basso, C.; Papke, D.K.M.; Pires, T.R.; Siqueira, I.R.; Picada, J.N.; Pereira, P. Antiepileptogenic, antioxidant and genotoxic evaluation of rosmarinic acid and its metabolite caffeic acid in mice. Life Sci. 2015, 122, 65–71. [Google Scholar] [CrossRef]
- Howe, K.; Clark, M.D.; Torroja, C.F.; Torrance, J.; Berthelot, C.; Muffato, M.; Collins, J.E.; Humphray, S.; McLaren, K.; Matthews, L.; et al. The zebrafish reference genome sequence and its relationship to the human genome. Nature 2013, 496, 498–503. [Google Scholar] [CrossRef]
- Norton, W.; Bally-Cuif, L. Adult zebrafish as a model organism for behavioural genetics. BMC Neurosci. 2010, 11, 90. [Google Scholar] [CrossRef]
- Stewart, A.M.; Braubach, O.; Spitsbergen, J.; Gerlai, R.; Kalueff, A.V. Zebrafish models for translational neuroscience research: From tank to bedside. Trends Neurosci. 2014, 37, 264–278. [Google Scholar] [CrossRef]
- OECD (Organisation for Economic Co-operation). Development Test No. 203: Fish, Acute Toxicity Test; OECD Publishing: Paris, France, 1992. [Google Scholar]
- Blaser, R.E.; Rosemberg, D.B. Measures of anxiety in zebrafish (danio rerio): Dissociation of black/white preference and novel tank test. PLoS ONE 2012, 7, e36931. [Google Scholar] [CrossRef]
- Kysil, E.V.; Meshalkina, D.A.; Frick, E.E.; Echevarria, D.J.; Rosemberg, D.B.; Maximino, C.; Lima, M.G.; Abreu, M.S.; Giacomini, A.C.; Barcellos, L.J. Comparative analyses of zebrafish anxiety-like behavior using conflict-based novelty tests. Zebrafish 2017, 14, 197–208. [Google Scholar] [CrossRef] [PubMed]
- Gebauer, D.L.; Pagnussat, N.; Piato, Â.L.; Schaefer, I.C.; Bonan, C.D.; Lara, D.R. Effects of anxiolytics in zebrafish: Similarities and differences between benzodiazepines, buspirone and ethanol. Pharmacol. Biochem. Behav. 2011, 99, 480–486. [Google Scholar] [CrossRef]
- OECD (Organisation for Economic Co-operation). Development Test No. 203: Fish, Acute Toxicity Test; OECD Publishing: Paris, France, 2018. [Google Scholar]
- Ismail, H.F.; Hashim, Z.; Soon, W.T.; Ab Rahman, N.S.; Zainudin, A.N.; Majid, F.A.A. Comparative study of herbal plants on the phenolic and flavonoid content, antioxidant activities and toxicity on cells and zebrafish embryo. J. Tradit. Complementary Med. 2017, 7, 452–465. [Google Scholar] [CrossRef]
- Kundap, U.P.; Kumari, Y.; Othman, I.; Shaikh, M.F. Zebrafish as a model for epilepsy-induced cognitive dysfunction: A pharmacological, biochemical and behavioral approach. Front. Pharmacol. 2017, 8, 515. [Google Scholar] [CrossRef] [PubMed]
- Mormann, F.; Jefferys, J.G. Neuronal firing in human epileptic cortex: The ins and outs of synchrony during seizures: Dissociation of synchronization of neurons and field potentials. Epilepsy Curr. 2013, 13, 100–102. [Google Scholar] [CrossRef]
- Scharfman, H.E. The neurobiology of epilepsy. Curr. Neurol. Neurosci. Rep. 2007, 7, 348–354. [Google Scholar] [CrossRef]
- Griffin, C.E., 3rd; Kaye, A.M.; Bueno, F.R.; Kaye, A.D. Benzodiazepine pharmacology and central nervous system-mediated effects. Ochsner J. 2013, 13, 214–223. [Google Scholar] [PubMed]
- Dhaliwal, J.S.; Saadabadi, A. Diazepam [Updated 2019 January 30]. In StatPearls [Internet]; StatPearls Publishing: Treasure Island, CA, USA, 2019. [Google Scholar]
- Gupta, P.; Khobragade, S.B.; Shingatgeri, V.M.; Rajaram, S.M. Assessment of locomotion behavior in adult Zebrafish after acute exposure to different pharmacological reference compounds. Drug Dev. Ther. 2014, 5, 127–133. [Google Scholar] [CrossRef]
- Calcaterra, N.E.; Barrow, J.C. Classics in chemical neuroscience: Diazepam (valium). ACS Chem. Neurosci. 2014, 5, 253–260. [Google Scholar] [CrossRef]
- Kelly, T.H.; Delzer, T.A.; Martin, C.A.; Harrington, N.G.; Hays, L.R.; Bardo, M.T. Performance and subjective effects of diazepam and d-amphetamine in high and low sensation seekers. Behav. Pharmacol. 2009, 20, 505–517. [Google Scholar] [CrossRef] [PubMed]
- Velíšek, L. Models of Generalized Seizures in Freely Moving Animals. In Encyclopedia of Basic Epilepsy Research; Philip, A.S., Ed.; Academic Press: Cambridge, MA, USA, 2009; pp. 775–780. [Google Scholar] [CrossRef]
- Bernasconi, R.; Klein, M.; Martin, P.; Portet, C.; Maitre, L.; Jones, R.; Baltzer, V.; Schmutz, M. The specific protective effect of diazepam and valproate against isoniazid-induced seizures is not correlated with increased GABA levels. J. Neural Transm. 1985, 63, 169–189. [Google Scholar] [CrossRef] [PubMed]
- Perks, A.; Cheema, S.; Mohanraj, R. Anaesthesia and epilepsy. BJA Br. J. Anaesth. 2012, 108, 562–571. [Google Scholar] [CrossRef] [PubMed]
- Cao, L.; Bie, X.; Huo, S.; Du, J.; Liu, L.; Song, W. Effects of diazepam on glutamatergic synaptic transmission in the hippocampal CA1 area of rats with traumatic brain injury. Neural Regen. Res. 2014, 9, 1897–1901. [Google Scholar] [PubMed]
- Trimbuch, T.; Rosenmund, C. Should I stop or should I go? The role of complexin in neurotransmitter release. Nat. Rev. Neurosci. 2016, 17, 118–125. [Google Scholar] [CrossRef] [PubMed]
- Acuna, C.; Guo, Q.; Burré, J.; Sharma, M.; Sun, J.; Südhof, T.C. Microsecond Dissection of Neurotransmitter Release: SNARE-Complex Assembly Dictates Speed and Ca2+ Sensitivity. Neuron 2014, 82, 1088–1100. [Google Scholar] [CrossRef]
- Li, Y.C.; Kavalali, E.T. Synaptic vesicle-recycling machinery components as potential therapeutic targets. Pharm. Rev. 2017, 69, 141–160. [Google Scholar] [CrossRef]
- Snead, D.; Eliezer, D. Chapter Nine—Spectroscopic Characterization of Structure–Function Relationships in the Intrinsically Disordered Protein Complexin. In Methods in Enzymology; Rhoades, E., Ed.; Academic Press: Cambridge, MA, USA, 2018; Volume 611, pp. 227–286. [Google Scholar]
- Tang, J. Complexins. In Encyclopedia of Neuroscience; Squire, L.R., Ed.; Academic Press: Oxford, UK, 2009; pp. 1–7. [Google Scholar]
- Ungermann, C.; Langosch, D. Functions of SNAREs in intracellular membrane fusion and lipid bilayer mixing. J. Cell Sci. 2005, 118, 3819–3828. [Google Scholar] [CrossRef]
- Moriya, Y.; Itoh, M.; Okuda, S.; Yoshizawa, A.C.; Kanehisa, M. KAAS: An automatic genome annotation and pathway reconstruction server. Nucleic Acids Res. 2007, 35, W182–W185. [Google Scholar] [CrossRef]
- Roncon, P.; Soukupovà, M.; Binaschi, A.; Falcicchia, C.; Zucchini, S.; Ferracin, M.; Langley, S.R.; Petretto, E.; Johnson, M.R.; Marucci, G. MicroRNA profiles in hippocampal granule cells and plasma of rats with pilocarpine-induced epilepsy–comparison with human epileptic samples. Sci. Rep. 2015, 5, 141–143. [Google Scholar] [CrossRef]
- Chen, X.; Tomchick, D.R.; Kovrigin, E.; Araç, D.; Machius, M.; Südhof, T.C.; Rizo, J. Three-dimensional structure of the complexin/snare complex. Neuron 2002, 33, 397–409. [Google Scholar] [CrossRef]
- Scarmeas, N.; Honig, L.S.; Choi, H.; Cantero, J.; Brandt, J.; Blacker, D.; Albert, M.; Amatniek, J.C.; Marder, K.; Bell, K.; et al. Seizures in alzheimer disease: Who, when, and how common? Arch. Neurol. 2009, 66, 992–997. [Google Scholar] [CrossRef] [PubMed]
- Son, A.Y.; Biagioni, M.C.; Kaminski, D.; Gurevich, A.; Stone, B.; Di Rocco, A. Parkinson’s disease and cryptogenic epilepsy. Case Rep. Neurol Med. 2016, 2016, 3745631. [Google Scholar] [CrossRef] [PubMed]
- Sipilä, J.O.T.; Soilu-Hänninen, M.; Majamaa, K. Comorbid epilepsy in Finnish patients with adult-onset Huntington’s disease. BMC Neurol. 2016, 16, 24. [Google Scholar] [CrossRef]
- Mendez, M.F.; Grau, R.; Doss, R.C.; Taylor, J.L. Schizophrenia in epilepsy. Seizure Psychos. Var. 1993, 43, 1073. [Google Scholar]
- Cascella, N.G.; Schretlen, D.J.; Sawa, A. Schizophrenia and epilepsy: Is there a shared susceptibility? Neurosci. Res. 2009, 63, 227–235. [Google Scholar] [CrossRef]
- Knott, S.; Forty, L.; Craddock, N.; Thomas, R.H. Epilepsy and bipolar disorder. Epilepsy Behav. 2015, 52, 267–274. [Google Scholar] [CrossRef]
- Awad, R.; Arnason, J.T.; Trudeau, V.; Bergeron, C.; Budzinski, J.W.; Foster, B.C.; Merali, Z. Phytochemical and biological analysis of skullcap (scutellaria lateriflora l.): A medicinal plant with anxiolytic properties. Phytomedicine 2003, 10, 640–649. [Google Scholar] [CrossRef]
- Awad, R.; Levac, D.; Cybulska, P.; Merali, Z.; Trudeau, V.; Arnason, J. Effects of traditionally used anxiolytic botanicals on enzymes of the γ-aminobutyric acid (GABA). Can. J. Physiol. Pharmacol. 2007, 85, 933–942. [Google Scholar] [CrossRef]
- Hanrahan, J.R.; Chebib, M.; Johnston, G.A.R. Flavonoid modulation of GABA(A) receptors. Br. J. Pharmacol. 2011, 163, 234–245. [Google Scholar] [CrossRef]
- Wang, H.; Hui, K.-M.; Chen, Y.; Xu, S.; Wong, J.T.-F.; Xue, H. Structure-activity relationships of flavonoids, isolated from scutellaria baicalensis, binding to benzodiazepine site of GABAA receptor complex. Planta Med. 2002, 68, 1059–1062. [Google Scholar] [CrossRef] [PubMed]
- Zhang, Z.; Lian, X.-y.; Li, S.; Stringer, J.L. Characterization of chemical ingredients and anticonvulsant activity of american skullcap (scutellaria lateriflora). Phytomedicine 2009, 16, 485–493. [Google Scholar] [CrossRef] [PubMed]
- Jones, N.A.; Hill, A.J.; Smith, I.; Bevan, S.A.; Williams, C.M.; Whalley, B.J.; Stephens, G.J. Cannabidiol displays antiepileptiform and antiseizure properties in vitro and in vivo. J. Pharm. Exp. Ther. 2010, 332, 569–577. [Google Scholar] [CrossRef] [PubMed]
- Hill, A.; Mercier, M.; Hill, T.; Glyn, S.; Jones, N.; Yamasaki, Y.; Futamura, T.; Duncan, M.; Stott, C.; Stephens, G. Cannabidivarin is anticonvulsant in mouse and rat. Br. J. Pharm. 2012, 167, 1629–1642. [Google Scholar] [CrossRef] [PubMed]
- Hill, T.D.M.; Cascio, M.-G.; Romano, B.; Duncan, M.; Pertwee, R.G.; Williams, C.M.; Whalley, B.J.; Hill, A.J. Cannabidivarin-rich cannabis extracts are anticonvulsant in mouse and rat via a CB1 receptor-independent mechanism. Br. J. Pharm. 2013, 170, 679–692. [Google Scholar] [CrossRef] [PubMed]
- Karniol, I.G.; Shirakawa, I.; Takahashi, R.N.; Knobel, E.; Musty, R.E. Effects of Δ9-Tetrahydrocannabinol and Cannabinol in Man. Pharmacology 1975, 13, 502–512. [Google Scholar] [CrossRef] [PubMed]
- De Barros, G.S.; Silva, C.M.M.; De Abreu Matos, F.J. Anticonvulsant activity of essential oils and active principles from chemotypes of Lippia alba (Mill.) NE Brown. Biol. Pharm. Bull. 2000, 23, 1314–1317. [Google Scholar]
- Russo, E.B. Taming THC: Potential cannabis synergy and phytocannabinoid-terpenoid entourage effects. Br. J. Pharmacol. 2011, 163, 1344–1364. [Google Scholar] [CrossRef]
- Reddy, D.S.; Golub, V.M. The pharmacological basis of cannabis therapy for epilepsy. J. Pharmacol. Exp. Ther. 2016, 357, 45–55. [Google Scholar] [CrossRef]
- Perucca, E. Cannabinoids in the treatment of epilepsy: Hard evidence at last? J. Epilepsy Res. 2017, 7, 61–76. [Google Scholar] [CrossRef]
- Katona, I. Cannabis and endocannabinoid signaling in epilepsy. In Endocannabinoids; Springer: Berlin/Heidelberg, Germany, 2015; pp. 285–316. [Google Scholar]
- Grigoletto, J.; De Oliveira, C.V.; Grauncke, A.C.B.; De Souza, T.L.; Souto, N.S.; De Freitas, M.L.; Furian, A.F.; Santos, A.R.S.; Oliveira, M.S. Rosmarinic acid is anticonvulsant against seizures induced by pentylenetetrazol and pilocarpine in mice. Epilepsy Behav. 2016, 62, 27–34. [Google Scholar] [CrossRef] [PubMed]


| Group | Treatment |
|---|---|
| VC | Vehicle control (tank water, i.p.) |
| Treatment Group a | OSLP (50 µg/kg, i.p.) |
| Treatment Group b | OSLP (100 µg/kg, i.p.) |
| Treatment Group c | OSLP (200 µg/kg, i.p.) |
| Treatment Group d | OSLP (400 µg/kg, i.p.) |
| Treatment Group e | OSLP (800 µg/kg, i.p.) |
| Treatment Group f | OSLP (1600 µg/kg, i.p.) |
| Group | Treatment |
|---|---|
| VC | Vehicle control (tank water, i.p. + tank water) |
| NC | Negative control (tank water + PTZ 170 mg/kg, i.p.) |
| PC | Positive control (DZP 1.25 mg/kg + PTZ 170 mg/kg, i.p.) |
| TC | Treatment control (800 µg/kg + tank water, i.p.) |
| O+P | OSLP-treated PTZ (800 µg/kg + PTZ 170 mg/kg, i.p.) |
| Score | Criteria |
|---|---|
| 1 | short swim mainly at the bottom of tank |
| 2 | increased swimming activity and high frequency of opercular movements |
| 3 | burst swimming, left and right movements as well as the erratic movements |
| 4 | circular movements |
| Uniprot Accession ID | Uniprot Protein Name | Significance (≥13) | Coverage (%) | #Peptides | #Unique | Avg. Mass | Group Profile (Ratio of NC/O+P) | ZFIN Protein |
|---|---|---|---|---|---|---|---|---|
| Q90487 | Hemoglobin subunit alpha | 200 | 49 | 12 | 4 | 15,524 | 0.00:1.00 | Hbaa1 |
| Q803Z5 | Hemoglobin subunit alpha | 200 | 49 | 12 | 4 | 15,508 | 1.00:255.14 | Hbaa1 |
| Q90486 | Hemoglobin subunit beta-1 | 200 | 43 | 8 | 8 | 16,389 | 1.00:49.49 | Hbba1 |
| Q08BA1 | ATP synthase subunit alpha | 200 | 15 | 6 | 3 | 59,744 | 0.00:1.00 | Atp5fa1 |
| Q6PC12 | Enolase 1 | 200 | 12 | 4 | 3 | 47,074 | 0.00:1.00 | Eno1a |
| Q4VBK0 | ATP synthase subunit beta | 200 | 9 | 3 | 3 | 55,000 | 0.00:1.00 | Atp5f1b |
| Q6ZM12 | Hemoglobin beta adult 2 | 200 | 13 | 3 | 3 | 16,295 | 0.00:1.00 | Hbba2 |
| E7F2M5 | CD59 molecule (CD59 blood group) | 200 | 26 | 2 | 2 | 12,914 | 0.00:1.00 | Cd59 |
| E9QBF0 | Triosephosphate isomerase | 200 | 20 | 4 | 4 | 21,811 | 0.00:1.00 | Tpi1b |
| Q6PC53 | Peptidyl-prolyl cis-trans isomerase | 200 | 18 | 3 | 3 | 17,489 | 0.00:1.00 | Ppiab |
| F8W4M7 | Aconitate hydratase mitochondrial | 200 | 4 | 2 | 2 | 85,590 | 0.00:1.00 | Aco2 |
| Q8AY63 | Brain-subtype creatine kinase | 153.53 | 7 | 3 | 3 | 42,884 | 0.00:1.00 | Ckbb |
| Q4VBT9 | Cox4i1 protein | 126.93 | 18 | 2 | 2 | 19,443 | 0.00:1.00 | Cox4i1 |
| Q8JH70 | Fructose-bisphosphate aldolase C-B | 126.51 | 12 | 4 | 4 | 39,259 | 1.00:8.14 | Aldocb |
| Q6PE34 | Tubulin beta chain | 125.32 | 31 | 12 | 3 | 49,635 | 0.00:1.00 | Zgc:65894 |
| A0A0R4IKF0 | Apolipoprotein A-Ib | 112 | 9 | 2 | 2 | 30,140 | 0.00:1.00 | Apoa1b |
| F8W3W8 | Myelin basic protein a | 110.44 | 63 | 10 | 2 | 10,776 | 0.00:1.00 | Mbpa |
| A3KPR4 | Histone H4 | 104.16 | 24 | 2 | 2 | 11,367 | 0.00:1.00 | Hist1h4l |
| B3DFP9 | Apolipoprotein A-II | 103.56 | 21 | 2 | 2 | 15,537 | 0.00:1.00 | Apoa2 |
| Q5BJC7 | Haemoglobin alpha adult 2 | 79.54 | 17 | 3 | 2 | 15,403 | 0.00:1.00 | Hbaa2 |
| Q8AYC4 | Tubulin beta chain | 76.34 | 39 | 13 | 2 | 49,826 | 0.00:1.00 | Tubb5 |
| R4GE02 | Si:ch211–113a14.11 | 56.58 | 21 | 4 | 2 | 27,149 | 0.00:1.00 | Si:ch211–113a14.11 |
| Q7ZUY3 | Histone H2AX | 56.36 | 34 | 4 | 2 | 15,001 | 0.00:1.00 | H2ax |
| Q6TH32 | Cofilin 1 | 44.76 | 13 | 2 | 2 | 18,771 | 0.00:1.00 | Cfl1 |
| A0A2R8Q2Z0 | Ependymin | 44.72 | 12 | 2 | 2 | 23,370 | 0.00:1.00 | Epd |
| A8WG05 | Actin beta 2 | 43.68 | 15 | 6 | 6 | 41,753 | 1.00:9.75 | Actb2 |
| E7FBR8 | Complexin 2 | 43.27 | 24 | 2 | 2 | 15,094 | 1.00:5.64 | Cplx2 |
| A8DZ95 | Dihydropyrimidinase-like 2b | 43.27 | 6 | 2 | 2 | 58,285 | 0.00:1.00 | Dpysl2b |
| Q6GQM9 | Eno2 protein | 36.01 | 7 | 2 | 1 | 46,841 | 0.00:1.00 | Eno2 |
| Protein Family | ZFIN Protein | ZFIN Gene ID |
|---|---|---|
| Globin domain-containing protein | ||
| Belongs to the family of hemoglobin, alpha-type and to the subfamily of hemoglobin, pi | Hbaa1 | ZDB-GENE-980526-79 |
| Hbaa2 | ZDB-GENE-081104-38 | |
| Member of the hemoglobin, beta-type | Hbba1 | ZDB-GENE-990415-18 |
| Hbba2 | ZDB-GENE-040801-164 | |
| Plasma protein | ||
| Member of the CD marker | Cd59 | ZDB-GENE-030131-7871 |
| Member of the apolipoprotein A/E | Apoa2 | ZDB-GENE-030131-1046 |
| Belong to the myelin basic protein | Mbpa | ZDB-GENE-030128-2 |
| Member of the apolipoprotein A/E | Apoa1b | ZDB-GENE-050302-172 |
| Cytoskeletal protein | ||
| Member of the actin family | Actb2 | ZDB-GENE-000329-3 |
| Member of the beta tubulin | Tubb5 | ZDB-GENE-031110-4 |
| Zgc:65894 | ZDB-GENE-030131-7741 | |
| Enzyme protein | ||
| Transferase | ||
| Member of the ATP:guanido phosphotransferase protein | Ckbb | ZDB-GENE-020103-2 |
| Member of the ATP synthase, F1 complex, beta subunit | Atp5f1b | ZDB-GENE-030131-124 |
| Member of the mitochondrial F1-F0 ATP synthase subunit F | Atp5mf | ZDB-GENE-050309-87 |
| Member of the ATP synthase, F1 complex, alpha subunit | Atp5fa1 | ZDB-GENE-060201-1 |
| Isomerase | ||
| Member of the cyclophilin-type peptidyl-prolyl cis-trans isomerase | Ppiab | ZDB-GENE-030131-7459 |
| Member of the triosephosphate isomerase | Tpi1b | ZDB-GENE-020416-4 |
| Lyase | ||
| Member of the fructose-bisphosphate aldolase, class-I | Aldocb | ZDB-GENE-030821-1 |
| Member of the enolase | Eno1a | ZDB-GENE-030131-6048 |
| Citric acid cycle related protein | ||
| Belongs to the family of aconitase, mitochondrial-like | Aco2 | ZDB-GENE-030131-1390 |
| Member of the enolase | Eno2 | ZDB-GENE-040704-27 |
| Histone protein | ||
| Core Histone | ||
| Member of the histone H2A | H2ax | ZDB-GENE-040426-987 |
| Si:ch211-113a14.11 | ZDB-GENE-121214-162 | |
| Member of the histone H4 | Hist1h4l | ZDB-GENE-070927-10 |
| Intracellular protein-Ependymin | ||
| Member of the ependymin-related protein family (EPDRs) | Epd | ZDB-GENE-980526-111 |
| Cytosolic protein | ||
| Member of the complexin/synaphin family | Cplx2 | ZDB-GENE-081113-1 |
| ADF-H domain-containing protein | ||
| Belongs to the family of ADF/Cofilin | Cfl1 | ZDB-GENE-030131-215 |
| Transporter protein-Primary active transporter | ||
| Belongs to the cytochrome c oxidase subunit IV family and to the subfamily of cytochrome c oxidase subunit IV | Cox4i1 | ZDB-GENE-030131-5175 |
| Amidohydro-rel domain-containing protein | ||
| Belongs to the hydantoinase/dihydropyrimidinase family and to the subfamily of dihydropyrimidinase-related protein 2 | Dpysl2b | ZDB-GENE-031105-1 |
| KEGG Pathway ID | Pathway Category | Mapped Protein |
|---|---|---|
| Metabolism | ||
| 01100 | Metabolic pathways | Ckbb, Aldocb, Aco2, Eno1a, Eno2, Tpi1b, Atp5fa1, Atp5f1b, Cox4i1 |
| 01110 | Biosynthesis of secondary metabolites | Aldocb, Aco2, Eno1a, Eno2, Tpi1b |
| 01120 | Microbial metabolism in diverse environments | Aldocb, Aco2, Eno1a, Eno2, Tpi1b |
| 01200 | Carbon metabolism | Aldocb, Aco2, Eno1a, Eno2, Tpi1b |
| 01210 | 2-Oxocarboxylic acid metabolism | Aco2 |
| 01230 | Biosynthesis of amino acids | Aldocb, Aco2, Eno1a, Eno2, Tpi1b |
| Carbohydrate metabolism | ||
| 00010 | Glycolysis/Gluconeogenesis | Aldocb, Eno1a, Eno2, Tpi1b |
| 00020 | Citrate cycle (TCA cycle) | Aco2 |
| 00030 | Pentose phosphate pathway | Aldocb |
| 00051 | Fructose and mannose metabolism | Aldocb, Tpi1b |
| 00630 | Glyoxylate and dicarboxylate metabolism | Aco2 |
| 00562 | Inositol phosphate metabolism | Tpi1b |
| Energy metabolism | ||
| 00190 | Oxidative phosphorylation | Atp5fa1, Atp5f1b, Cox4i1 |
| 00710 | Carbon fixation in photosynthetic organisms | Aldocb, Tpi1b |
| 00720 | Carbon fixation pathways in prokaryotes | Aco2 |
| 00680 | Methane metabolism | Aldocb, Eno1a, Eno2, Ppiab |
| Amino acid metabolism | ||
| 00330 | Arginine and proline metabolism | Ckbb |
| Genetic Information Processing | ||
| Folding, sorting and degradation | ||
| 03018 | RNA degradation | Eno1a, Eno2 |
| Environmental Information Processing | ||
| Signal transduction | ||
| 04015 | Rap1 signaling pathway | Actb2 |
| 04390 | Hippo signaling pathway | Actb2 |
| 04391 | Hippo signaling pathway - fly | Actb2 |
| 04066 | HIF-1 signaling pathway | Aldocb, Eno1a, Eno2 |
| Cellular Processes | ||
| Transport and catabolism | ||
| 04145 | Phagosome | Actb2, Tubb5, Zgc:65894 |
| Cell growth and death | ||
| 04210 | Apoptosis | Actb2 |
| 04217 | Necroptosis | Ppiab, H2ax |
| Cellular community-eukaryotes | ||
| 04510 | Focal adhesion | Actb2 |
| 04520 | Adherens junction | Actb2 |
| 04530 | Tight junction | Actb2 |
| 04540 | Gap junction | Tubb5, Zgc:65894 |
| Cell motility | ||
| 04810 | Regulation of actin cytoskeleton | Actb2, Cfl1 |
| Organismal Systems | ||
| Immune system | ||
| 04640 | Hematopoietic cell lineage | Cd59 |
| 04610 | Complement and coagulation cascades | Cd59 |
| 04611 | Platelet activation | Actb2 |
| 04666 | Fc gamma R-mediated phagocytosis | Cfl1 |
| 04670 | Leukocyte transendothelial migration | Actb2 |
| Endocrine system | ||
| 04921 | Oxytocin signaling pathway | Actb2 |
| 04919 | Thyroid hormone signaling pathway | Actb2 |
| Circulatory system | ||
| 04260 | Cardiac muscle contraction | Cox4i1 |
| Digestive system | ||
| 04971 | Gastric acid secretion | Actb2 |
| Nervous system | ||
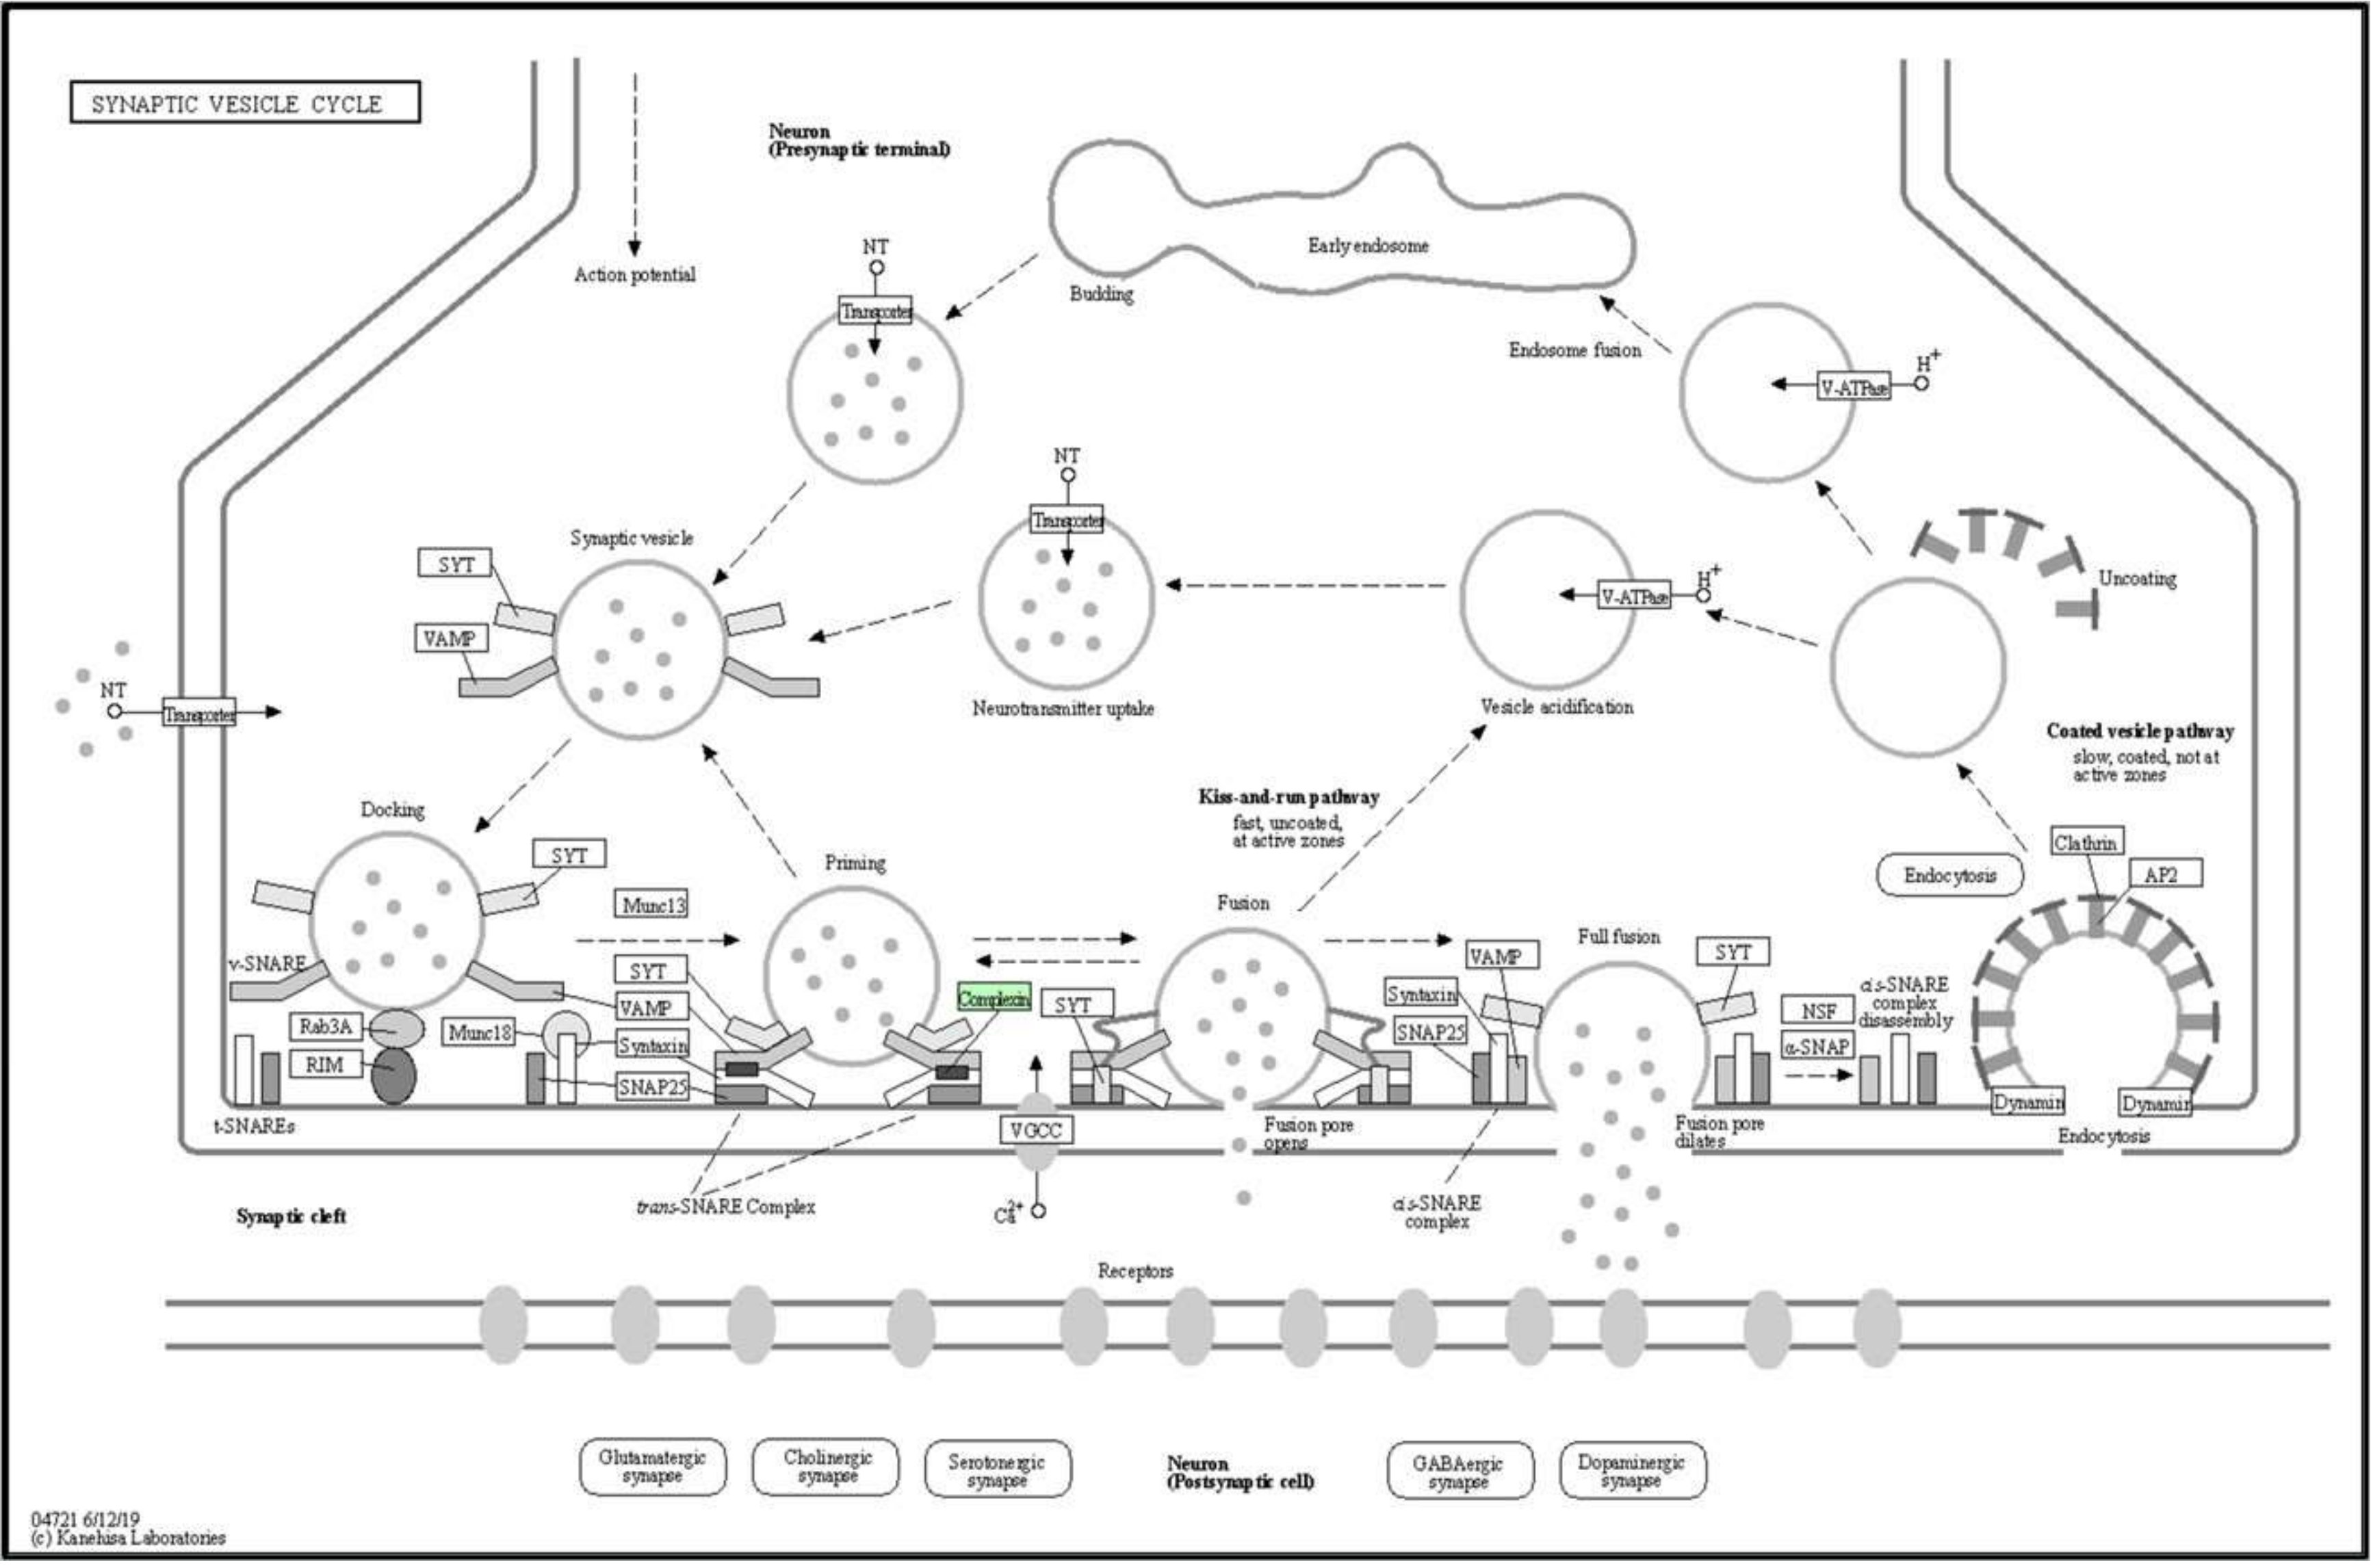
| 04721 | Synaptic vesicle cycle | Cplx2 |
| Sensory system | ||
| 04745 | Phototransduction - fly | Actb2 |
| Development and regeneration | ||
| 04360 | Axon guidance | Cfl1, Dpysl2b |
| Environmental adaptation | ||
| 04714 | Thermogenesis | Atp5fa1, Atp5f1b, Cox4i1, Actb2 |
| Human Diseases | ||
| Cancer: overview | ||
| 05205 | Proteoglycans in cancer | Actb2 |
| 05203 | Viral carcinogenesis | Si:ch211-113a14.11, Hist1h4l |
| Cancer: specific types | ||
| 05225 | Hepatocellular carcinoma | Actb2 |
| Immune disease | ||
| 05322 | Systemic lupus erythematosus | H2ax, Si:ch211-113a14.11, Hist1h4l |
| Neurodegenerative disease | ||
| 05010 | Alzheimer disease | Atp5fa1, Atp5f1b, Cox4i1, Tubb5 |
| 05012 | Parkinson disease | Atp5fa1, Atp5f1b, Cox4i1 |
| 05016 | Huntington disease | Atp5fa1, Atp5f1b, Cox4i1, Tubb5 |
| Substance dependence | ||
| 05034 | Alcoholism | H2ax, Si:ch211-113a14.11, Hist1h4l |
| Cardiovascular disease | ||
| 05418 | Fluid shear stress and atherosclerosis | Actb2 |
| 05410 | Hypertrophic cardiomyopathy (HCM) | Actb2 |
| 05412 | Arrhythmogenic right ventricular cardiomyopathy (ARVC) | Actb2 |
| 05414 | Dilated cardiomyopathy (DCM) | Actb2 |
| 05416 | Viral myocarditis | Actb2 |
| Endocrine and metabolic disease | ||
| 04932 | Non-alcoholic fatty liver disease (NAFLD) | Cox4i1 |
| Infectious disease: bacterial | ||
| 05110 | Vibrio cholerae infection | Actb2 |
| 05130 | Pathogenic Escherichia coli infection | Actb2, Tubb5, Zgc:65894 |
| 05132 | Salmonella infection | Actb2 |
| 05131 | Shigellosis | Actb2 |
| 05135 | Yersinia infection | Actb2 |
| 05133 | Pertussis | Cfl1 |
| 05100 | Bacterial invasion of epithelial cells | Actb2, Cfl1 |
| Infectious disease: viral | ||
| 05164 | Influenza A | Actb2 |
| Drug resistance: antimicrobial | ||
| 01503 | Cationic antimicrobial peptide (CAMP) resistance | Ppiab |
© 2020 by the authors. Licensee MDPI, Basel, Switzerland. This article is an open access article distributed under the terms and conditions of the Creative Commons Attribution (CC BY) license (http://creativecommons.org/licenses/by/4.0/).
Share and Cite
Chung, Y.-S.; Choo, B.K.M.; Ahmed, P.K.; Othman, I.; Shaikh, M.F. Orthosiphon stamineus Proteins Alleviate Pentylenetetrazol-Induced Seizures in Zebrafish. Biomedicines 2020, 8, 191. https://doi.org/10.3390/biomedicines8070191
Chung Y-S, Choo BKM, Ahmed PK, Othman I, Shaikh MF. Orthosiphon stamineus Proteins Alleviate Pentylenetetrazol-Induced Seizures in Zebrafish. Biomedicines. 2020; 8(7):191. https://doi.org/10.3390/biomedicines8070191
Chicago/Turabian StyleChung, Yin-Sir, Brandon Kar Meng Choo, Pervaiz Khalid Ahmed, Iekhsan Othman, and Mohd. Farooq Shaikh. 2020. "Orthosiphon stamineus Proteins Alleviate Pentylenetetrazol-Induced Seizures in Zebrafish" Biomedicines 8, no. 7: 191. https://doi.org/10.3390/biomedicines8070191
APA StyleChung, Y.-S., Choo, B. K. M., Ahmed, P. K., Othman, I., & Shaikh, M. F. (2020). Orthosiphon stamineus Proteins Alleviate Pentylenetetrazol-Induced Seizures in Zebrafish. Biomedicines, 8(7), 191. https://doi.org/10.3390/biomedicines8070191