1. Introduction
Replacement therapy using plasma-derived Factor IX (FIX) products is a life-saving treatment for patients with hemophilia B. Both recombinant and plasma-derived FIX show high efficacy in clinical trials [
1]. Production of FIX normally involves multiple steps. High purity FIX is obtained from prothrombin complex concentrate (PCC), which is a mixture of vitamin K-dependent clotting factors, e.g., factor II (prothrombin), V, VII, IX, and X, and clotting inhibitors, e.g., protein C, Z, and S [
2]. PCC preparation is a highly complex mixture of proteins and may contain up to 50% of proteins other than FIX [
3]. Both highly purified FIX and PCC can be used for hemophilia B treatment [
4]. Also, PCC preparation may be useful for prevention of bleeding due to overdose of oral anticoagulants and liver dysfunctions [
2,
3].
As it is with all plasma-derived products, the viral safety of FIX-rich PCC is a critical issue [
5]. According to current regulations, at least two orthogonal virus clearance steps must be implemented to ensure viral safety of the final product [
6]. The steps to mitigate virus contamination of FIX and PCC products include donor screening for known blood-borne viruses, i.e., HIV 1–2, HBV, HCV, HAV, and parvo B19; virus inactivation, such as solvent/detergent, mixed chemical inactivation (tri-n-butyl phosphate) and detergent (nonionic, polysorbate, and polyethylene oxide) treatment; and incubating intermediate product in controlled temperature (usually 6 h at 25 °C) [
3,
7,
8]. Dry heat treatment may also be used after lyophilization, e.g., 100 °C for 1 h or 80 °C for 72 h. In the past, steam treatment at 60 °C (190 mbar) for 10 h or 80 °C (375 mbar) for 1 h was reported [
3,
7,
8]. Presently, virus removal nanofiltration has become widely used as a robust and reliable method for ensuring viral safety. Nanofiltration is attractive because it is capable of physically removing all types of viruses from protein solution as opposed to virus inactivation. Several authors have described the application of virus removal nanofiltration for FIX industrial products using Planova 15/20/35N [
9,
10,
11,
12,
13,
14,
15], Viresolve NFP [
11,
16,
17,
18,
19], and Ultipor DV50 filters [
2]. The conclusion of these studies is that filtration of plasma-derived FIX-rich products is challenging due to the presence of large molecular weight impurities and protein aggregates.
It is known that the levels of different impurities are highly dependent on the type of chromatographic separation that was used during plasma treatment [
3,
18,
20]. The most extensively described impurities in vitamin K-dependent clotting factors include inter-α-trypsin-inhibitor (ITI), complement 4b binding protein (C4BP), and vitronectin (VN). C4BP is a large glycoprotein of 570 kDa [
21] in the shape of an octopus that consists of seven α-chains connected to a single β-chain by disulfide bonds [
22,
23,
24]. The α-chains are responsible for binding C4b, while the β-chain has high-affinity for VN (protein S), forming large complexes [
22,
25]. The molecular conformation of C4BP is highly dependent on the surrounding medium composition [
11,
19]. In the charged state the α-chains repel each other, thereby occupying much larger volume than the same molecule in the uncharged state. In its open structure form, C4BP would have a diameter of approximately 66 nm since each α-chain arm is 33 nm long [
11,
22]. Varying salt concentrations have been shown to affect the compactness of C4BP molecule and thereby the flux properties of the virus removal filter [
19]. Another large Mw impurity present often in FIX products is ITI. ITI (225 kDa) is a large complex that consists of one light and several heavy chains (H1-H3) covalently linked by a chondroitin sulfate chain. The heavy chains of ITI proteins function as hyaluronic acid (HA) binding proteins, whereas the light chain, also called bikunin, functions as a serine protease inhibitor upon activation [
26]. The third extensively described impurity is VN [
27]. The monomeric form of VN has a cryptic hydrophobic pocket, which upon exposure and conformational changes exhibits heparin- and C5b-7 binding activity [
28]. Normally, only 2% of VN in plasma shows heparin-binding activity but its fraction increases manifold during coagulation [
29]. VN also presents a free thiol group capable of disulfide bonding [
30]. When unfolded VN is highly prone to polymerization and may form aggregates with Mw up to 1000 kDa [
28]. Studies on nanofiltration of FIX products where VN aggregates were detectable confirmed its role as a filter foulant [
27]. Extensive coverage of various impurities at different intermediate stages during FIX manufacturing is discussed elsewhere [
15,
18].
So far successful virus removal filtration of FIX products has been described in the literature only for a limited number of commercial filters. A novel type of virus removal filter paper was developed at Uppsala University, which is produced by adapting traditional paper making technology and consists of 100% cellulose nanofibers [
31,
32]. The pore size and flux properties of the filter paper can be controlled, which opens new opportunities to model fundamental aspects of bioprocessing [
32,
33,
34]. The filter paper was previously validated in numerous studies to remove several large and small-size model viruses, including retroviruses (xMuLV, 100 nm) [
35], parvoviruses (MVM, 20 nm) [
32,
36], and model phages (ΦX174, 28 nm) [
37,
38,
39]. Recently, it was shown that this nanocellulose-based virus removal filter paper is useful for bioprocessing human plasma-derived IgG [
40].
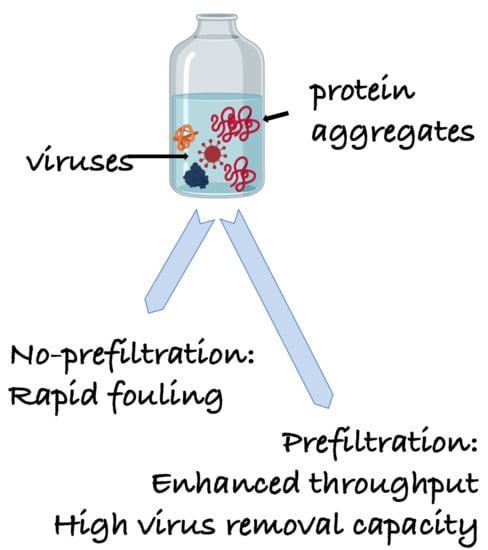
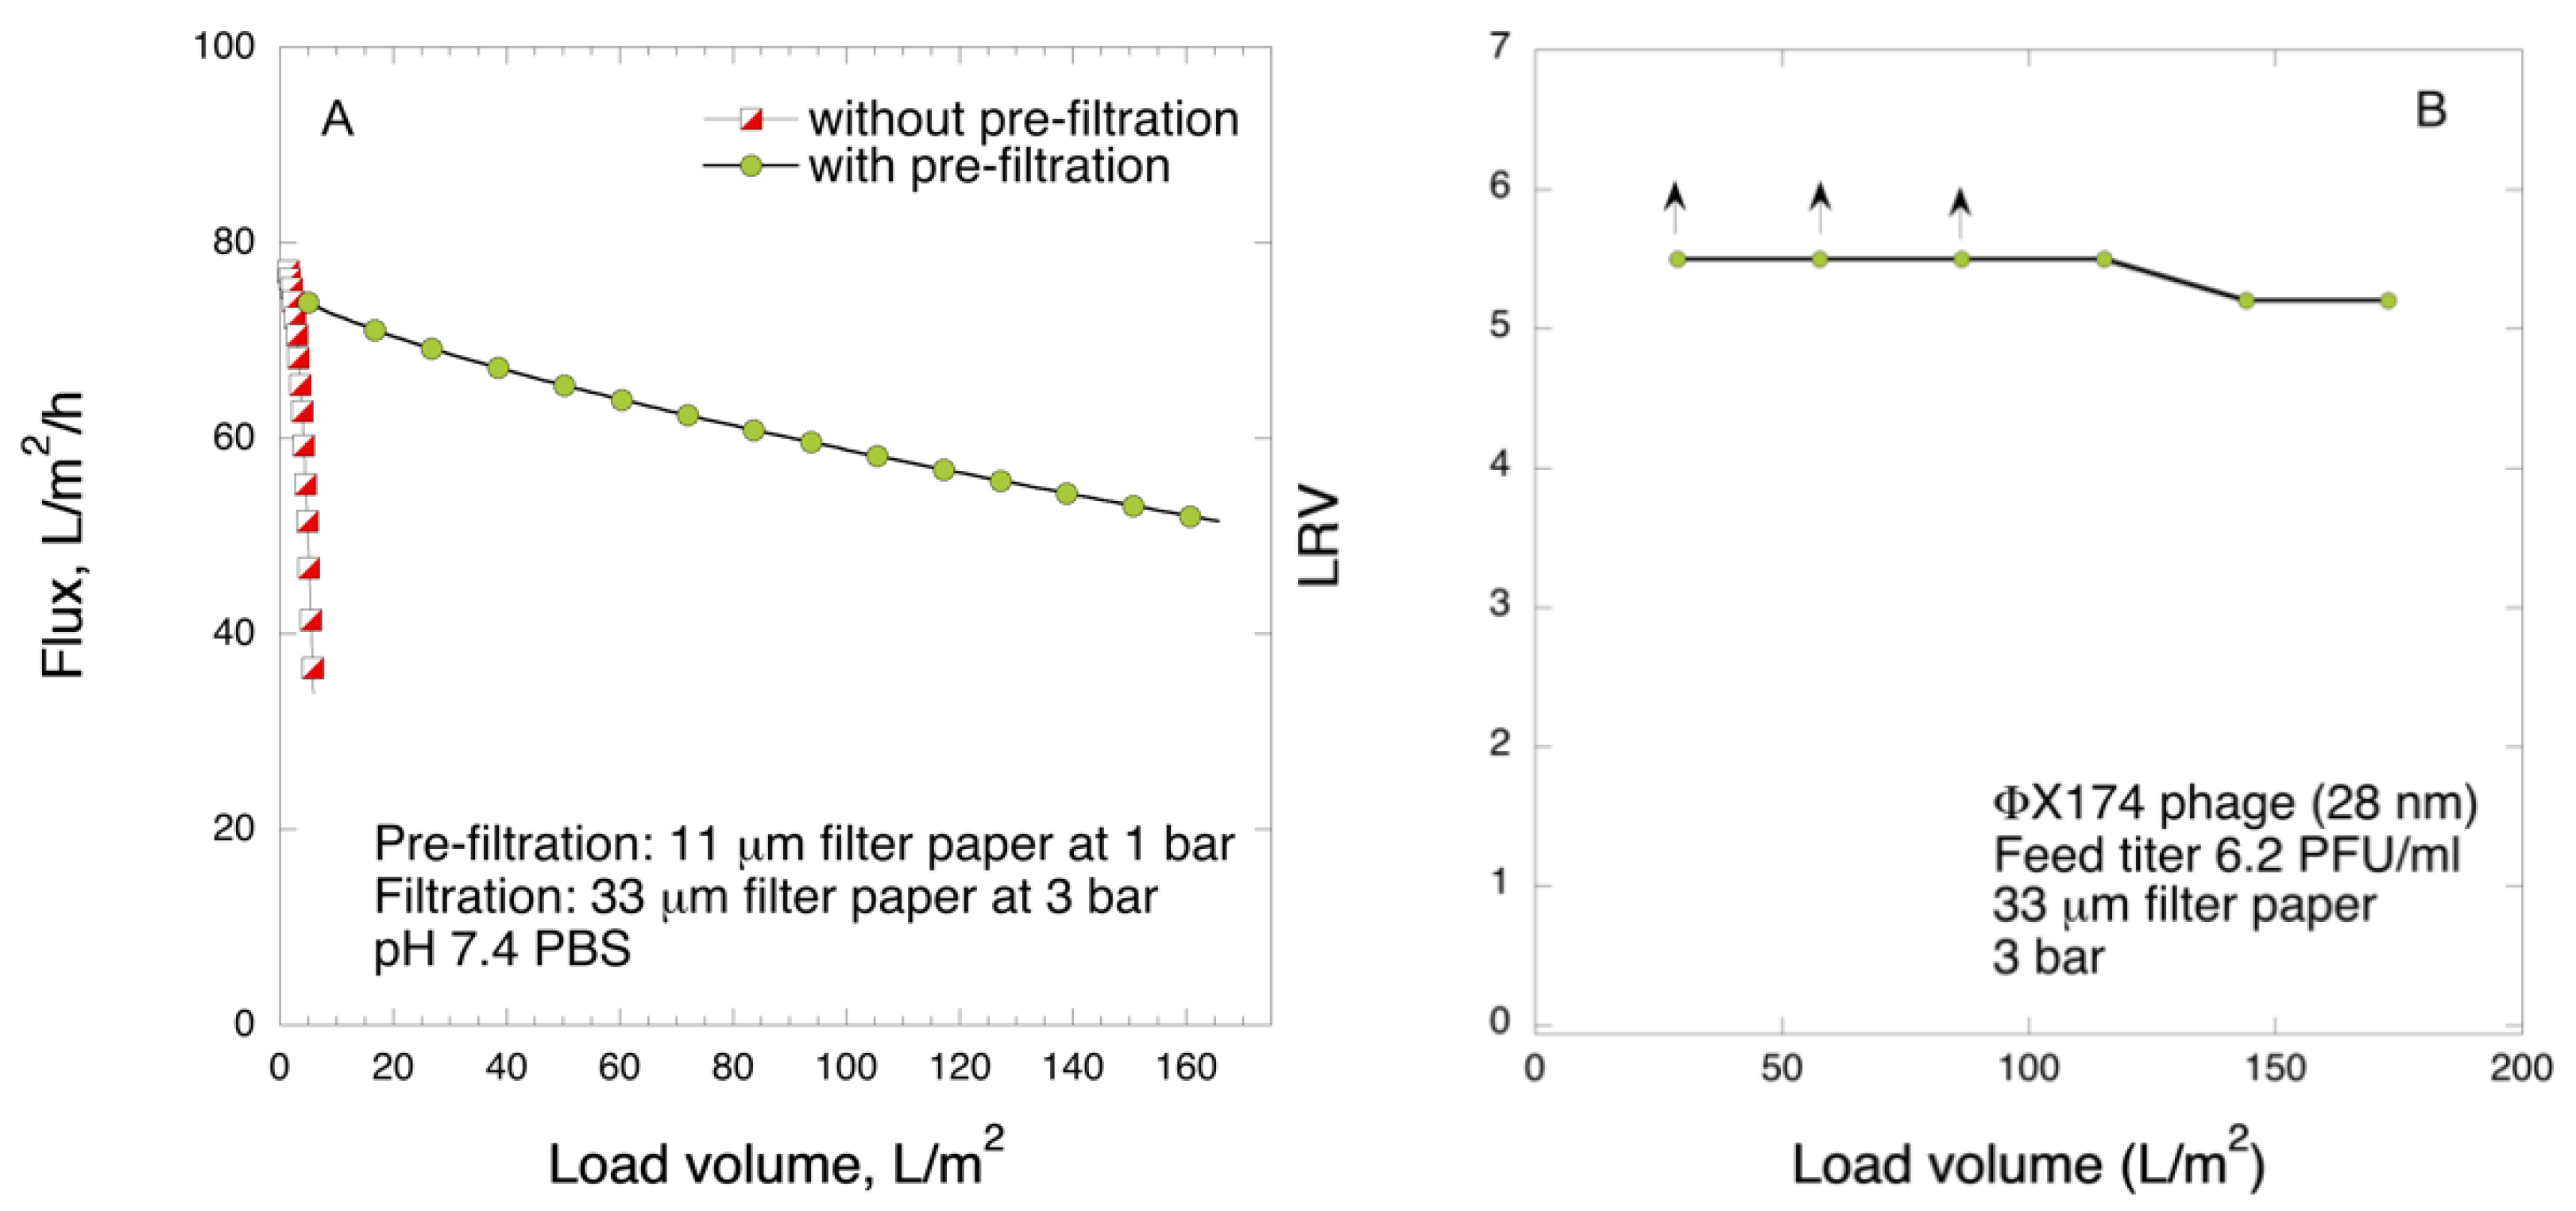
In this article, for the first time the filtration of FIX-rich PCC using a nanocellulose-based virus removal filter paper is described. Furthermore, a two-step size-exclusion nanofiltration process is developed to remove foulants and ensure efficient virus removal filtration of FIX-rich PCC using nanocellulose-based virus removal filter paper. FIX-rich PCC was used as a model for a highly complex plasma-derived product to simulate industrial bioprocesses where impurities may greatly affect product yield and biosafety.
2. Materials and Methods
2.1. Materials
Cladophora cellulose was provided by FMC Biopolymer (batch 3095-10; Newark, DE, USA). FIX-rich PCC was provided by National Center for Hematology, Moscow, Russia, as lyophilized powder. Coliphages ΦX174 (ATCC 13706-B1™) and PR772 (BAA-769-B1), and the host bacteria Escherichia coli (Migula) Castellani and Chalmers C (ATCC 13706) and K12 J53-1(R15) [HER 1221] (BAA-769) strains were obtained from ATCC (Manassas, VA, USA). Agar (214530) was obtained from BD (Franklin Lakes, NJ, USA). Tryptone (LP0042B) and yeast extract (Oxoid) (LP0021) were obtained from Thermo Fisher Scientific. Phosphate-buffered saline (P4417), 2-mercaptoethanol (M3148), sodium chloride (S5886), sodium phosphate dibasic (71640) and 2-mercaptoethanol (M3148) were purchased from Sigma-Aldrich (Saint Louis, MO, USA). Any kD™ Mini-PROTEAN® TGX Stain-Free™ protein gels (4568125), tris/glycine/SDS running buffer (1610732), 4x Laemmli Sample Buffer (1610747), and Precision Plus Protein™ unstained protein standards (1610363) were purchased from Bio-Rad (Hercules, CA, USA).
2.2. Filter Preparation
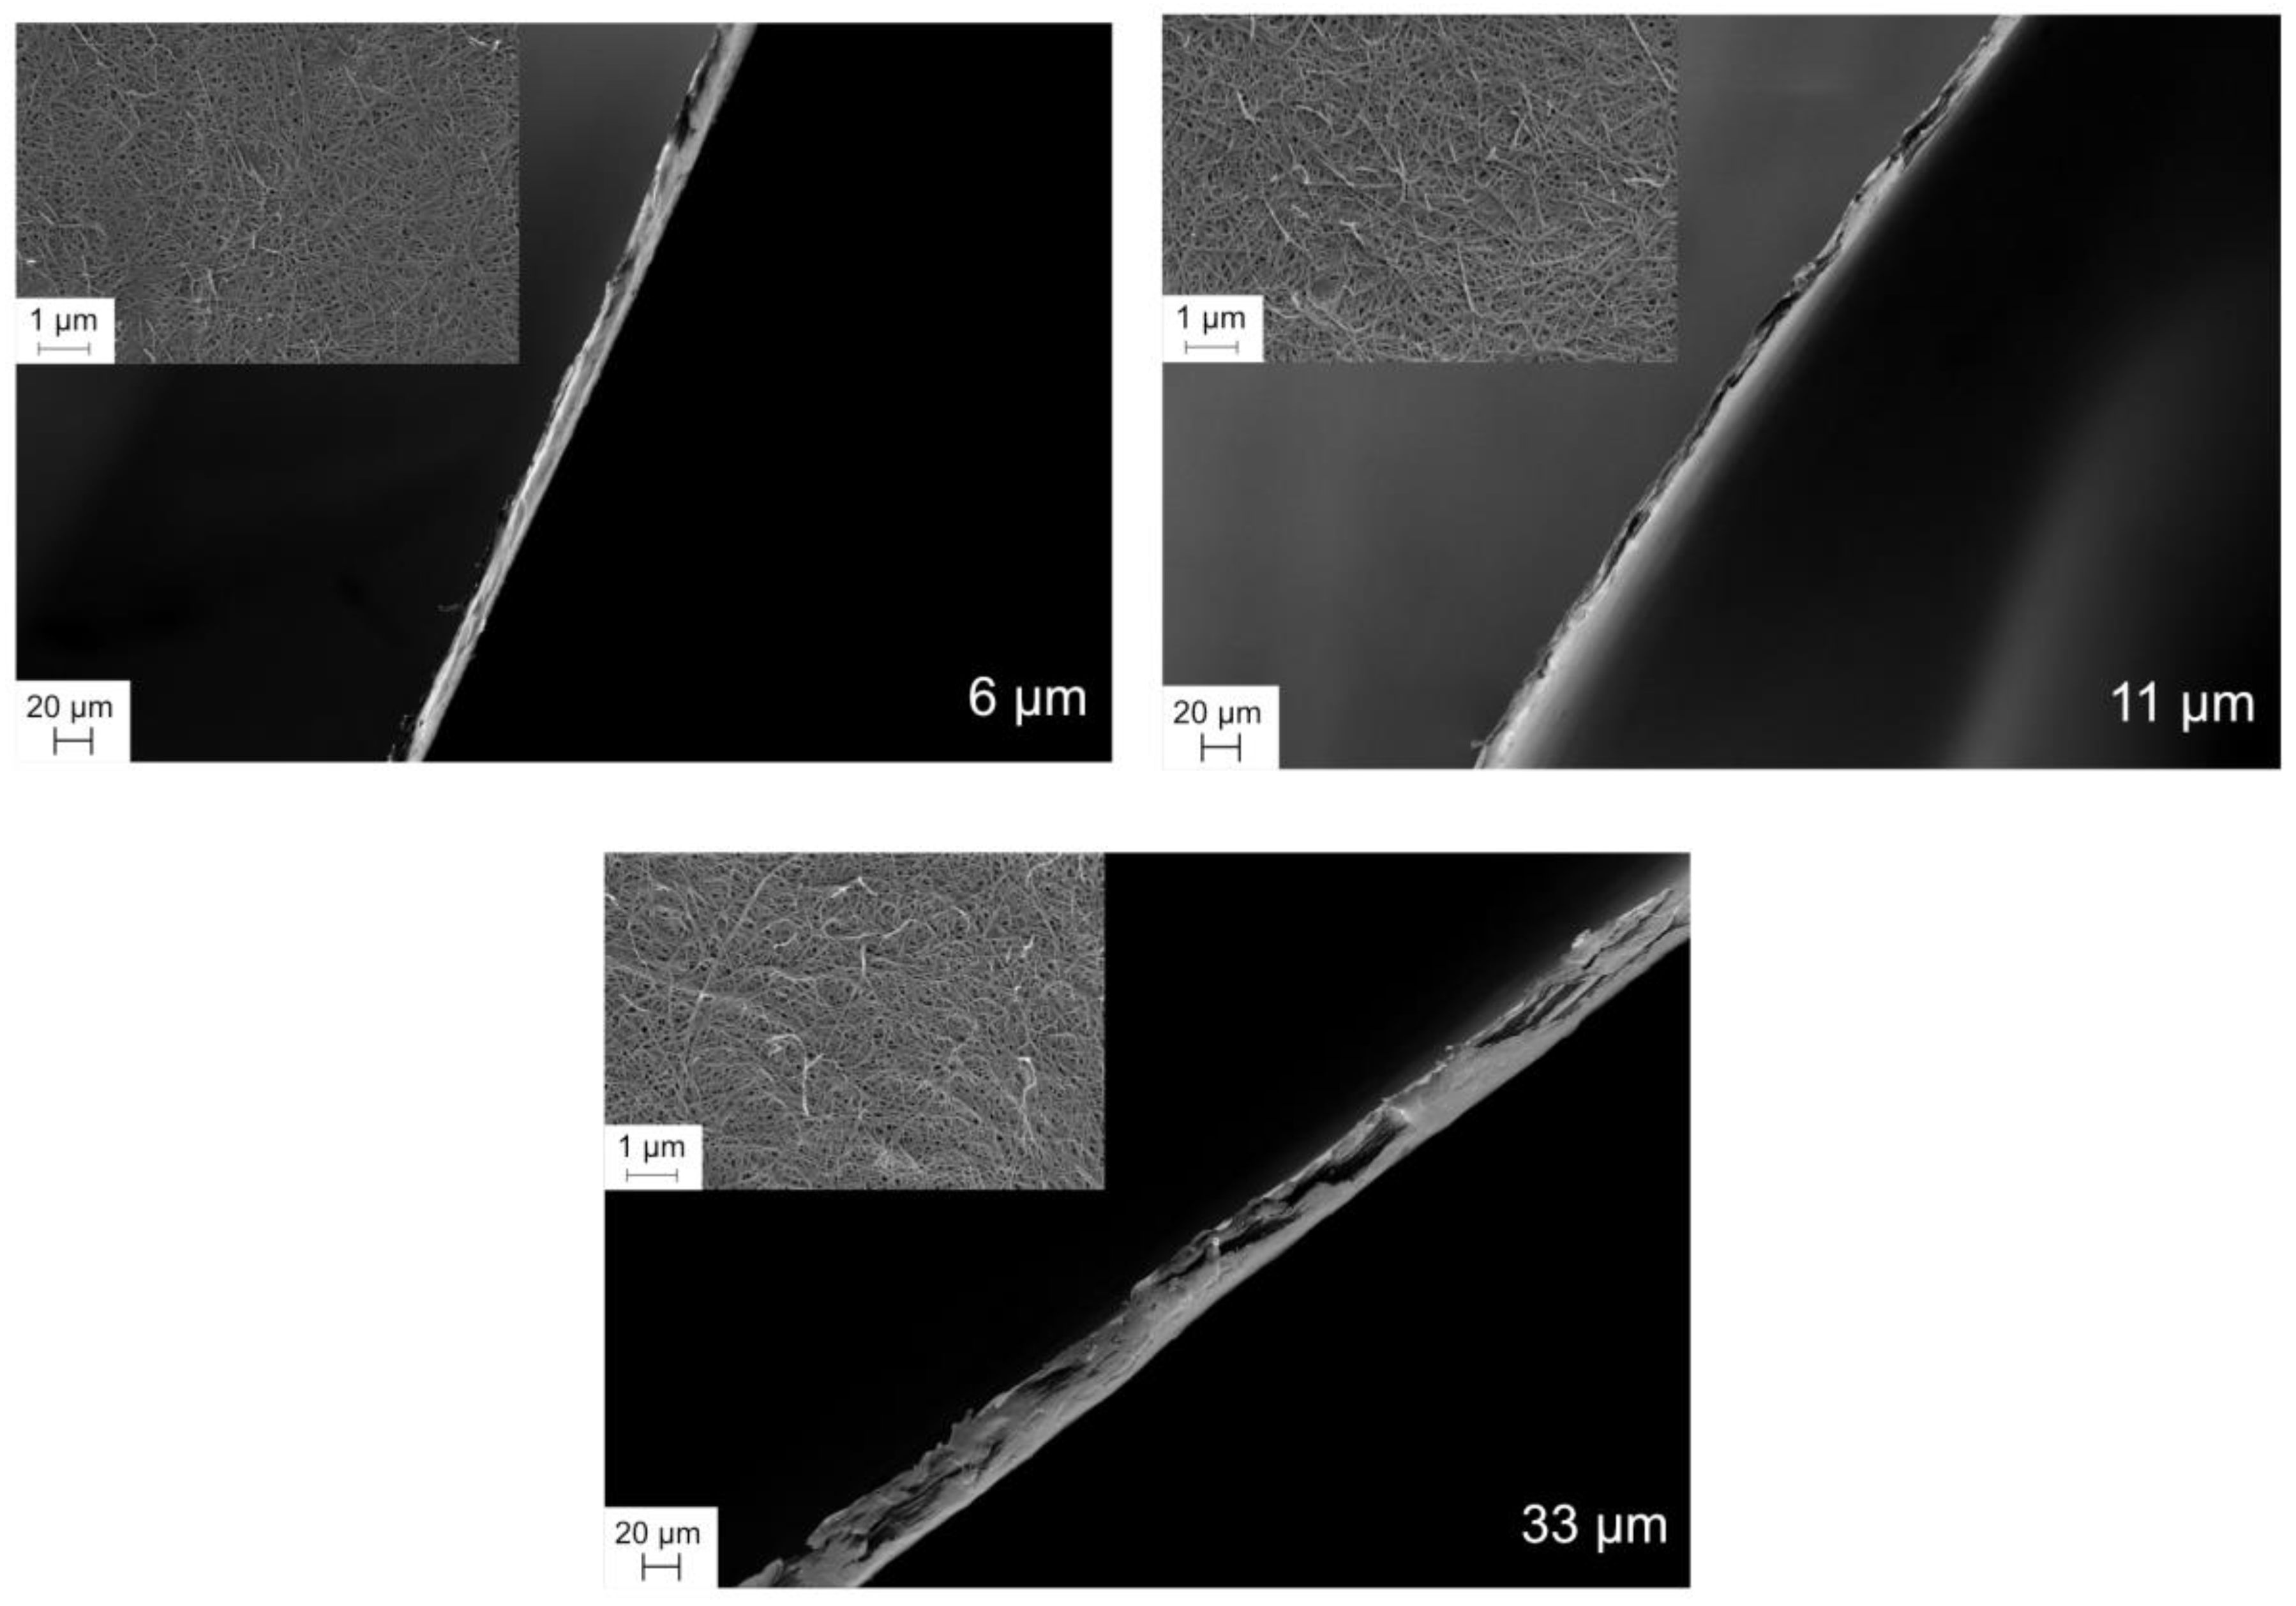
Filters of different thickness were prepared from Cladophora cellulose dispersion (0.1 wt.%) made by microfluidization with 200 μm (twice) and 100 μm hole sized chambers at 1800 bar using LM20 Microfluidizer (Microfluidics, Westwood, MA, USA). Furthermore, the wet cake was made by draining the dispersion over a membrane (Durapore, 0.65 µm hydrophilic PVDF “DVPP”, Merck Millipore, Burlington, MA, USA) in a funnel, driven by vacuum. Obtained cellulose cakes were dried at 140 °C to produce pre-filters and 80 °C for filter papers using hot-press (Carver Model 4122CE, Carver, Wabash, IN, USA).
2.3. Dissolution of Factor IX-rich PCC
Lyophilized FIX-rich PCC samples were reconstituted by dissolving in phosphate-buffered saline (PBS). No visible particles could be seen after reconstitution, and the solution was clear and transparent. Upon dissolution, the conductivity and pH values were 15.4 mS cm−1 and 7.4, respectively.
2.4. Filtration Setup
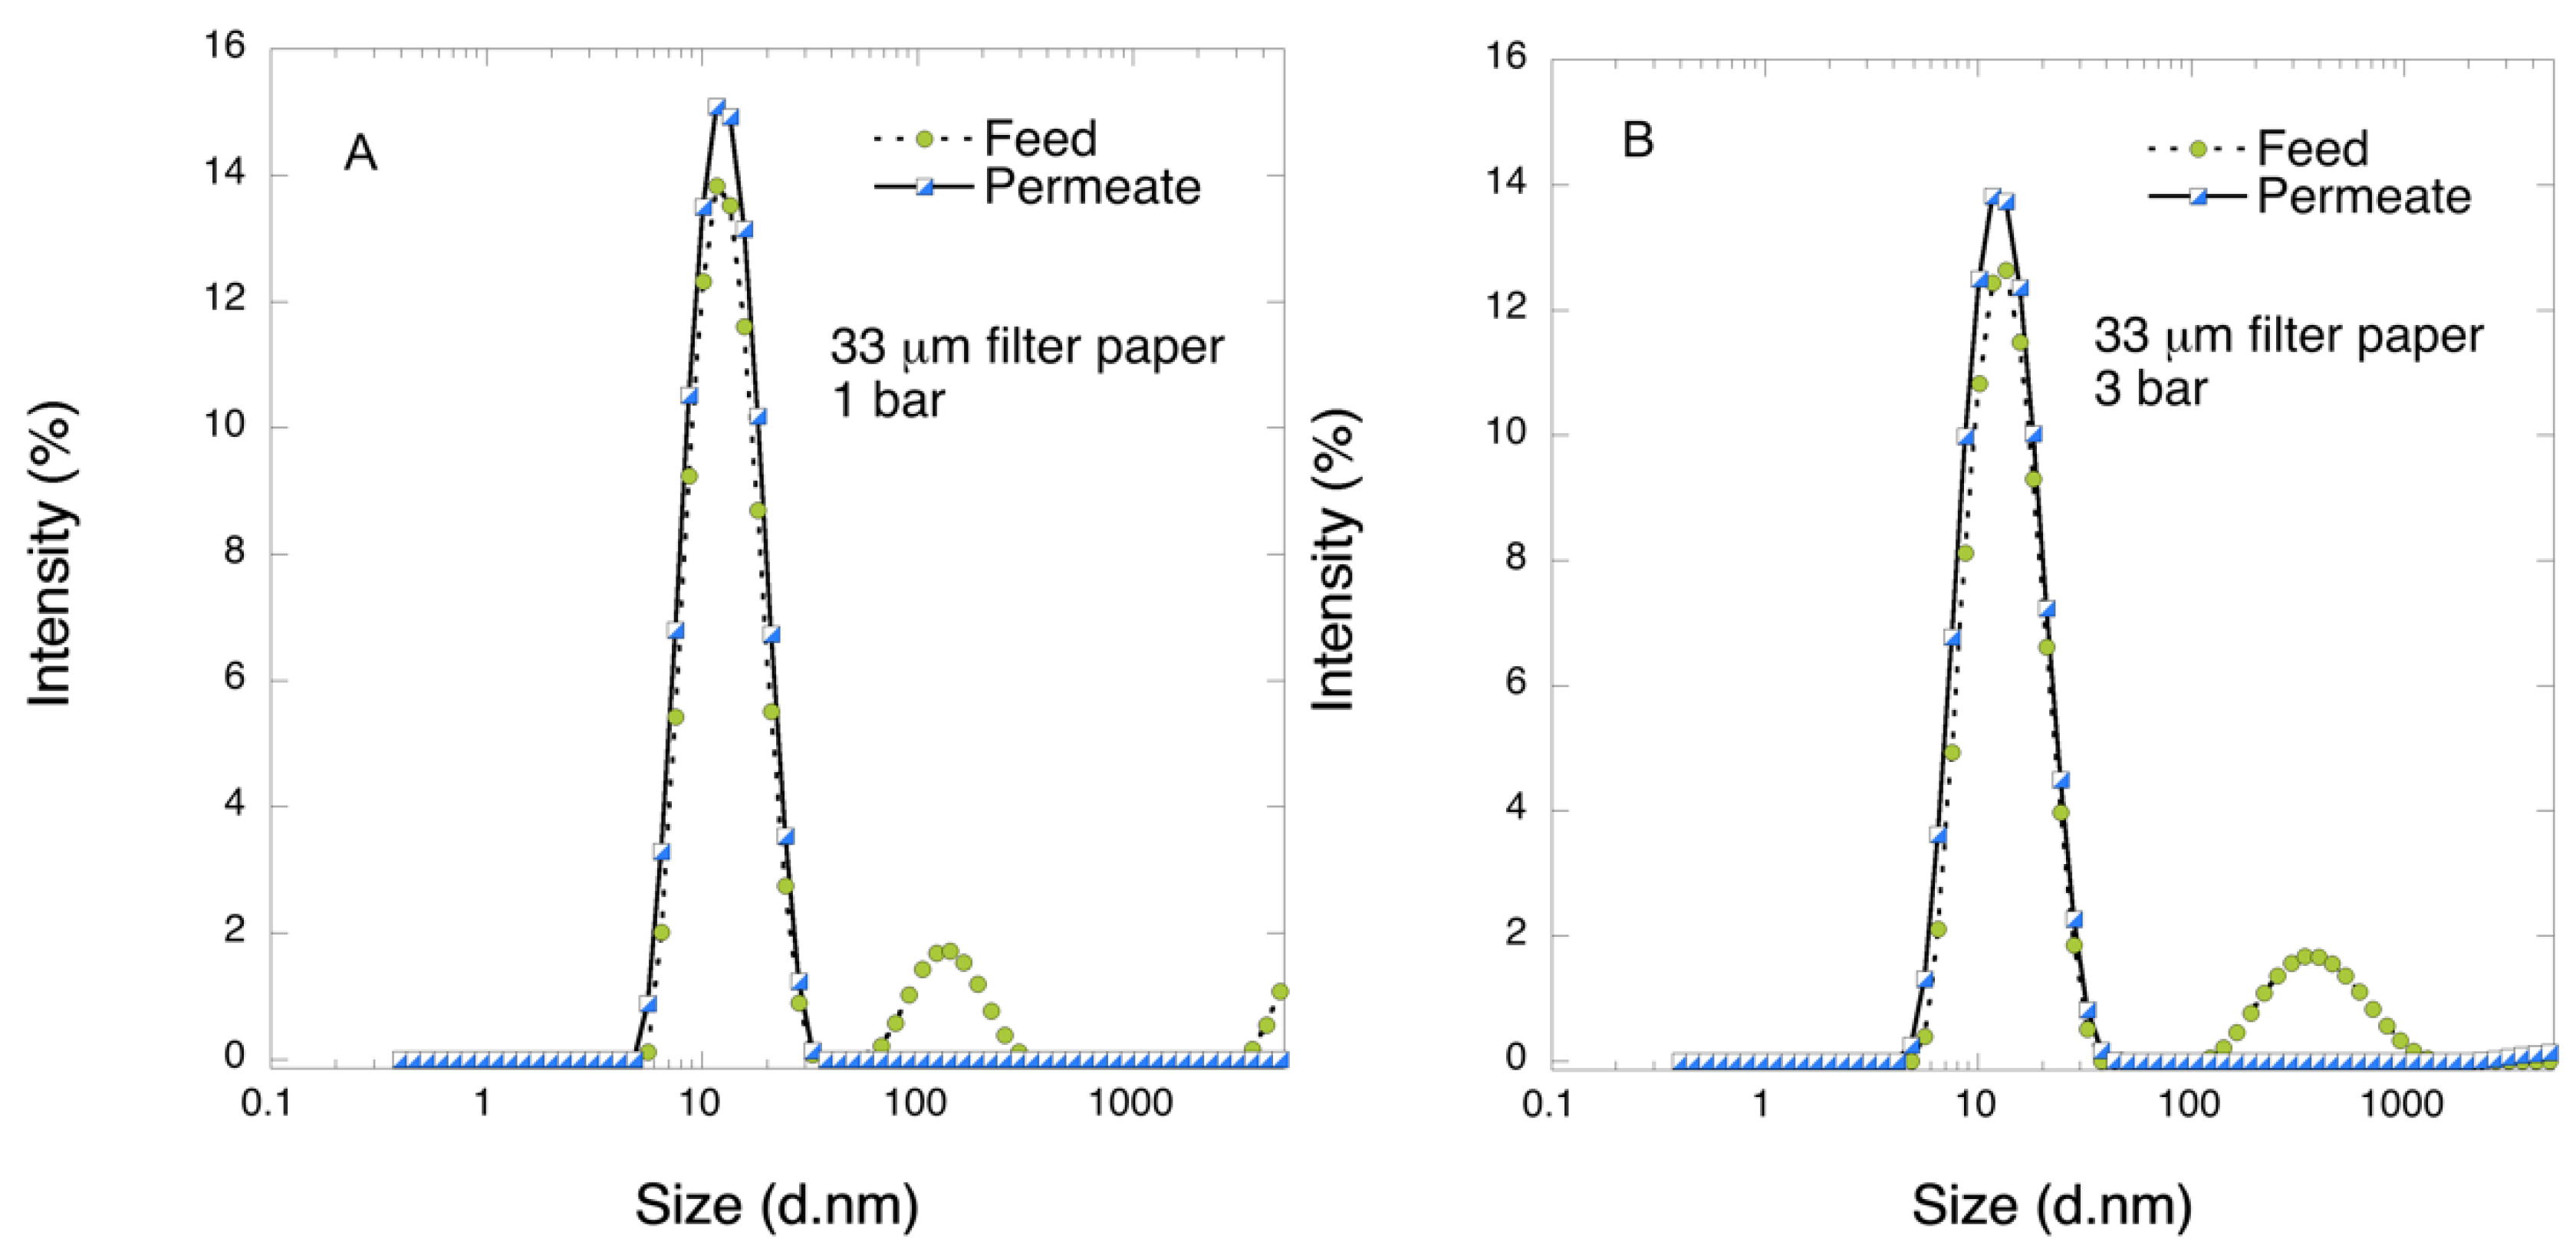
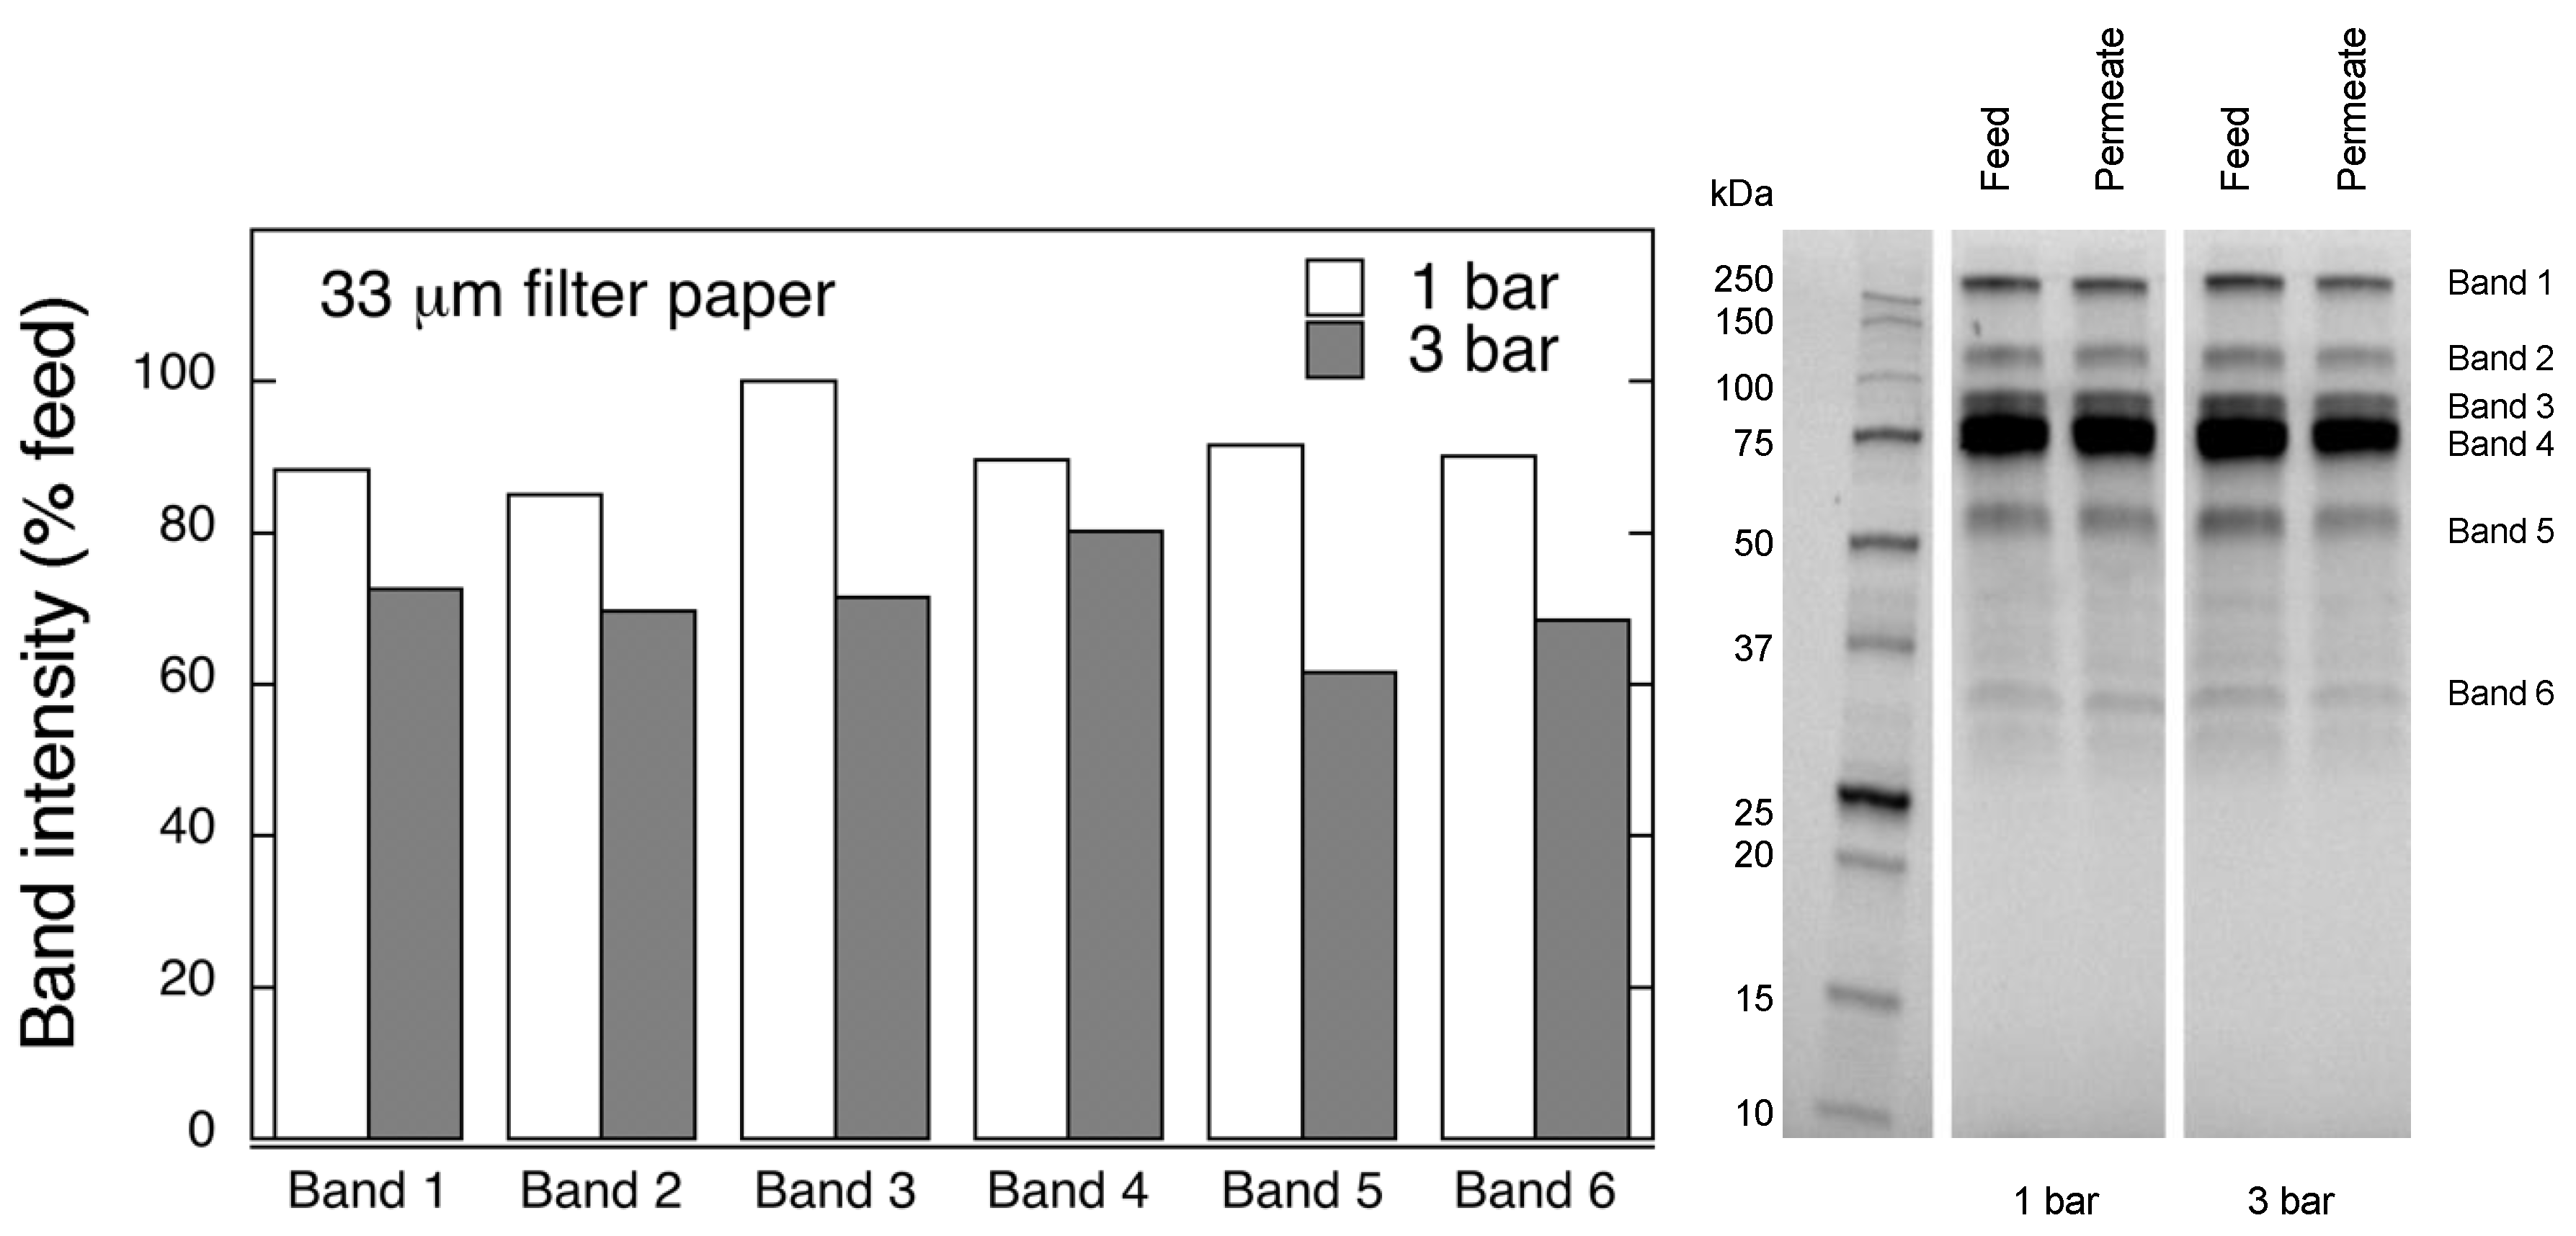
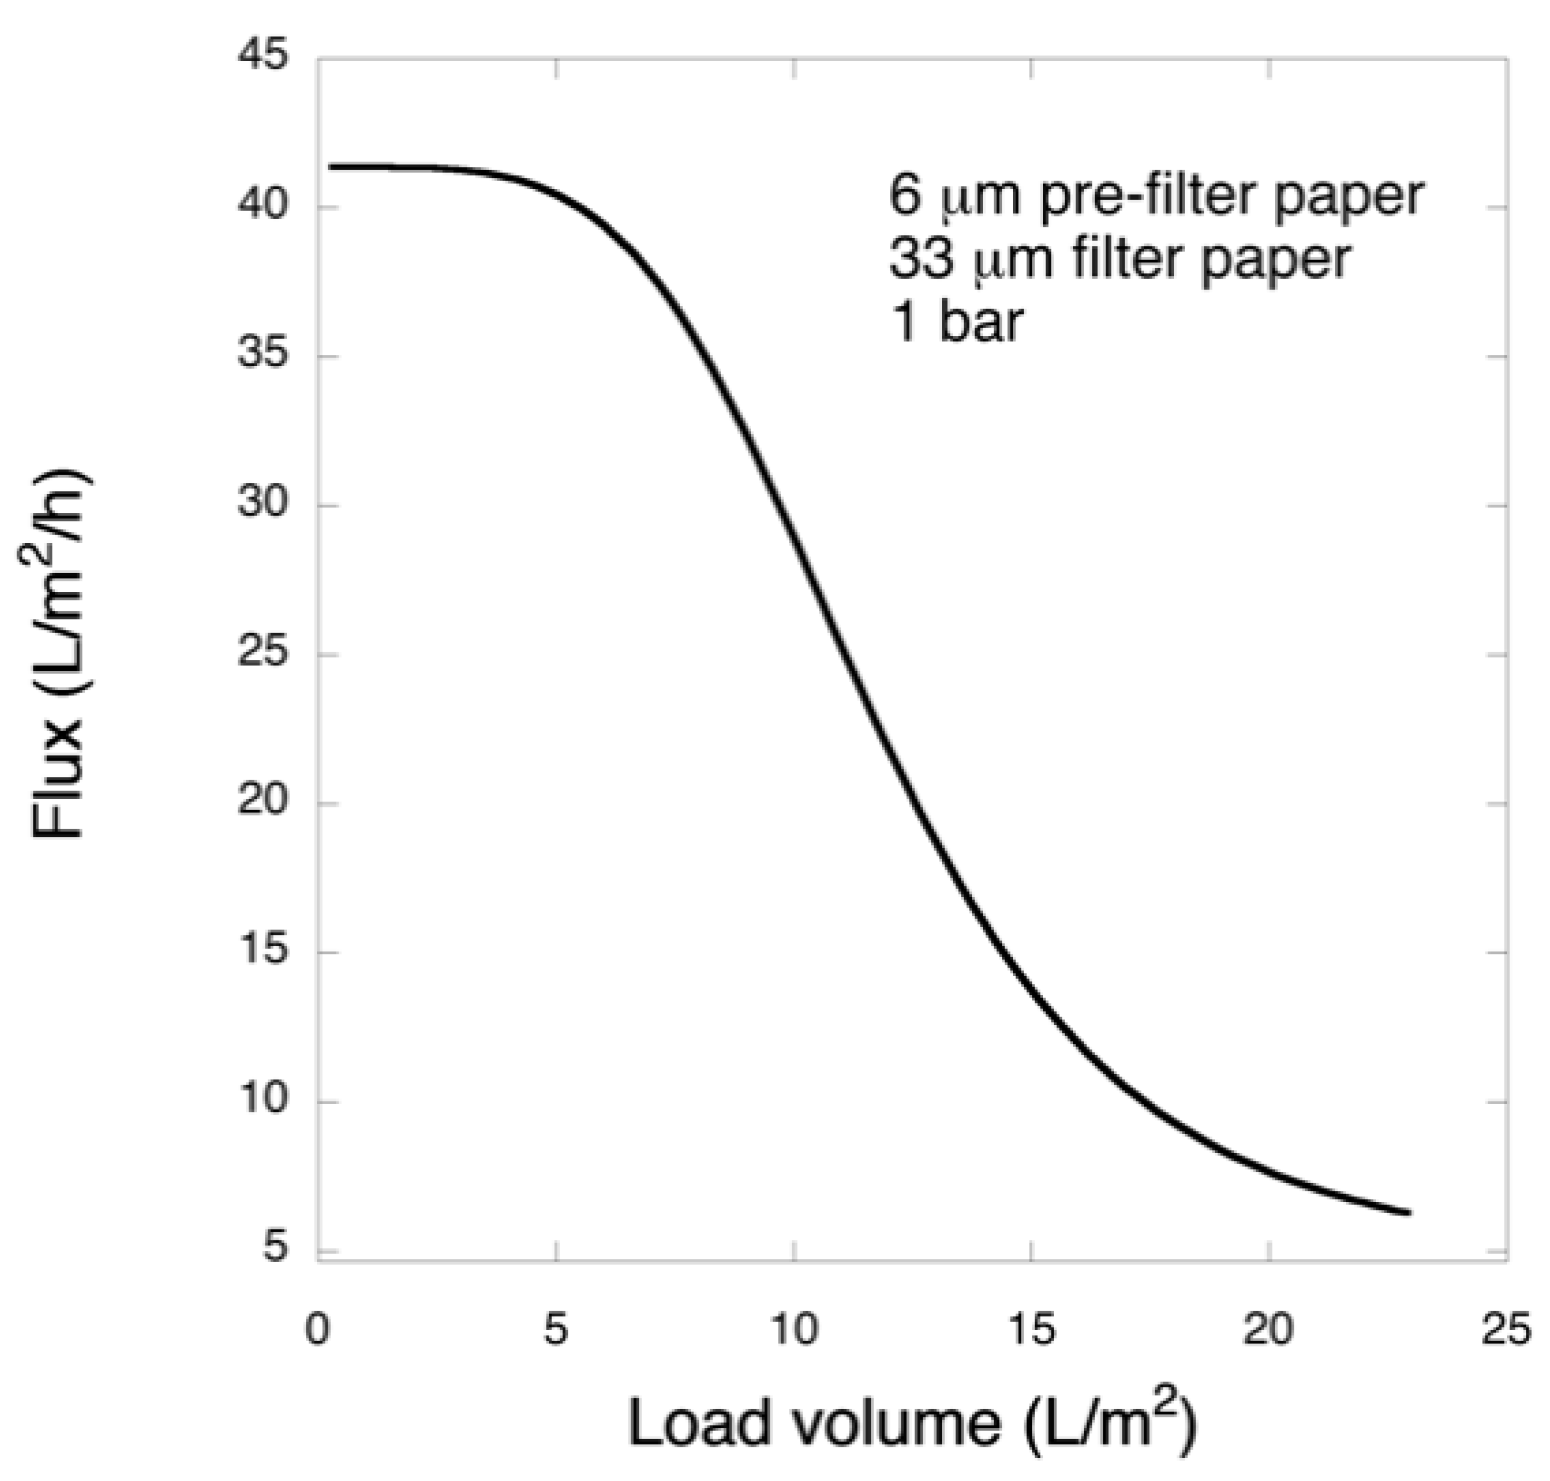
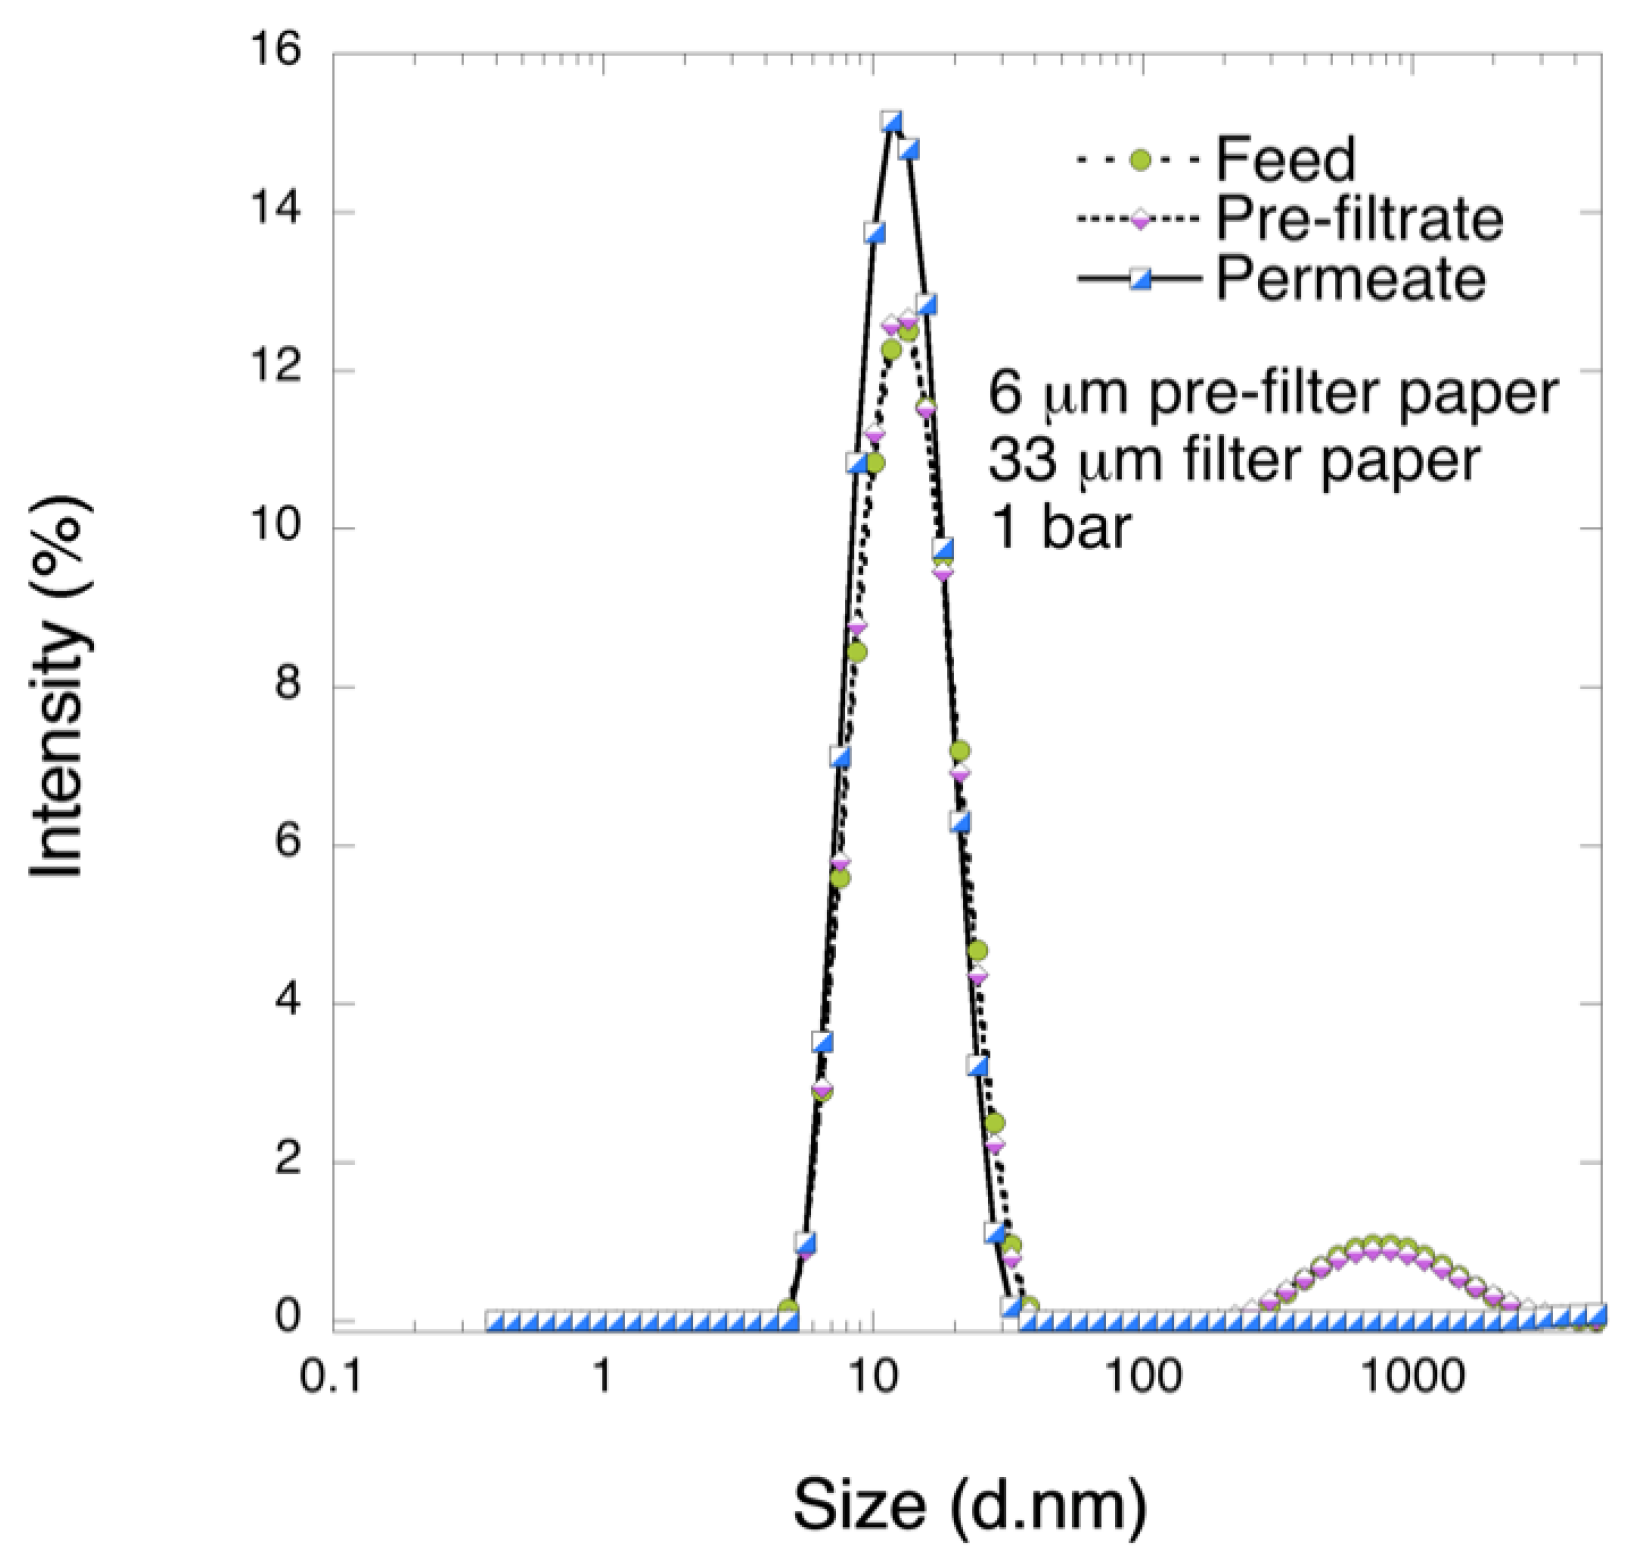
Pre-filtration and filtration steps were performed in a 47 mm diameter Advantech KST 47 filter holder. Prior to filtration, the pre- and filter papers were wetted in order to extrude the air by running 20 mL of PBS. The pre-filtration steps with 6 and 11 μm pre-filters were performed at 1 bar transmembrane pressure, and the filtrations with 33 μm filters were carried out at 1 or 3 bar. The permeate solutions were collected and for filtrations of the larger volume, permeate was collected in one or three fractions and saved.
2.5. Scanning Electron Microscopy (SEM)
For top-view images samples were fixed onto aluminum stubs with double-adhesive carbon tape, and for cross-section images the samples were mounted onto aluminum sample holders with screw. Imaging was performed using Zeiss Merlin FEG-SEM instrument (Jena, Germany). To reduce charging effects samples were sputtered with Au/Pd with a sputter coater (Polaron, Ashford, UK) was used. The sputtering settings were 4 × 10² mbar and 35 mA, and the sputtering time was 30 s.
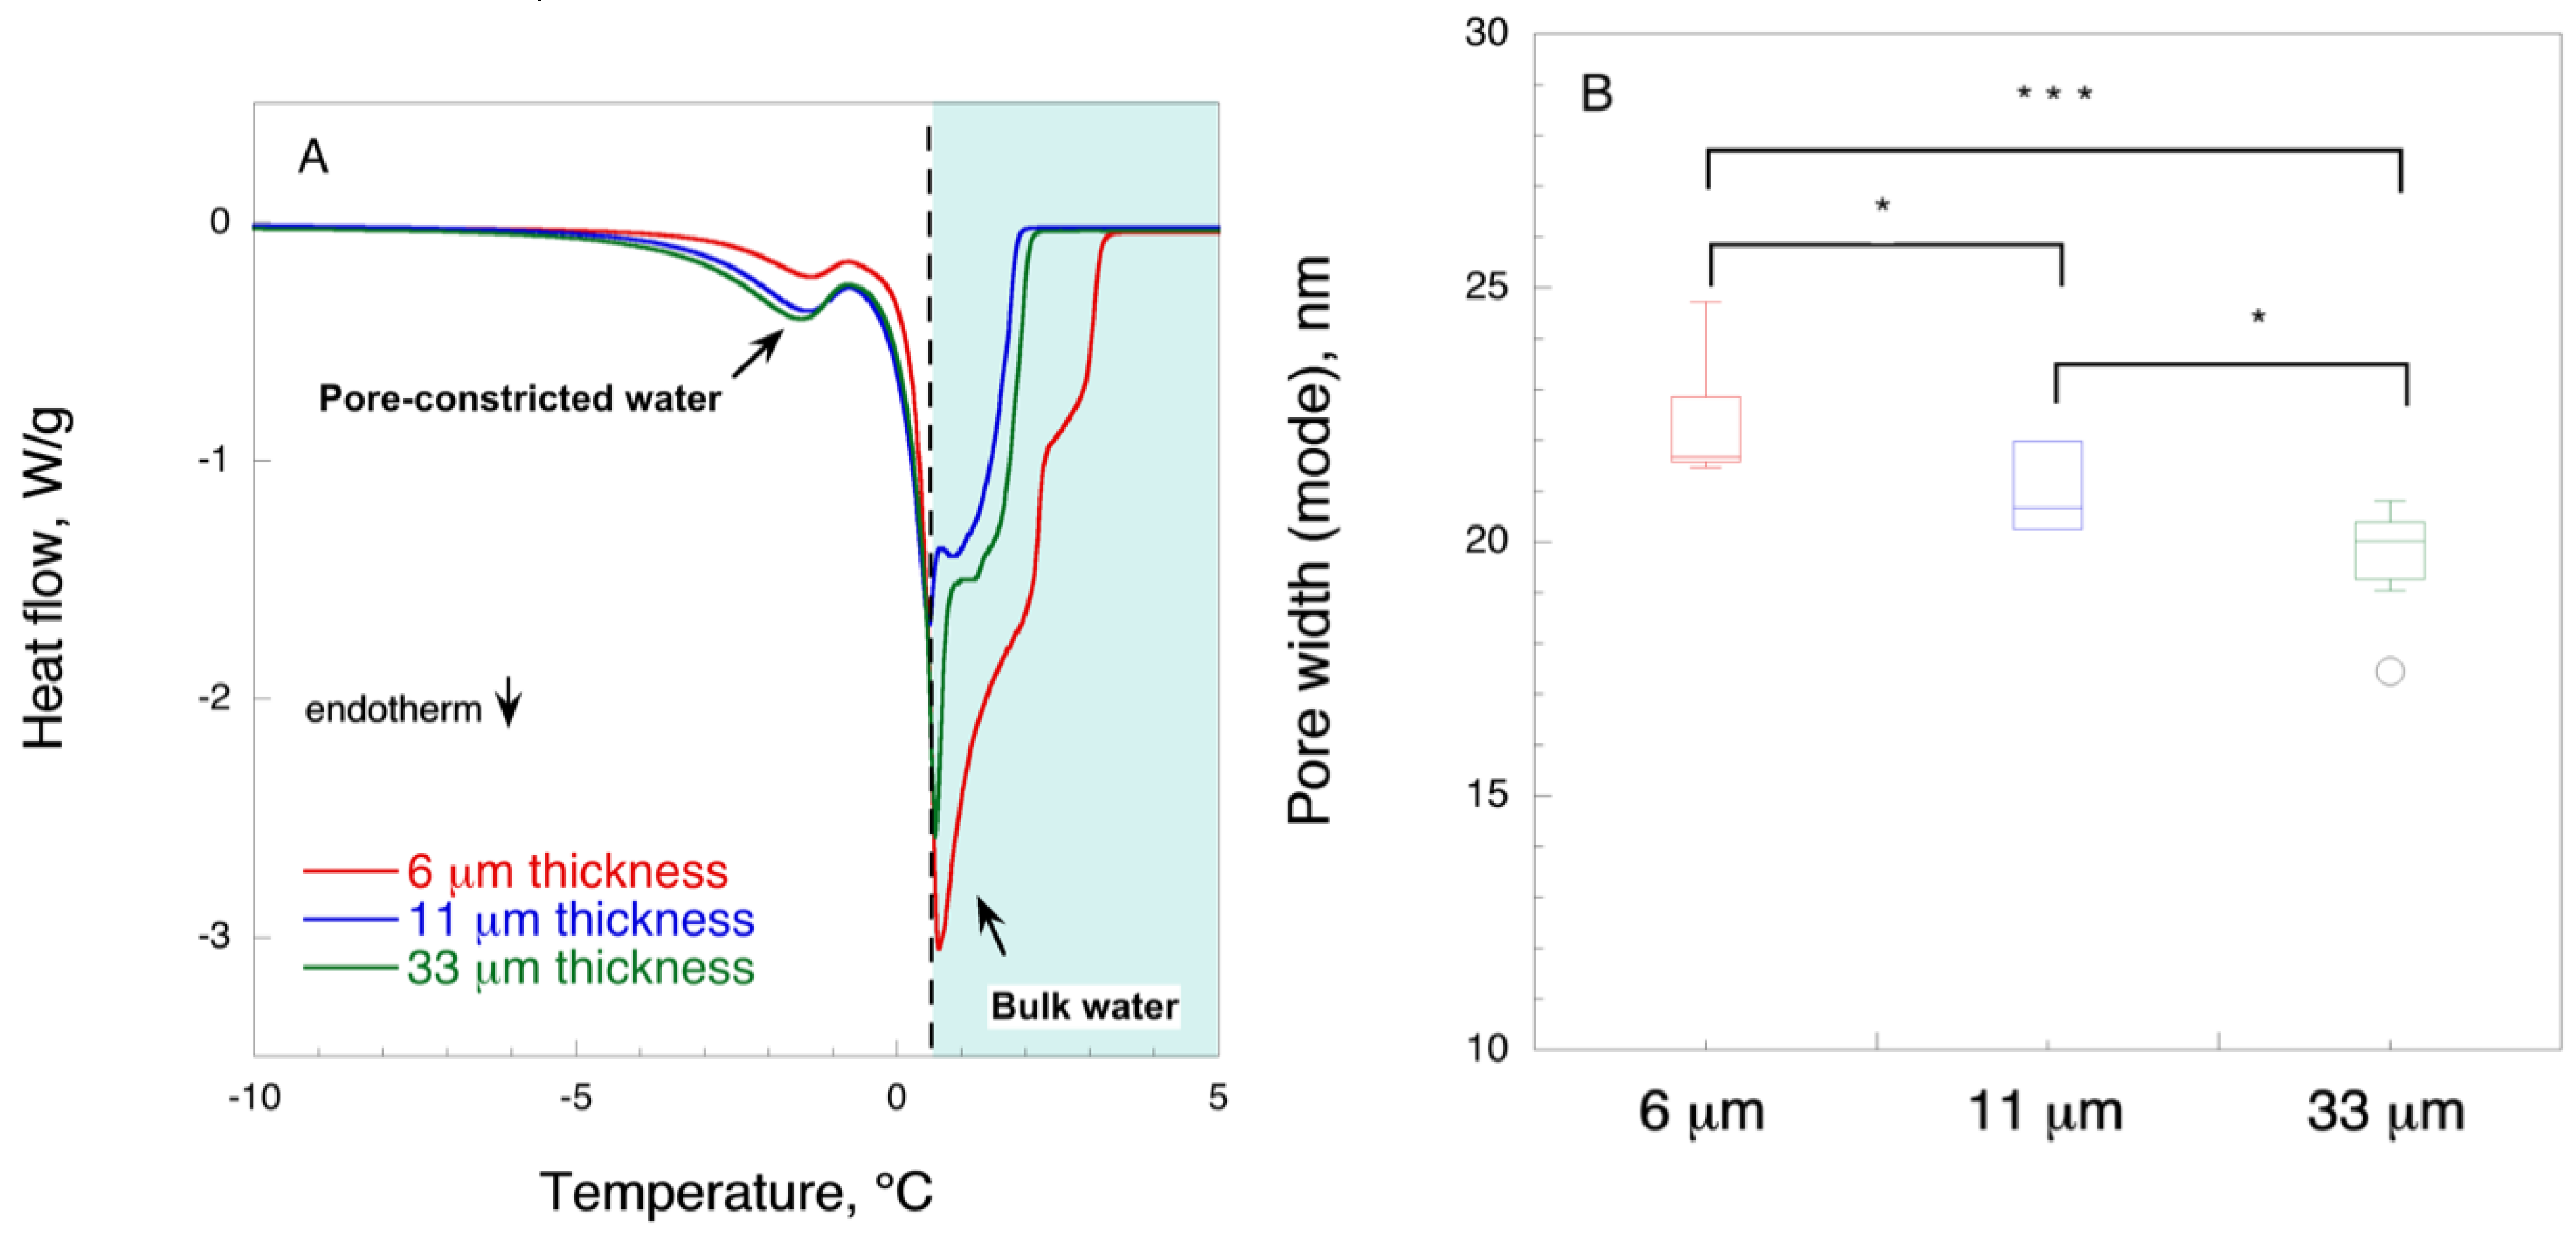
2.6. Cryoporometry by Differential Scanning Calorimetry
Filter paper samples (1.5–2 mg) were soaked into deionized water overnight at room temperature. Water was decanted, and the samples were placed in aluminum crucibles with a lid. Samples were cooled down to 248.15 K (−25 °C) at a rate of 10 K min−1 followed by heating to 277.15 K (4 °C) at a rate of 0.7 K min−1. Measurements were performed in five replicates.
The pore size was calculated according to Landry [
41]:
where
rp is the radius of pore (nm) and
ΔT is the difference between the peak maximum for melting of pore-confined water and peak value for melting of bulk water, experimentally determined at 0.6 ± 0.01 °C.
2.7. Dynamic Light Scattering
Particle size distribution was obtained from dynamic light scattering (DLS) using a Zetasizer Nano ZS (Malvern, UK) instrument. All experiments were performed in triplicates.
2.8. Polyacrylamide Gel Electrophoresis
Protein separation was performed by reducing polyacrylamide gel electrophoresis (SDS-PAGE). Samples were diluted (1:20 v/v) with PBS and Laemmli buffer, and boiled for 10 min. Electrophoretic separation was carried out at 270 V with Mini-PROTEAN Tetra Vertical Electrophoresis Cell (Bio-Rad, Hercules, CA, USA). Protein bands were detected with Gel Doc™ EZ System (Bio-Rad, Hercules, CA, USA), and quantified using Image Lab 6.0 analysis software (Bio-Rad).
2.9. Analytical SEHPLC
Samples were analyzed by size-exclusion high-pressure liquid chromatography using Hitachi Chromaster HPLC-UV system with bioZen 1.8 μm SEC-3 (Phenomenex, Torrance, CA, USA) analytical column. Chromatography was performed with 100 mM sodium phosphate, pH 6.8 mobile phase at 0.3 mL min−1 flow rate for 20 min.
2.10. LCMS
Equal amounts (20 µg) of protein samples were taken out for digestion. After reduction and alkylation, the proteins were on-filter digested by trypsin using 3 kDa centrifugal filters (Millipore Tullagreen, Ireland) according to a standard operating procedure. Obtained peptides were dried using a speedvac system. Pellets were resolved in 60 μL of 0.1% formic acid and further diluted four times prior to nano-LCMS/MS. Tandem mass spectrometry was performed by applying HCD in the QEx-Orbitrap mass spectrometer (Thermo Finnigan, San Jose, CA, USA), equipped with a reversed-phase C18-column by 35 min long gradient.
Database searches were performed using the Sequest algorithm, embedded in Proteome Discoverer 1.4 (Thermo Fisher Scientific, Waltham, MA, USA) against Homo Sapience proteome extracted from Uniprot, Release June 2019 with 95% confidence level per protein.
2.11. Bacteriophage Filtration and Titration
Coliphages PR772 and ΦX174 were spiked to the pre-filtered solutions to obtain final titer about 106 plaque forming units (PFU) mL−1 before filtration was performed. Bacteriophage titer was determined by PFU assay by double agar overlay method. Briefly, ten-fold serially diluted bacteriophage samples were mixed with host E. coli strains and melted soft agar, and poured on the surface of prepared hard agar plate, followed by incubation at 37 °C for 5 h.
Bacteriophage titer was calculated using Equation (1):
where
N is the number of plaques, V is the volume (typically 0.1 mL) of added virus and d is the dilution factor.
The virus retention was expressed as
log10 reduction value (
LRV):
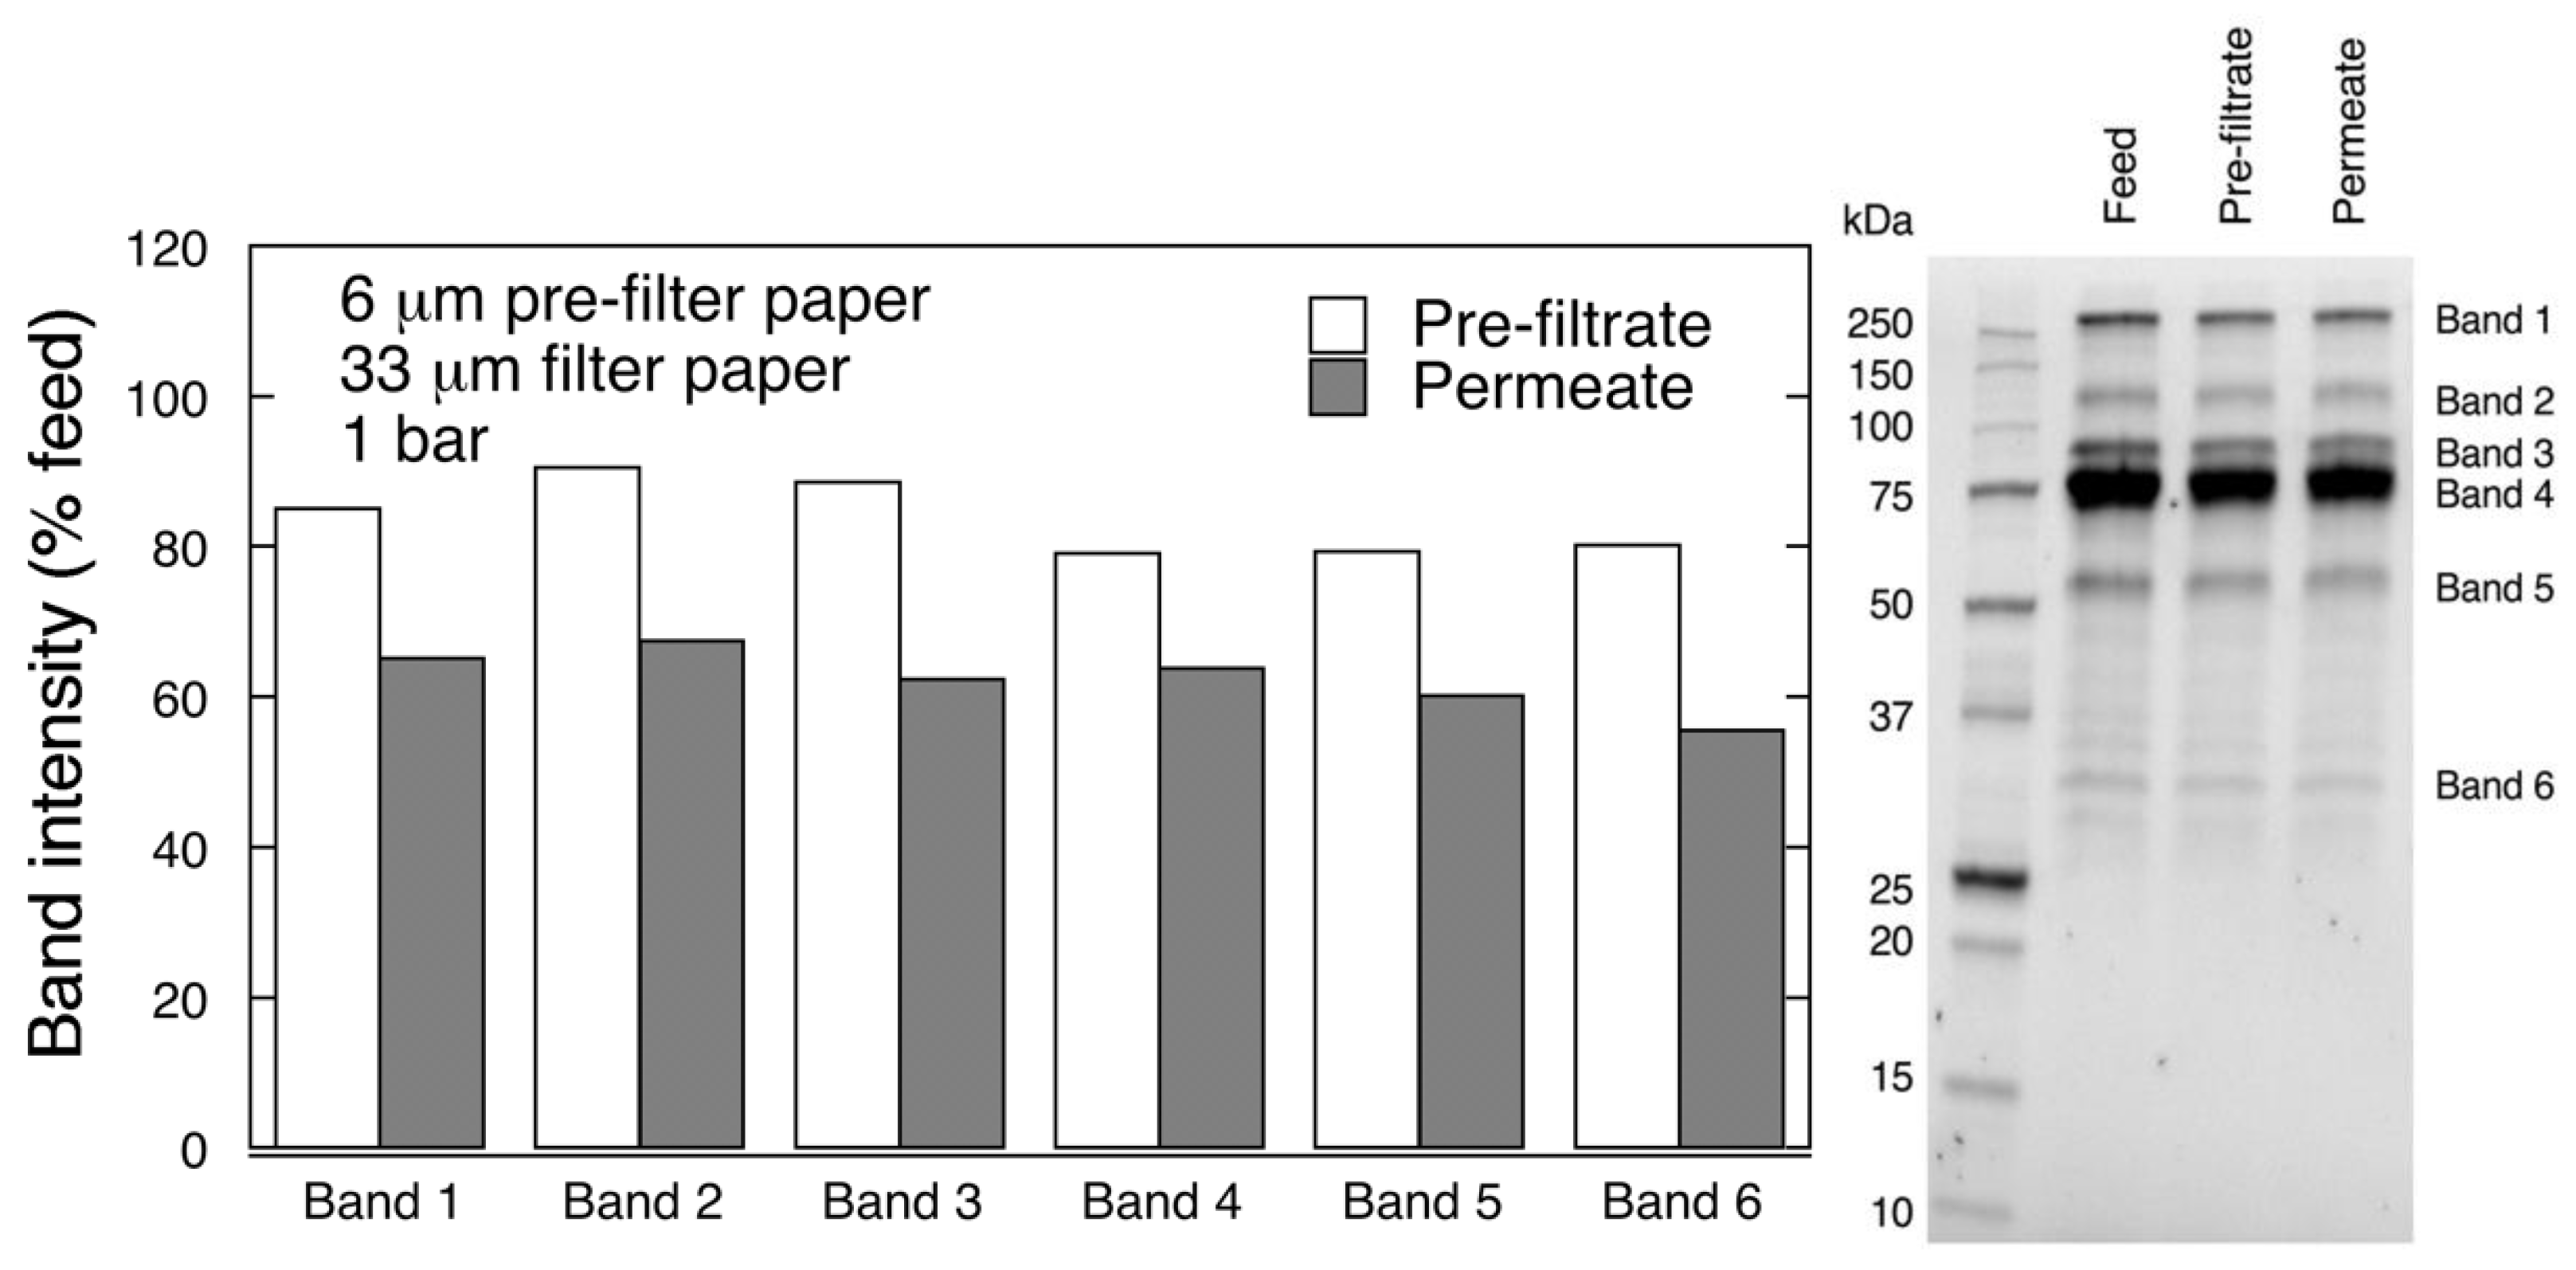
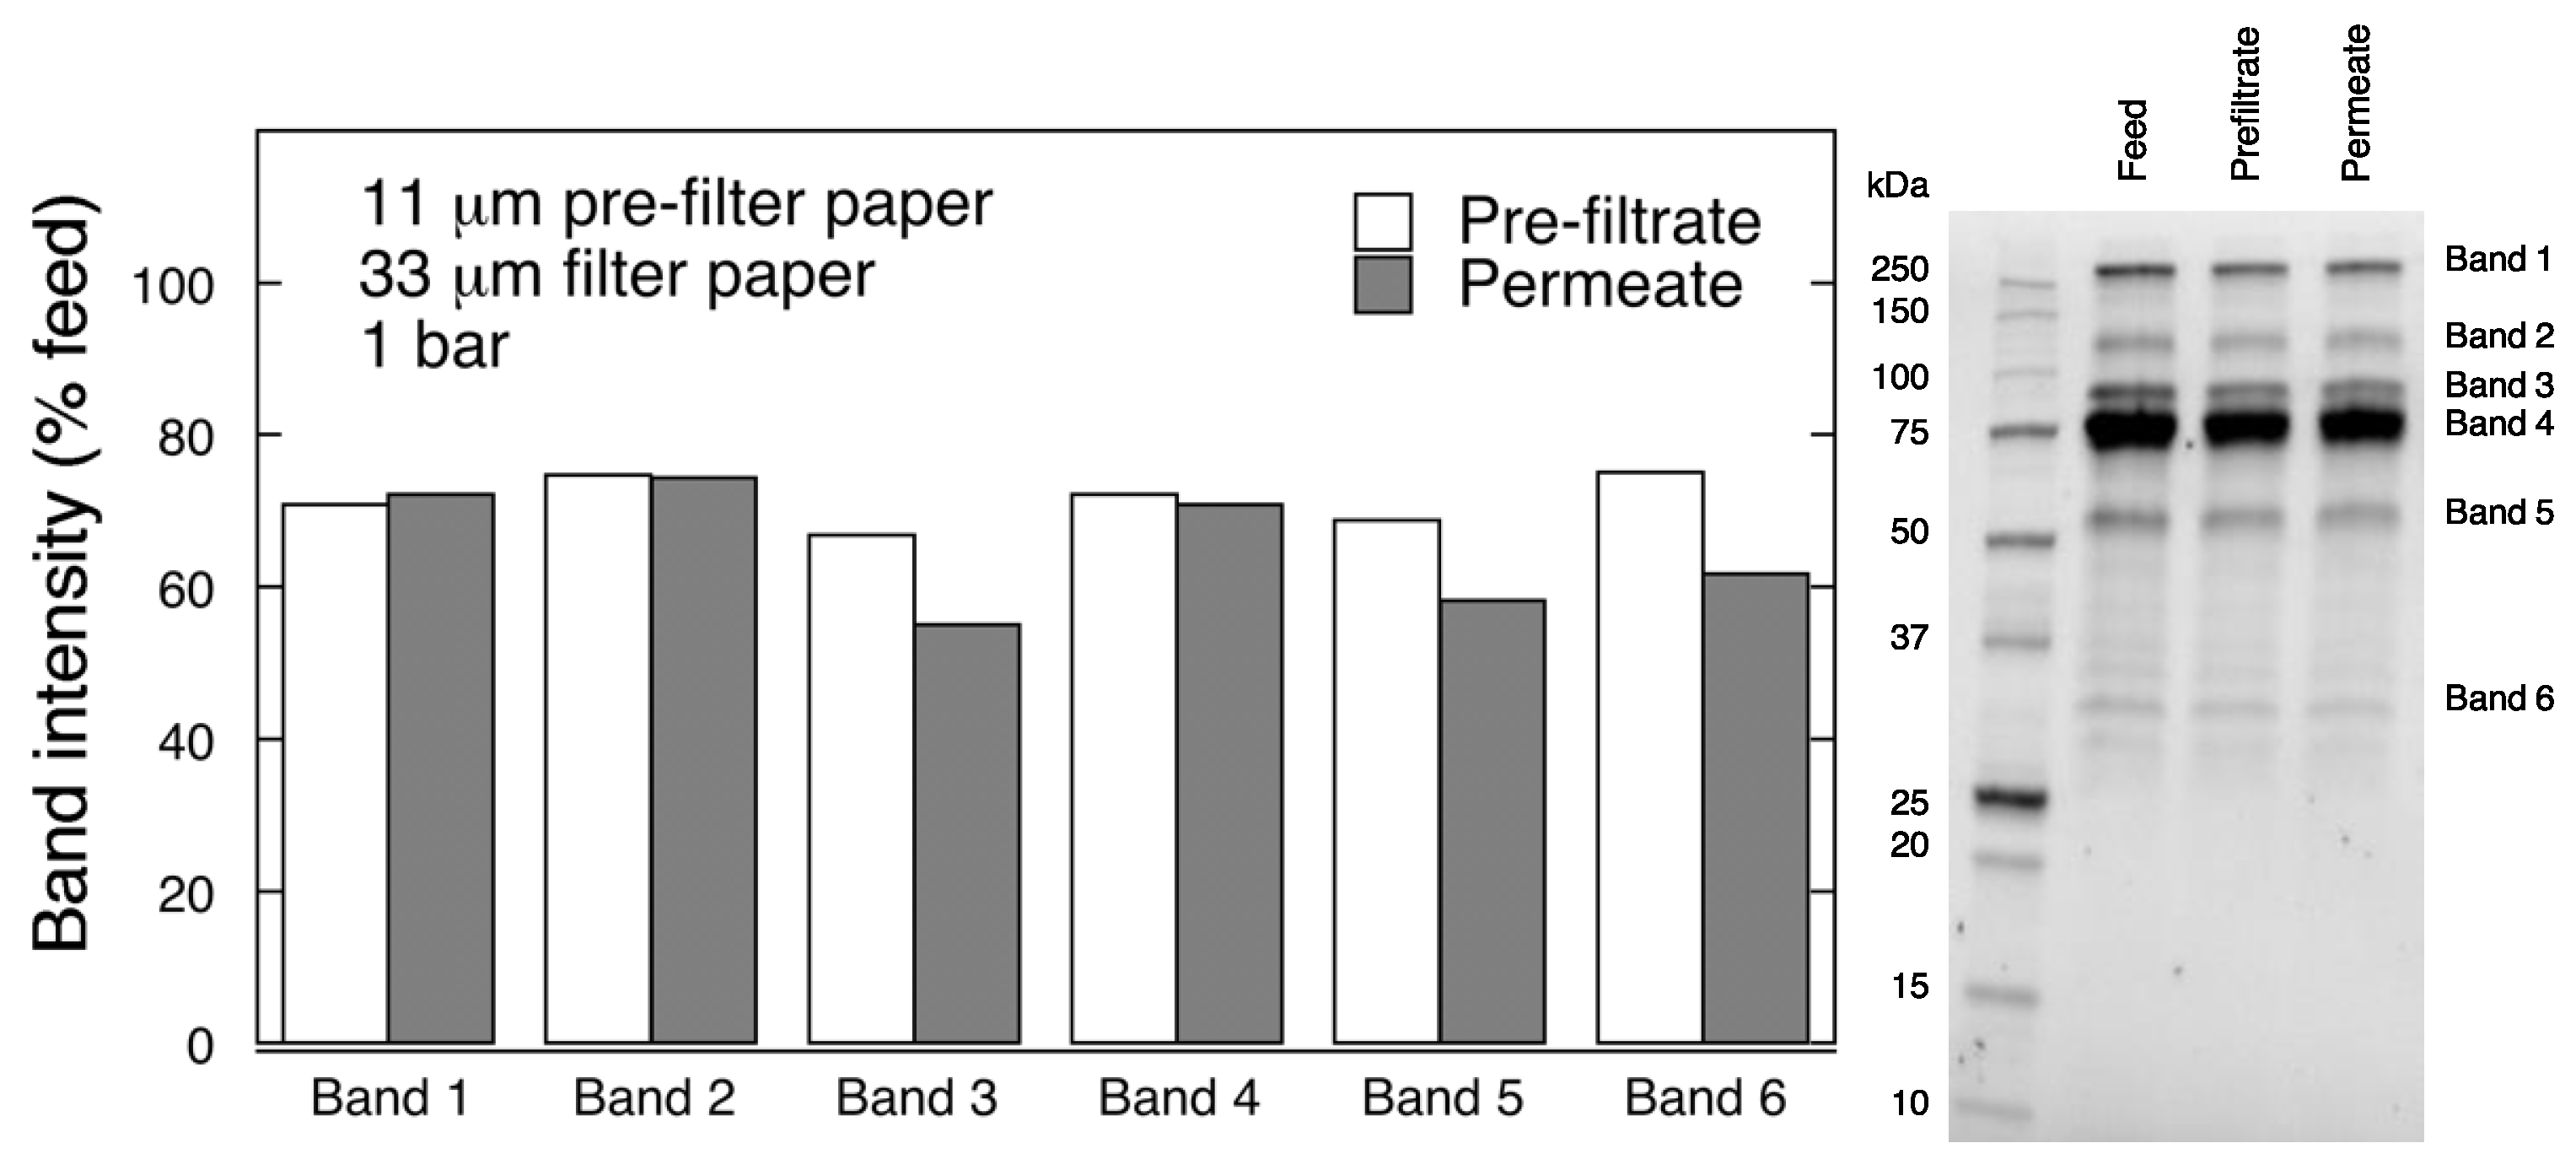
4. Discussion
In this article, the filtration of a highly challenging hematologic product was investigated. Considering that FIX-rich PCC inherently consists of many bioactive components and some impurities, the virus removal filtration of this product is difficult without fouling. The virus removal filtration of PCC was previously reported using Ultipor DV50 filters, which are dedicated for removal of large-size viruses but do not ensure viral safety against parvoviruses [
2]. Filtration of PCC through small-size virus removal filters, e.g., Planova 15N, resulted in nearly 39% total protein loss and reduced FIX and FII activity, which was ascribed to presence of large-size complexes between clotting factors and high molecular weight impurities [
14]. It was further reported in the same study that filtration of highly purified FIX through Planova 15N not only did not result in the decrease of FIX activity but also improved its purity [
14].
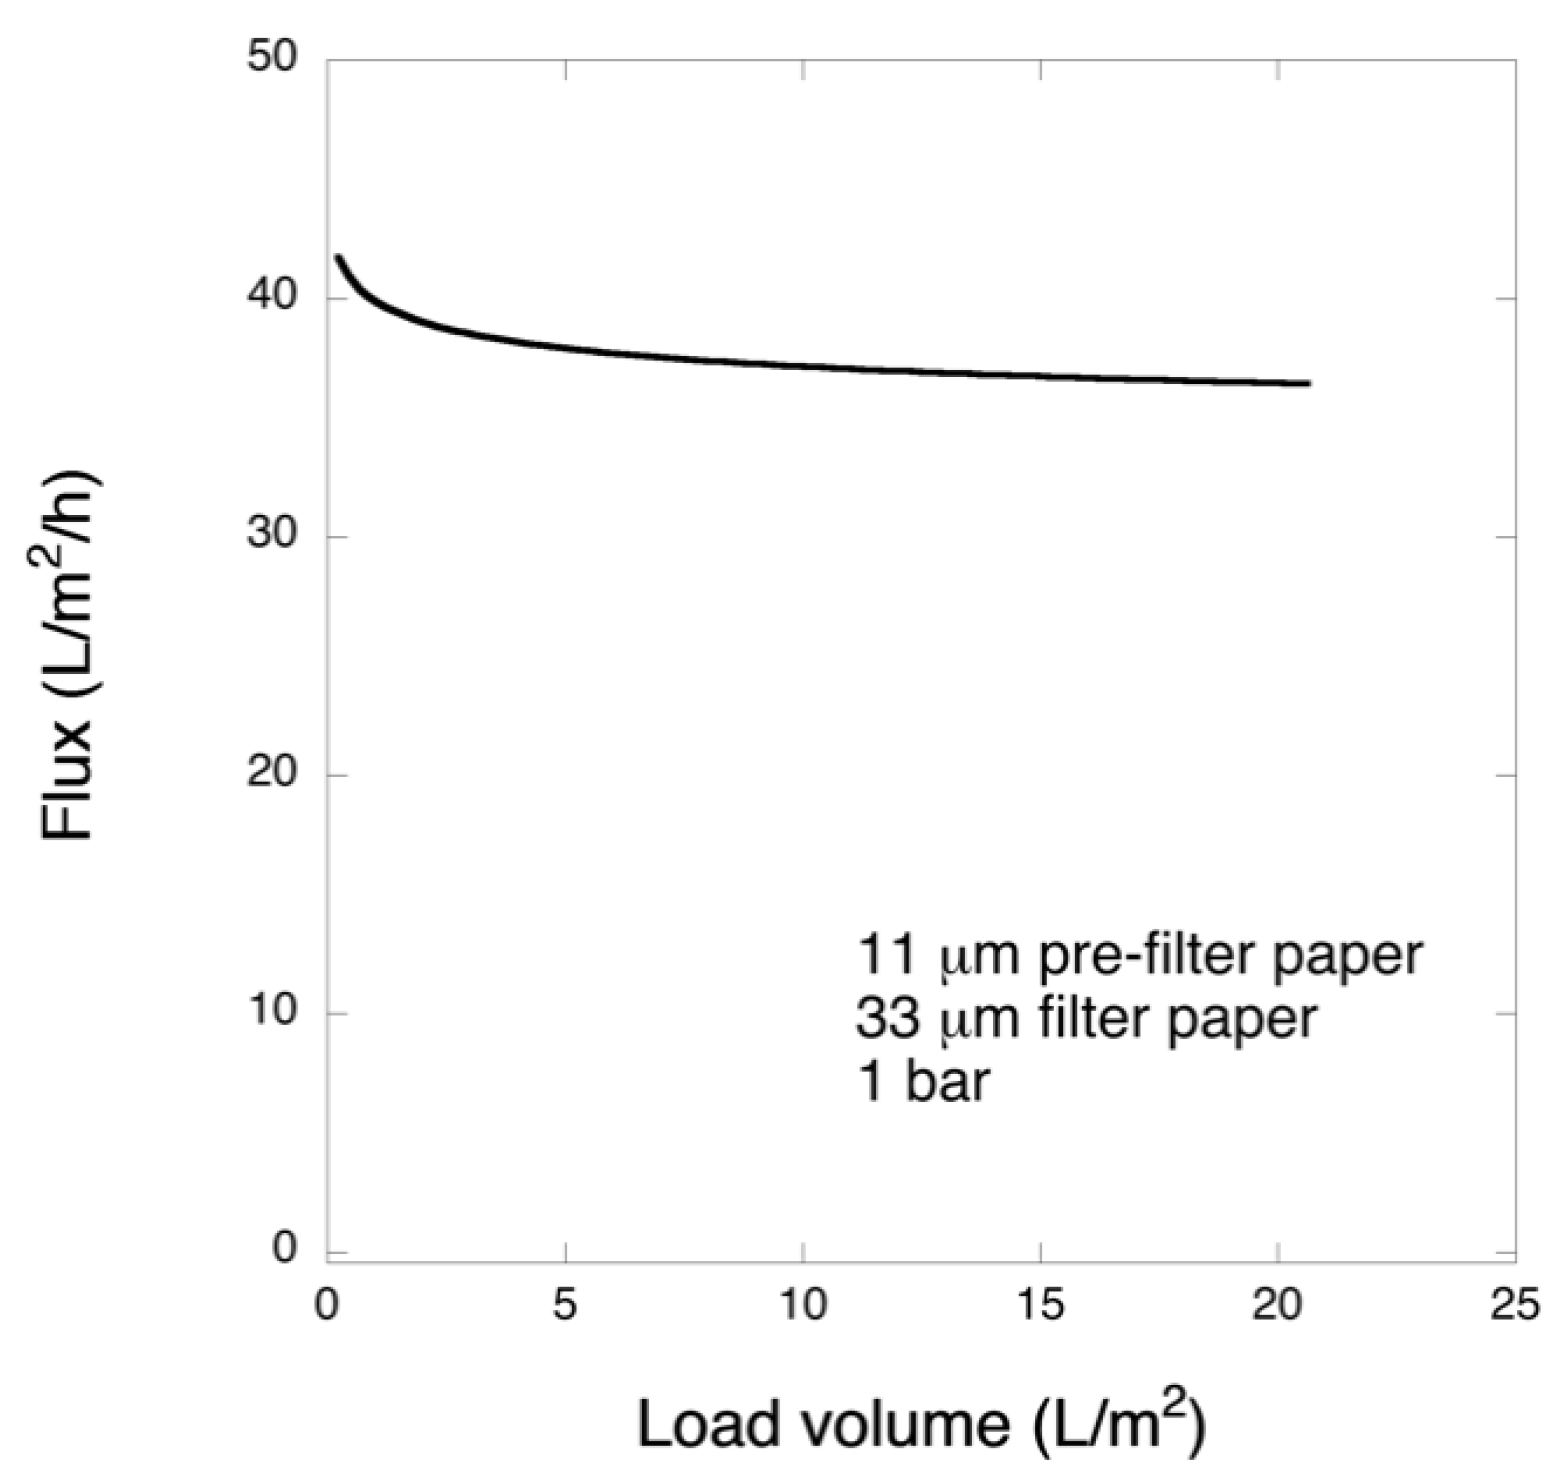
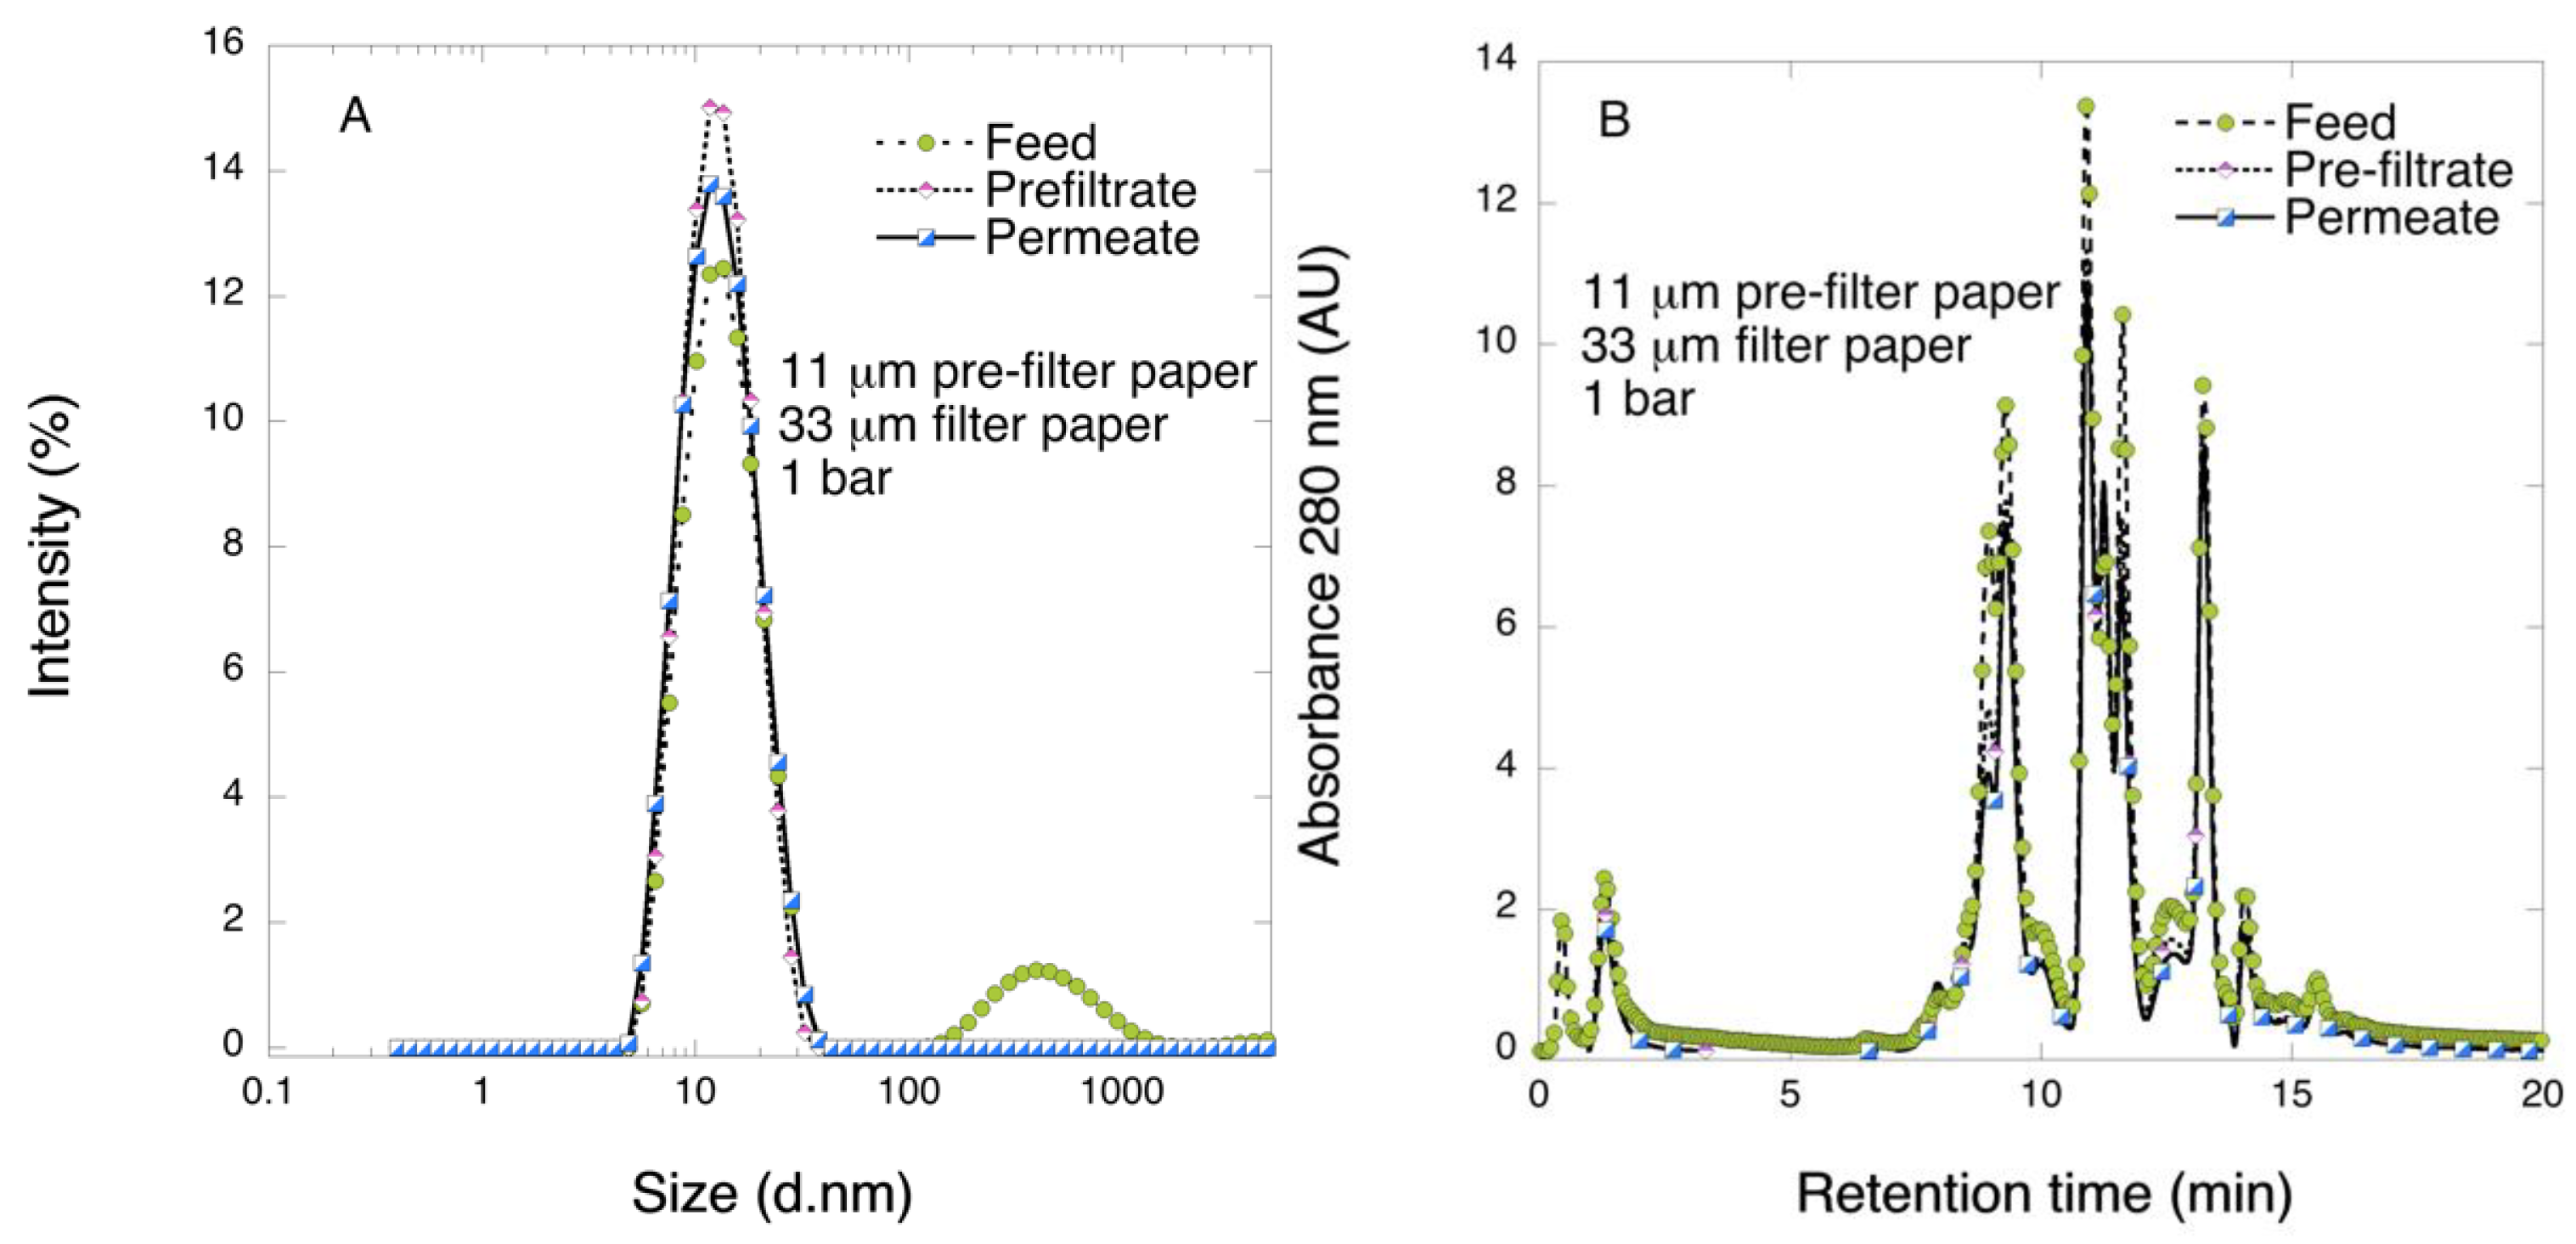
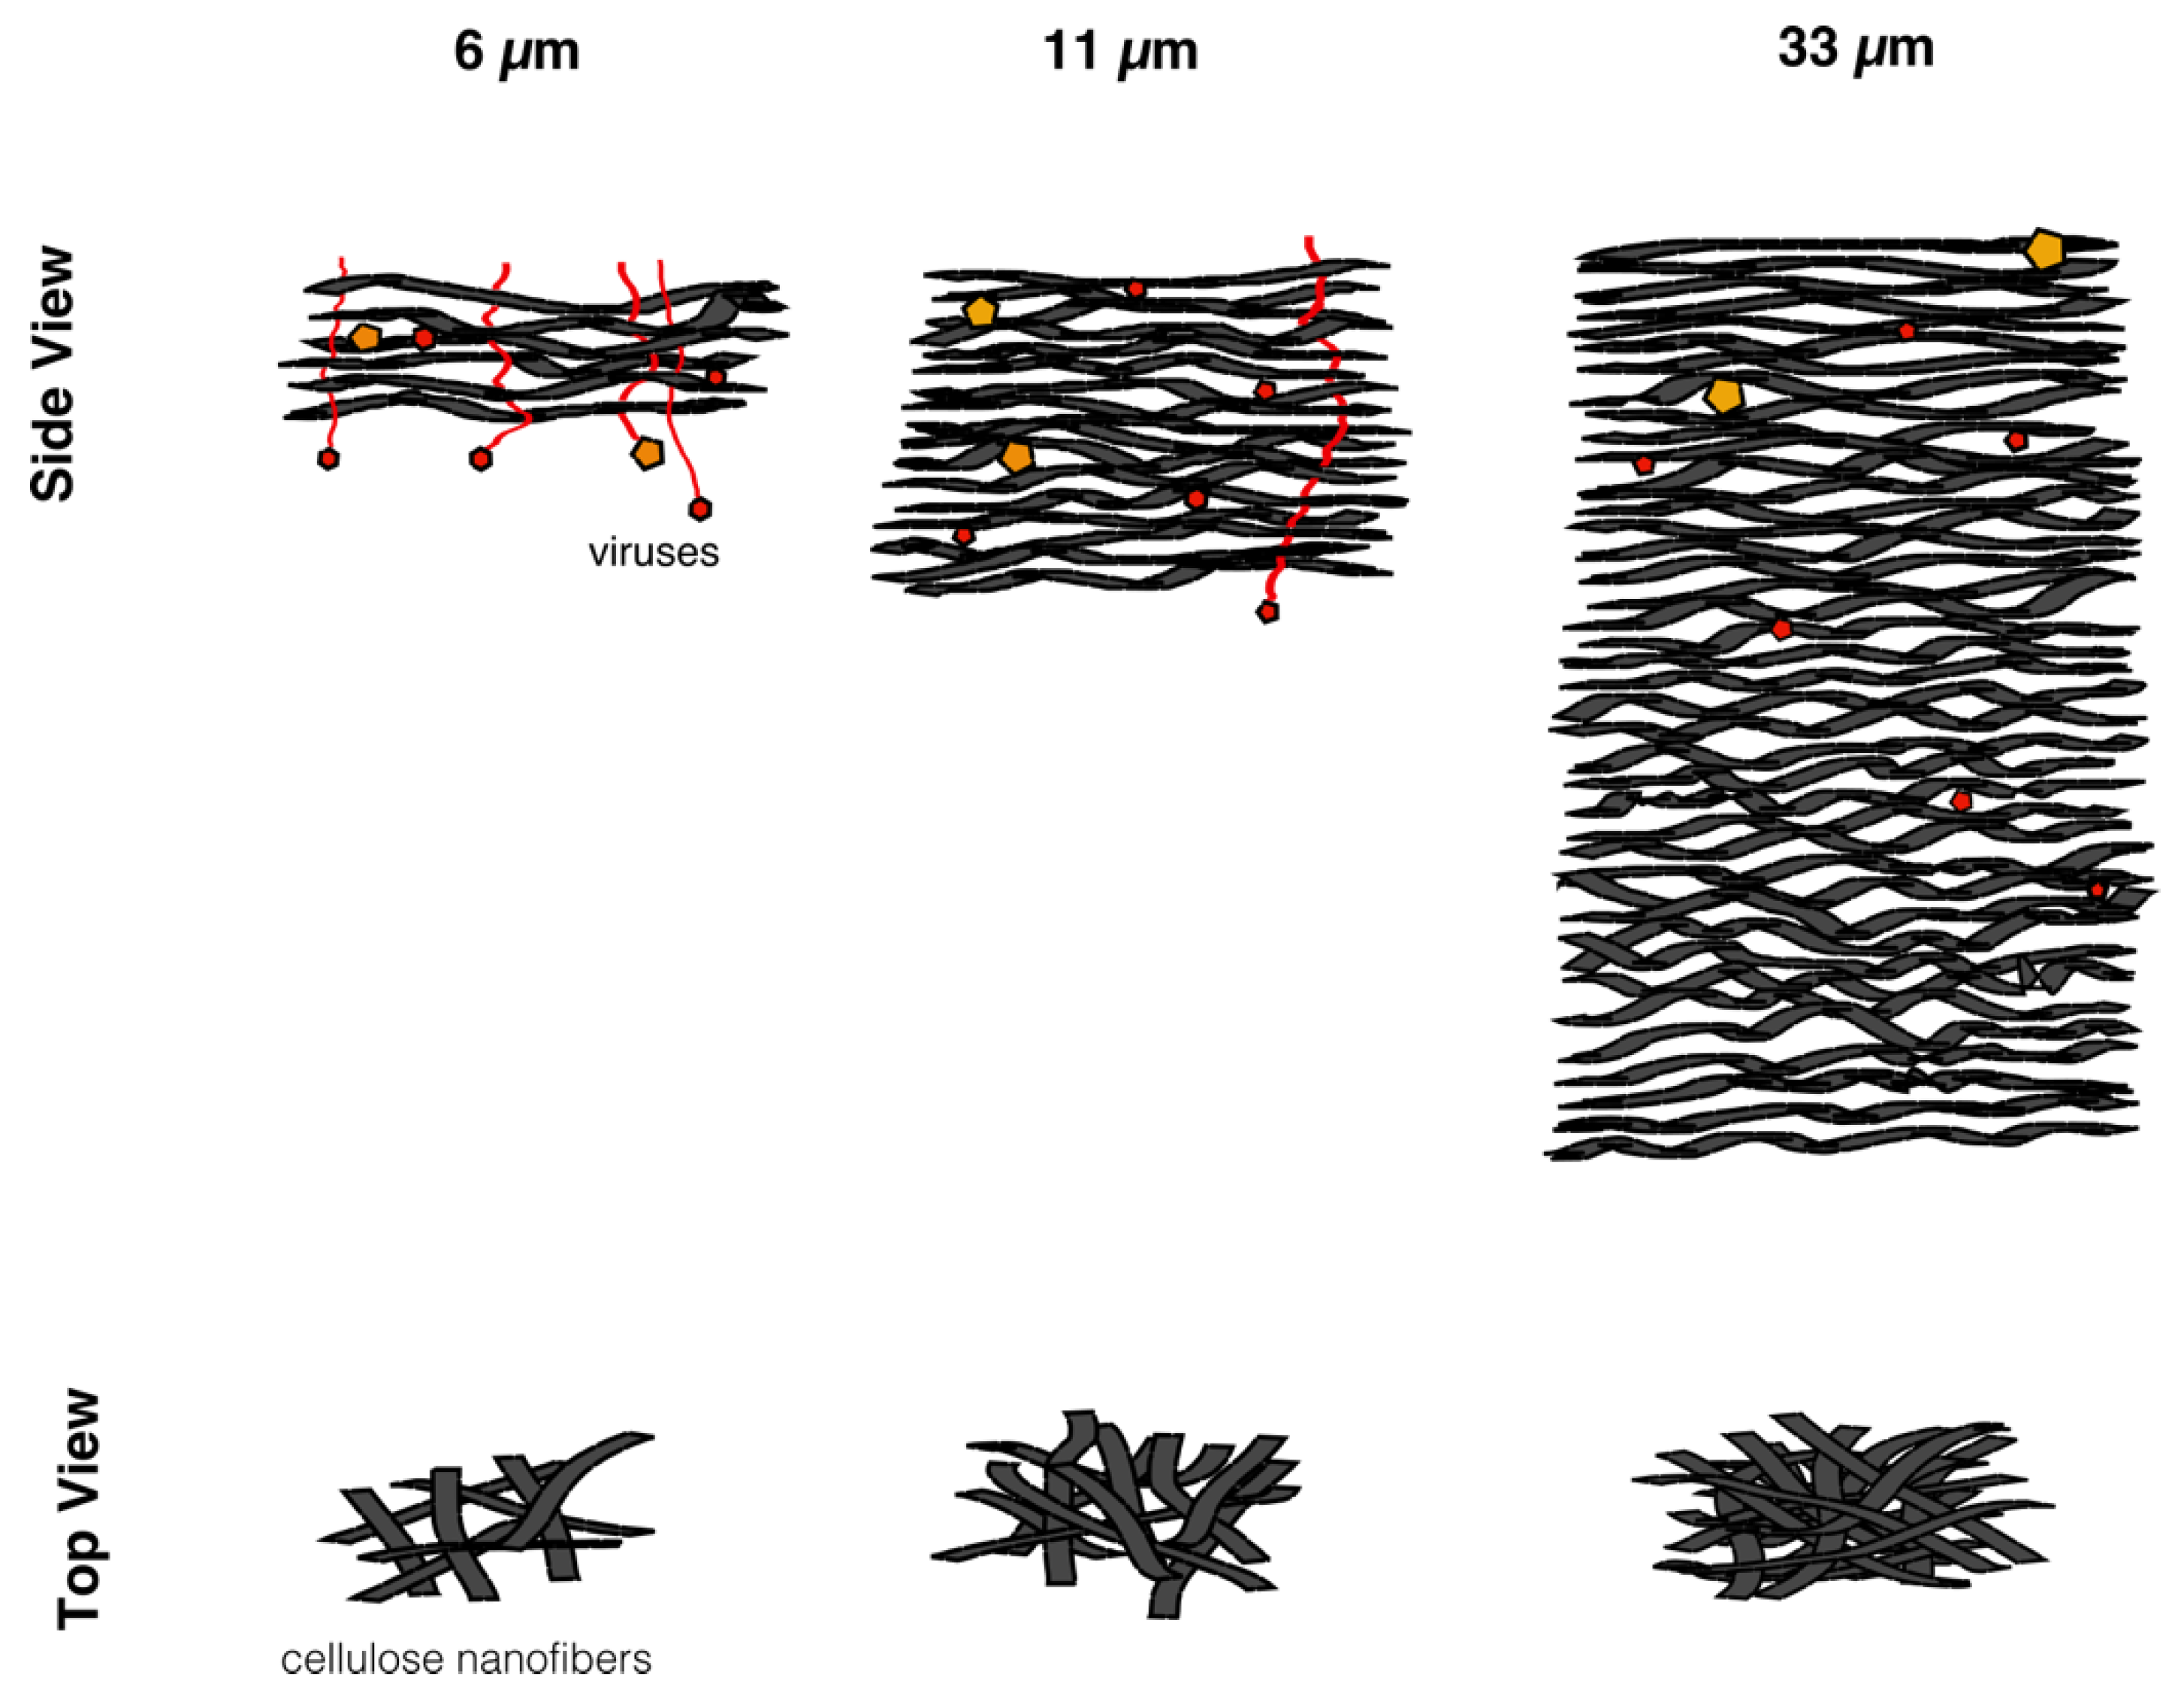
In this work, in order to achieve high virus removal capacity combined with reduced fouling, a tailored two-step process of filtration with nanocellulose-based filter paper was developed. In particular, sacrificial pre-filters with a thickness of 6 and 11 μm were tested. The increased thickness of the filters resulted in tighter pore structure as detected by cryoporometry. The observed effect is explained as follows and illustrated in
Figure 12. The mille-feuille filter paper consists of a stratified 3-dimensional network of cellulose nanofibers, producing a mesh-like stricture. The layered structure is illustrated in the side-view panel of
Figure 12. Considering that the nanofibers are randomly distributed in each layer, the pores, which percolate throughout the entire depth of the filter, become tighter with increasing number of layers. The latter is reflected, e.g., in improved virus clearance properties with increased thickness or enhanced aggregate removal properties. Based on the results of PFU titrations of 27 and 70 nm phage particles, it was concluded that the tested filters show varying particle size rejection threshold as the thickness of the filter is increased. Thus, the observed effect is due to the combination of the receding pore size and depth effects (increased tortuosity). The latter enables using pre-filters with tailored cut-off to remove protein aggregates, which eventually results in improved flux through the dedicated virus removal filter.
Overall, the two-step approach presented here is based on the size-exclusion principles and is therefore robust. It could thus further be adapted in the manufacturing of other protein-based pharmaceutics, too, including recombinant proteins wherein impurities in the form of host cell proteins may greatly affect the final yield of the biologics during virus removal nanofiltration.

 ,
, 


