Article

UCHL1 Expression in Colorectal Cancer: Clinicopathological Significance, Prognostic Value, and Implications for Immunotherapy Response

1
Department of General Surgery, The First Affiliated Hospital of Soochow University, Suzhou 215000, China
2
Department of Oncology, The First Affiliated Hospital of Soochow University, Suzhou 215000, China
3
Jiangsu Institute of Clinical Immunology, The First Affiliated Hospital of Soochow University, Suzhou 215000, China
*
Authors to whom correspondence should be addressed.
These authors contributed equally to this work.
Biomedicines 2026, 14(9), 1924; https://doi.org/10.3390/biomedicines14091924
Submission received: 3 August 2026 / Revised: 21 August 2026 / Accepted: 25 August 2026 / Published: 27 August 2026
(This article belongs to the Section Cancer Biology and Oncology)

Abstract

Background/Objectives: Ubiquitin C-terminal hydrolase L1 (UCHL1) exhibits context-dependent roles in various cancers, but its clinical significance and biological functions specifically in colorectal cancer (CRC) remain incompletely understood. Methods: We systematically evaluated UCHL1 expression, clinicopathological associations, prognostic value, and immunological role in CRC using multiple public databases (TCGA, GTEx, UALCAN, GEPIA2, GSCA, and ENCORI) combined with immunohistochemical validation on a tissue microarray containing 80 paired CRC and adjacent normal tissues. Functional enrichment was assessed using ssGSEA, and immune cell infiltration was analyzed using the immunedeconv R package. The immunotherapy response was evaluated using the TIDE algorithm. Results: UCHL1 mRNA and protein levels were significantly downregulated in CRC tissues compared with normal tissues. Paradoxically, high UCHL1 expression was significantly associated with advanced T stage, N stage, TNM stage, and poor overall and disease-free survival. ssGSEA revealed positive associations with multiple aspects of oncogenic pathways, including tumor inflammation signature, tumor proliferation signature, epithelial–mesenchymal transition markers, extracellular matrix-related genes, angiogenesis, apoptosis, and G2M checkpoint regulation. Notably, UCHL1 expression was positively correlated with computationally estimated infiltration of macrophages, CD4+ T cells, and CD8+ T cells, and with elevated expression of immune checkpoint genes, as well as higher TIDE scores. These correlative findings suggest a potential association with immunotherapy-related pathways that warrants further investigation. Conclusions: UCHL1 is downregulated in CRC, but its elevated expression is associated with aggressive disease and poor prognosis. It is implicated in multiple oncogenic pathways and may contribute to an immunosuppressive tumor microenvironment, suggesting its potential as a candidate prognostic biomarker that warrants further functional investigation.

1. Introduction

Colorectal cancer (CRC) is highly malignant and associated with substantial global mortality [1]. In 2022, CRC accounted for approximately 1.9 million new cases and 90,000 deaths, representing one of the most prevalent malignancies worldwide [2]. Although advancements in screening and adjuvant therapy have improved the five-year overall survival rate for localized CRC in recent years, the prognosis for advanced or metastatic disease remains poor [3]. The absence of distinct early clinical manifestations often leads to diagnosis at an advanced stage, with approximately 20% of patients presenting with distant metastases at initial diagnosis [4,5,6]. Therefore, identifying diagnostic biomarkers and developing novel therapeutic strategies are imperative to improving clinical outcomes in patients with CRC.
Ubiquitin C-terminal Hydrolase L1 (UCHL1), also known as PGP9.5 or PARK5, is a multifunctional deubiquitinating enzyme that participates in the ubiquitin-mediated protein degradation pathway, exhibiting effects such as deubiquitination, ligation, and hydrolysis [7]. In cancer pathogenesis, UCHL1 plays context-dependent and often opposing roles, acting either as a tumor suppressor or an oncogene depending on the malignancy. For instance, it promotes tumorigenesis in neuroendocrine carcinomas, triple-negative breast cancer, and gastric cancer [8,9,10], whereas it suppresses tumor development in nasopharyngeal carcinoma [11]. In CRC, UCHL1 has been reported to function as an oncogene by activating the β-catenin/TCF pathway through its deubiquitinating activity [12]. Additionally, UCHL1 promoter methylation has been identified as a potential marker for metastatic CRC [13], and its level of expression correlates with lymph node metastasis in colorectal carcinoma [14]. Despite these emerging insights, the diagnostic value of UCHL1 in CRC remains unclear.
In this study, we aimed to comprehensively evaluate the expression, clinicopathological associations, and prognostic significance of UCHL1 in CRC through a bioinformatics analysis integrating multiple public mRNA databases. Further analysis revealed that elevated UCHL1 protein levels in CRC tissues correlate with N and AJCC stages. Potential biological pathways regulated by UCHL1 during CRC progression were subsequently identified. Additionally, the impact of UCHL1 on immune infiltration and immunotherapy response was assessed.

2. Materials and Methods

2.1. Analysis of UCHL1 mRNA Expression

UCHL1 mRNA expression in colorectal cancer and normal tissues was examined using four databases—UALCAN (https://ualcan.path.uab.edu/, accessed on 24 March 2026), GEPIA2 (http://gepia2.cancer-pku.cn/#index, accessed on 24 March 2026), GSCA (https://guolab.wchscu.cn/GSCA/#/, accessed on 24 March 2026), and ENCORI (https://rnasysu.com/encori/, accessed on 24 March 2026). TCGA-derived STAR-counts data, together with corresponding clinical information, were downloaded from the GDC data portal (https://portal.gdc.cancer.gov, accessed on 24 March 2026). The raw read counts were converted to TPM values and normalized via log2(TPM+1) transformation, yielding 620 eligible CRC samples after filtering. Normal tissue expression profiles were obtained from the GTEx project (V8 release; https://gtexportal.org/home/datasets, accessed on 24 March 2026). All statistical comparisons of UCHL1 mRNA abundance between CRC-TCGA and GTEx samples were executed in R (version 4.0.3) [15]. The beta value, which indicates the DNA methylation level at the UCHL1 promoter, was analyzed using the UALCAN database (https://ualcan.path.uab.edu/, accessed on 19 August 2026).

2.2. Association Between UCHL1 mRNA Expression and Clinicopathological Parameters

Based on the 620 CRC samples obtained from TCGA (https://portal.gdc.cancer.gov, accessed on 24 March 2026), patients were stratified into two groups according to the median UCHL1 expression level, yielding 311 cases with high expression and 309 with low expression. Associations between UCHL1 expression and clinicopathological variables—including age, gender, race, T stage, N stage, M stage, TNM stage, and new tumor event—were evaluated using the chi-squared test. All statistical analyses were performed using R software (version 4.0.3) [16].

2.3. Survival Prognosis Analysis

To evaluate the prognostic value of UCHL1 in CRC, we utilized three independent datasets. The GEPIA2 database, which integrates TCGA and GTEx expression data, was used to evaluate overall survival (OS)—defined as the time from diagnosis to death from any cause—and disease-free survival (DFS)—defined as the time from treatment completion to disease recurrence or death. For this analysis, patients were stratified into groups based on quartiles of UCHL1 expression. Additionally, the Kaplan–Meier Plotter database (https://kmplot.com/analysis/, accessed on 24 March 2026), which integrates gene expression and clinical data from GEO, TCGA, and EGA, was used to assess OS (time from diagnosis to death) and DFS (time from treatment completion to recurrence). Finally, the TCGA cohort (n = 620) was analyzed, for which RNA-seq data and corresponding clinical information were obtained from the TCGA GDC data portal (https://portal.gdc.cancer.gov, accessed on 24 March 2026); only samples with complete RNA-seq data, non-missing clinical information (including survival time, T/N/M stage, and TNM stage), and non-zero survival time were included, with OS defined using the TCGA “OS” attribute (time from diagnosis to death) and DFS defined as time from treatment completion to recurrence or death. For all three datasets, Kaplan–Meier curves were generated, and log-rank tests were performed to compare survival differences between the high- and low-UCHL1 expression groups [17,18,19].

2.4. Function Analysis

For single-sample gene set enrichment analysis (ssGSEA), we applied the same TCGA CRC dataset described above (https://portal.gdc.cancer.gov, accessed on 24 March 2026). Predefined pathway gene sets were assembled and processed using the GSVA package in R (version 4.0.3), with the method parameter set to “ssgsea” [20,21].

2.5. Immune Correlation Analysis

To investigate the relationship between UCHL1 expression and immune cell infiltration in CRC samples from the TCGA database (https://portal.gdc.cancer.gov, accessed on 24 March 2026), immune scores were assessed using the immunedeconv R package (version 2.1.2), which integrates four state-of-the-art algorithms: QUANTISEQ, TIMER, EPIC, and MCPCOUNTER. These algorithms have been systematically benchmarked, each offering distinct advantages in deconvoluting immune cell fractions from bulk transcriptomic data. All statistical analyses were conducted using R software (version 4.1.3; R Foundation for Statistical Computing, Vienna, Austria, 2022), with the correlation analyses and visualizations performed using the ggClusterNet R package (version 2.00) [22].
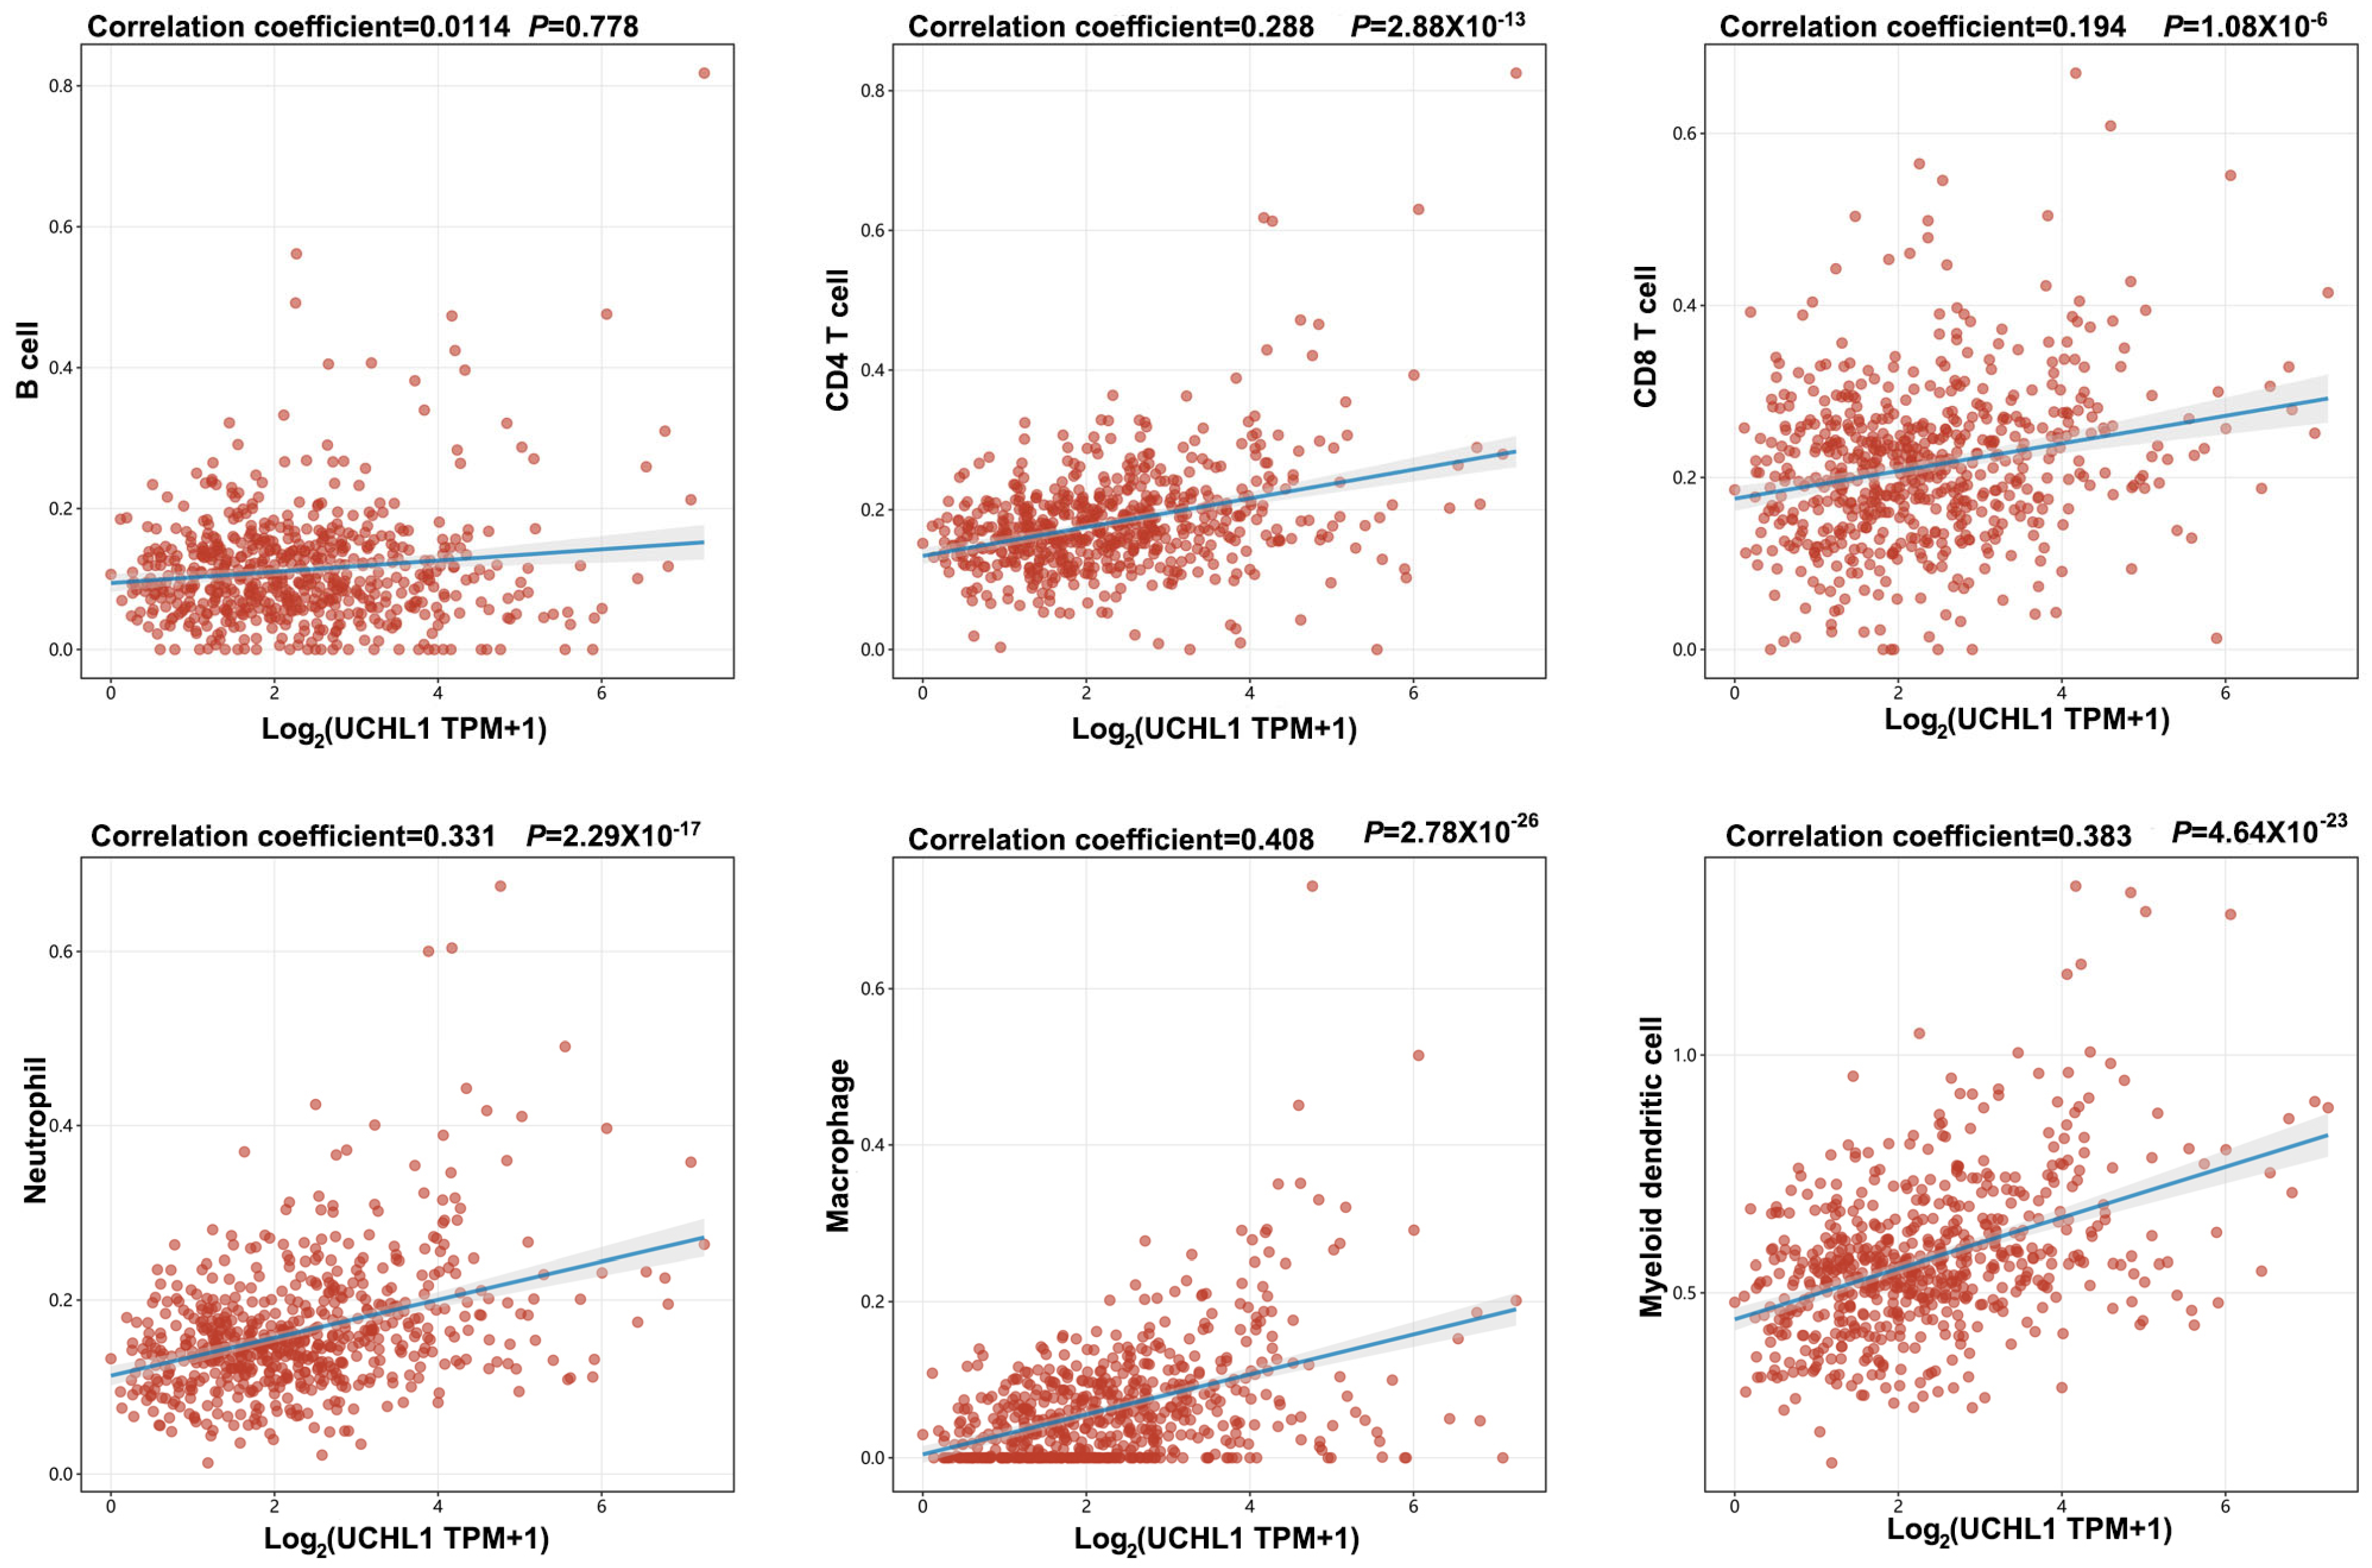
In addition, Spearman’s correlation analysis was performed to assess the relationship between UCHL1 and immune cells (B cells, CD4+ T cells, CD8+ T cells, macrophages, neutrophils, and myeloid dendritic cells) in CRC using TCGA data (n = 620) [23].

2.6. Relationship Between UCHL1 and Immune Checkpoint Gene Expression

To further explore the relationship between UCHL1 expression and immune checkpoint regulation, the CRC samples from the TCGA database (https://portal.gdc.cancer.gov, accessed on 24 March 2026) that were dichotomized into high- and low-expression groups based on the median UCHL1 expression level (high expression, n = 311; low expression, n = 309) were used. The expression levels of immune checkpoint-associated genes, including CD274, CTLA4, HAVCR2, ITPRIPL1, LAG3, PDCD1, PDCD1LG2, SIGLEC15, TIGIT, and IGSF8, were compared between the two groups [24,25]. Moreover, the Tumor Immune Dysfunction and Exclusion (TIDE) algorithm was employed to predict immunotherapy response for each group. Statistical analyses were performed using R software (version 4.0.3) [26].

2.7. Human Samples

A CRC tissue microarray (TMA) was obtained from Hunan Aifang Biotechnology Co., Ltd. (Changsha, China), accompanied by corresponding follow-up data. The TMA consisted of 80 paired samples of CRC and adjacent normal tissues (NATs); the patient characteristics are summarized in Table 1. Ethical approval for this study was granted by the Medical Ethics Committee of the First Affiliated Hospital of Soochow University (approval no. 2021-327). Informed consent was obtained from all subjects involved in the study.

2.8. Immunohistochemistry

Immunohistochemical staining was conducted on 4 μm serial sections of paraffin-embedded tissue specimens, following a previously established protocol [27]. After deparaffinization and rehydration, antigen retrieval was performed by microwave heating in citrate buffer (pH 6.0). Non-specific binding sites were blocked by incubating the sections with 1% bovine serum albumin (BSA) in PBS for 30 min at ambient temperature. The sections were subsequently incubated overnight at 4 °C with a rabbit polyclonal anti-UCHL1 primary antibody (Proteintech Group, Inc. (Wuhan, China); cat. no. 14730-1-AP) at a 1:200 dilution. Following washing, the sections were treated with a biotinylated secondary antibody (Boster Biological Technology Co., Ltd. (Wuhan, China); cat. no. SA1020; 1:500) and then with HRP-conjugated streptavidin from the same kit. Immunoreactivity was visualized using a DAB+ chromogen kit (Agilent Technologies, Inc., Santa Clara, CA, USA), and the sections were counterstained with hematoxylin. The IHC score was determined by multiplying the staining intensity (negative, 0; mild, 1; moderate, 2; and strong, 3) by the percentage of the stained area (0%, 0; 1–25%, 1; 26–50%, 2; 51–75%, 3; and 76–100%, 4). All sections were evaluated independently by two experienced pathologists who were blinded to all clinicopathological information, including patient identity, disease stage, and survival outcomes. For subsequent clinicopathological and prognostic analyses, CRC samples were dichotomized into high- and low-UCHL1 expression groups using the median IHC score of the 80 paired samples as the cutoff (IHC score > 3 as high expression).

2.9. Statistical Analysis

Data analysis and visualization were performed using R software (version 4.0.3) and GraphPad Prism 8.0 (Dotmatics, San Diego, USA). For comparisons between the two groups, paired t-tests, unpaired t-tests, one-way ANOVA, or Wilcoxon rank-sum tests were applied depending on data distribution and experimental design. For parametric comparisons using t-tests, data are expressed as mean ± standard deviation (SD). For non-parametric comparisons using Wilcoxon rank-sum tests, data are expressed as medians with interquartile ranges. Associations between UCHL1 expression and clinicopathological features were evaluated using Fisher’s exact test or the chi-squared test, as appropriate. Spearman’s rank or Pearson’s correlation analysis was conducted to examine the relationship between UCHL1 expression and immune cell infiltration in CRC using TCGA data (n = 620). p < 0.05 was considered statistically significant.

3. Results

3.1. Expression and Association of UCHL1 with Clinicopathological Variables in CRC Patients

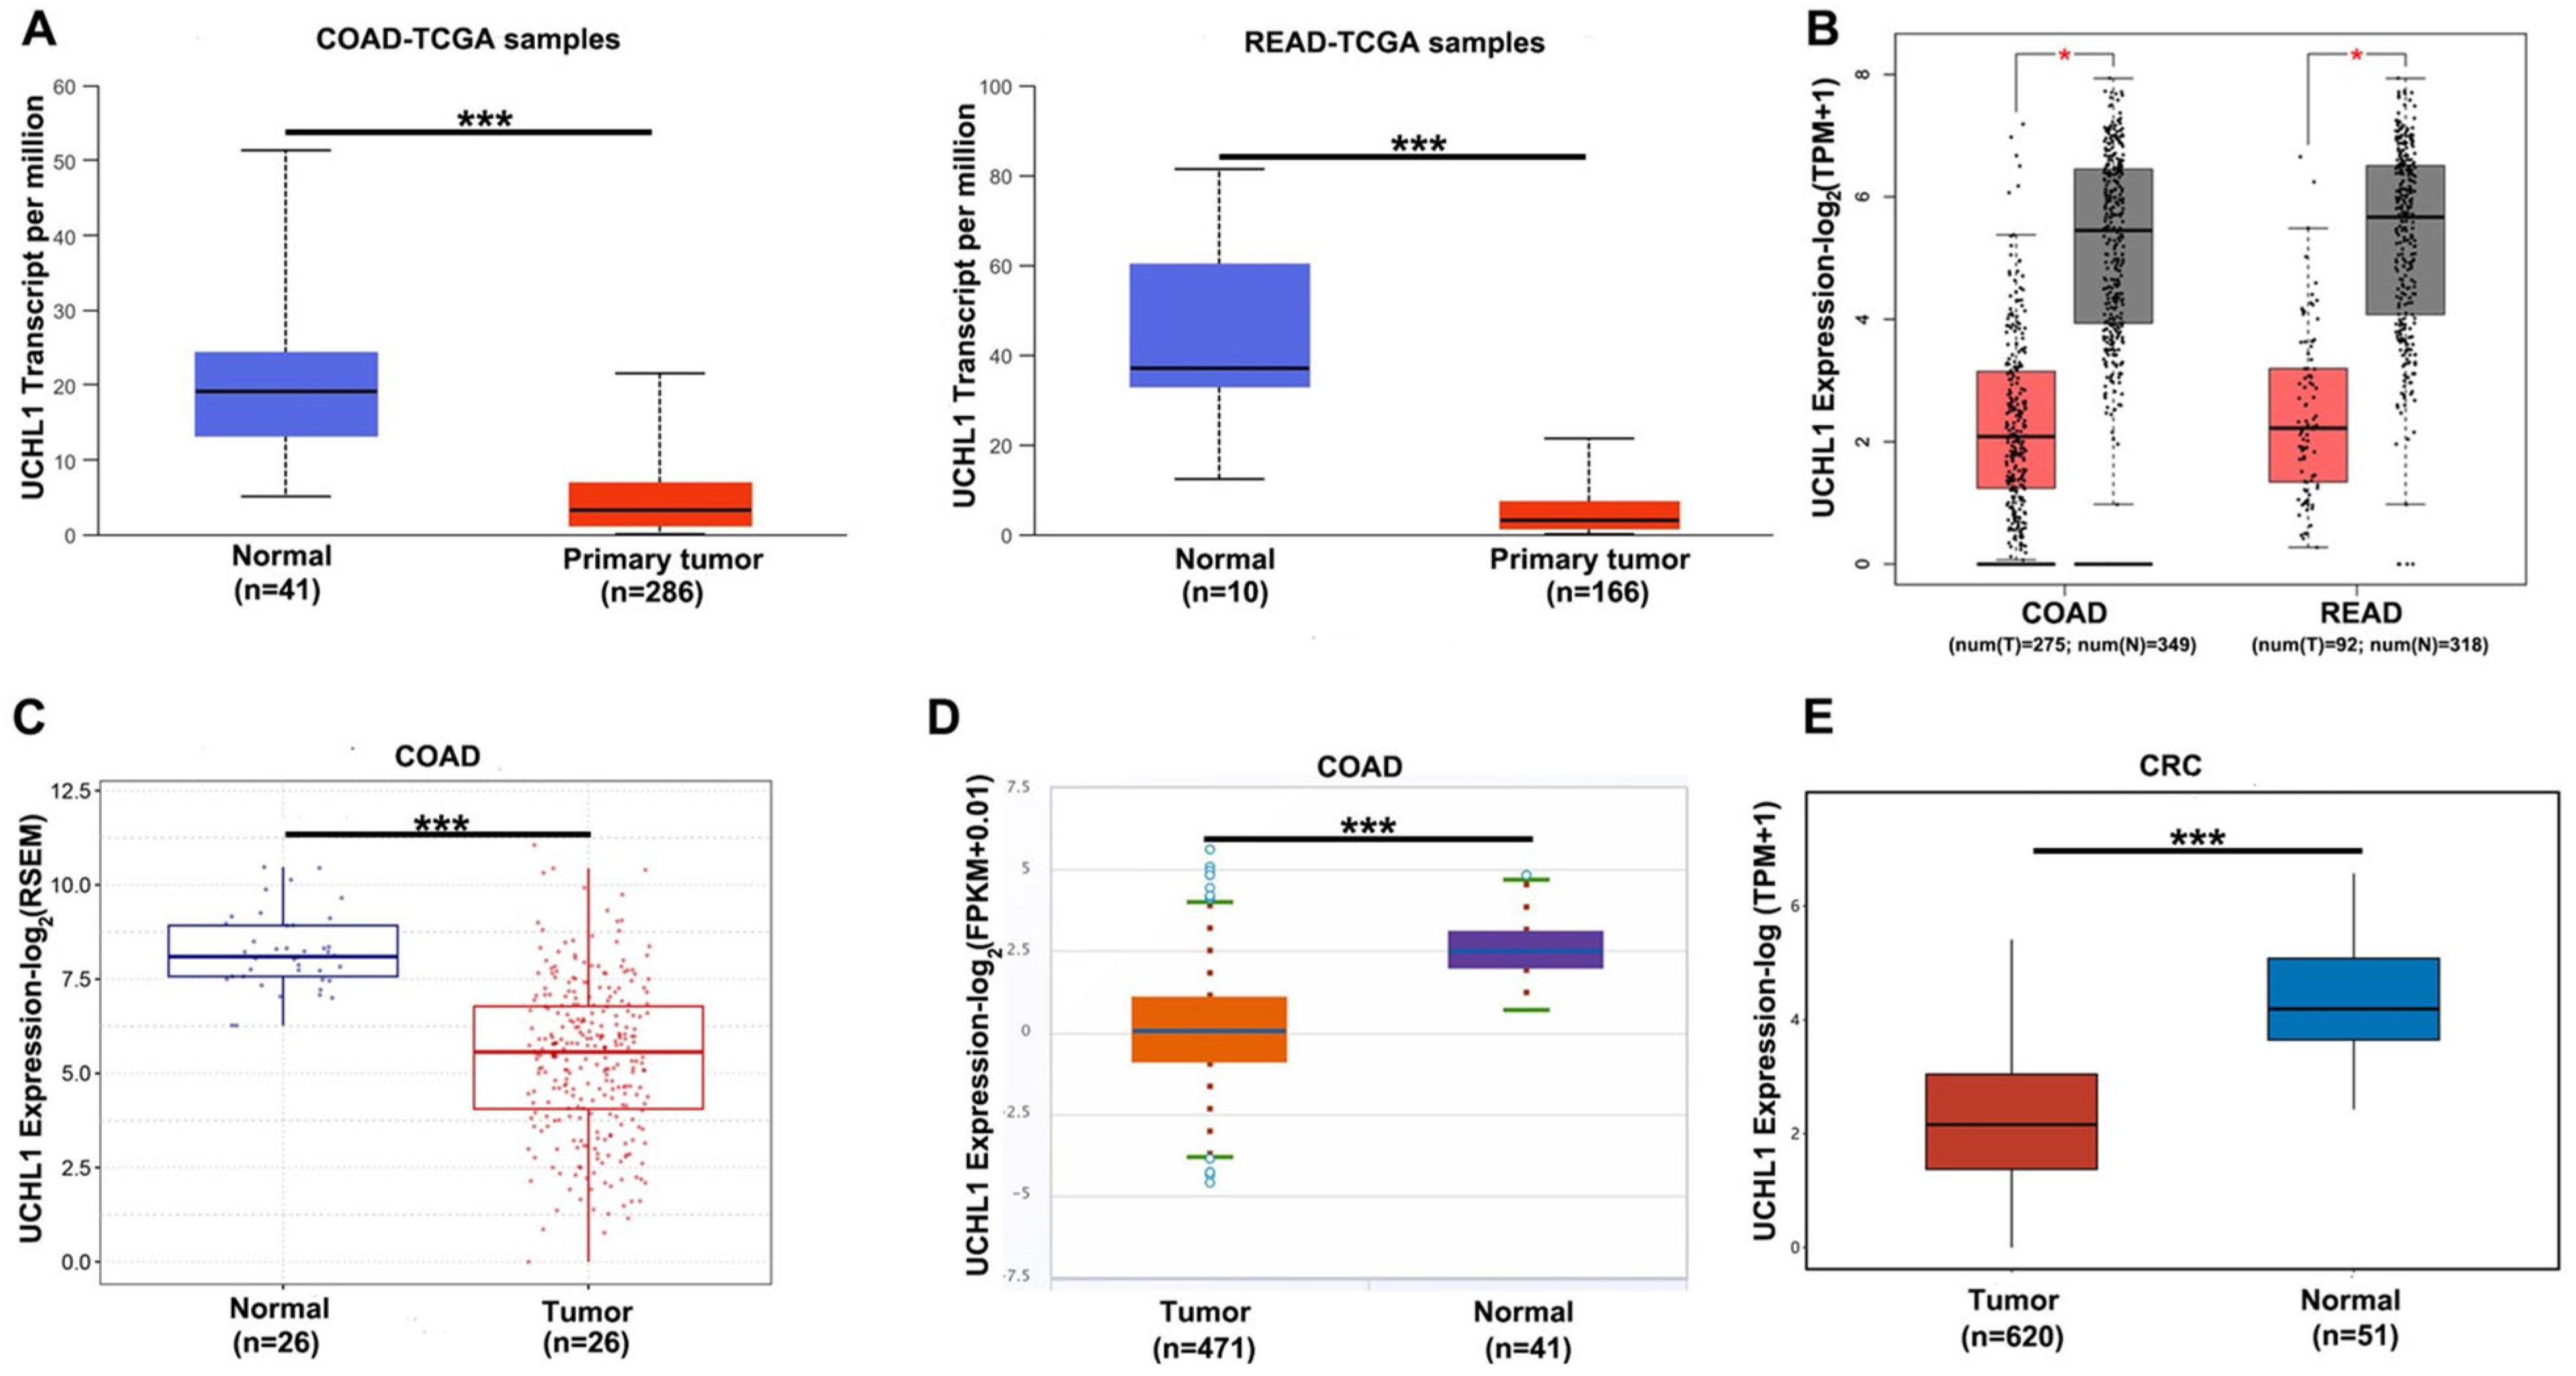
To investigate the expression of UCHL1 in colorectal cancer (CRC) tissue samples, we utilized multiple database visualization platforms, including UALCAN, GEPIA2, GSCA, and ENCORI. The results showed that UCHL1 mRNA levels were lower in the CRC tissues than in normal tissues (Figure 1A–D). In addition, we downloaded STAR-counts data and corresponding clinical information for CRC from the TCGA database to further analyze UCHL1 mRNA expression levels. As shown in Figure 1E, UCHL1 mRNA levels were significantly decreased in CRC tissues compared with normal tissues.
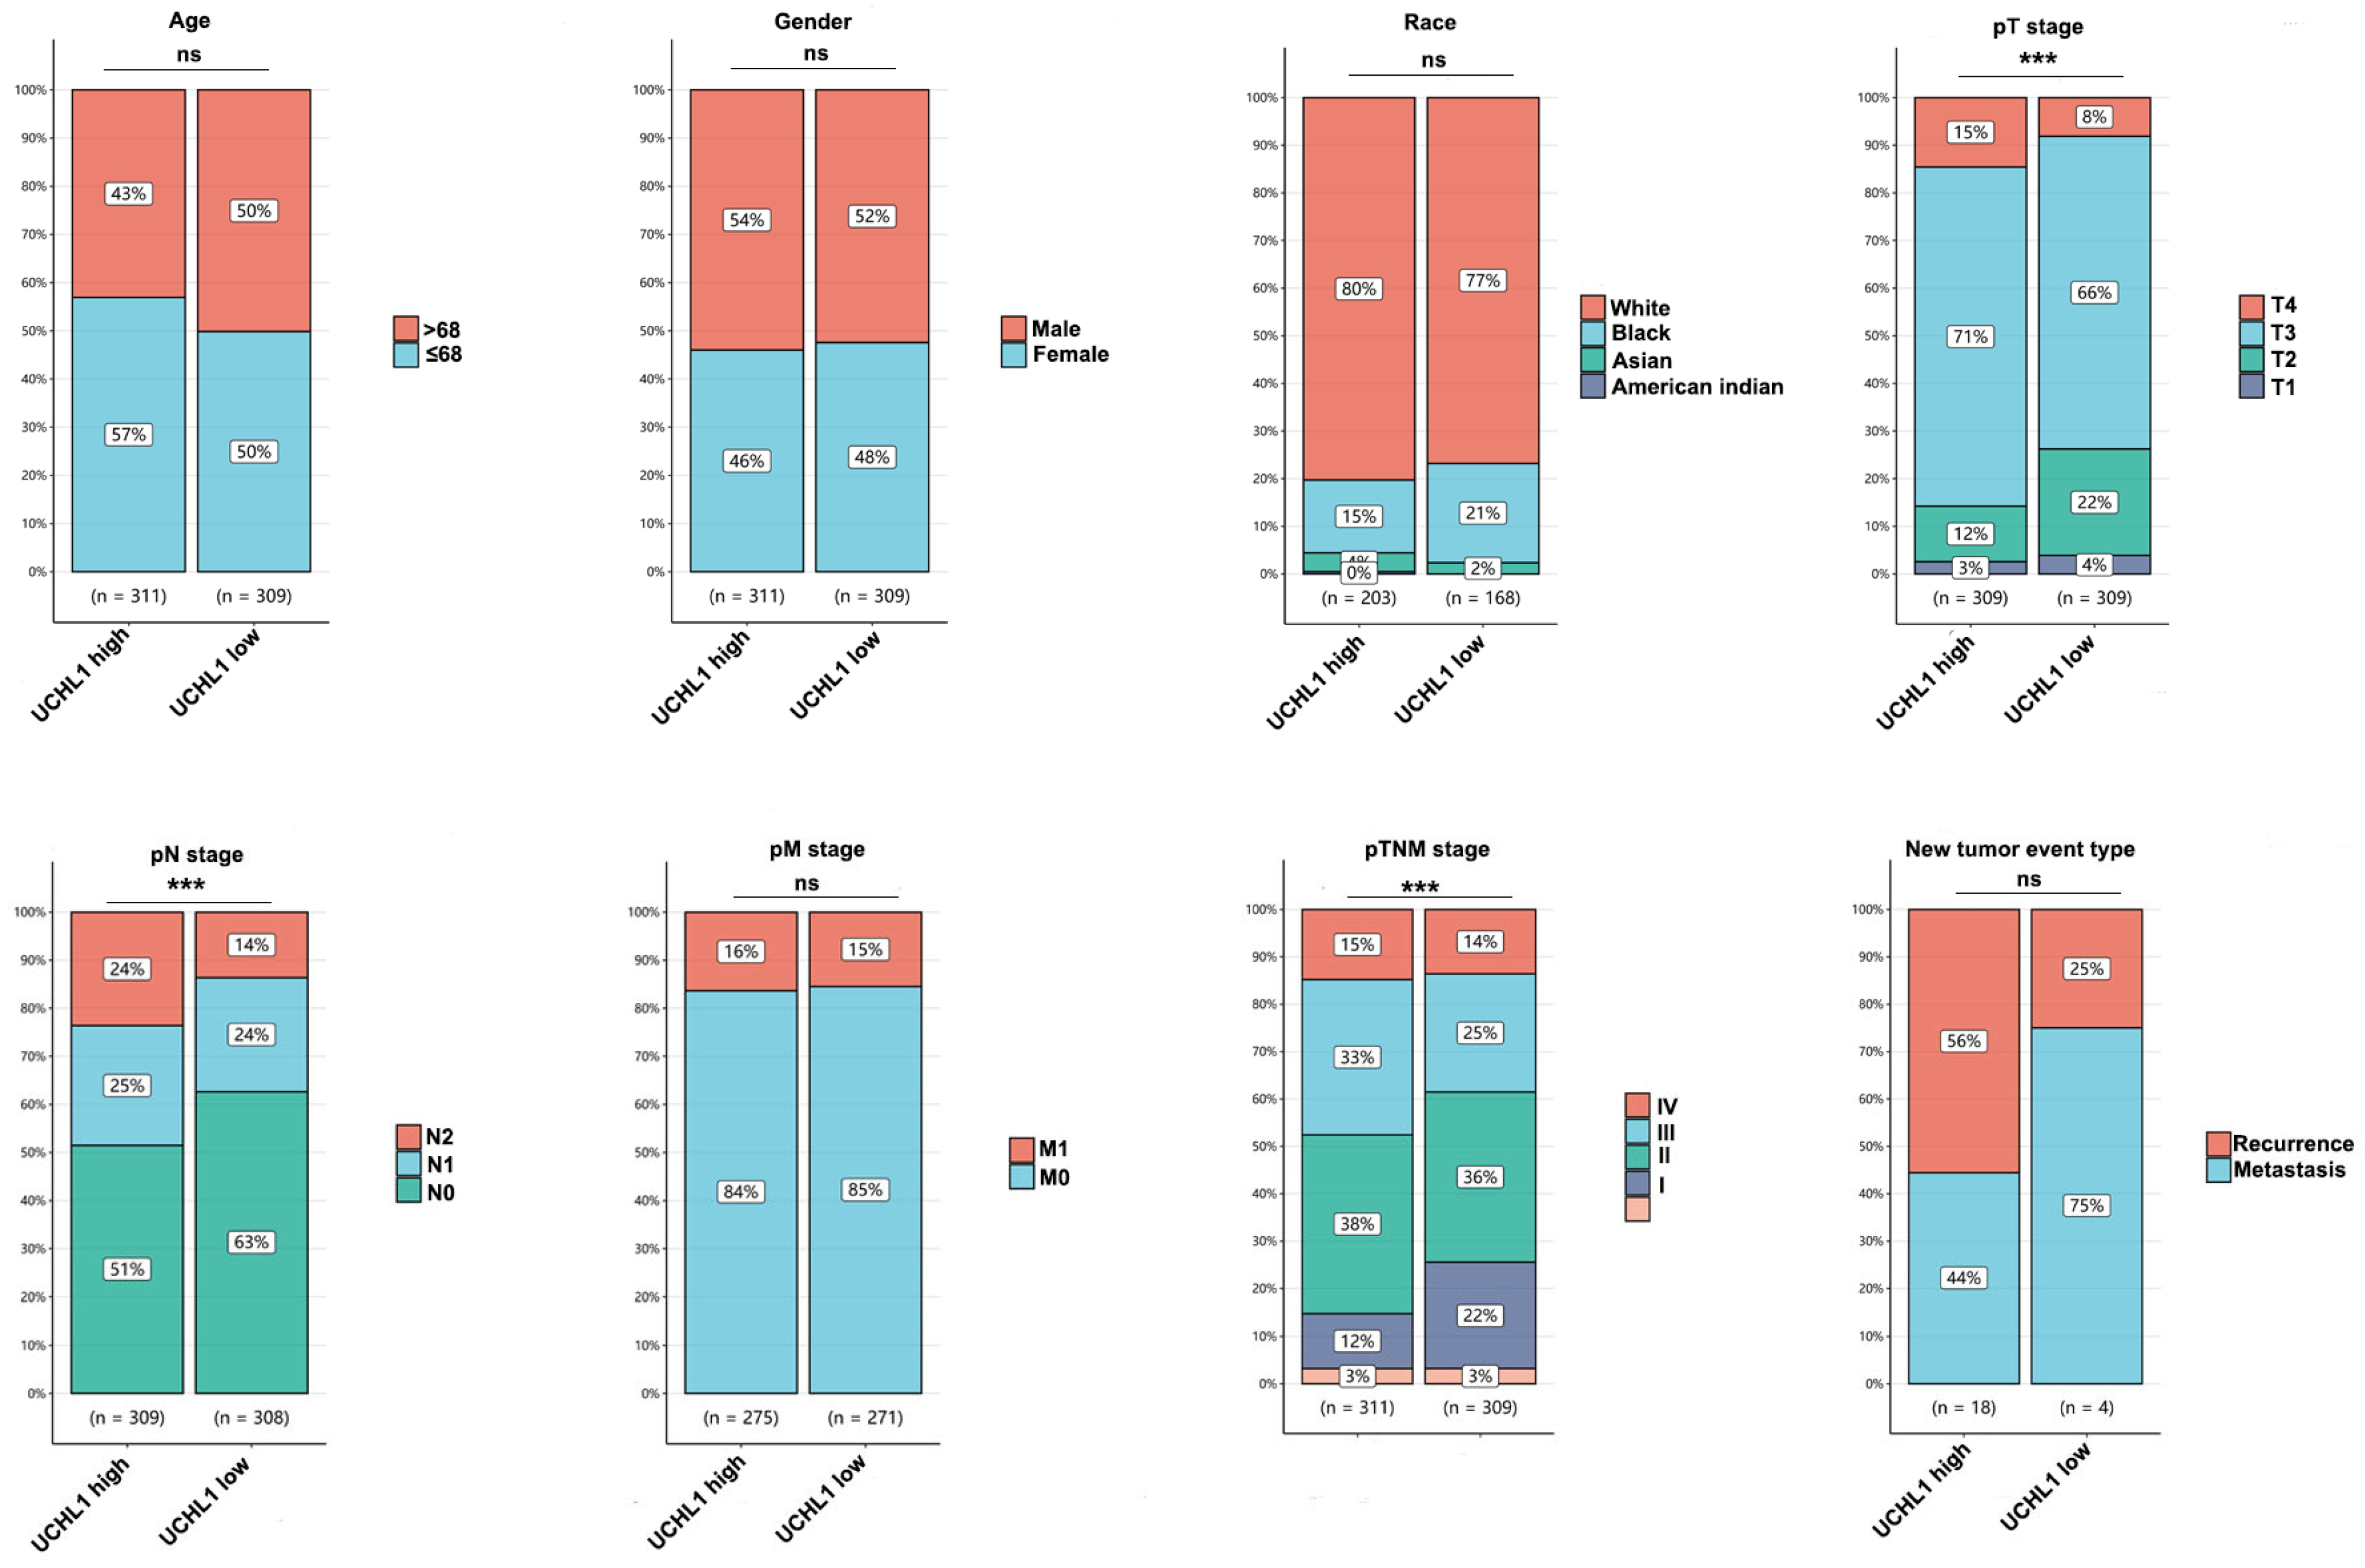
Subsequently, we analyzed UCHL1 expression in 620 CRC samples from the TCGA dataset. As shown in Figure 2, UCHL1 expression was significantly associated with T, N, and TNM stage. In contrast, no significant associations were observed with age, gender, race, M stage, or new tumor event type.

3.2. Prognostic Value of UCHL1 in CRC

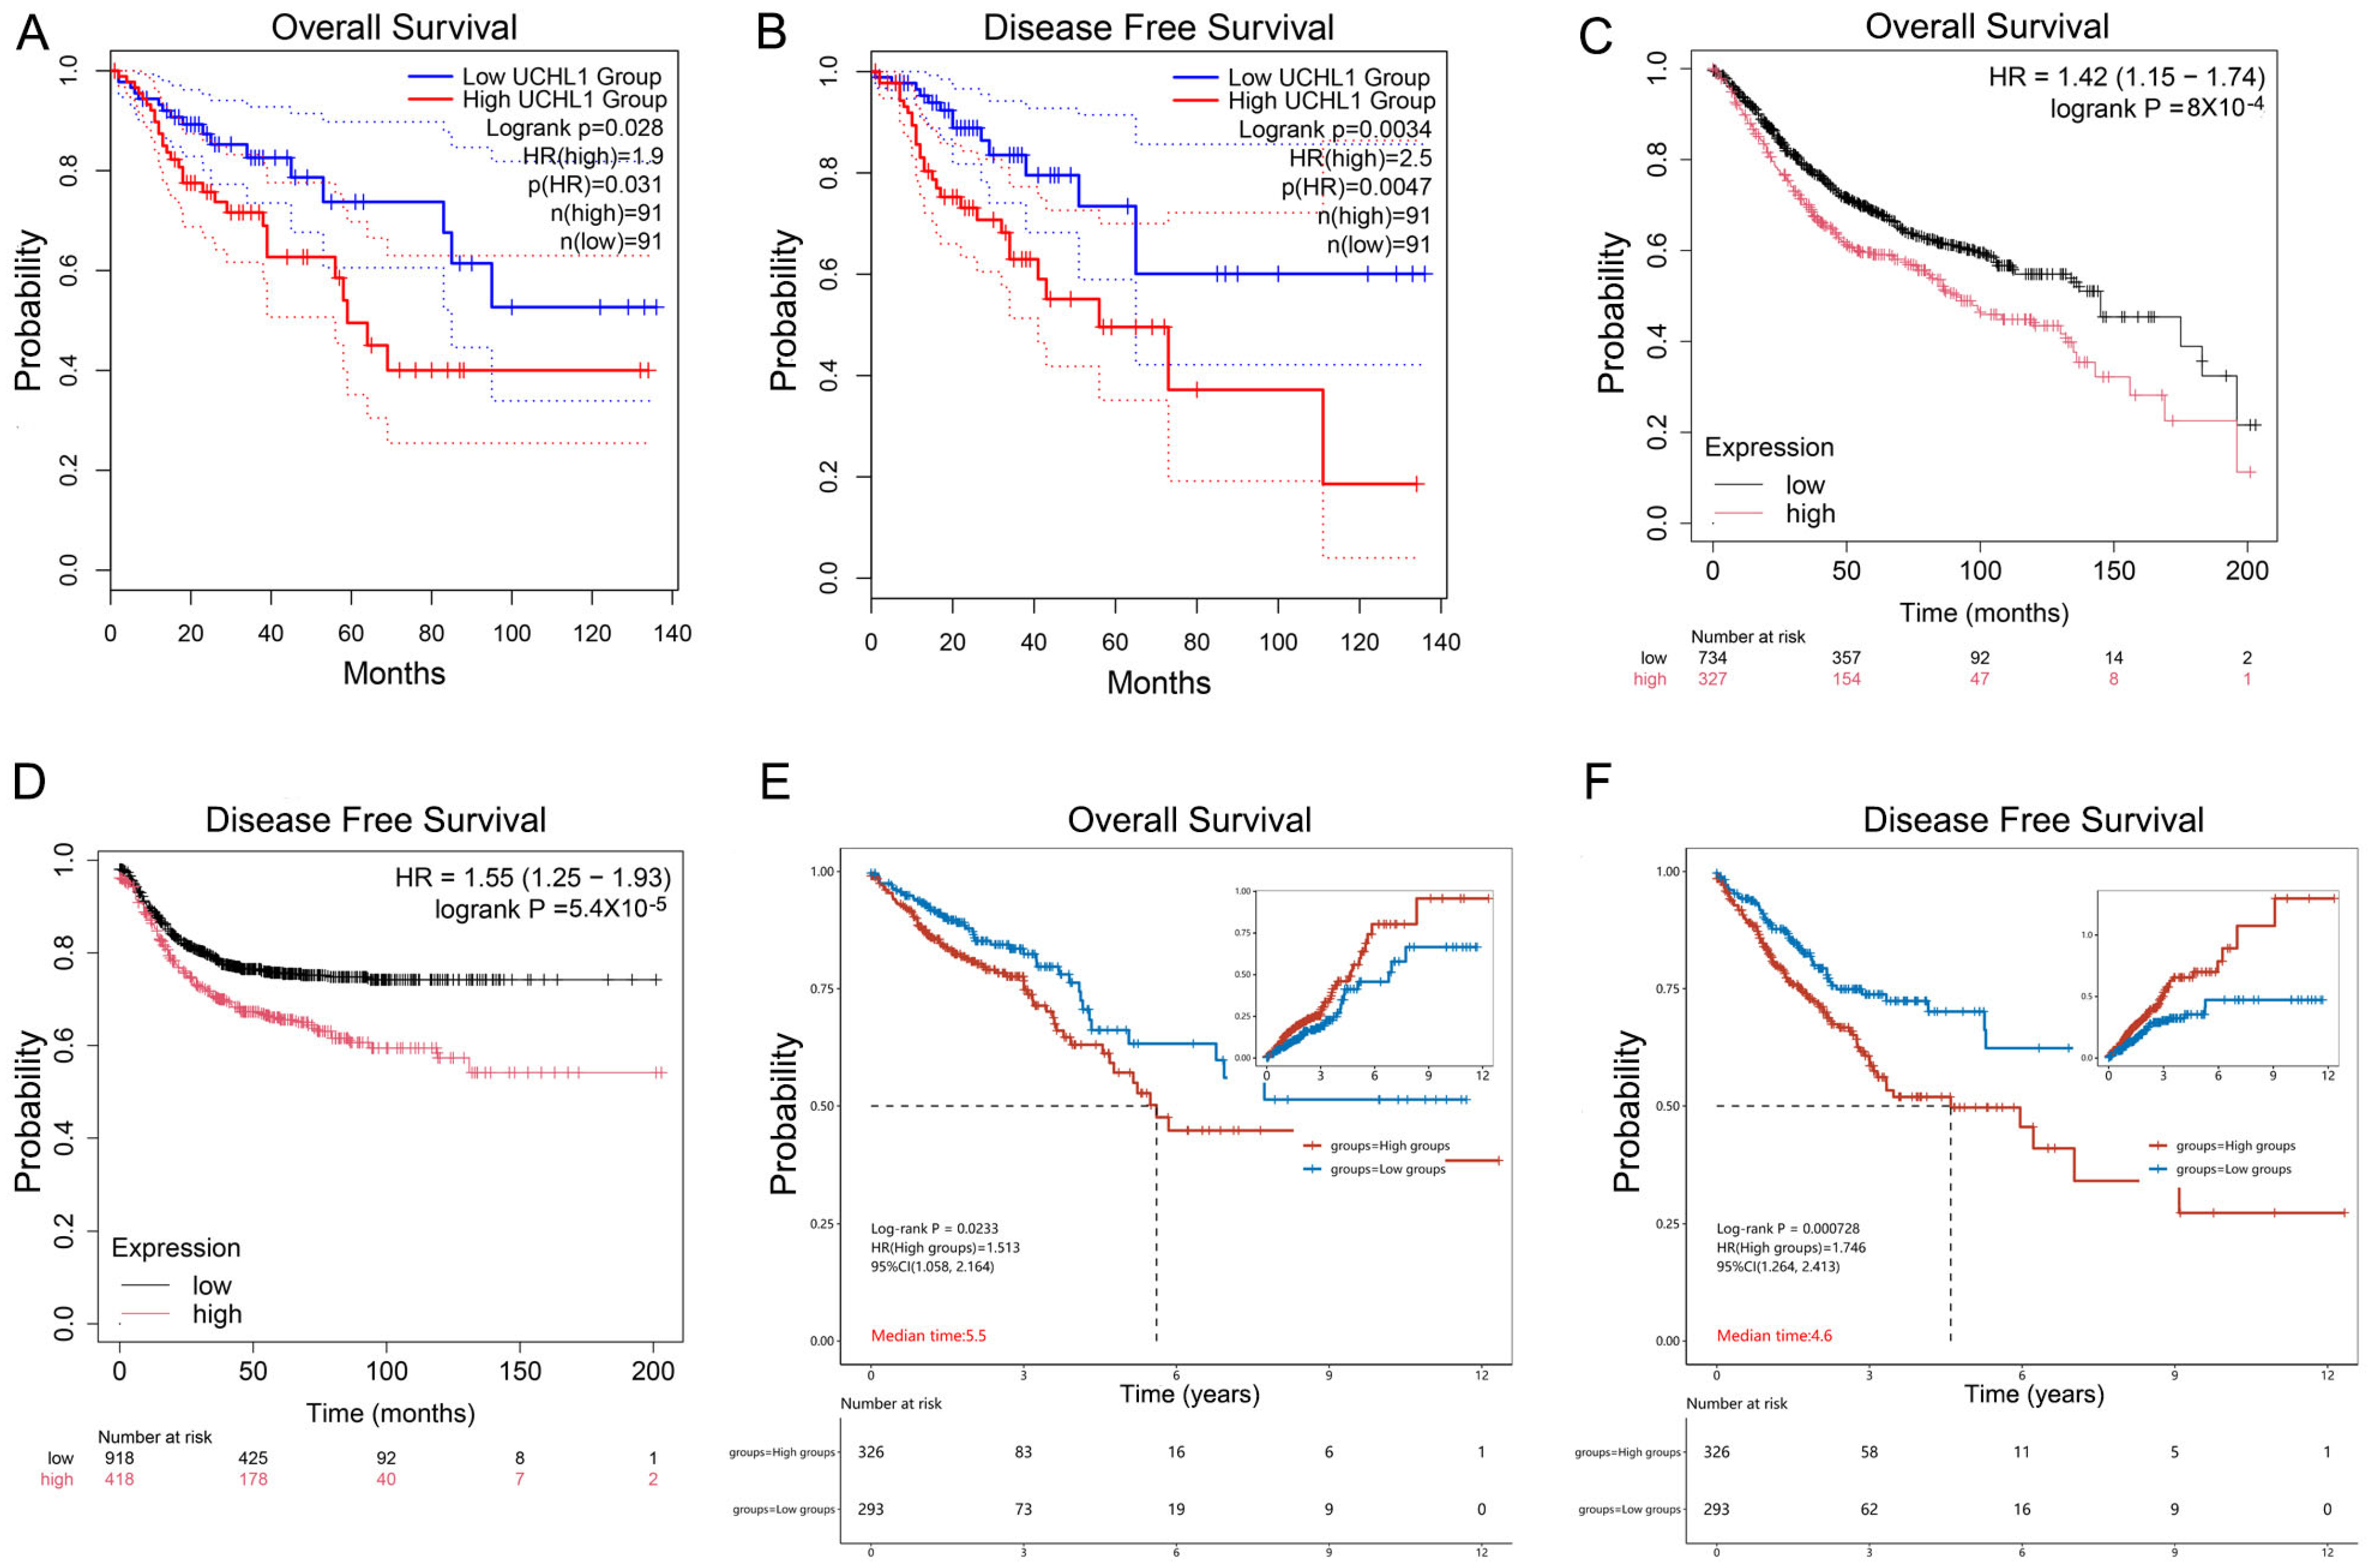
To investigate the prognostic value of UCHL1 in CRC, we utilized the GEPIA and Kaplan–Meier Plotter databases. As shown in Figure 3A–D, patients with high UCHL1 expression exhibited lower overall and disease-free survival than those with low UCHL1 expression. Furthermore, we validated these findings using the TCGA database, which also indicated that high UCHL1 expression was associated with a poor prognosis.

3.3. The Potential Biological Role of UCHL1 in CRC

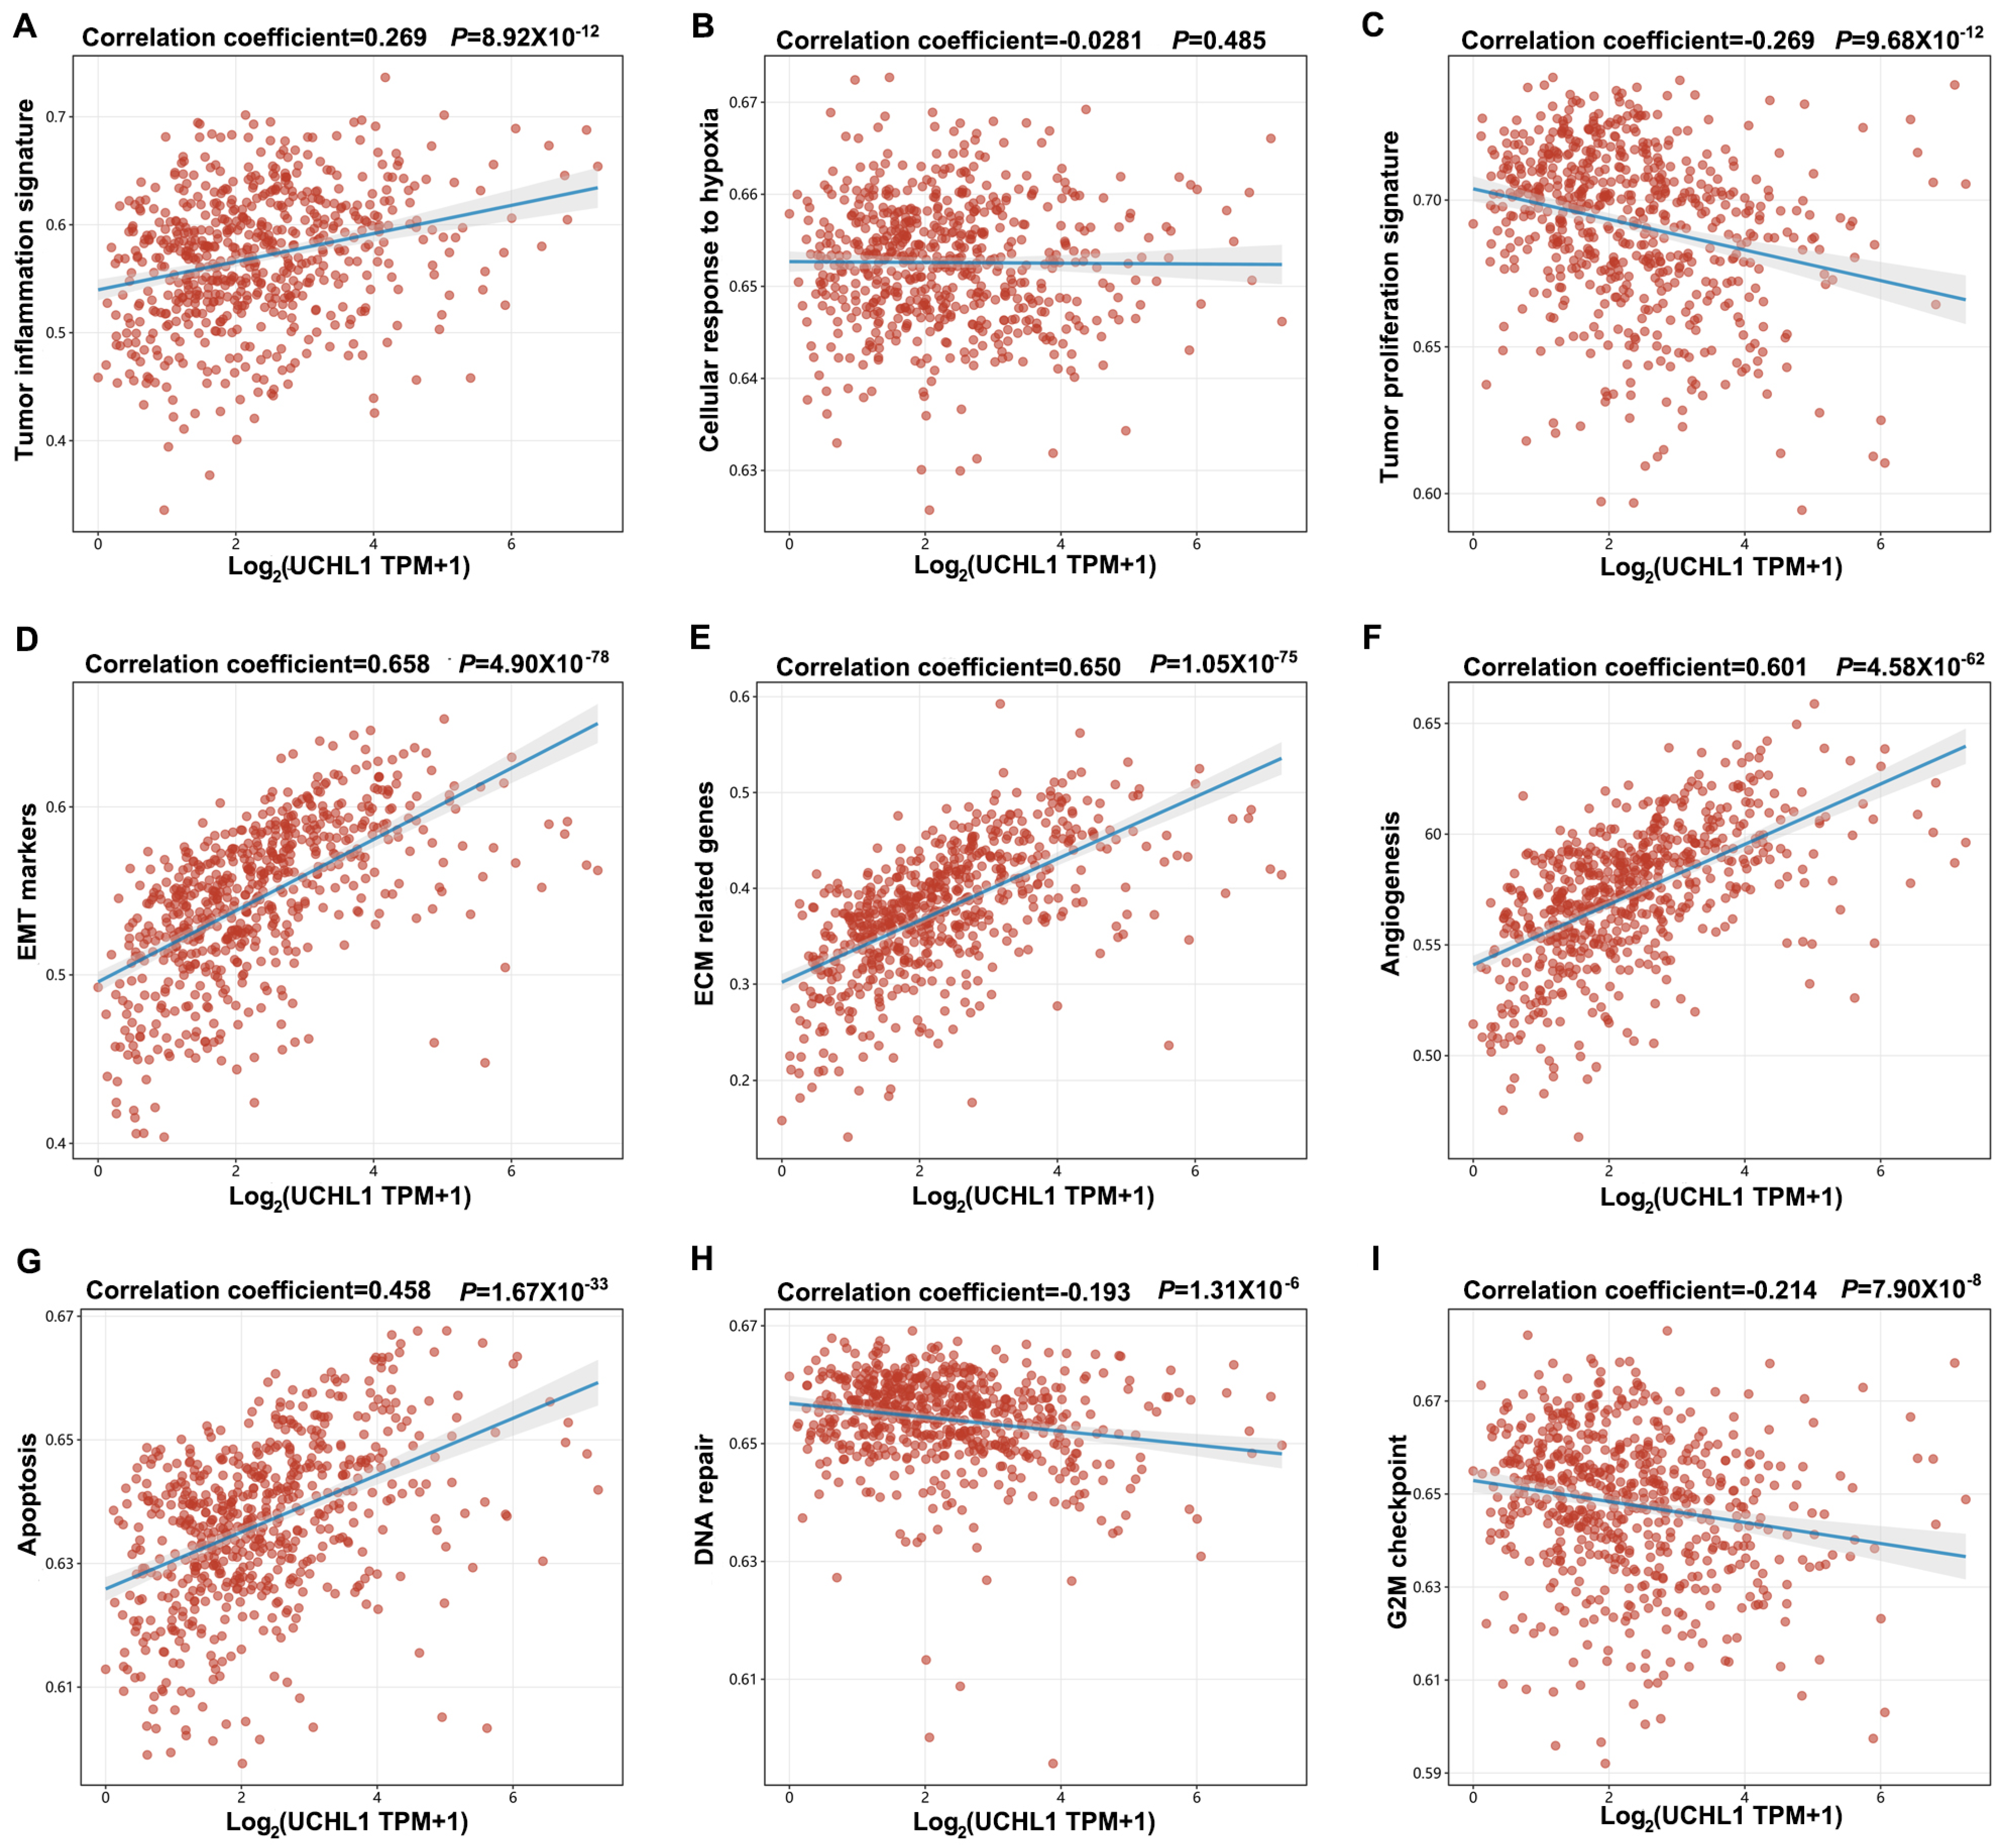
Using the ssGSEA algorithm, we calculated the enrichment scores of predefined pathways for each sample to explore the relationship between samples and pathways. The resulting fractions served as an intuitive indicator of sample–pathway interactions. Our findings reveal that UCHL1 may be involved in several key biological processes in CRC, including tumor inflammation signature, tumor proliferation signature, epithelial–mesenchymal transition (EMT) markers, extracellular matrix (ECM)-related genes, angiogenesis, apoptosis, and G2M checkpoint regulation (Figure 4). Collectively, these results suggest that UCHL1 plays a multifaceted role in CRC, potentially contributing to tumor progression through the modulation of diverse oncogenic pathways.

3.4. The Association Between UCHL1 Expression and Infiltrating Immune Cells

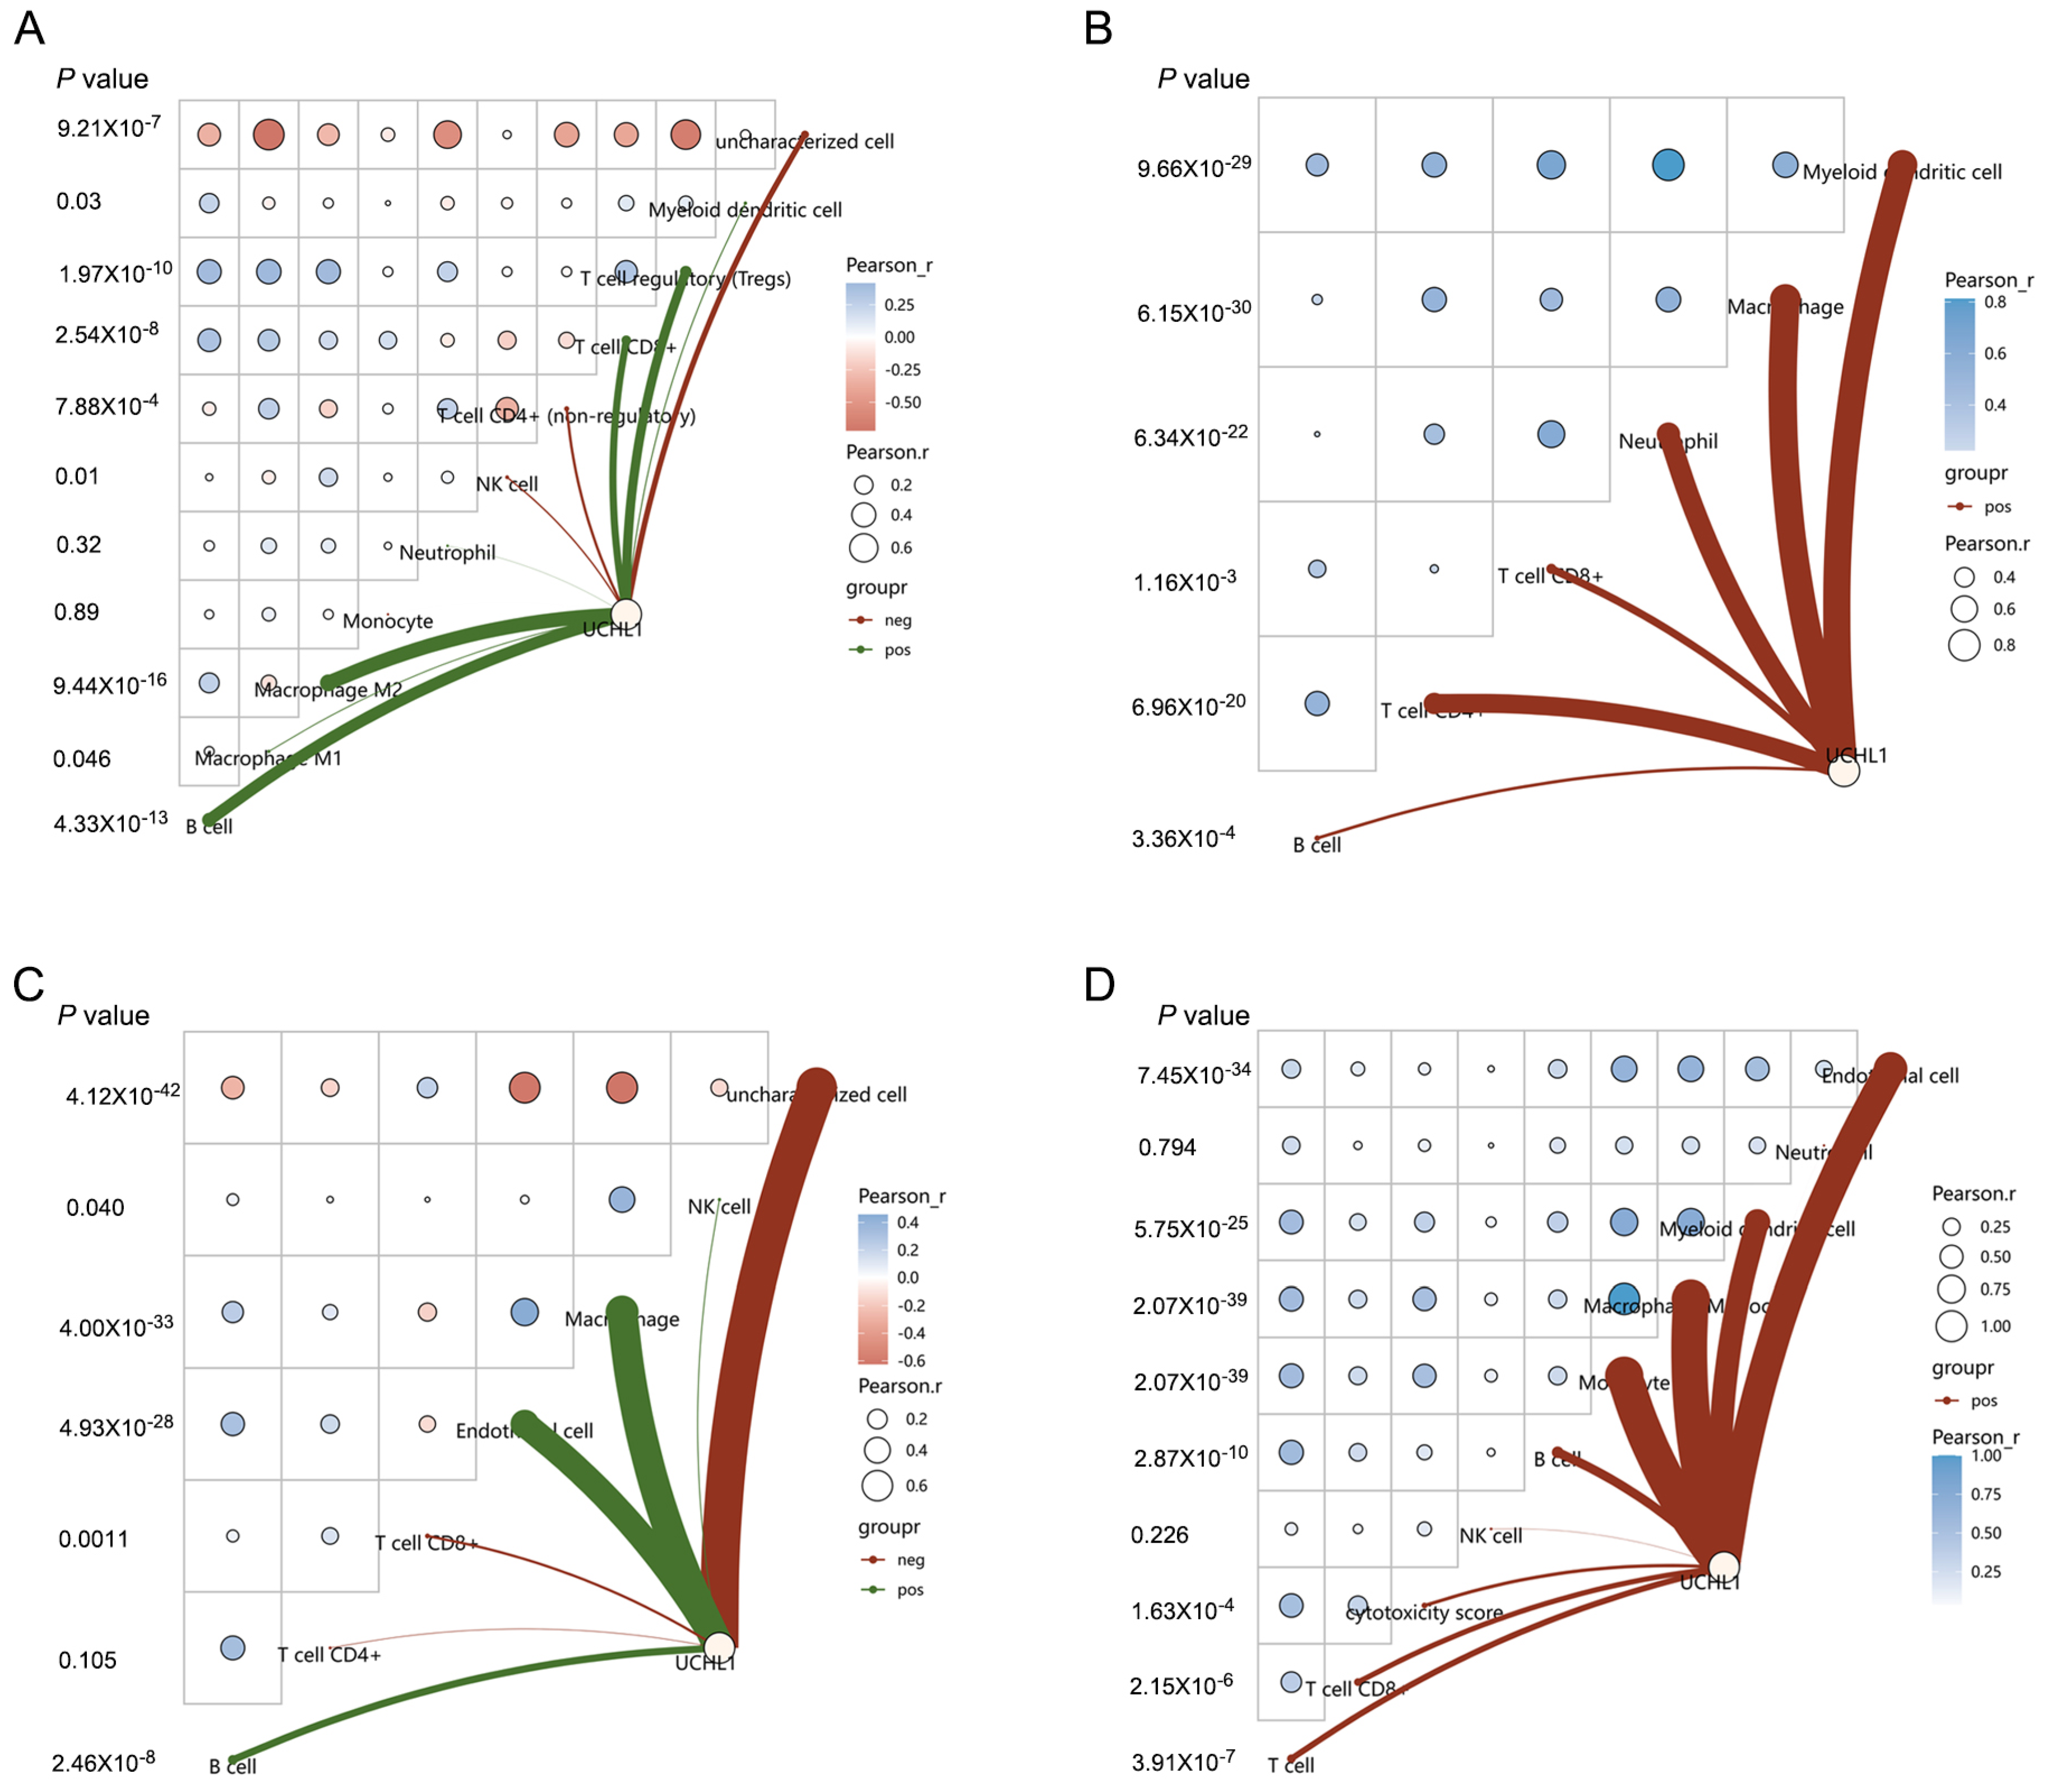
To explore the association between UCHL1 expression and immune cell infiltration in CRC, we conducted a correlation analysis using network diagrams and heatmaps to visualize the relationship between UCHL1 levels and immune scores. In these plots, color intensity and circle size were used to denote correlation strength, with red and green colors representing negative and positive correlations, respectively. Applying four distinct algorithms—QUANTISEQ, TIMER, EPIC, and MCPCOUNTER—we found that UCHL1 expression was positively correlated with infiltration of macrophages, CD4+ T cells, and CD8+ T cells (Figure 5). This positive correlation was subsequently confirmed by Spearman’s rank correlation analysis of TCGA CRC samples via the TIMER database. In agreement with these results, UCHL1 expression also exhibited positive associations with CD4+ T cells, CD8+ T cells, macrophages, neutrophils, and myeloid dendritic cells (Figure 6). Collectively, these correlative findings suggest that UCHL1 expression is associated with the abundance of certain immune cell populations as estimated by computational algorithms.

3.5. Relationship Between UCHL1 Expression and Immune Checkpoint Gene Expression

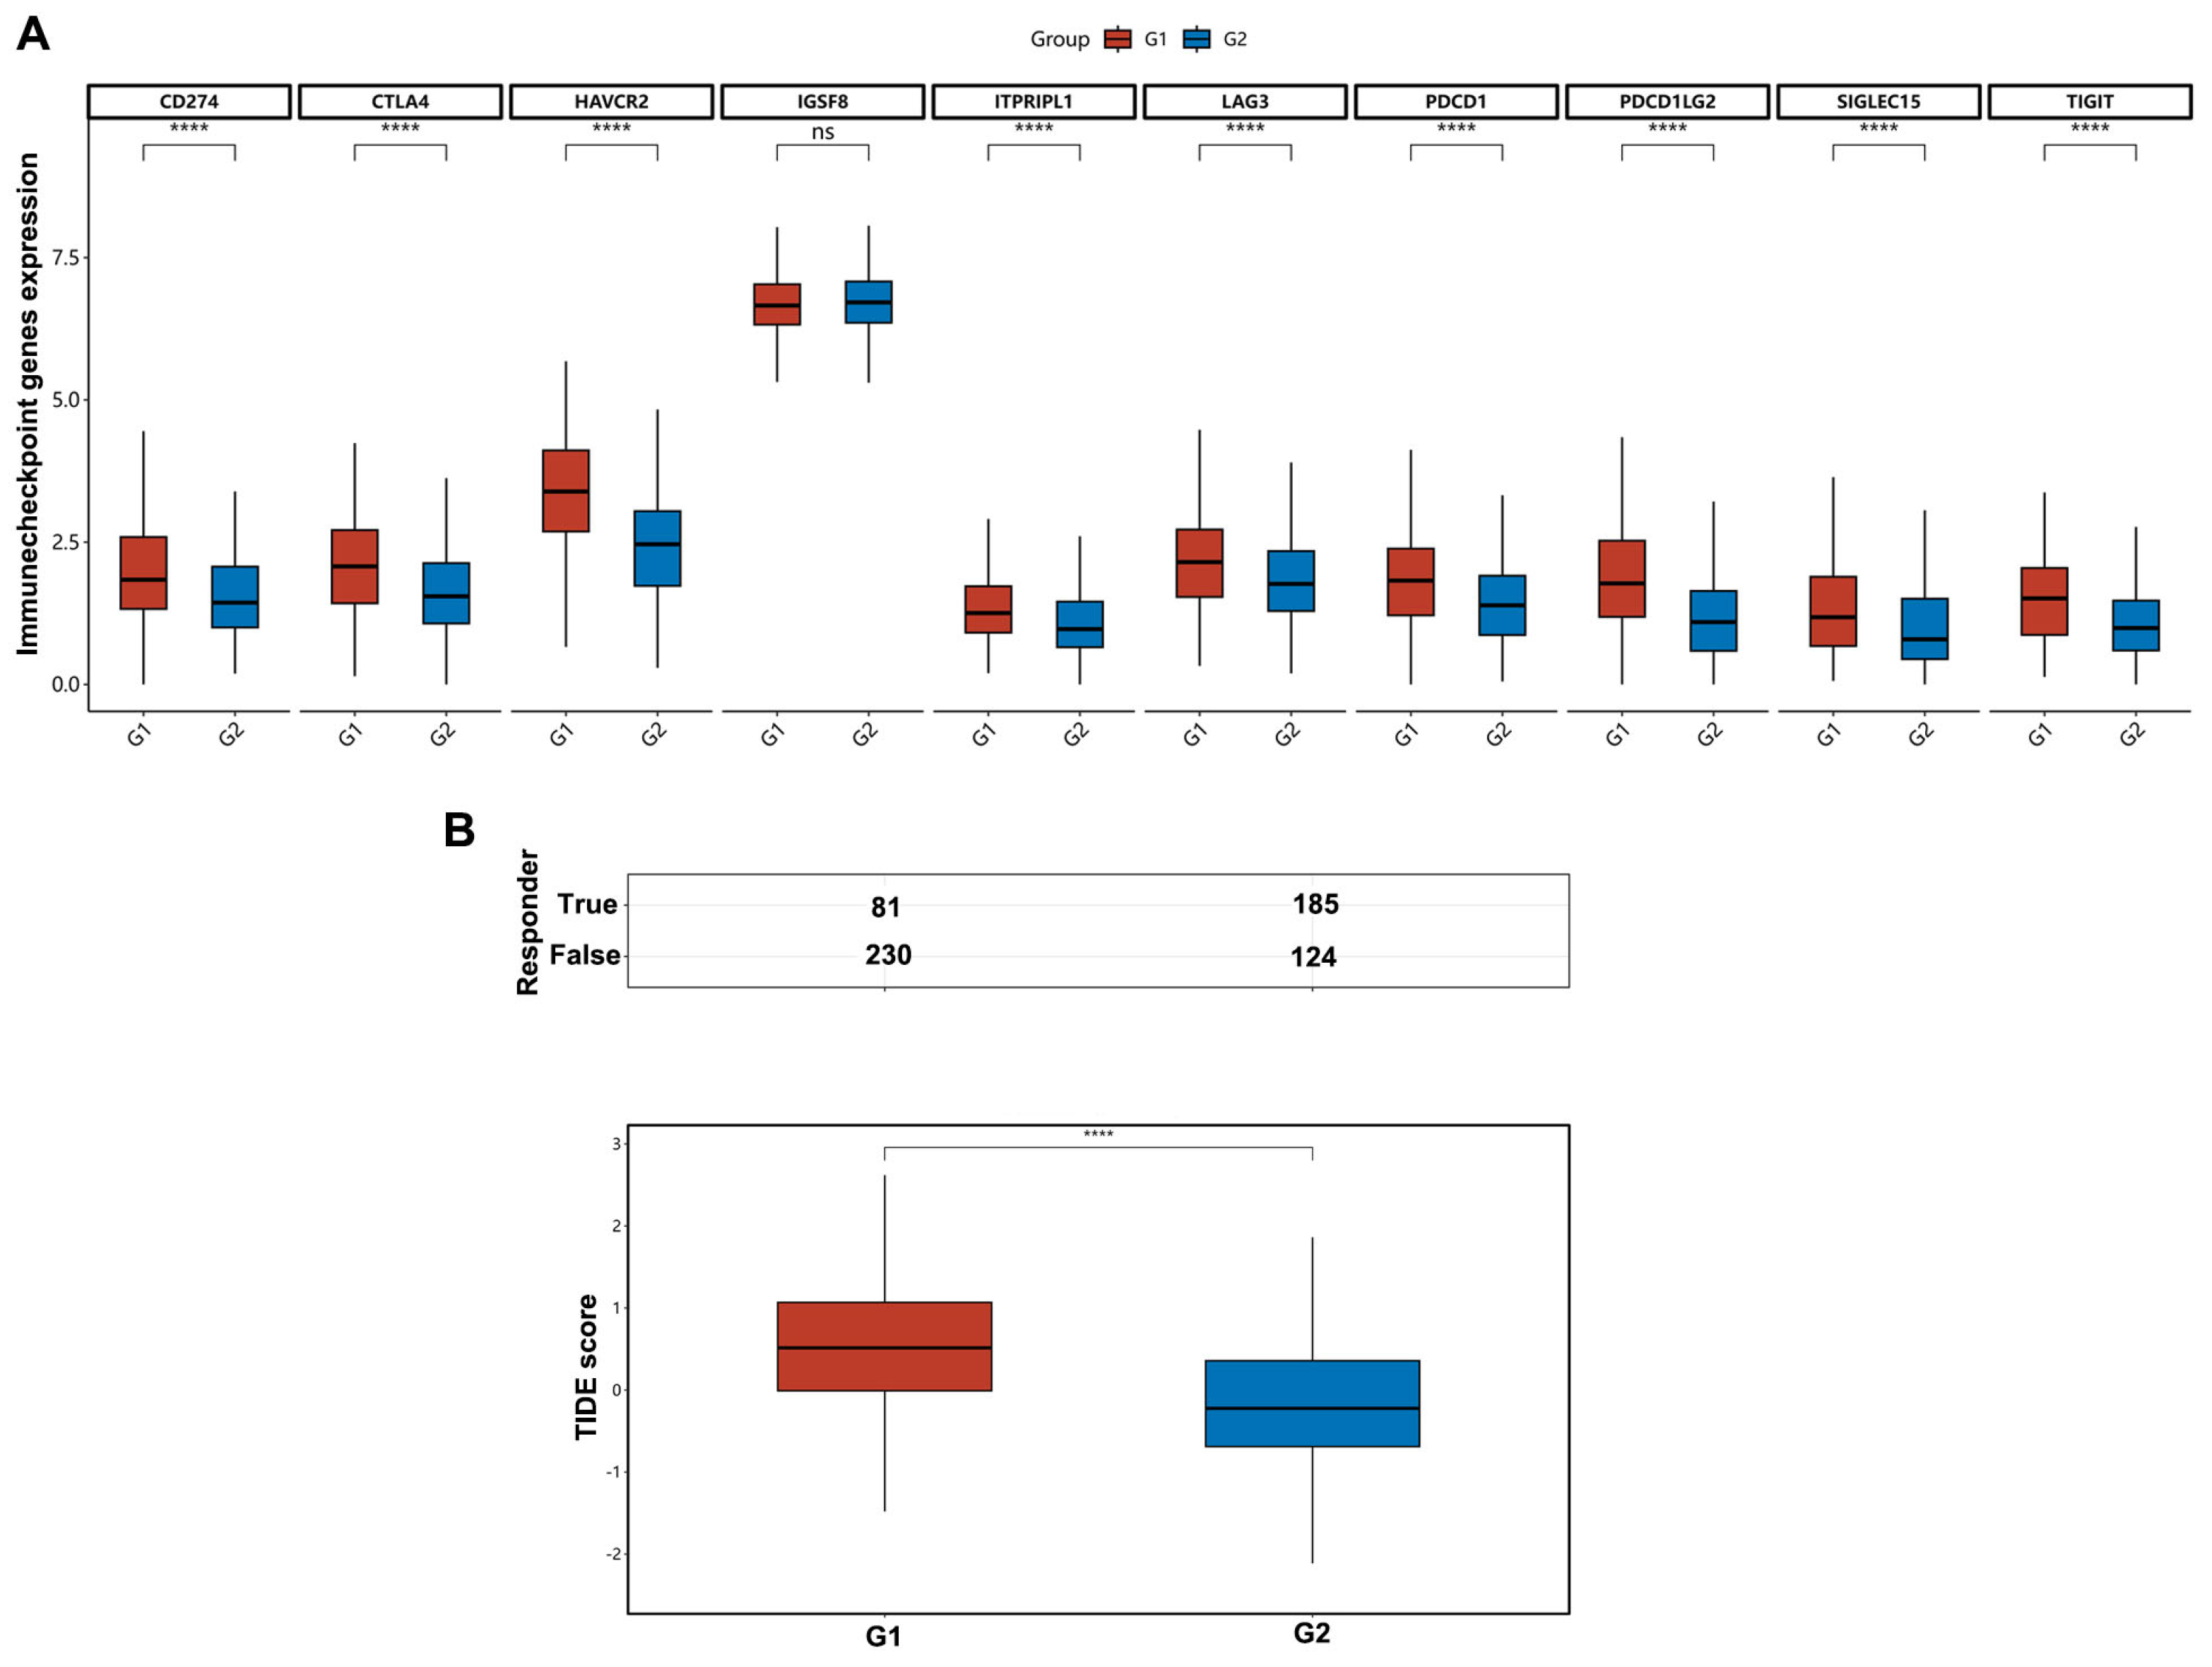
Given the established involvement of UCHL1 in immunity (Figure 5 and Figure 6), we next investigated its potential association with immune checkpoint genes in CRC. The relationship between UCHL1 expression and immune checkpoint genes was examined in CRC tissues. As depicted in Figure 7A, the expression levels of several immune checkpoint genes, including CD274, CTLA4, HAVCR2, ITPRIPL1, LAG3, PDCD1, PDCD1LG2, SIGLEC15, and TIGIT, were markedly elevated in CRC tissues with high UCHL1 expression relative to those with low UCHL1 expression, whereas no significant difference was observed for IGSF8 between the two groups.
To further evaluate the potential clinical relevance of these findings, we employed the TIDE algorithm to predict the immunotherapy response based on UCHL1 expression levels. The results revealed that CRC patients with high UCHL1 expression exhibited significantly higher TIDE scores than those with low UCHL1 expression (Figure 7B).

3.6. Protein Expression and Association of UCHL1 with Clinicopathological Variables in CRC Patients

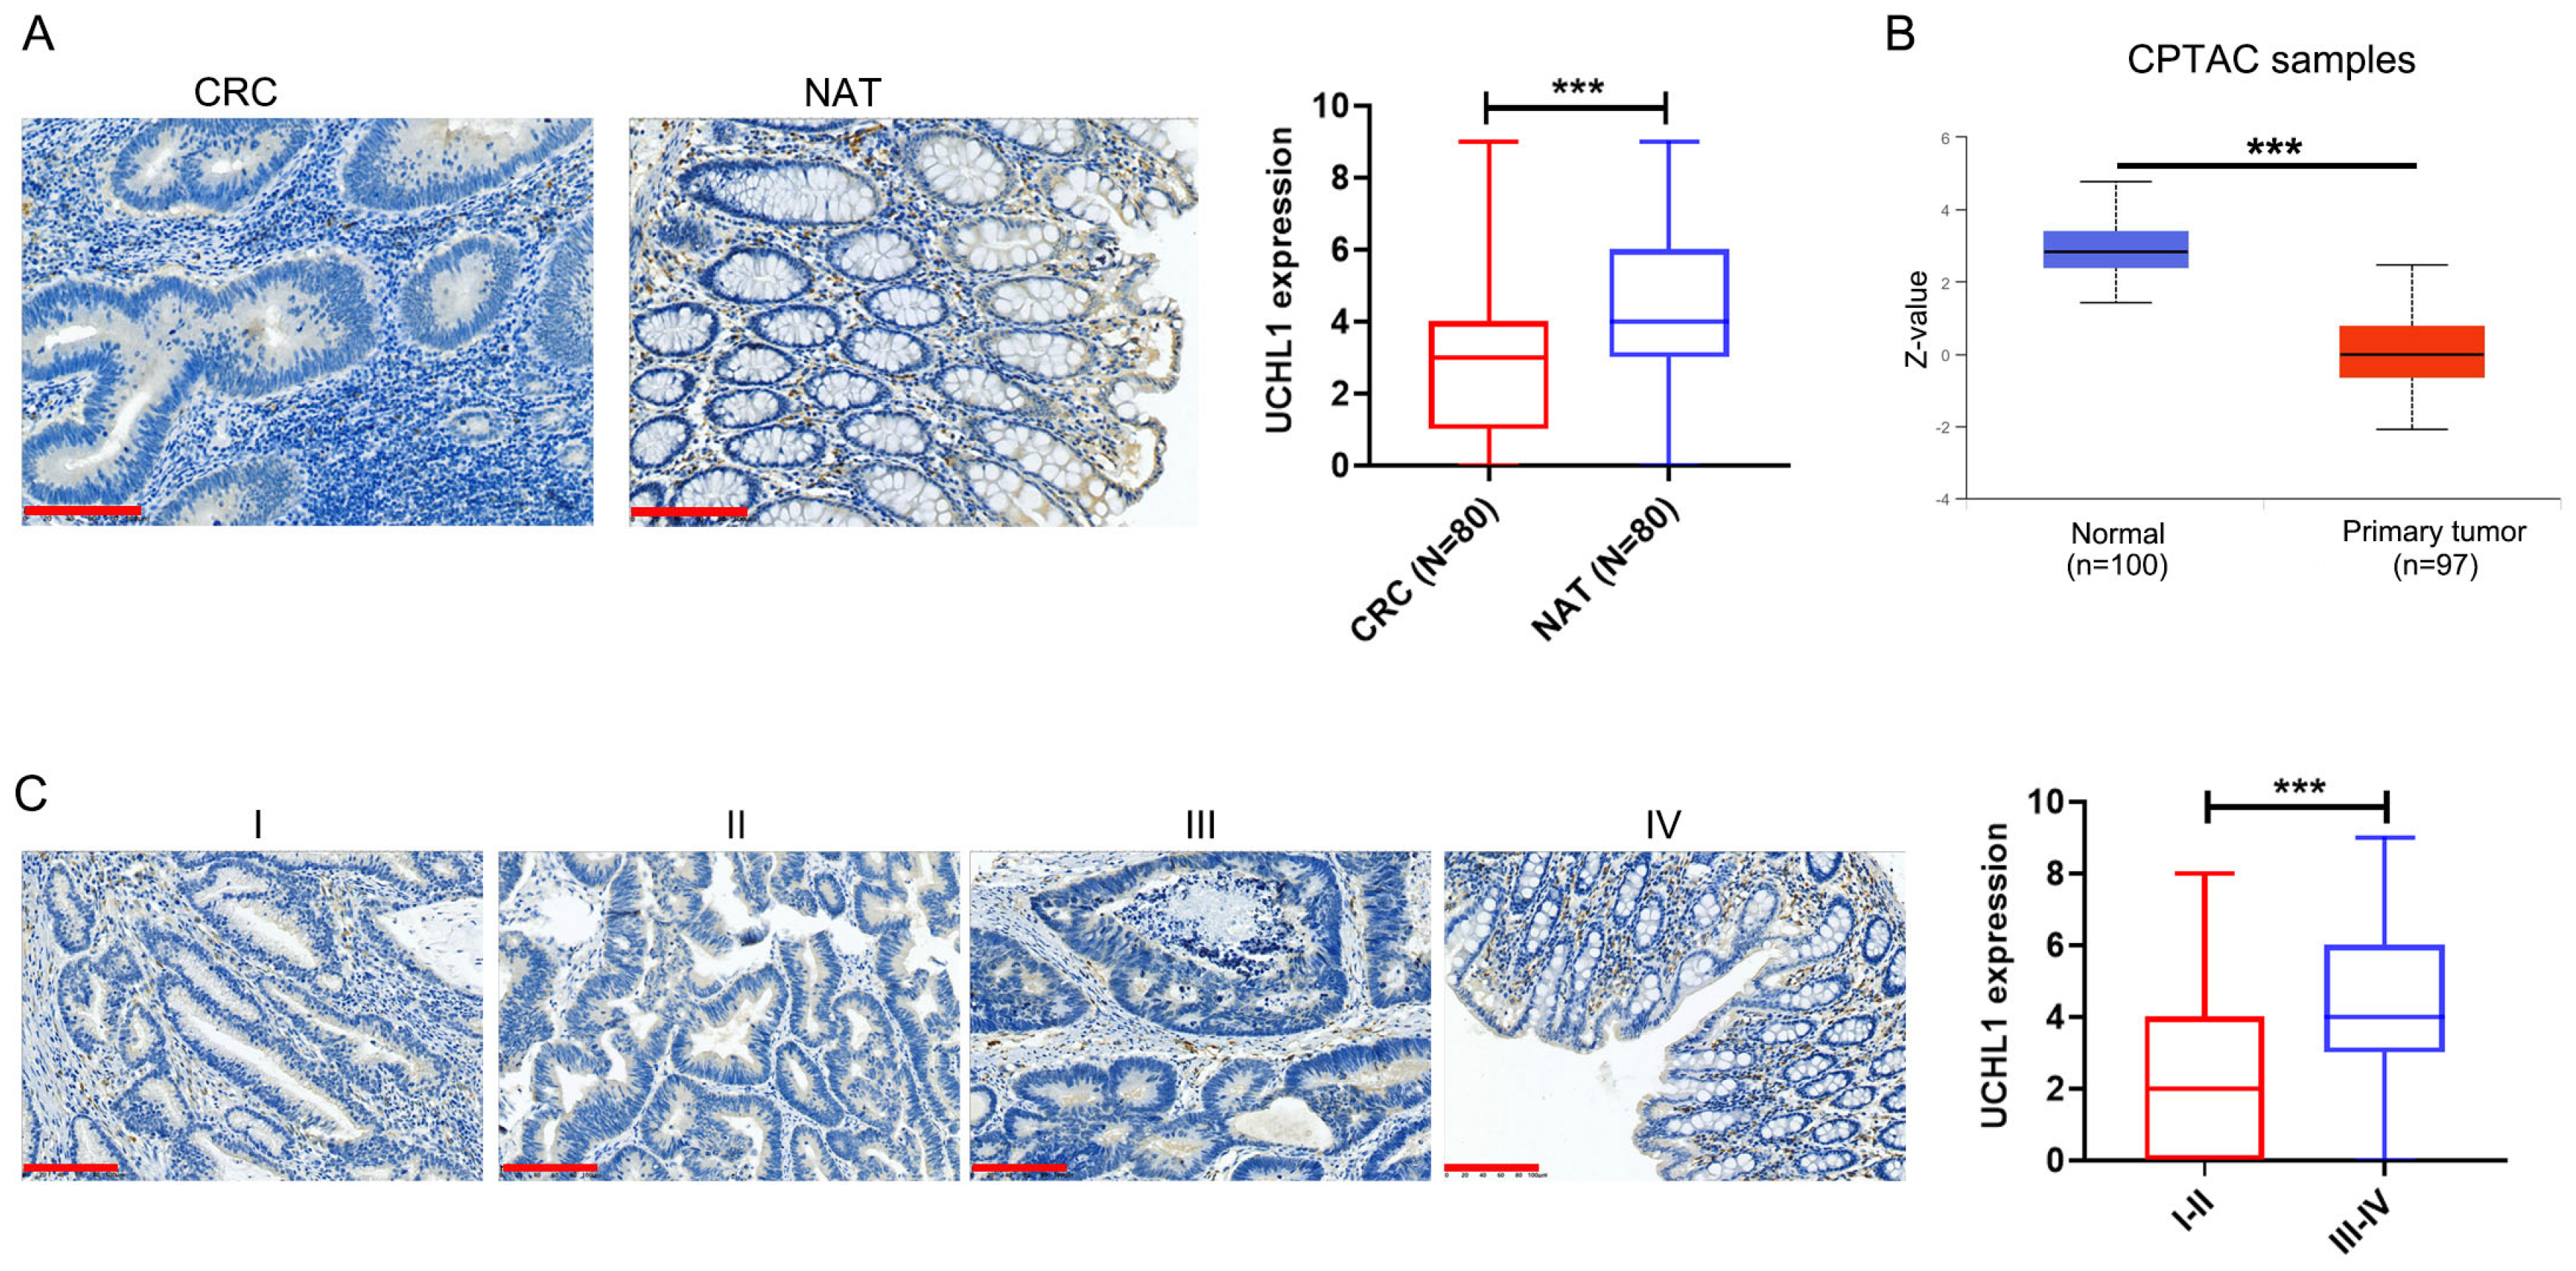
An IHC analysis was performed to evaluate UCHL1 protein expression in CRC tissues and paired adjacent normal tissues (NATs). The results revealed that UCHL1 expression levels were markedly lower in tumor tissues than in their normal counterparts (Figure 8A). This finding was consistent with data obtained from the CPTAC database (Figure 8B). Additionally, high UCHL1 expression (IHC score > 3) was positively correlated with the N and AJCC stages, whereas no significant association was observed between UCHL1 expression and gender, age, T and M stages, or patient death (Figure 8C, Table 1). Collectively, these findings suggest that reduced UCHL1 expression is a characteristic feature of CRC tissues, while elevated expression may be associated with more advanced disease stages in CRC.

4. Discussion

In this study, we comprehensively evaluated the expression, clinicopathological significance, prognostic value, and immunological role of UCHL1 in CRC through integrative bioinformatics analysis combined with immunohistochemical validation.
Research has demonstrated that UCHL1 expression exhibits tissue-specific patterns across malignancies. For example, in gastric cancer and cervical squamous cell carcinoma, UCHL1 is markedly upregulated in tumor tissues and associated with poor prognosis, supporting its oncogenic role [10,28]. In contrast, aberrant methylation of the UCHL1 gene has been detected in primary colon cancer samples, suggesting transcriptional silencing [13]. Consistent with this epigenetic observation, our results revealed that UCHL1 mRNA expression was significantly downregulated in CRC tissues across multiple independent databases, including UALCAN, GEPIA2, GSCA, and ENCORI, as well as in the TCGA cohort. This finding was further validated at the protein level by immunohistochemistry on a tissue microarray, confirming lower UCHL1 expression in tumor tissues relative to adjacent normal tissues.
Notably, despite its reduced expression in tumors, high UCHL1 expression was significantly associated with advanced T, N, and TNM stage, as well as with poorer overall survival and disease-free survival in the TCGA and public database analyses. This paradoxical pattern of downregulation in tumor tissues yet correlation with aggressive features has been observed in other malignancies such as ovarian cancer and nasopharyngeal carcinoma, where UCHL1 functions as a tumor suppressor [11,29]. In contrast, UCHL1 promotes tumorigenesis in neuroendocrine carcinomas, triple-negative breast cancer, and gastric cancer [8,9,10], further highlighting its context-dependent role.
To further reconcile this apparent paradox, we performed additional analyses of UCHL1 promoter methylation using the UALCAN dataset (Figure S1). Our results revealed that the UCHL1 promoter was hypermethylated in CRC tissues, consistent with previous reports demonstrating that UCHL1 silencing in CRC is primarily driven by CpG island methylation [30,31]. This methylation-expression pattern may partially explain our observation that UCHL1 is globally silenced in the bulk tumor population, yet elevated expression in a subset of aggressive cases correlates with poor prognosis. We speculate that while promoter hypermethylation silences UCHL1 in the majority of tumor cells, selective demethylation, clonal expansion of UCHL1-positive aggressive subclones, or epigenetic reprogramming during tumor progression may occur [30]. Additionally, post-transcriptional and post-translational regulatory mechanisms may further uncouple mRNA levels from protein function in advanced stages. For instance, lncRNA ZFAS1 promoted invasion of medullary thyroid carcinoma by enhancing EPAS1 expression via the miR-214-3p/UCHL1 axis [32]. Moreover, S-nitrosylation of the UCHL1 protein itself can modulate its enzymatic stability, deubiquitinating activity [33], and substrate specificity without this modification being reflected by total protein levels measured by IHC. However, as we emphasize throughout this discussion, these mechanistic interpretations remain speculative and are derived solely from correlative bioinformatic and epigenetic analyses.
UCHL1 has been reported to exert multifaceted functions through diverse molecular mechanisms across cancer types. In gastric cancer, reduced UCHL1 expression suppresses proliferation, migration, and invasion, with CIP2A identified as a downstream effector [10]. In triple-negative breast cancer, UCHL1 contributes to endocrine therapy insensitivity by deubiquitinating and stabilizing KLF5 [34]. These studies underscore the functional versatility of UCHL1 in modulating tumor behavior. Consistent with this diversity, our ssGSEA analysis revealed that UCHL1 expression was positively associated with multiple oncogenic processes in CRC, including tumor inflammation signature, tumor proliferation signature, EMT, ECM-related gene expression, angiogenesis, apoptosis, and G2M checkpoint regulation. These findings align with previous reports that UCHL1 promotes CRC progression via activation of the β-catenin/TCF pathway [12]. Collectively, our correlative results extend the functional repertoire of UCHL1 in CRC by implicating it in a broader spectrum of signaling networks beyond previously characterized mechanisms, suggesting that UCHL1 may coordinate multiple oncogenic pathways to drive tumor progression. However, we emphasize that these pathway associations are derived from ssGSEA correlations and do not establish causal relationships.
Given the critical role of the tumor immune microenvironment in CRC progression and therapy response, we investigated the relationship between UCHL1 expression and immune cell infiltration. Using multiple algorithms (QUANTISEQ, TIMER, EPIC, and MCPCOUNTER), we observed that UCHL1 expression was positively correlated with computationally estimated infiltration of macrophages, CD4+ T cells, and CD8+ T cells, a finding consistently validated by Spearman’s correlation analysis. Furthermore, elevated UCHL1 expression was associated with increased expression of multiple immune checkpoint genes, including CD274 (PD-L1), CTLA4, LAG3, and TIGIT, as well as with higher TIDE scores.
An apparent paradox emerges from our observations: UCHL1 expression positively correlates with CD8+ T cell infiltration, yet also with an immunosuppressive microenvironment and higher TIDE scores indicative of poor immunotherapy response. This seeming contradiction can be reconciled through the framework of T cell dysfunction. The quantity of tumor-infiltrating CD8+ T cells does not necessarily equate to their functional quality. In CRC, CD8+ T cells that have successfully infiltrated the tumor parenchyma frequently exhibit exhaustion—a state of progressive loss of effector function driven by persistent antigen stimulation and upregulation of inhibitory receptors (PD-1, CTLA-4, and LAG3) [35,36]. Indeed, the TIDE algorithm was specifically designed to model two principal mechanisms of tumor immune evasion, identifying tumors where high CD8+ T cell infiltration does not associate with survival benefits. Studies in BRAF V600E-mutant CRC have demonstrated that subtypes with higher CD8+ T cell infiltration can exhibit significantly higher T cell dysfunction scores [37].
Emerging evidence directly implicates UCHL1 in suppressing CD8+ T cell anti-tumor immunity through multiple mechanisms. In lung adenocarcinoma, UCHL1 deubiquitinates FHL2 to block ferroptosis and counteract CD8+ T cell-mediated tumor killing [38]. Additionally, UCHL1 has been shown to promote PD-L1 transcription via the Akt/NF-κB p65 axis [39]. These mechanistic insights align with our correlative observations that UCHL1 expression positively associates with immune checkpoint genes and higher TIDE scores. Collectively, these findings support a model in which UCHL1-high CRC tumors recruit CD8+ T cells but concurrently suppress their effector function through converging pathways, resulting in a dysfunctional immune microenvironment that fails to control tumor progression and resists immunotherapy.
Based on our correlative observations and emerging evidence from other cancer types—particularly in triple-negative breast cancer, where inhibition of UCHL1 enhances immunotherapy efficacy by stabilizing PD-L1 [40] and where UCHL1 acts as a transporter in the HDAC6/STAT3/PD-L1 pathway [41]—we propose a speculative hypothesis that UCHL1 may potentially contribute to an immunosuppressive microenvironment in CRC, possibly through mechanisms involving immune checkpoint modulation. However, we emphasize that this hypothesis is purely exploratory and derived entirely from bioinformatic correlations; it has not been experimentally validated in CRC and requires direct mechanistic investigation in future studies using CRC cell lines, animal models, and clinical cohorts.
Several important limitations must be acknowledged. First, all pathway enrichment, immune correlation, and TIDE-based predictions presented in this study are derived from descriptive bioinformatic analyses and represent preliminary, hypothesis-generating observations rather than validated mechanisms or clinically actionable biomarkers. Our study lacks functional experiments—such as gain-of-function or loss-of-function assays in CRC cell lines—and in vivo animal models, which are essential to determine whether UCHL1 actively drives immune evasion or whether the observed correlations reflect secondary phenomena. Second, the TIDE algorithm was originally developed and validated using transcriptomic data from patients with melanoma and non-small cell lung cancer who received immune checkpoint blockade therapy [26]. For cancer types outside this training domain, including CRC, TIDE applies a generalized “Other” prediction model whose performance has not been systematically benchmarked against CRC-specific immunotherapy outcomes. Third, our study lacks independent clinical cohorts of CRC patients receiving immune checkpoint inhibitor therapy, which are essential for externally validating the predictive utility of UCHL1 expression. Fourth, TIDE scores are derived from bulk transcriptome data and may not fully capture the spatial heterogeneity of immune cell infiltration and dysfunction within the tumor microenvironment. Future studies incorporating prospective CRC cohorts receiving standardized immunotherapy, along with orthogonal validation methods such as multiplex immunohistochemistry or spatial transcriptomics, are urgently needed to determine whether UCHL1 holds any genuine predictive value in the clinical immunotherapy setting. Despite these limitations, our study provides a comprehensive characterization of UCHL1 expression, clinicopathological associations, and immune correlations in CRC, offering a foundation for future mechanistic and translational investigations.

5. Conclusions

In conclusion, this study demonstrates that UCHL1 is downregulated in CRC tissues, but, paradoxically, its elevated expression is associated with advanced disease stages and poor prognosis. UCHL1 is implicated in multiple oncogenic pathways and appears to positively regulate immune cell infiltration and immune checkpoint gene expression, potentially influencing the response to immunotherapy.

Supplementary Materials

The following supporting information can be downloaded at: https://www.mdpi.com/article/10.3390/biomedicines14091924/s1, Figure S1. Methylation of the UCHL1 promoter in COAD and READ based on TCGA datasets from the UALCAN database.

Author Contributions

Conceptualization, T.S. and D.Z.; methodology, J.G. and S.X.; formal analysis, J.G.; writing—original draft preparation, J.G., T.S. and S.X.; supervision, D.Z. All authors have read and agreed to the published version of the manuscript.

Funding

This research received no external funding.

Institutional Review Board Statement

The study was conducted in accordance with the Declaration of Helsinki and approved by the Institutional Review Board of Soochow University’s First Affiliated Hospital (Ethics No. 2021-327) on 23 February 2024.

Informed Consent Statement

Informed consent was obtained from all subjects involved in the study.

Data Availability Statement

The data of the current study are available from the following open public databases: UALCAN (https://ualcan.path.uab.edu/, accessed on 24 March 2026), GEPIA2 (http://gepia2.cancer-pku.cn/#index, accessed on 24 March 2026), GSCA (https://guolab.wchscu.cn/GSCA/#/, accessed on 24 March 2026), and ENCORI (https://rnasysu.com/encori/, accessed on 24 March 2026) tools.

Conflicts of Interest

The authors declare no conflicts of interest.

Abbreviations

CRCColorectal cancer
UCHL1Ubiquitin C-terminal hydrolase L1
IHCImmunohistochemistry
NATsAdjacent normal tissues

References

  1. Cui, W.; Hao, M.; Yang, X.; Yin, C.; Chu, B. Gut microbial metabolism in ferroptosis and colorectal cancer. Trends Cell Biol. 2025, 35, 341–351. [Google Scholar] [CrossRef] [Scilit] [PubMed]
  2. Wu, S.; Zhang, Y.; Lin, Z.; Wei, M. Global burden of colorectal cancer in 2022 and projections to 2050: Incidence and mortality estimates from GLOBOCAN. BMC Cancer 2025, 25, 1770. [Google Scholar] [CrossRef] [Scilit] [PubMed]
  3. Ilyas, M.I.M. Epidemiology of Stage IV Colorectal Cancer: Trends in the Incidence, Prevalence, Age Distribution, and Impact on Life Span. Clin. Colon Rectal Surg. 2024, 37, 57–61. [Google Scholar] [CrossRef] [Scilit] [PubMed]
  4. Ma, Y.; Chen, Y.; Zhan, L.; Dong, Q.; Wang, Y.; Li, X.; He, L.; Zhang, J. CEBPB-mediated upregulation of SERPINA1 promotes colorectal cancer progression by enhancing STAT3 signaling. Cell Death Discov. 2024, 10, 219. [Google Scholar] [CrossRef] [Scilit] [PubMed]
  5. An, S.X.; Yu, Z.J.; Fu, C.; Wei, M.J.; Shen, L.H. Biological factors driving colorectal cancer metastasis. World J. Gastrointest. Oncol. 2024, 16, 259–272. [Google Scholar] [CrossRef] [Scilit] [PubMed]
  6. He, J.H.; Cao, C.; Ding, Y.; Yi, Y.; Lv, Y.Q.; Wang, C.; Chang, Y. A nomogram model for predicting distant metastasis of newly diagnosed colorectal cancer based on clinical features. Front. Oncol. 2023, 13, 1186298. [Google Scholar] [CrossRef] [Scilit] [PubMed]
  7. Yang, D.; Lu, Q.; Peng, S.; Hua, J. Ubiquitin C-terminal hydrolase L1 (UCHL1), a double-edged sword in mammalian oocyte maturation and spermatogenesis. Cell Prolif. 2023, 56, e13347. [Google Scholar] [CrossRef] [Scilit] [PubMed]
  8. Liu, S.; Chai, T.; Garcia-Marques, F.; Yin, Q.; Hsu, E.C.; Shen, M.; Toland, A.M.S.; Bermudez, A.; Hartono, A.B.; Massey, C.F.; et al. UCHL1 is a potential molecular indicator and therapeutic target for neuroendocrine carcinomas. Cell Rep. Med. 2024, 5, 101381. [Google Scholar] [CrossRef] [Scilit] [PubMed]
  9. Tian, C.; Liu, Y.; Liu, Y.; Hu, P.; Xie, S.; Guo, Y.; Wang, H.; Zhang, Z.; Du, L.; Lei, B.; et al. UCHL1 promotes cancer stemness in triple-negative breast cancer. Pathol. Res. Pract. 2022, 240, 154235. [Google Scholar] [CrossRef] [Scilit] [PubMed]
  10. Lee, G.Y.; Jeong, I.H.; Kim, B.S.; Kim, H.S.; Lee, P.C. UCHL1 Promotes Gastric Cancer Progression by Regulating CIP2A Degradation. Pharmaceuticals 2025, 18, 1468. [Google Scholar] [CrossRef] [Scilit] [PubMed]
  11. Zhao, Y.; Lei, Y.; He, S.W.; Li, Y.Q.; Wang, Y.Q.; Hong, X.H.; Liang, Y.L.; Li, J.Y.; Chen, Y.; Luo, W.J.; et al. Hypermethylation of UCHL1 Promotes Metastasis of Nasopharyngeal Carcinoma by Suppressing Degradation of Cortactin (CTTN). Cells 2020, 9, 559. [Google Scholar] [CrossRef] [Scilit] [PubMed]
  12. Zhong, J.; Zhao, M.; Ma, Y.; Luo, Q.; Liu, J.; Wang, J.; Yuan, X.; Sang, J.; Huang, C. UCHL1 acts as a colorectal cancer oncogene via activation of the beta-catenin/TCF pathway through its deubiquitinating activity. Int. J. Mol. Med. 2012, 30, 430–436. [Google Scholar] [CrossRef] [Scilit] [PubMed]
  13. Mizukami, H.; Shirahata, A.; Goto, T.; Sakata, M.; Saito, M.; Ishibashi, K.; Kigawa, G.; Nemoto, H.; Sanada, Y.; Hibi, K. PGP9.5 methylation as a marker for metastatic colorectal cancer. Anticancer Res. 2008, 28, 2697–2700. [Google Scholar] [PubMed]
  14. Lee, K.C.; Chen, H.H.; Cheng, K.C.; Liu, T.T.; Lee, K.F.; Teng, C.C.; Huang, C.Y.; Hsieh, M.C.; Kuo, H.C. Use of iTRAQ-based quantitative proteomic identification of CHGA and UCHL1 correlated with lymph node metastasis in colorectal carcinoma. J. Cell. Mol. Med. 2023, 27, 2004–2020. [Google Scholar] [CrossRef] [Scilit] [PubMed]
  15. Zhou, T.; Cai, Z.; Ma, N.; Xie, W.; Gao, C.; Huang, M.; Bai, Y.; Ni, Y.; Tang, Y. A Novel Ten-Gene Signature Predicting Prognosis in Hepatocellular Carcinoma. Front. Cell Dev. Biol. 2020, 8, 629. [Google Scholar] [CrossRef] [Scilit] [PubMed]
  16. Hu, W.; Wang, G.; Chen, Y.; Yarmus, L.B.; Liu, B.; Wan, Y. Coupled immune stratification and identification of therapeutic candidates in patients with lung adenocarcinoma. Aging 2020, 12, 16514–16538. [Google Scholar] [CrossRef] [Scilit] [PubMed]
  17. Lin, W.; Wu, S.; Chen, X.; Ye, Y.; Weng, Y.; Pan, Y.; Chen, Z.; Chen, L.; Qiu, X.; Qiu, S. Characterization of Hypoxia Signature to Evaluate the Tumor Immune Microenvironment and Predict Prognosis in Glioma Groups. Front. Oncol. 2020, 10, 796. [Google Scholar] [CrossRef] [Scilit] [PubMed]
  18. Zhang, Z.; Lin, E.; Zhuang, H.; Xie, L.; Feng, X.; Liu, J.; Yu, Y. Construction of a novel gene-based model for prognosis prediction of clear cell renal cell carcinoma. Cancer Cell Int. 2020, 20, 27. [Google Scholar] [CrossRef] [Scilit] [PubMed]
  19. Hong, W.; Yuan, H.; Gu, Y.; Liu, M.; Ji, Y.; Huang, Z.; Yang, J.; Ma, L. Immune-related prognosis biomarkers associated with osteosarcoma microenvironment. Cancer Cell Int. 2020, 20, 83. [Google Scholar] [CrossRef] [Scilit] [PubMed]
  20. Wei, J.; Huang, K.; Chen, Z.; Hu, M.; Bai, Y.; Lin, S.; Du, H. Characterization of Glycolysis-Associated Molecules in the Tumor Microenvironment Revealed by Pan-Cancer Tissues and Lung Cancer Single Cell Data. Cancers 2020, 12, 1788. [Google Scholar] [CrossRef] [Scilit] [PubMed]
  21. Hanzelmann, S.; Castelo, R.; Guinney, J. GSVA: Gene set variation analysis for microarray and RNA-seq data. BMC Bioinform. 2013, 14, 7. [Google Scholar] [CrossRef] [Scilit] [PubMed]
  22. Wen, T.; Xie, P.; Yang, S.; Niu, G.; Liu, X.; Ding, Z.; Xue, C.; Liu, Y.X.; Shen, Q.; Yuan, J. ggClusterNet: An R package for microbiome network analysis and modularity-based multiple network layouts. Imeta 2022, 1, e32. [Google Scholar] [CrossRef] [Scilit] [PubMed]
  23. Sturm, G.; Finotello, F.; Petitprez, F.; Zhang, J.D.; Baumbach, J.; Fridman, W.H.; List, M.; Aneichyk, T. Comprehensive evaluation of transcriptome-based cell-type quantification methods for immuno-oncology. Bioinformatics 2019, 35, i436–i445. [Google Scholar] [CrossRef] [Scilit] [PubMed]
  24. Deng, S.; Zhang, Y.; Wang, H.; Liang, W.; Xie, L.; Li, N.; Fang, Y.; Wang, Y.; Liu, J.; Chi, H.; et al. ITPRIPL1 binds CD3epsilon to impede T cell activation and enable tumor immune evasion. Cell 2024, 187, 2305–2323.e33. [Google Scholar] [CrossRef] [Scilit] [PubMed]
  25. Ravi, R.; Noonan, K.A.; Pham, V.; Bedi, R.; Zhavoronkov, A.; Ozerov, I.V.; Makarev, E.; Artemov, A.V.; Wysocki, P.T.; Mehra, R.; et al. Bifunctional immune checkpoint-targeted antibody-ligand traps that simultaneously disable TGFbeta enhance the efficacy of cancer immunotherapy. Nat. Commun. 2018, 9, 741. [Google Scholar] [CrossRef] [Scilit] [PubMed]
  26. Jiang, P.; Gu, S.; Pan, D.; Fu, J.; Sahu, A.; Hu, X.; Li, Z.; Traugh, N.; Bu, X.; Li, B.; et al. Signatures of T cell dysfunction and exclusion predict cancer immunotherapy response. Nat. Med. 2018, 24, 1550–1558. [Google Scholar] [CrossRef] [Scilit] [PubMed]
  27. Liu, X.; Lu, J.; Ni, X.; He, Y.; Wang, J.; Deng, Z.; Zhang, G.; Shi, T.; Chen, W. FASN promotes lipid metabolism and progression in colorectal cancer via the SP1/PLA2G4B axis. Cell Death Discov. 2025, 11, 122. [Google Scholar] [CrossRef] [Scilit] [PubMed]
  28. Jia, Q.; Wang, H.; Xiao, X.; Sun, Y.; Tan, X.; Chai, J.; Yang, Y.; Yin, Z.; Li, M.; Wang, K.; et al. UCHL1 acts as a prognostic factor and promotes cancer stemness in cervical squamous cell carcinoma. Pathol. Res. Pract. 2023, 247, 154574. [Google Scholar] [CrossRef] [Scilit] [PubMed]
  29. Okochi-Takada, E.; Nakazawa, K.; Wakabayashi, M.; Mori, A.; Ichimura, S.; Yasugi, T.; Ushijima, T. Silencing of the UCHL1 gene in human colorectal and ovarian cancers. Int. J. Cancer 2006, 119, 1338–1344. [Google Scholar] [CrossRef] [Scilit] [PubMed]
  30. Abdelmaksoud-Dammak, R.; Saadallah-Kallel, A.; Miladi-Abdennadher, I.; Ayedi, L.; Khabir, A.; Sallemi-Boudawara, T.; Frikha, M.; Daoud, J.; Mokdad-Gargouri, R. CpG methylation of ubiquitin carboxyl-terminal hydrolase 1 (UCHL1) and P53 mutation pattern in sporadic colorectal cancer. Tumor Biol. 2016, 37, 1707–1714. [Google Scholar] [CrossRef] [Scilit] [PubMed]
  31. Heitzer, E.; Artl, M.; Filipits, M.; Resel, M.; Graf, R.; Weissenbacher, B.; Lax, S.; Gnant, M.; Wrba, F.; Greil, R.; et al. Differential survival trends of stage II colorectal cancer patients relate to promoter methylation status of PCDH10, SPARC, and UCHL1. Mod. Pathol. 2014, 27, 906–915. [Google Scholar] [CrossRef] [Scilit] [PubMed]
  32. Chen, W.; Wang, S.; Wei, D.; Zhai, L.; Liu, L.; Pan, C.; Han, Z.; Liu, H.; Zhong, W.; Jiang, X. LncRNA ZFAS1 promotes invasion of medullary thyroid carcinoma by enhancing EPAS1 expression via miR-214-3p/UCHL1 axis. J. Cell Commun. Signal. 2024, 18, e12021. [Google Scholar] [CrossRef] [Scilit] [PubMed]
  33. Kumar, R.; Jangir, D.K.; Verma, G.; Shekhar, S.; Hanpude, P.; Kumar, S.; Kumari, R.; Singh, N.; Bhavesh, N.S.; Jana, N.R.; et al. S-nitrosylation of UCHL1 induces its structural instability and promotes alpha-synuclein aggregation. Sci. Rep. 2017, 7, 44558. [Google Scholar] [CrossRef] [Scilit] [PubMed]
  34. Li, J.; Liang, Y.; Zhou, S.; Chen, J.; Wu, C. UCHL1 contributes to insensitivity to endocrine therapy in triple-negative breast cancer by deubiquitinating and stabilizing KLF5. Breast Cancer Res. 2024, 26, 44. [Google Scholar] [CrossRef] [Scilit] [PubMed]
  35. Zhang, J.; Cui, H.; Wu, S.; Shi, H.; Wang, H.; Jiang, J. CD82-associated exhausted CD8+ T cells define prognosis and immunotherapy resistance in colon cancer. Front. Immunol. 2025, 16, 1731154. [Google Scholar] [CrossRef] [Scilit] [PubMed]
  36. Datsi, A.; Sorg, R.V.; Garg, A.D. The conundrum of CD8+ T cell trajectories in low antigenic tumors: How to overcome a hypofunctional state distinct from antigen-driven exhaustion? Genes Immun. 2024, 25, 353–355. [Google Scholar] [CrossRef] [Scilit] [PubMed]
  37. Gu, T.; Qi, H.; Wang, J.; Sun, L.; Su, Y.; Hu, H. Identification of T cell dysfunction molecular subtypes and exploration of potential immunotherapy targets in BRAF V600E-mutant colorectal cancer. Discov. Oncol. 2025, 16, 163. [Google Scholar] [CrossRef] [Scilit] [PubMed]
  38. Chen, X.; Li, J.; Tang, B.; Wang, X.; Huang, Y. Deubiquitinating Enzyme UCHL1 Modulates FHL2 to Block Ferroptosis and Counteract CD8+ T Cell Anti-Tumour Immunity in Lung Adenocarcinoma. Immunology 2026, 177, 384–397. [Google Scholar] [CrossRef] [Scilit] [PubMed]
  39. Mao, R.; Tan, X.; Xiao, Y.; Wang, X.; Wei, Z.; Wang, J.; Wang, X.; Zhou, H.; Zhang, L.; Shi, Y. Ubiquitin C-terminal hydrolase L1 promotes expression of programmed cell death-ligand 1 in non-small-cell lung cancer cells. Cancer Sci. 2020, 111, 3174–3183. [Google Scholar] [CrossRef] [Scilit] [PubMed]
  40. He, L.; He, J.; Jiang, T.; Gong, R.; Wan, X.; Duan, M.; Chen, Z.; Cheng, Y. Inhibition of UCH-L1 enhances immunotherapy efficacy in triple-negative breast cancer by stabilizing PD-L1. Eur. J. Pharmacol. 2025, 1000, 177743. [Google Scholar] [CrossRef] [Scilit] [PubMed]
  41. Zhu, Q.; Zhang, K.; Cao, Y.; Hu, Y. Adipose stem cell exosomes, stimulated by pro-inflammatory factors, enhance immune evasion in triple-negative breast cancer by modulating the HDAC6/STAT3/PD-L1 pathway through the transporter UCHL1. Cancer Cell Int. 2024, 24, 385. [Google Scholar] [CrossRef] [Scilit] [PubMed]
Figure 1. The mRNA expression level of UCHL1 in CRC and healthy tissues: (AD) The mRNA expression of UCHL1 in CRC and normal tissues in the UALCAN (A), GEPIA 2.0 (B), GSCA (C), and ENCORI (D) databases. (E) The mRNA levels of UCHL1 in CRC and normal tissues from TCGA databases. Statistical significance was assessed using an unpaired t-test (A), one-way ANOVA (B), paired t-test (C), and Wilcoxon rank-sum test (D,E). * p < 0.05; *** p < 0.001.
Biomedicines 14 01924 g001
Figure 2. The distribution of clinical features in different CRC groups from the TCGA database. The significance (p-value) between different groups is analyzed through the chi-squared test. *** p < 0.001; ns, no significant change.
Biomedicines 14 01924 g002
Figure 3. Prognostic value of UCHL1 in patients with CRC: (A,B) The relationship between UCHL1 expression and the overall survival (A) and disease-free survival (B) of patients with CRC was analyzed using the GEPIA 2.0 database. (C,D) The relationship between UCHL1 expression and the overall survival (C) and disease-free survival (D) of patients with CRC was analyzed using the Kaplan–Meier Plotter database. (E,F) Kaplan–Meier overall survival (E) and disease-free survival (F) analyses of UCHL1 using the TCGA cohort. In all analyses, patients were stratified by UCHL1 expression, and survival differences were evaluated using the log-rank test.
Biomedicines 14 01924 g003
Figure 4. Correlation of UCHL1 and signaling pathways in CRC. (AI) Spearman’s correlation analysis plots reveal the correlation between UCHL1 expression and tumor inflammation signature (A), cellular response to hypoxia (B), tumor proliferation signature (C), epithelial–mesenchymal transition (EMT) markers (D), extracellular matrix (ECM)-related genes (E), angiogenesis (F), apoptosis (G), DNA repair (H), and G2M checkpoint regulation (I) in CRC samples from The Cancer Genome Atlas database.
Biomedicines 14 01924 g004
Figure 5. Relationship between UCHL1 expression and immune scores in CRC: (AD) Heatmap illustrates the correlation analysis of UCHL1 expression with QUANTISEQ (A), TIMER (B), EPIC (C), and MCPCOUNTER (D) scores. The redder or greener the color, the greater the correlation between the two; the larger the circle, the stronger the correlation. Pearson correlation analysis was used. All correlations were assessed using Pearson’s correlation analysis.
Biomedicines 14 01924 g005
Figure 6. Spearman’s correlation analysis of UCHL1 expression with immune cells, including B cells, CD4+ T cells, CD8+ T cells, neutrophils, macrophages, and myeloid dendritic cells in CRC, from The Cancer Genome Atlas database.
Biomedicines 14 01924 g006
Figure 7. Relationship between UCHL1 expression and immune response in CRC tissues with high UCHL1 expression (G1) versus those with low expression (G2): (A) A distribution diagram of the expression of immune checkpoint genes in CRC tissues with high UCHL1 expression (G1) versus those with low expression (G2). (B) The box plot of immune response score in CRC tissues with high UCHL1 expression (G1) versus those with low expression (G2). The significance of differences between the two groups of samples is evaluated by the Wilcoxon rank-sum test. **** p < 0.0001; ns, no significant change.
Biomedicines 14 01924 g007
Figure 8. Decreased UCHL1 expression in CRC: (A) UCHL1 protein levels in CRC and non-cancerous adjacent tissues (NATs) through immunohistochemistry (IHC). One representative image is shown. Scale bar, 100 µm. (B) Protein expression of UCHL1 was significantly decreased in colon cancer tissues compared with that in normal tissues from the CPTAC database. (C) The UCHL1 protein expression based on their staining index in CRC specimens at clinical stages I, II, III, and IV. Statistical significance was assessed using an unpaired t-test. *** p < 0.001.
Biomedicines 14 01924 g008
Table 1. UCHL1 expression and clinical features in 80 colorectal cancer patient samples.
CharacteristicTotal No.UCHL1 Expressionχ2p Value
LowHigh
Gender 0.4250.5144
    male442420
    female361719
Age 3.22410.0726
    <61392415
    ≥61411724
T stage 0.46660.4946
    T2/T3382117
    T4422022
N stage 14.5320.0001
    N0463214
    N1/N234925
M stage 1.81390.178
    M0683731
    M11248
AJCC stage 12.7760.0004
    I–II412912
    III–IV391227
Death 0.40790.523
    Alive583127
    Dead221012
Disclaimer/Publisher’s Note: The statements, opinions and data contained in all publications are solely those of the individual author(s) and contributor(s) and not of MDPI and/or the editor(s). MDPI and/or the editor(s) disclaim responsibility for any injury to people or property resulting from any ideas, methods, instructions or products referred to in the content.