Integrative Proteomics and Phosphoproteomics Profiling of Chronic Enteropathy Associated with SLCO2A1 Gene Reveals Mucosal Barrier Impairment and Focal Adhesion Pathway Alterations
 ,
,
Abstract
1. Introduction
2. Materials and Methods
2.1. Sample Collection and Preparation
2.2. Protein Digestion and LC-MS/MS
2.3. Data Processing
2.4. Bioinformatic Analyses
2.5. Molecular Docking
3. Results
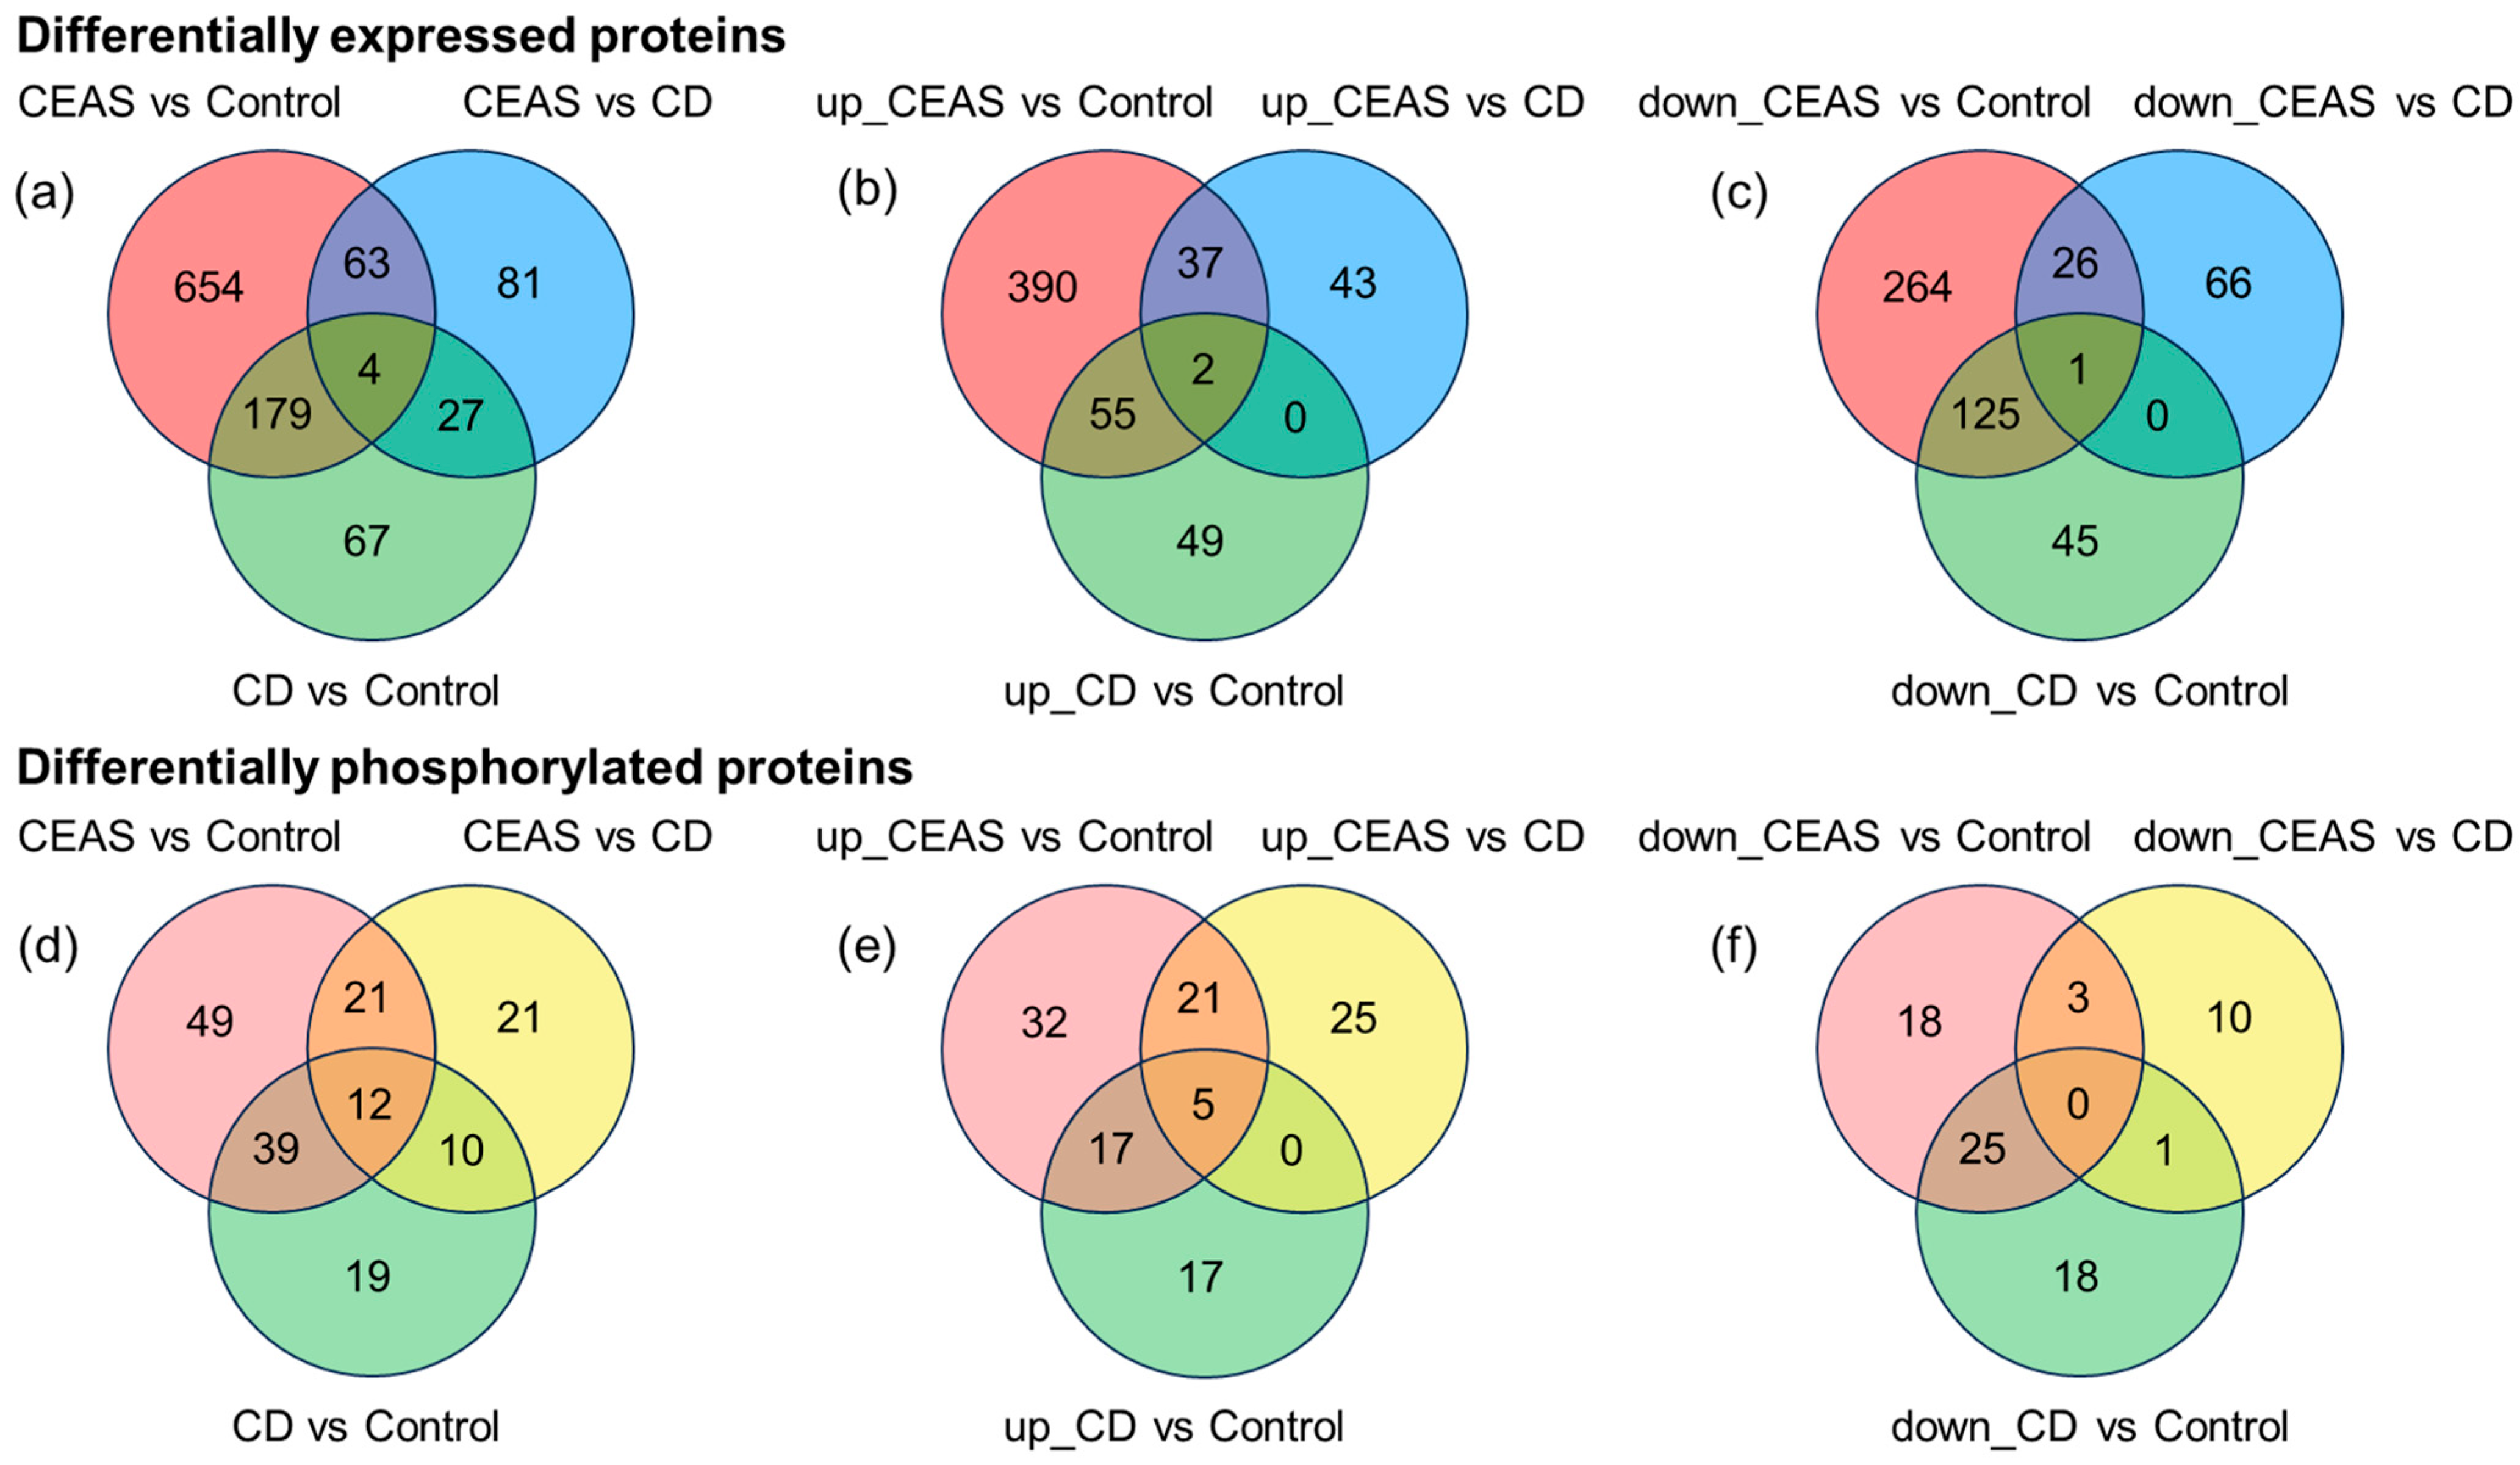
3.1. Identification and Classification of Differentially Expressed and Phosphorylated Proteins
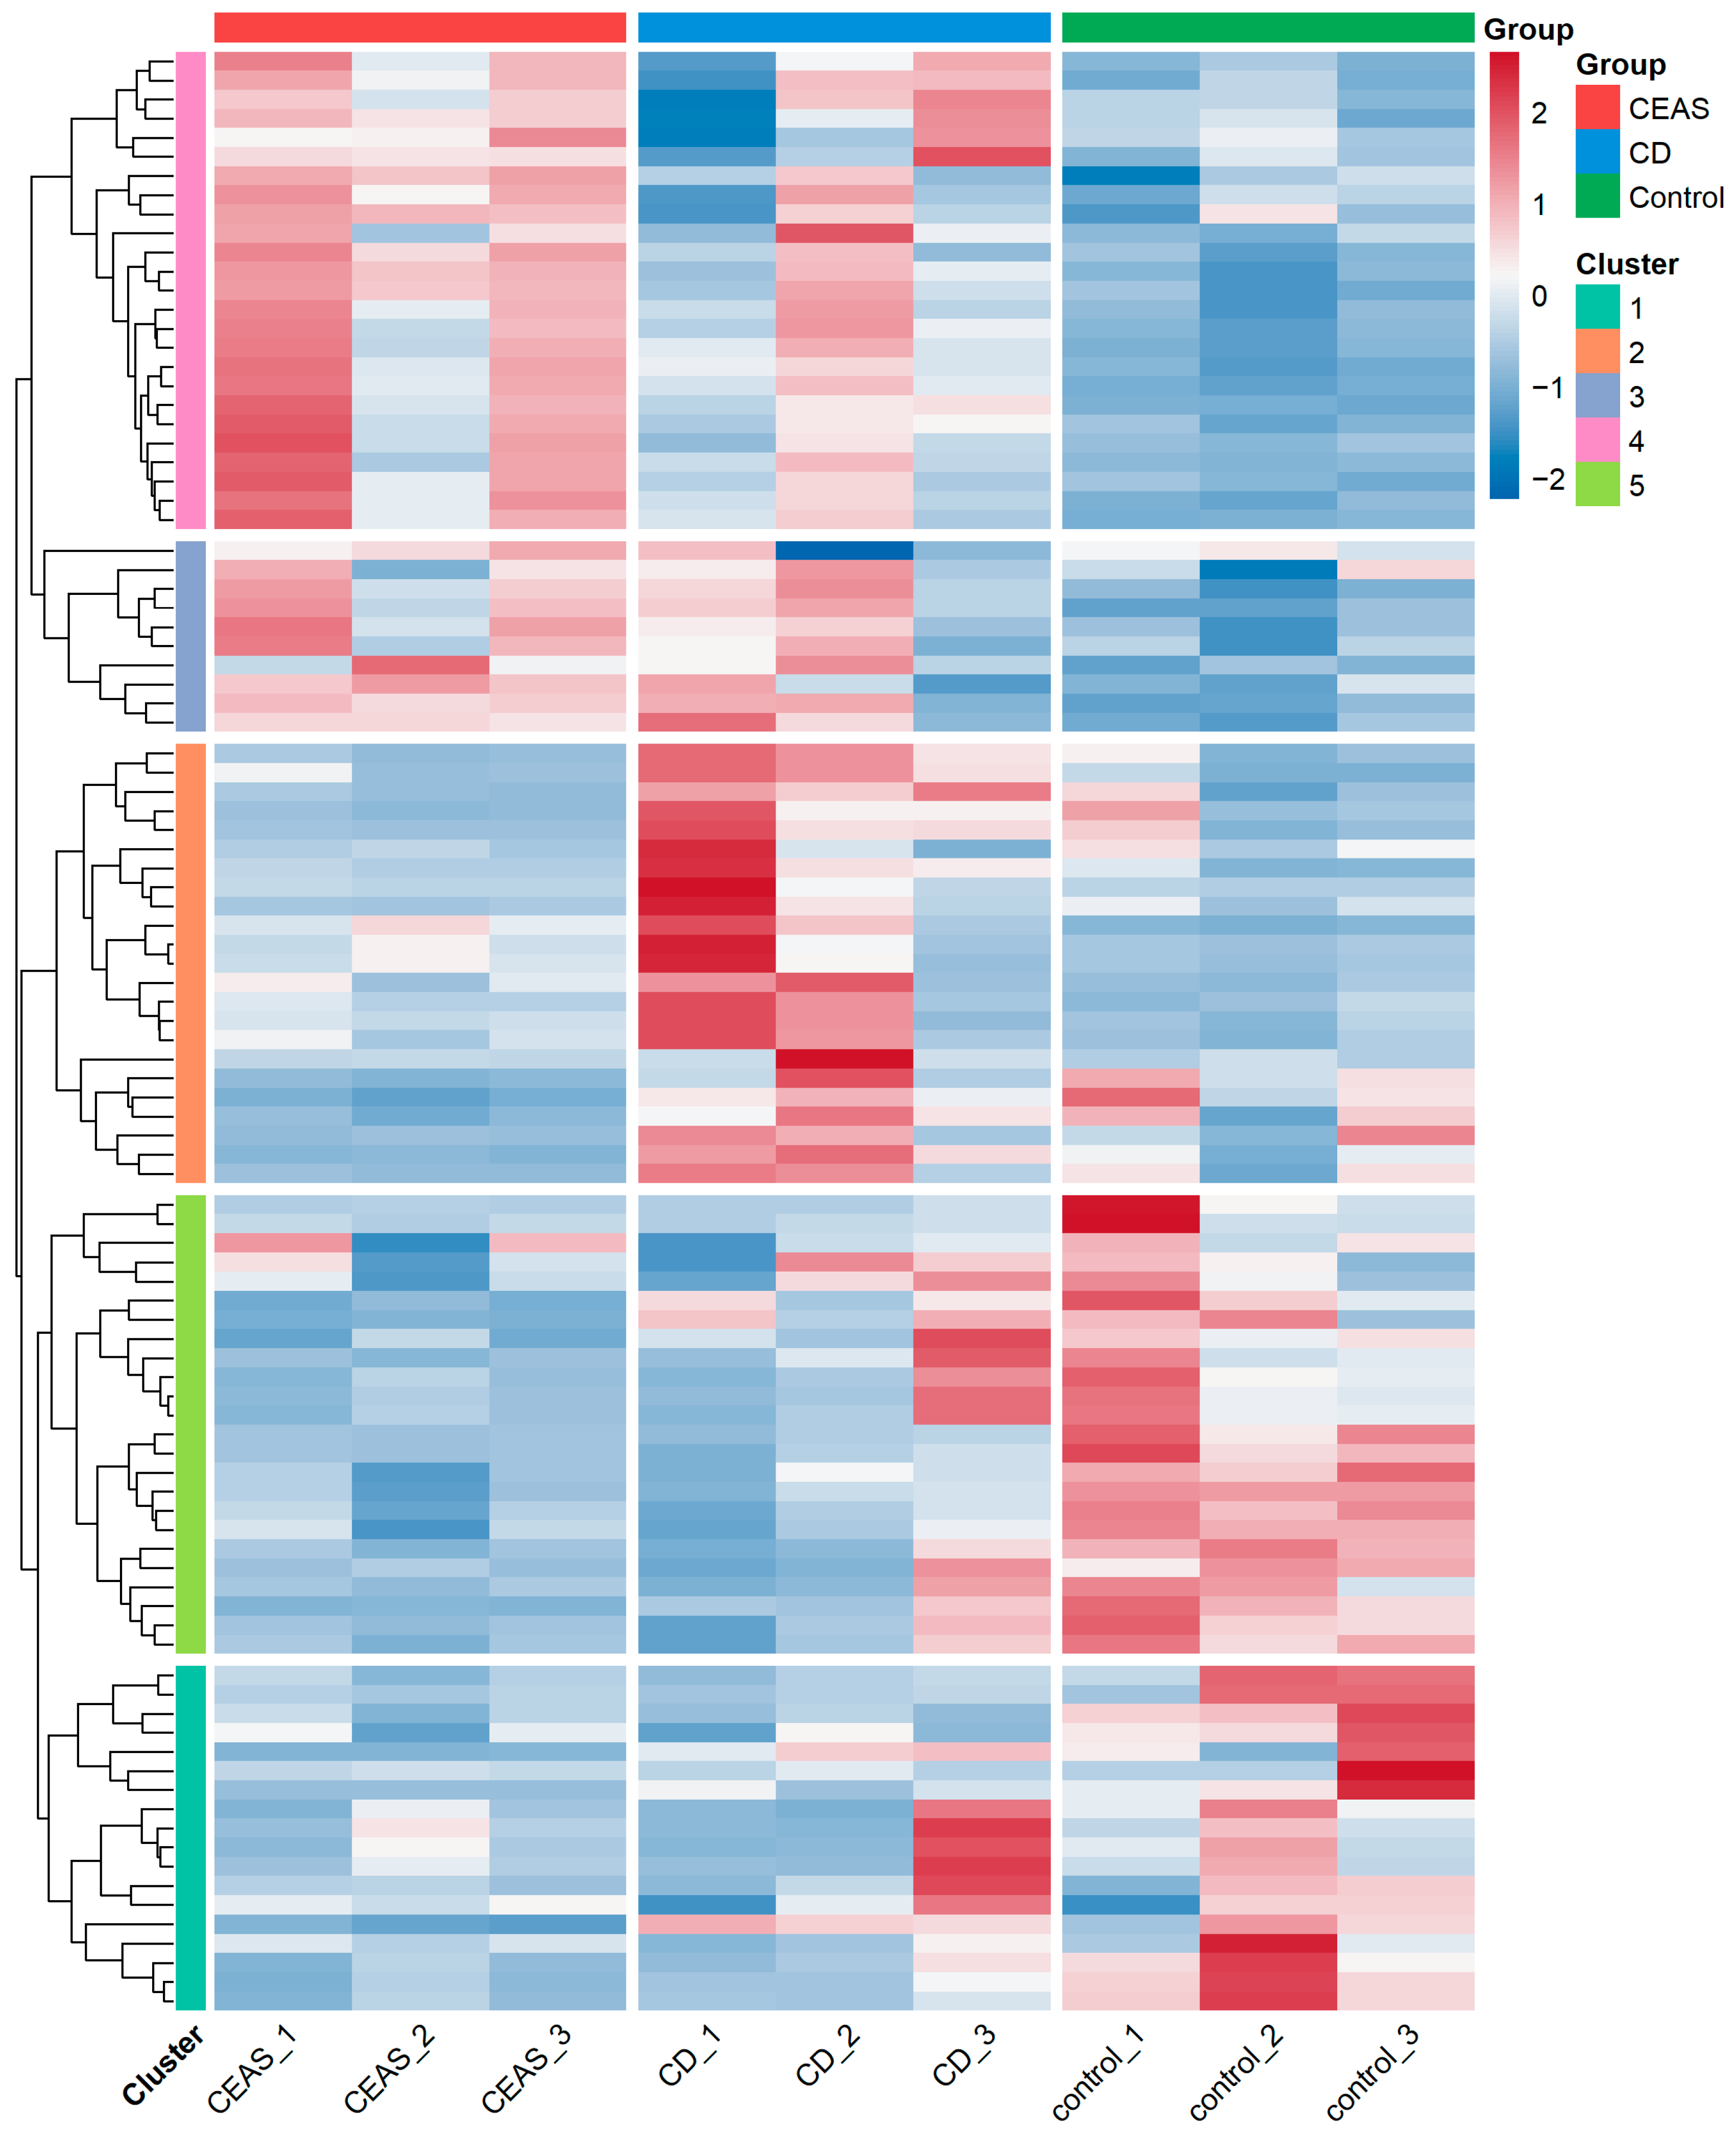
3.2. Hierarchical Clustering Analysis
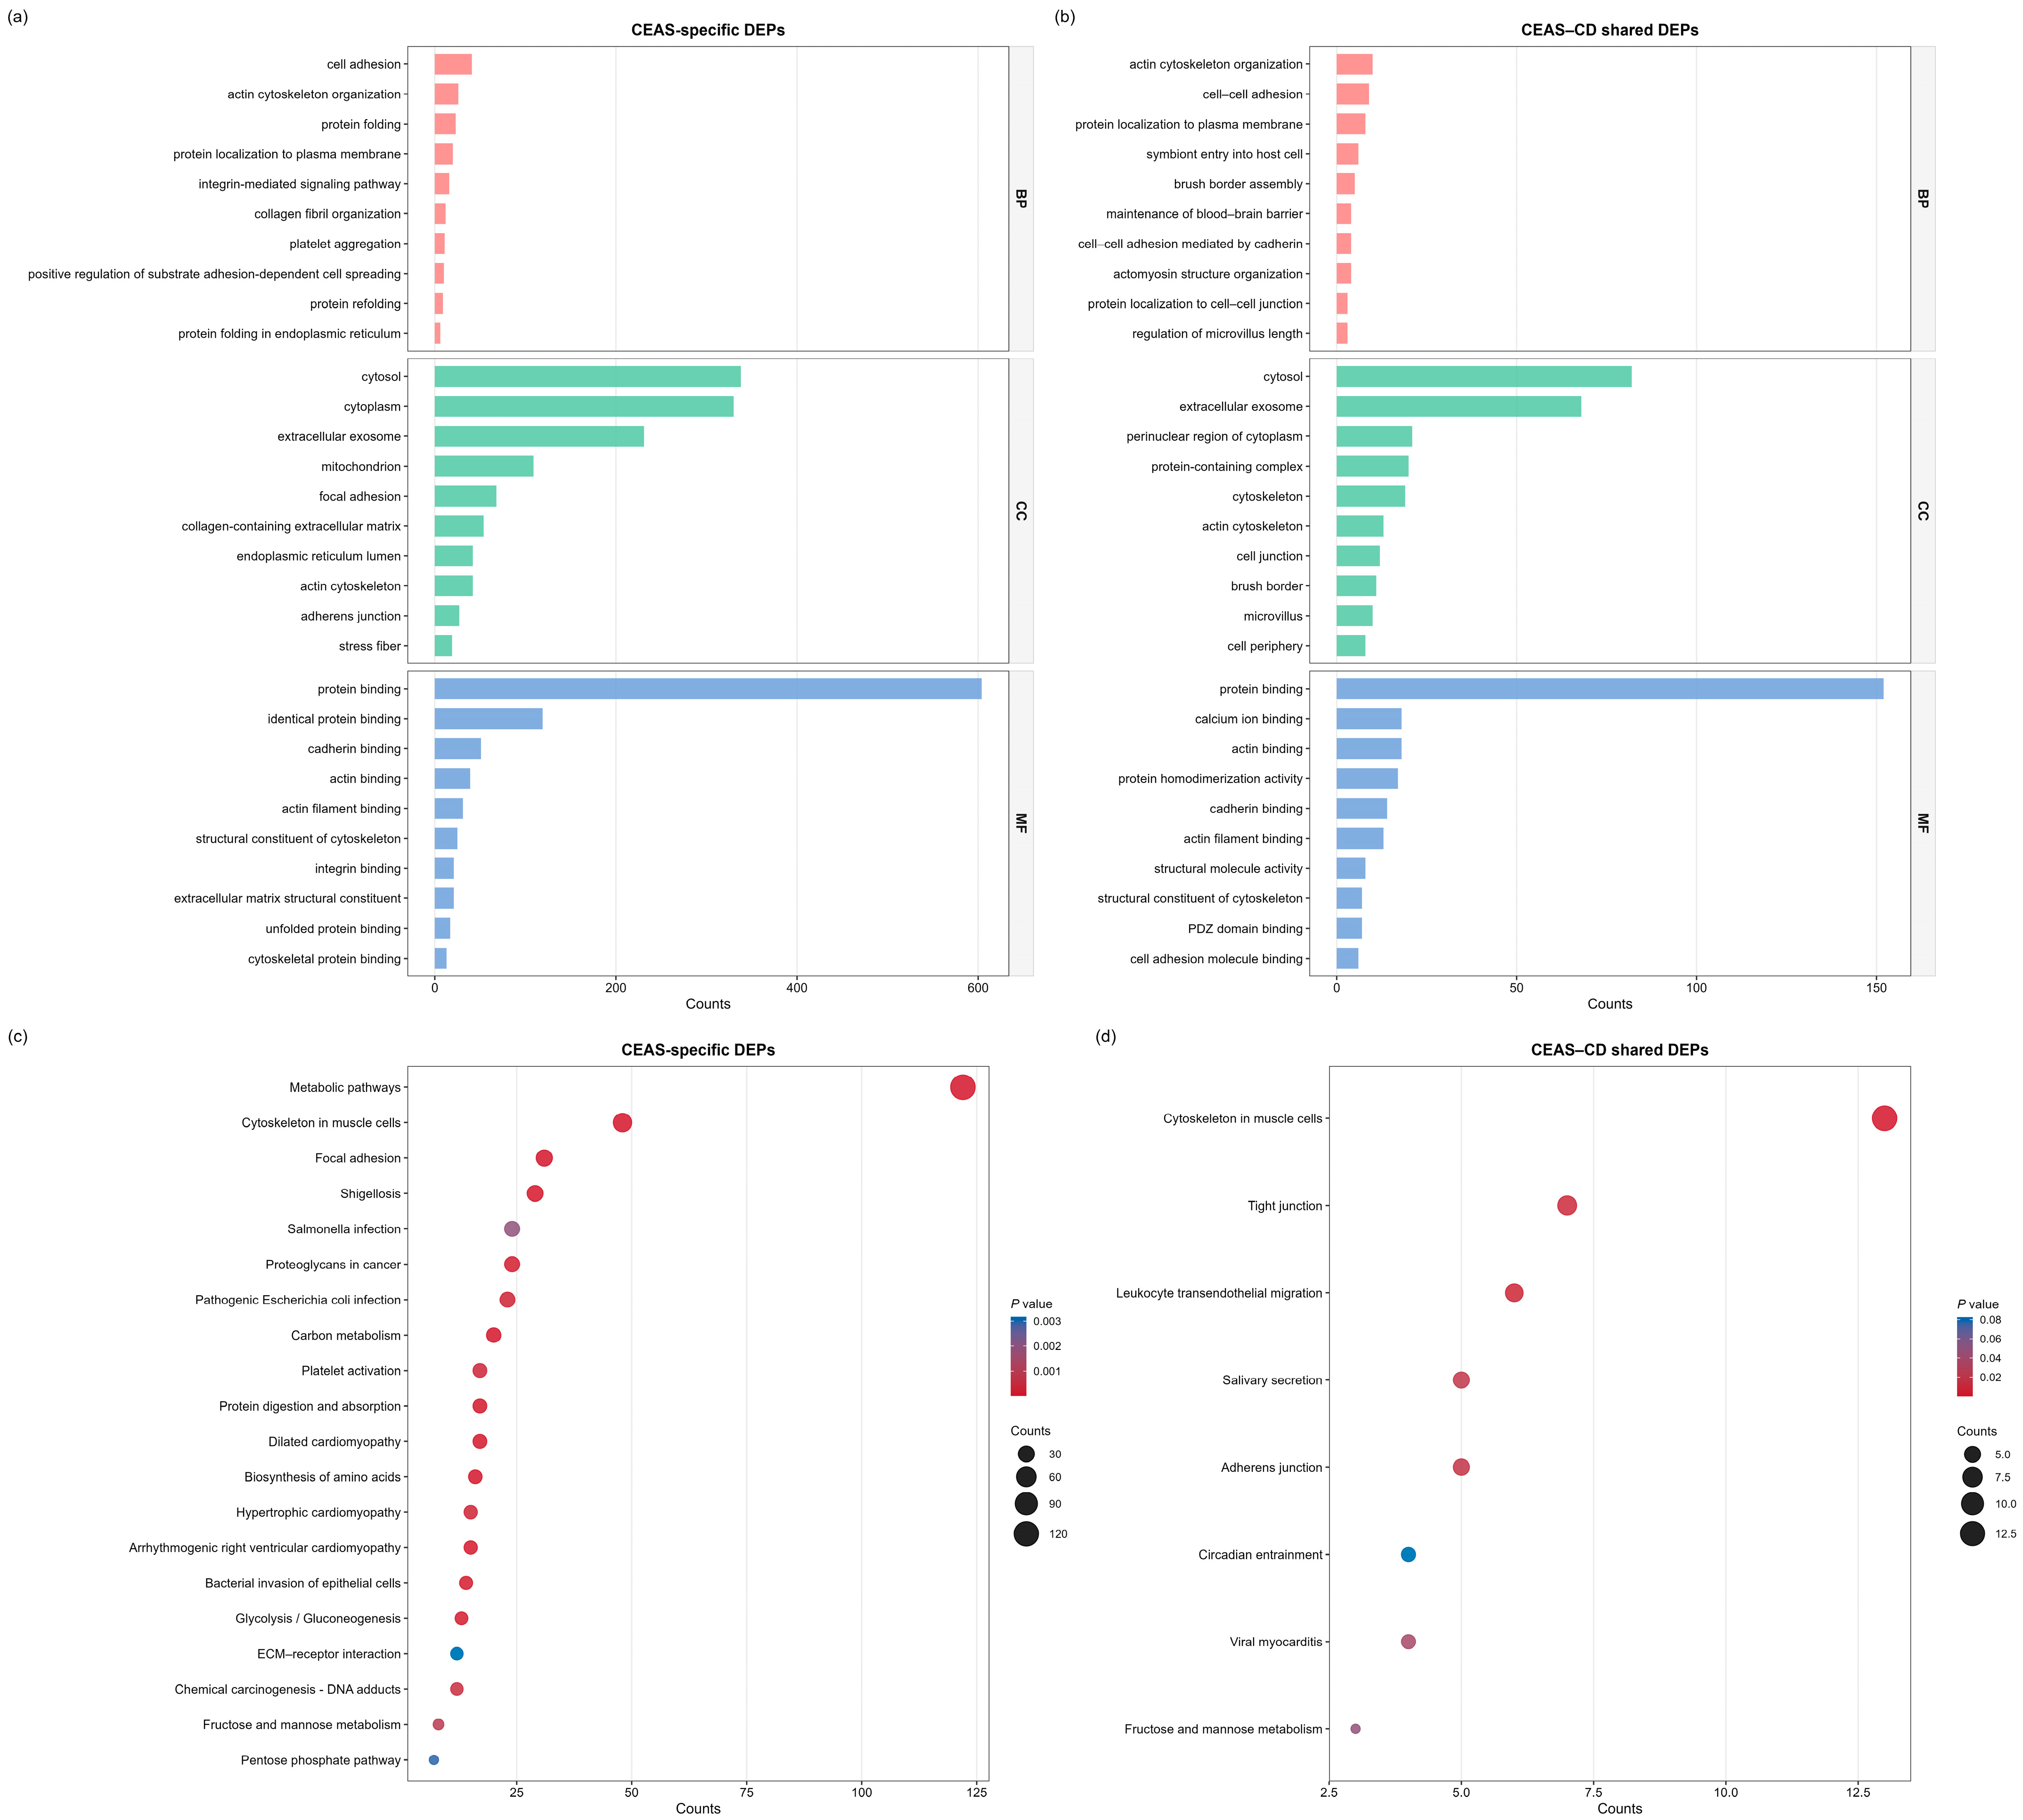
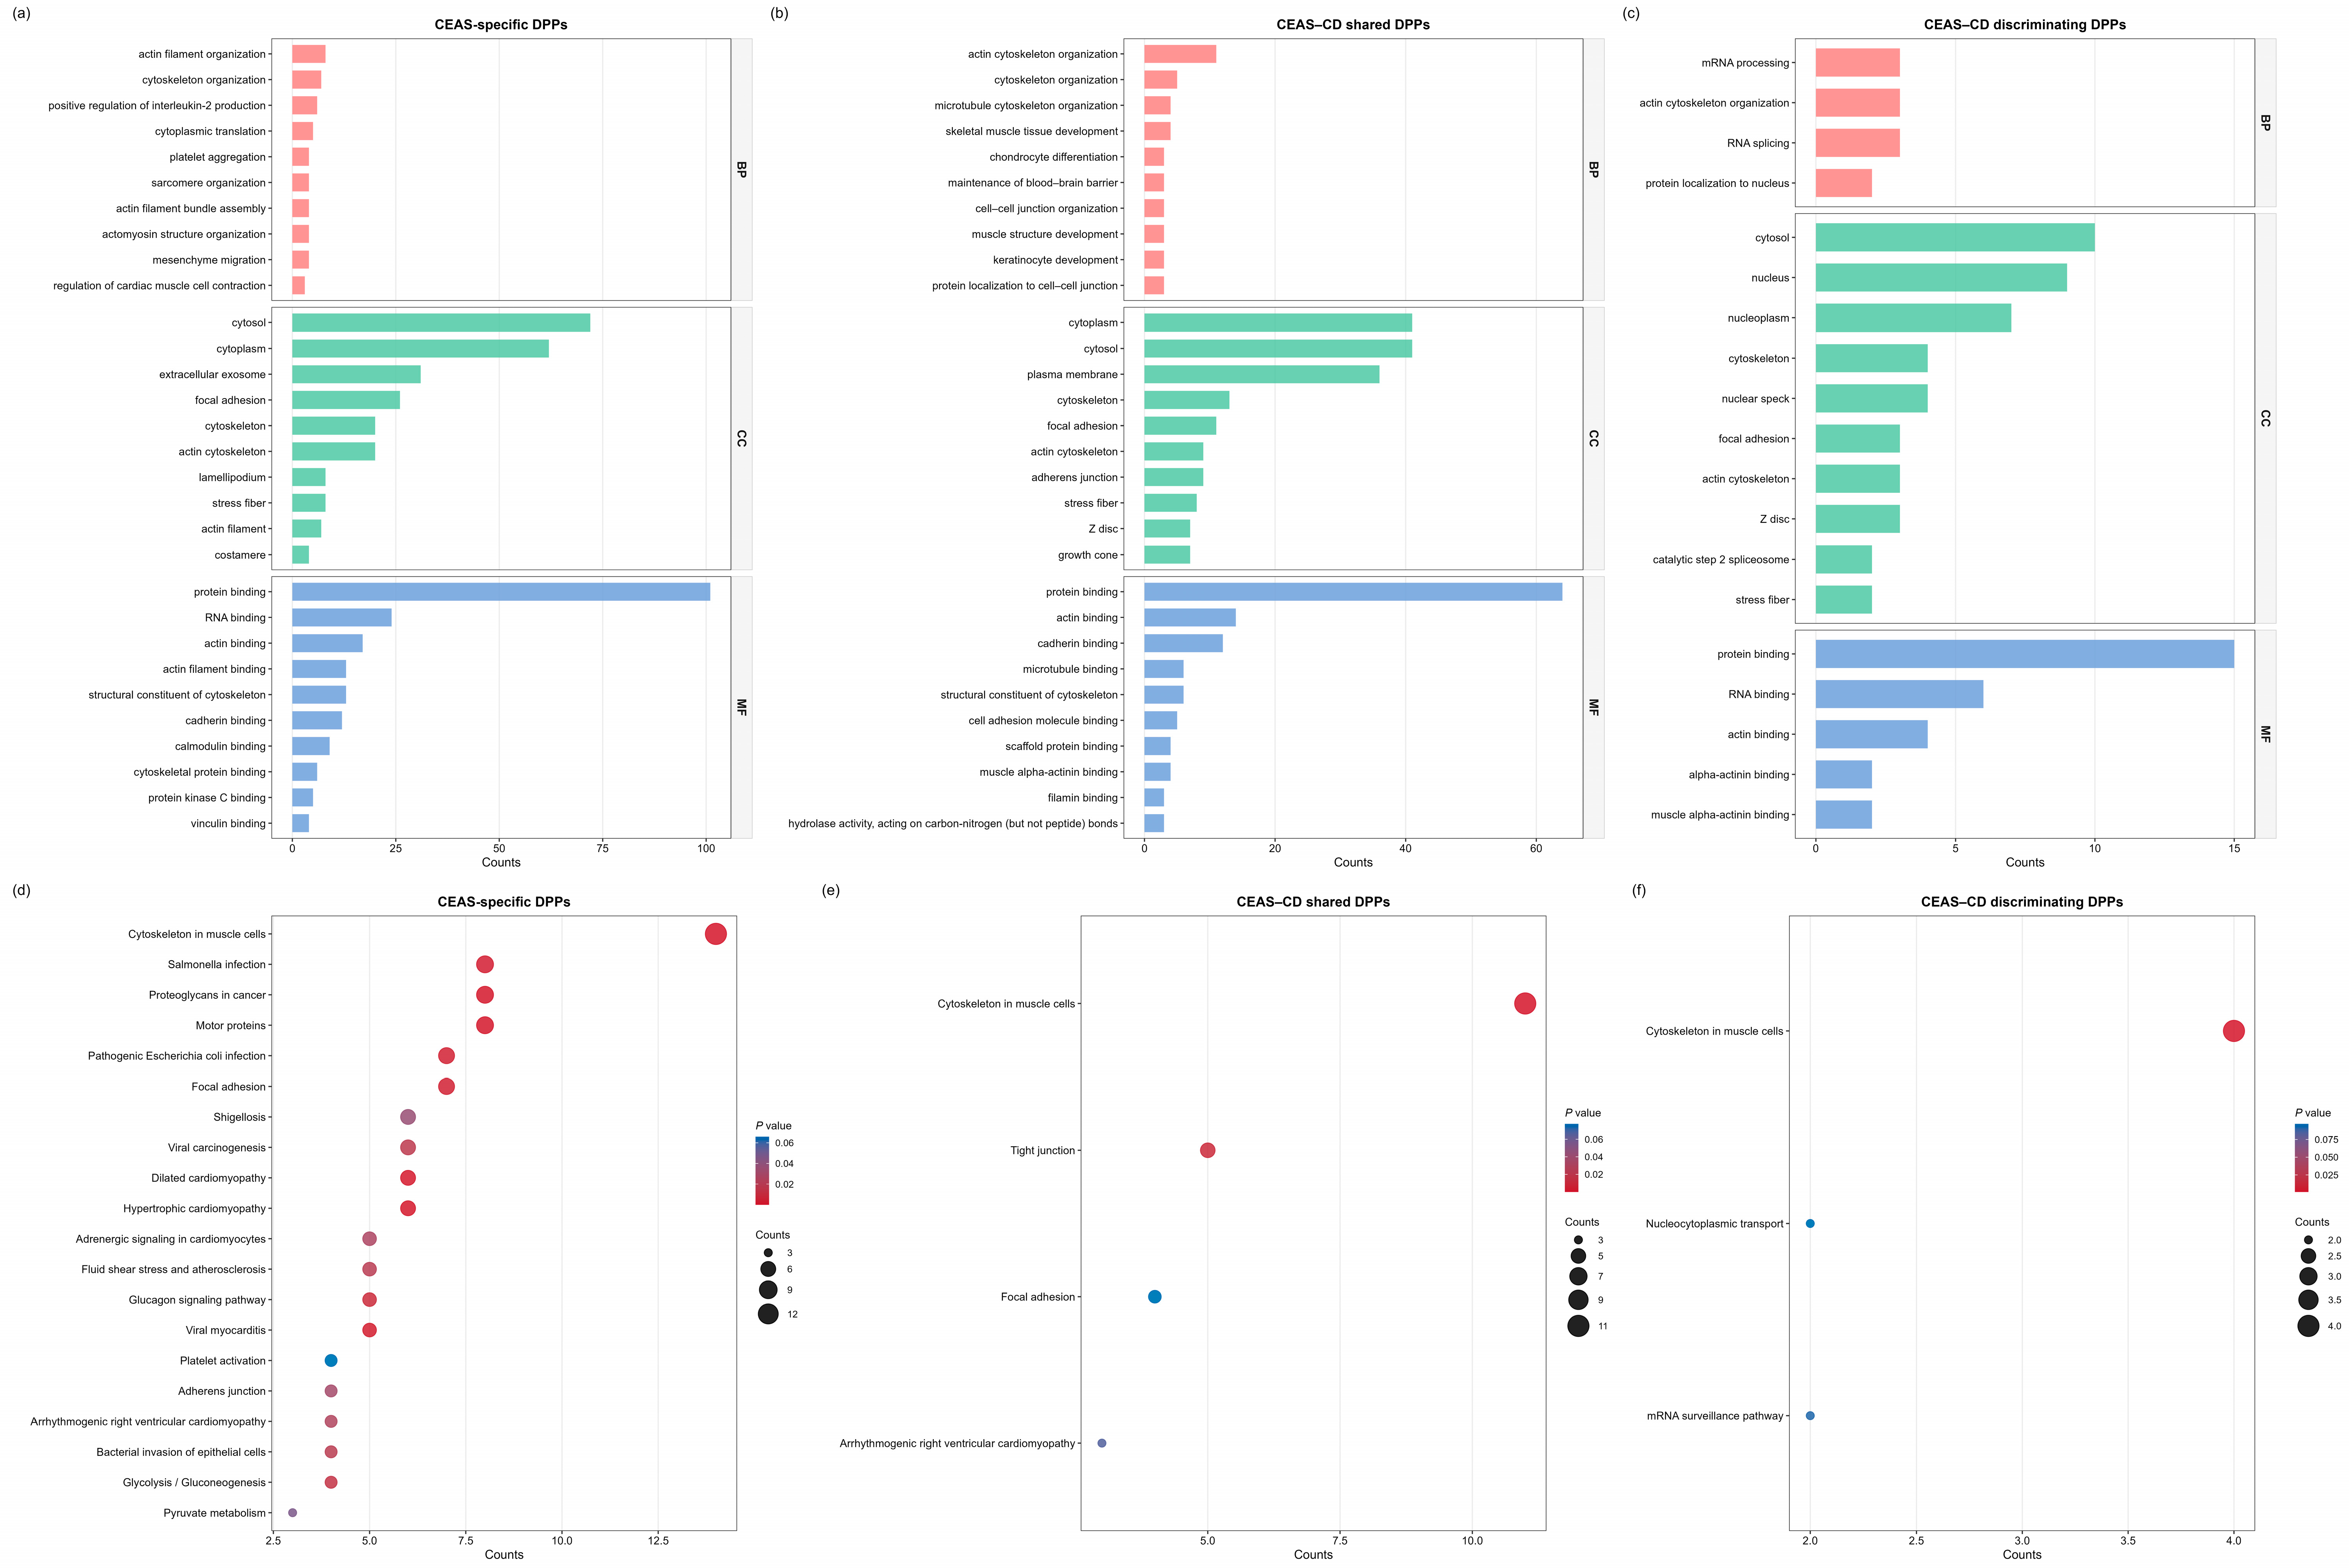
3.3. Functional Enrichment Analysis
3.3.1. Proteomic Enrichment
3.3.2. Phosphoproteomic Enrichment
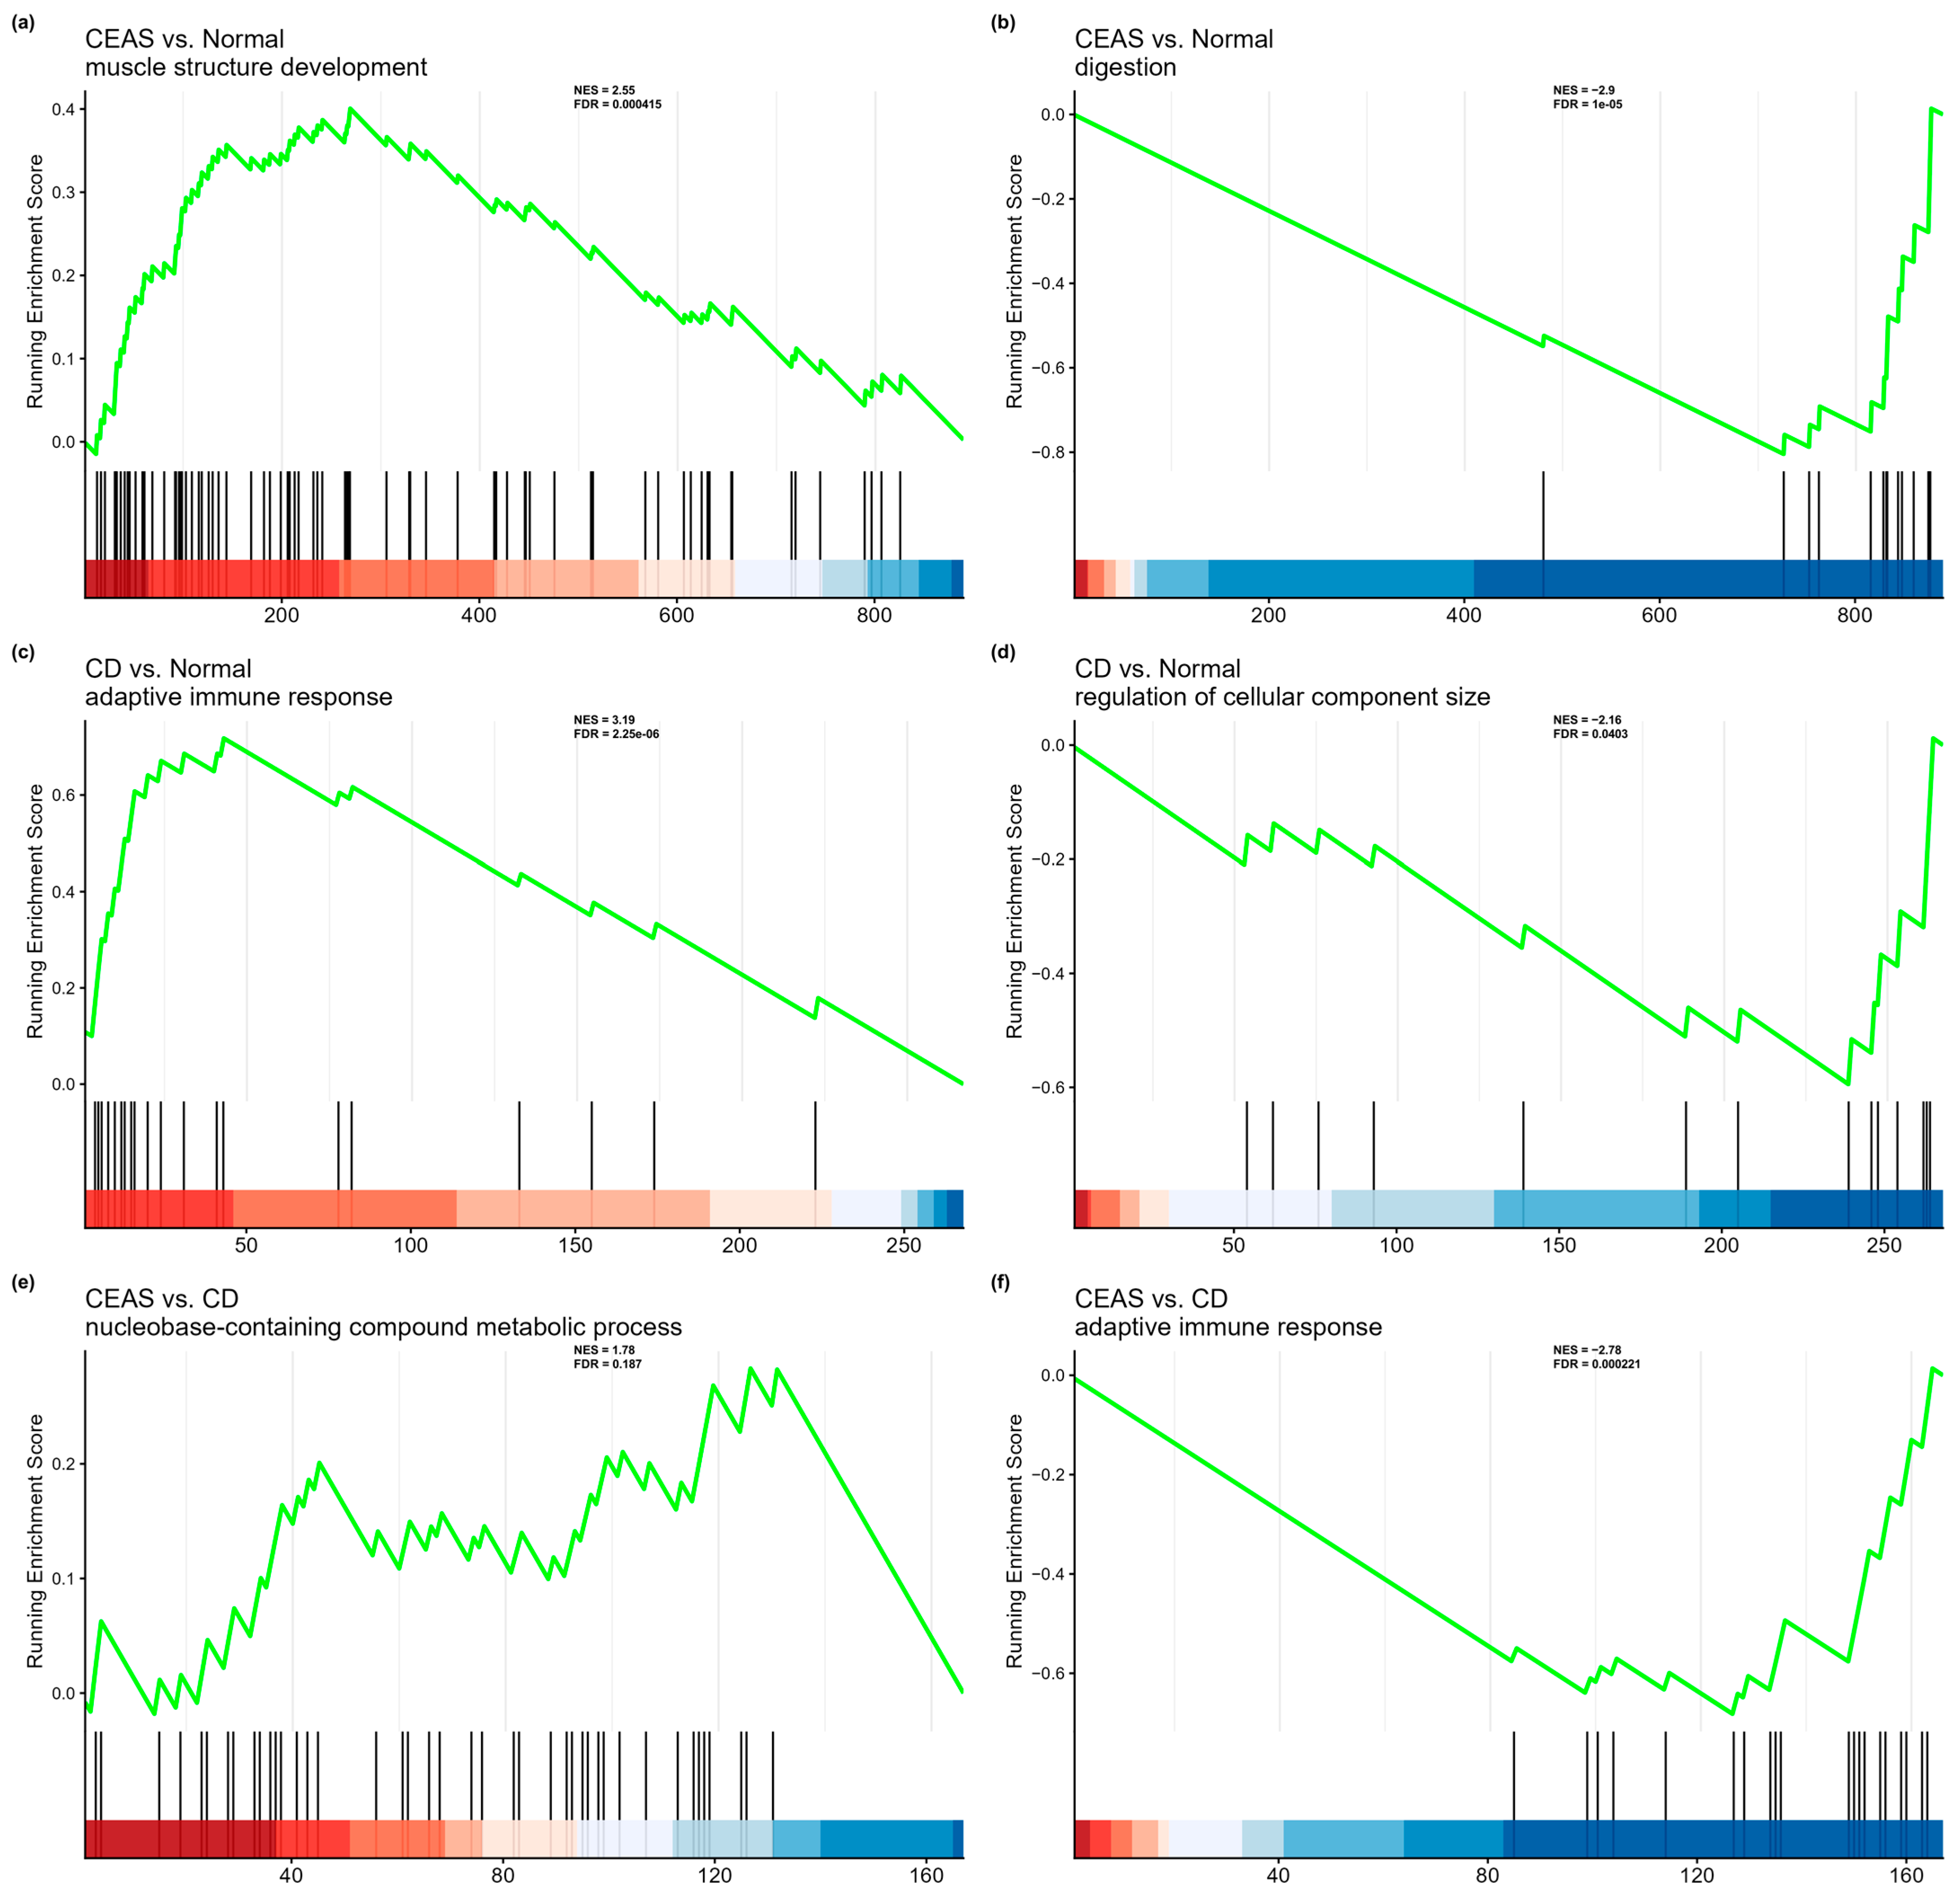
3.4. Gene Set Enrichment Analysis
3.5. Robustness Assessment by FDR Correction
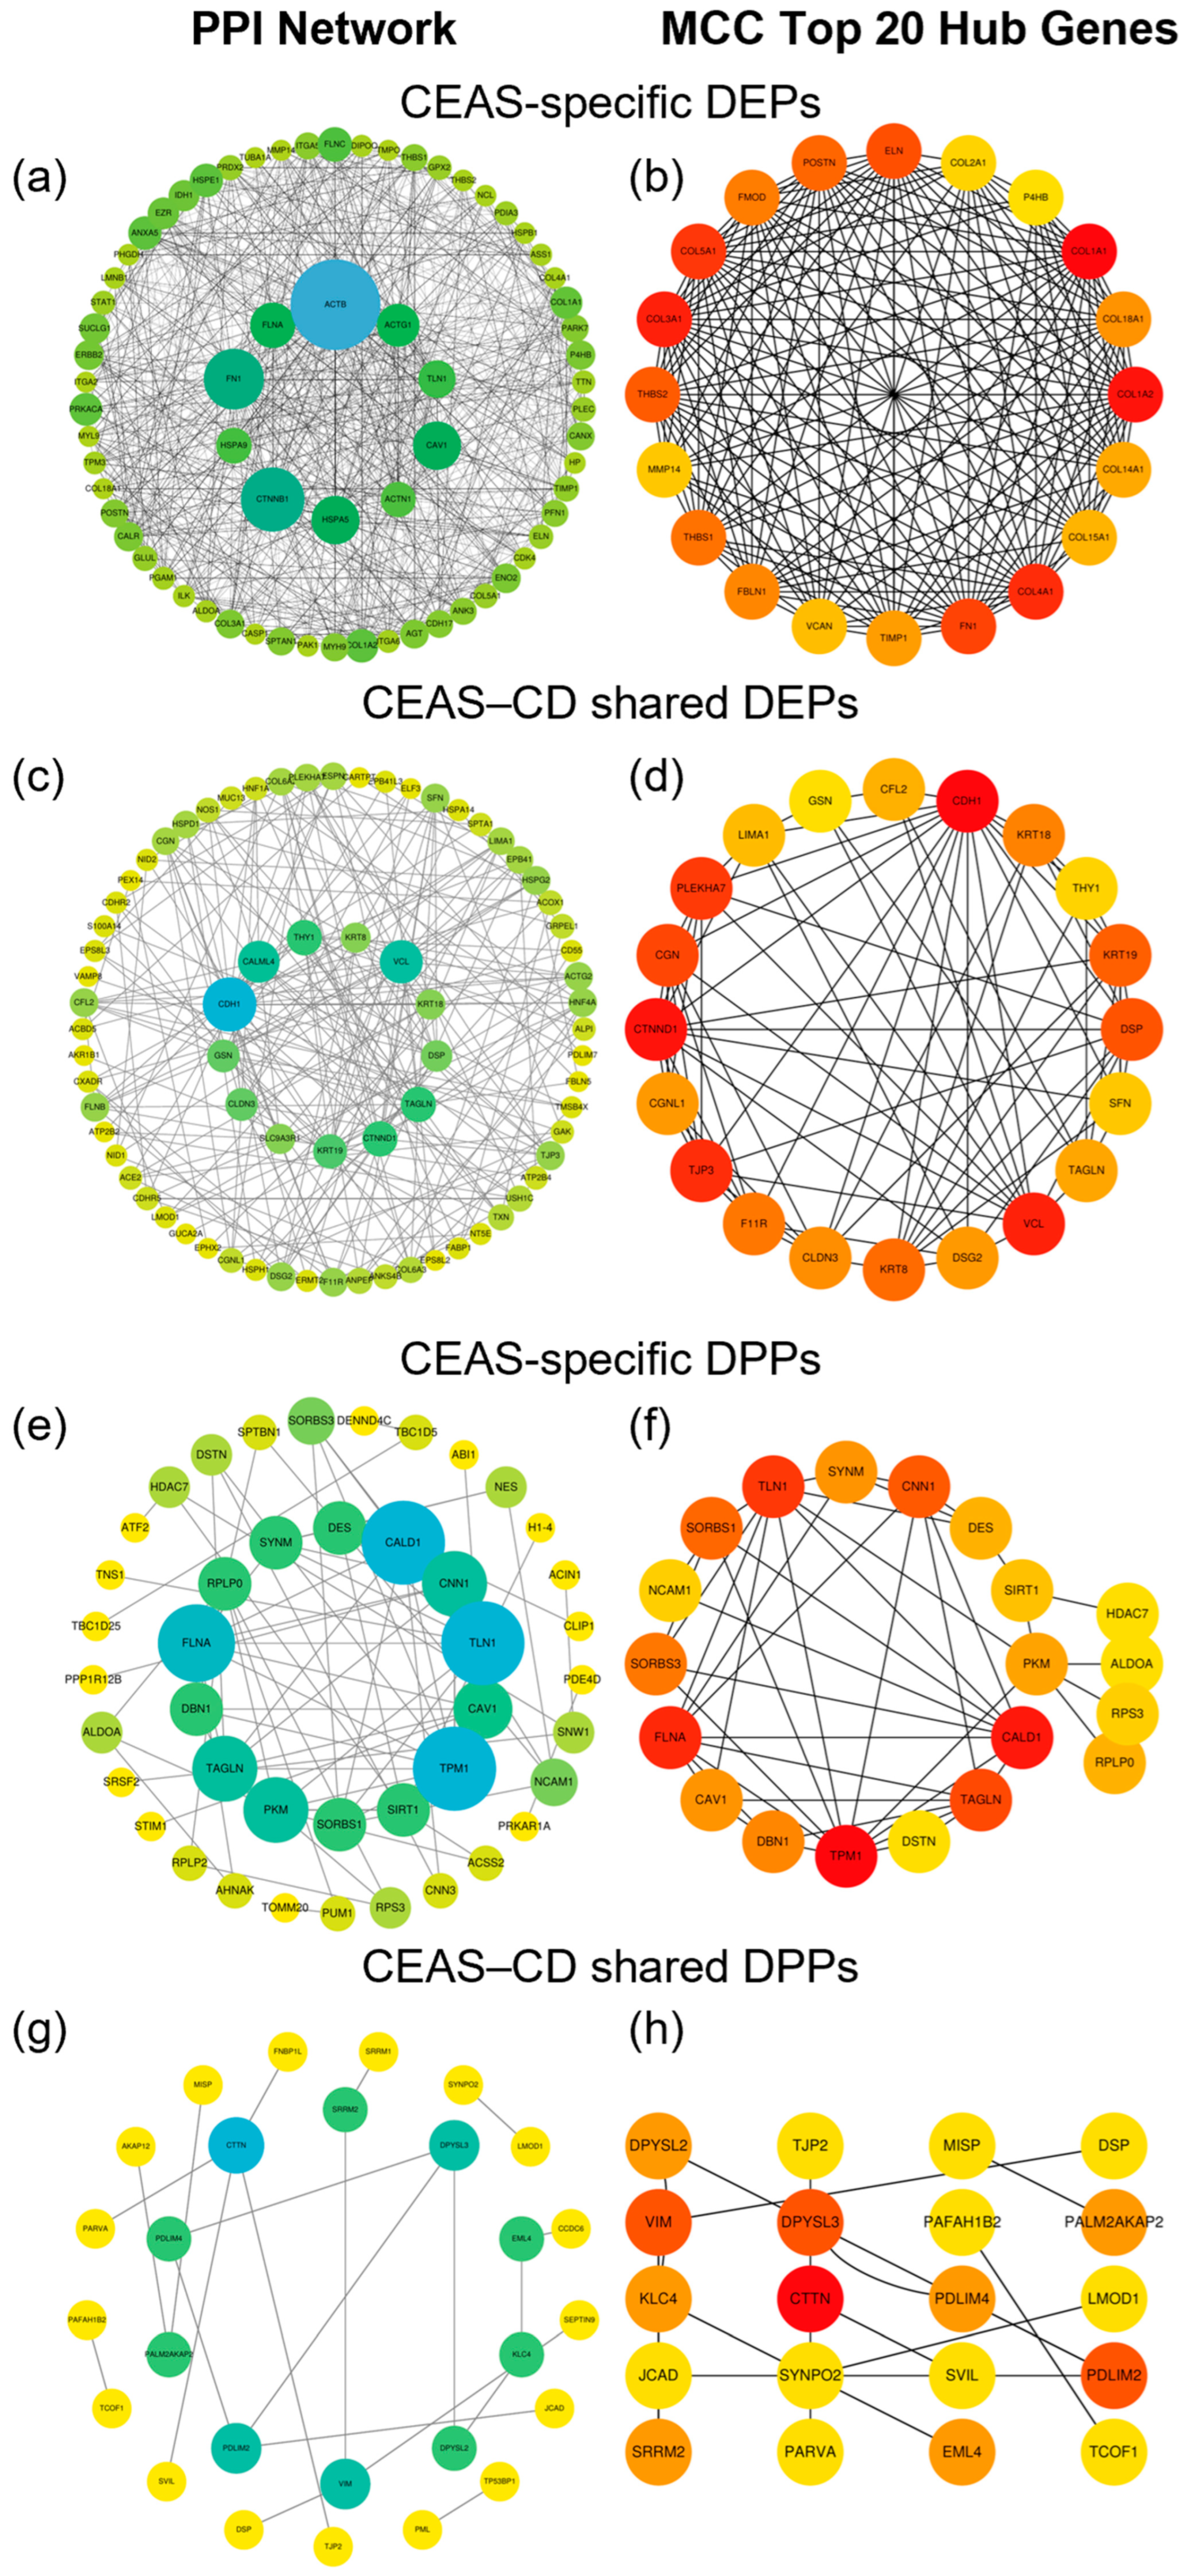
3.6. PPI Network and Hub Gene Analysis
3.7. Integrated Analysis of Proteomics and Phosphoproteomics
4. Discussion
Supplementary Materials
Author Contributions
Funding
Institutional Review Board Statement
Informed Consent Statement
Data Availability Statement
Conflicts of Interest
References
- Shang, Q.; Dai, Y.; Huang, J.; Liu, W.; Zhou, W.; Liu, Y.; Yang, H.; Wang, Q.; Li, Y. Clinical and genetic characteristics of Chinese patients diagnosed with chronic enteropathy associated with SLCO2A1 gene. Orphanet J. Rare Dis. 2024, 19, 201. [Google Scholar] [CrossRef] [Scilit] [PubMed]
- Umeno, J.; Esaki, M.; Hirano, A.; Fuyuno, Y.; Ohmiya, N.; Yasukawa, S.; Hirai, F.; Kochi, S.; Kurahara, K.; Yanai, S.; et al. Clinical features of chronic enteropathy associated with SLCO2A1 gene: A new entity clinically distinct from Crohn’s disease. J. Gastroenterol. 2018, 53, 907–915. [Google Scholar] [CrossRef] [Scilit] [PubMed]
- Matsuno, Y.; Umeno, J.; Esaki, M.; Hirakawa, Y.; Fuyuno, Y.; Okamoto, Y.; Hirano, A.; Yasukawa, S.; Hirai, F.; Matsui, T.; et al. Measurement of prostaglandin metabolites is useful in diagnosis of small bowel ulcerations. World J. Gastroenterol. 2019, 25, 1753–1763. [Google Scholar] [CrossRef] [Scilit] [PubMed]
- Seifert, W.; Kuhnisch, J.; Tuysuz, B.; Specker, C.; Brouwers, A.; Horn, D. Mutations in the prostaglandin transporter encoding gene SLCO2A1 cause primary hypertrophic osteoarthropathy and isolated digital clubbing. Hum. Mutat. 2012, 33, 660–664. [Google Scholar] [CrossRef] [Scilit] [PubMed]
- Umeno, J.; Hisamatsu, T.; Esaki, M.; Hirano, A.; Kubokura, N.; Asano, K.; Kochi, S.; Yanai, S.; Fuyuno, Y.; Shimamura, K.; et al. A Hereditary Enteropathy Caused by Mutations in the SLCO2A1 Gene, Encoding a Prostaglandin Transporter. PLoS Genet. 2015, 11, e1005581. [Google Scholar] [CrossRef] [Scilit] [PubMed]
- Xie, Z.X.; Li, Y.; Yang, A.M.; Wu, D.; Wang, Q. Pathogenesis of chronic enteropathy associated with the SLCO2A1 gene: Hypotheses and conundrums. World J. Gastroenterol. 2024, 30, 2505–2511. [Google Scholar] [CrossRef] [Scilit] [PubMed]
- Morris, G.M.; Huey, R.; Lindstrom, W.; Sanner, M.F.; Belew, R.K.; Goodsell, D.S.; Olson, A.J. AutoDock4 and AutoDockTools4: Automated docking with selective receptor flexibility. J. Comput. Chem. 2009, 30, 2785–2791. [Google Scholar] [CrossRef] [Scilit] [PubMed]
- Dolinger, M.; Torres, J.; Vermeire, S. Crohn’s disease. Lancet 2024, 403, 1177–1191. [Google Scholar] [CrossRef] [Scilit] [PubMed]
- Crawley, S.W.; Shifrin, D.A., Jr.; Grega-Larson, N.E.; McConnell, R.E.; Benesh, A.E.; Mao, S.; Zheng, Y.; Zheng, Q.Y.; Nam, K.T.; Millis, B.A.; et al. Intestinal brush border assembly driven by protocadherin-based intermicrovillar adhesion. Cell 2014, 157, 433–446. [Google Scholar] [CrossRef] [Scilit] [PubMed]
- Conway, S.J.; Izuhara, K.; Kudo, Y.; Litvin, J.; Markwald, R.; Ouyang, G.; Arron, J.R.; Holweg, C.T.; Kudo, A. The role of periostin in tissue remodeling across health and disease. Cell. Mol. Life Sci. 2014, 71, 1279–1288. [Google Scholar] [CrossRef] [Scilit] [PubMed]
- Mukanova, S.; Borissenko, A.; Kim, A.; Bolatbek, A.; Abdrakhmanova, A.; Vangelista, L.; Sonnenberg-Riethmacher, E.; Riethmacher, D. Role of periostin in inflammatory bowel disease development and synergistic effects mediated by the CCL5-CCR5 axis. Front. Immunol. 2022, 13, 956691. [Google Scholar] [CrossRef] [Scilit] [PubMed]
- Zhao, Y.; Lykov, N.; Tzeng, C. Talin-1 interaction network in cellular mechanotransduction (Review). Int. J. Mol. Med. 2022, 49, 60. [Google Scholar] [CrossRef] [Scilit] [PubMed]
- Lim, T.J.F.; Bunjamin, M.; Ruedl, C.; Su, I.H. Talin1 controls dendritic cell activation by regulating TLR complex assembly and signaling. J. Exp. Med. 2020, 217, e20191810. [Google Scholar] [CrossRef] [Scilit] [PubMed]
- Latour, Y.L.; McNamara, K.M.; Allaman, M.M.; Barry, D.P.; Smith, T.M.; Asim, M.; Williams, K.J.; Hawkins, C.V.; Jacobse, J.; Goettel, J.A.; et al. Myeloid deletion of talin-1 reduces mucosal macrophages and protects mice from colonic inflammation. Sci. Rep. 2023, 13, 22368. [Google Scholar] [CrossRef] [Scilit] [PubMed]
- Gumbiner, B.M. Regulation of cadherin-mediated adhesion in morphogenesis. Nat. Rev. Mol. Cell Biol. 2005, 6, 622–634. [Google Scholar] [CrossRef] [Scilit] [PubMed]
- Schneider, M.R.; Dahlhoff, M.; Horst, D.; Hirschi, B.; Trulzsch, K.; Muller-Hocker, J.; Vogelmann, R.; Allgauer, M.; Gerhard, M.; Steininger, S.; et al. A key role for E-cadherin in intestinal homeostasis and Paneth cell maturation. PLoS ONE 2010, 5, e14325. [Google Scholar] [CrossRef] [Scilit] [PubMed]
- Muise, A.M.; Walters, T.D.; Glowacka, W.K.; Griffiths, A.M.; Ngan, B.Y.; Lan, H.; Xu, W.; Silverberg, M.S.; Rotin, D. Polymorphisms in E-cadherin (CDH1) result in a mis-localised cytoplasmic protein that is associated with Crohn’s disease. Gut 2009, 58, 1121–1127. [Google Scholar] [CrossRef] [Scilit] [PubMed]
- Stevens, C.; Henderson, P.; Nimmo, E.R.; Soares, D.C.; Dogan, B.; Simpson, K.W.; Barrett, J.C.; International Inflammatory Bowel Disease Genetics Consortium; Wilson, D.C.; Satsangi, J. The intermediate filament protein, vimentin, is a regulator of NOD2 activity. Gut 2013, 62, 695–707. [Google Scholar] [CrossRef] [Scilit] [PubMed]
- Henderson, P.; Wilson, D.C.; Satsangi, J.; Stevens, C. A role for vimentin in Crohn disease. Autophagy 2012, 8, 1695–1696. [Google Scholar] [CrossRef] [Scilit] [PubMed]
- Gao, L.; Yu, Q.; Zhang, H.; Wang, Z.; Zhang, T.; Xiang, J.; Yu, S.; Zhang, S.; Wu, H.; Xu, Y.; et al. A resident stromal cell population actively restrains innate immune response in the propagation phase of colitis pathogenesis in mice. Sci. Transl. Med. 2021, 13, eabb5071. [Google Scholar] [CrossRef] [Scilit] [PubMed]
- Modl, B.; Schmidt, K.; Moser, D.; Eferl, R. The intermicrovillar adhesion complex in gut barrier function and inflammation. Explor. Dig. Dis. 2022, 1, 72–79. [Google Scholar] [CrossRef] [Scilit] [PubMed]
- Ma, Y.; Semba, S.; Khan, R.I.; Bochimoto, H.; Watanabe, T.; Fujiya, M.; Kohgo, Y.; Liu, Y.; Taniguchi, T. Focal adhesion kinase regulates intestinal epithelial barrier function via redistribution of tight junction. Biochim. Biophys. Acta 2013, 1832, 151–159. [Google Scholar] [CrossRef] [Scilit] [PubMed]
- Xie, H.; Jiao, Y.; Zhou, X.; Liao, X.; Chen, J.; Chen, H.; Chen, L.; Yu, S.; Deng, Q.; Sun, L.; et al. Integrin alphavbeta6 contributes to the development of intestinal fibrosis via the FAK/AKT signaling pathway. Exp. Cell Res. 2022, 411, 113003. [Google Scholar] [CrossRef] [Scilit] [PubMed]
- Malek, K.K.; Kumar, B.; Ahmad, R.; Singh, A.; Basson, M.D. Focal adhesion kinase: A promising regulator of colitis-associated healing. World J. Gastroenterol. 2025, 31, 105466. [Google Scholar] [CrossRef] [Scilit] [PubMed]
- Owen, K.A.; Abshire, M.Y.; Tilghman, R.W.; Casanova, J.E.; Bouton, A.H. FAK regulates intestinal epithelial cell survival and proliferation during mucosal wound healing. PLoS ONE 2011, 6, e23123. [Google Scholar] [CrossRef] [Scilit] [PubMed]



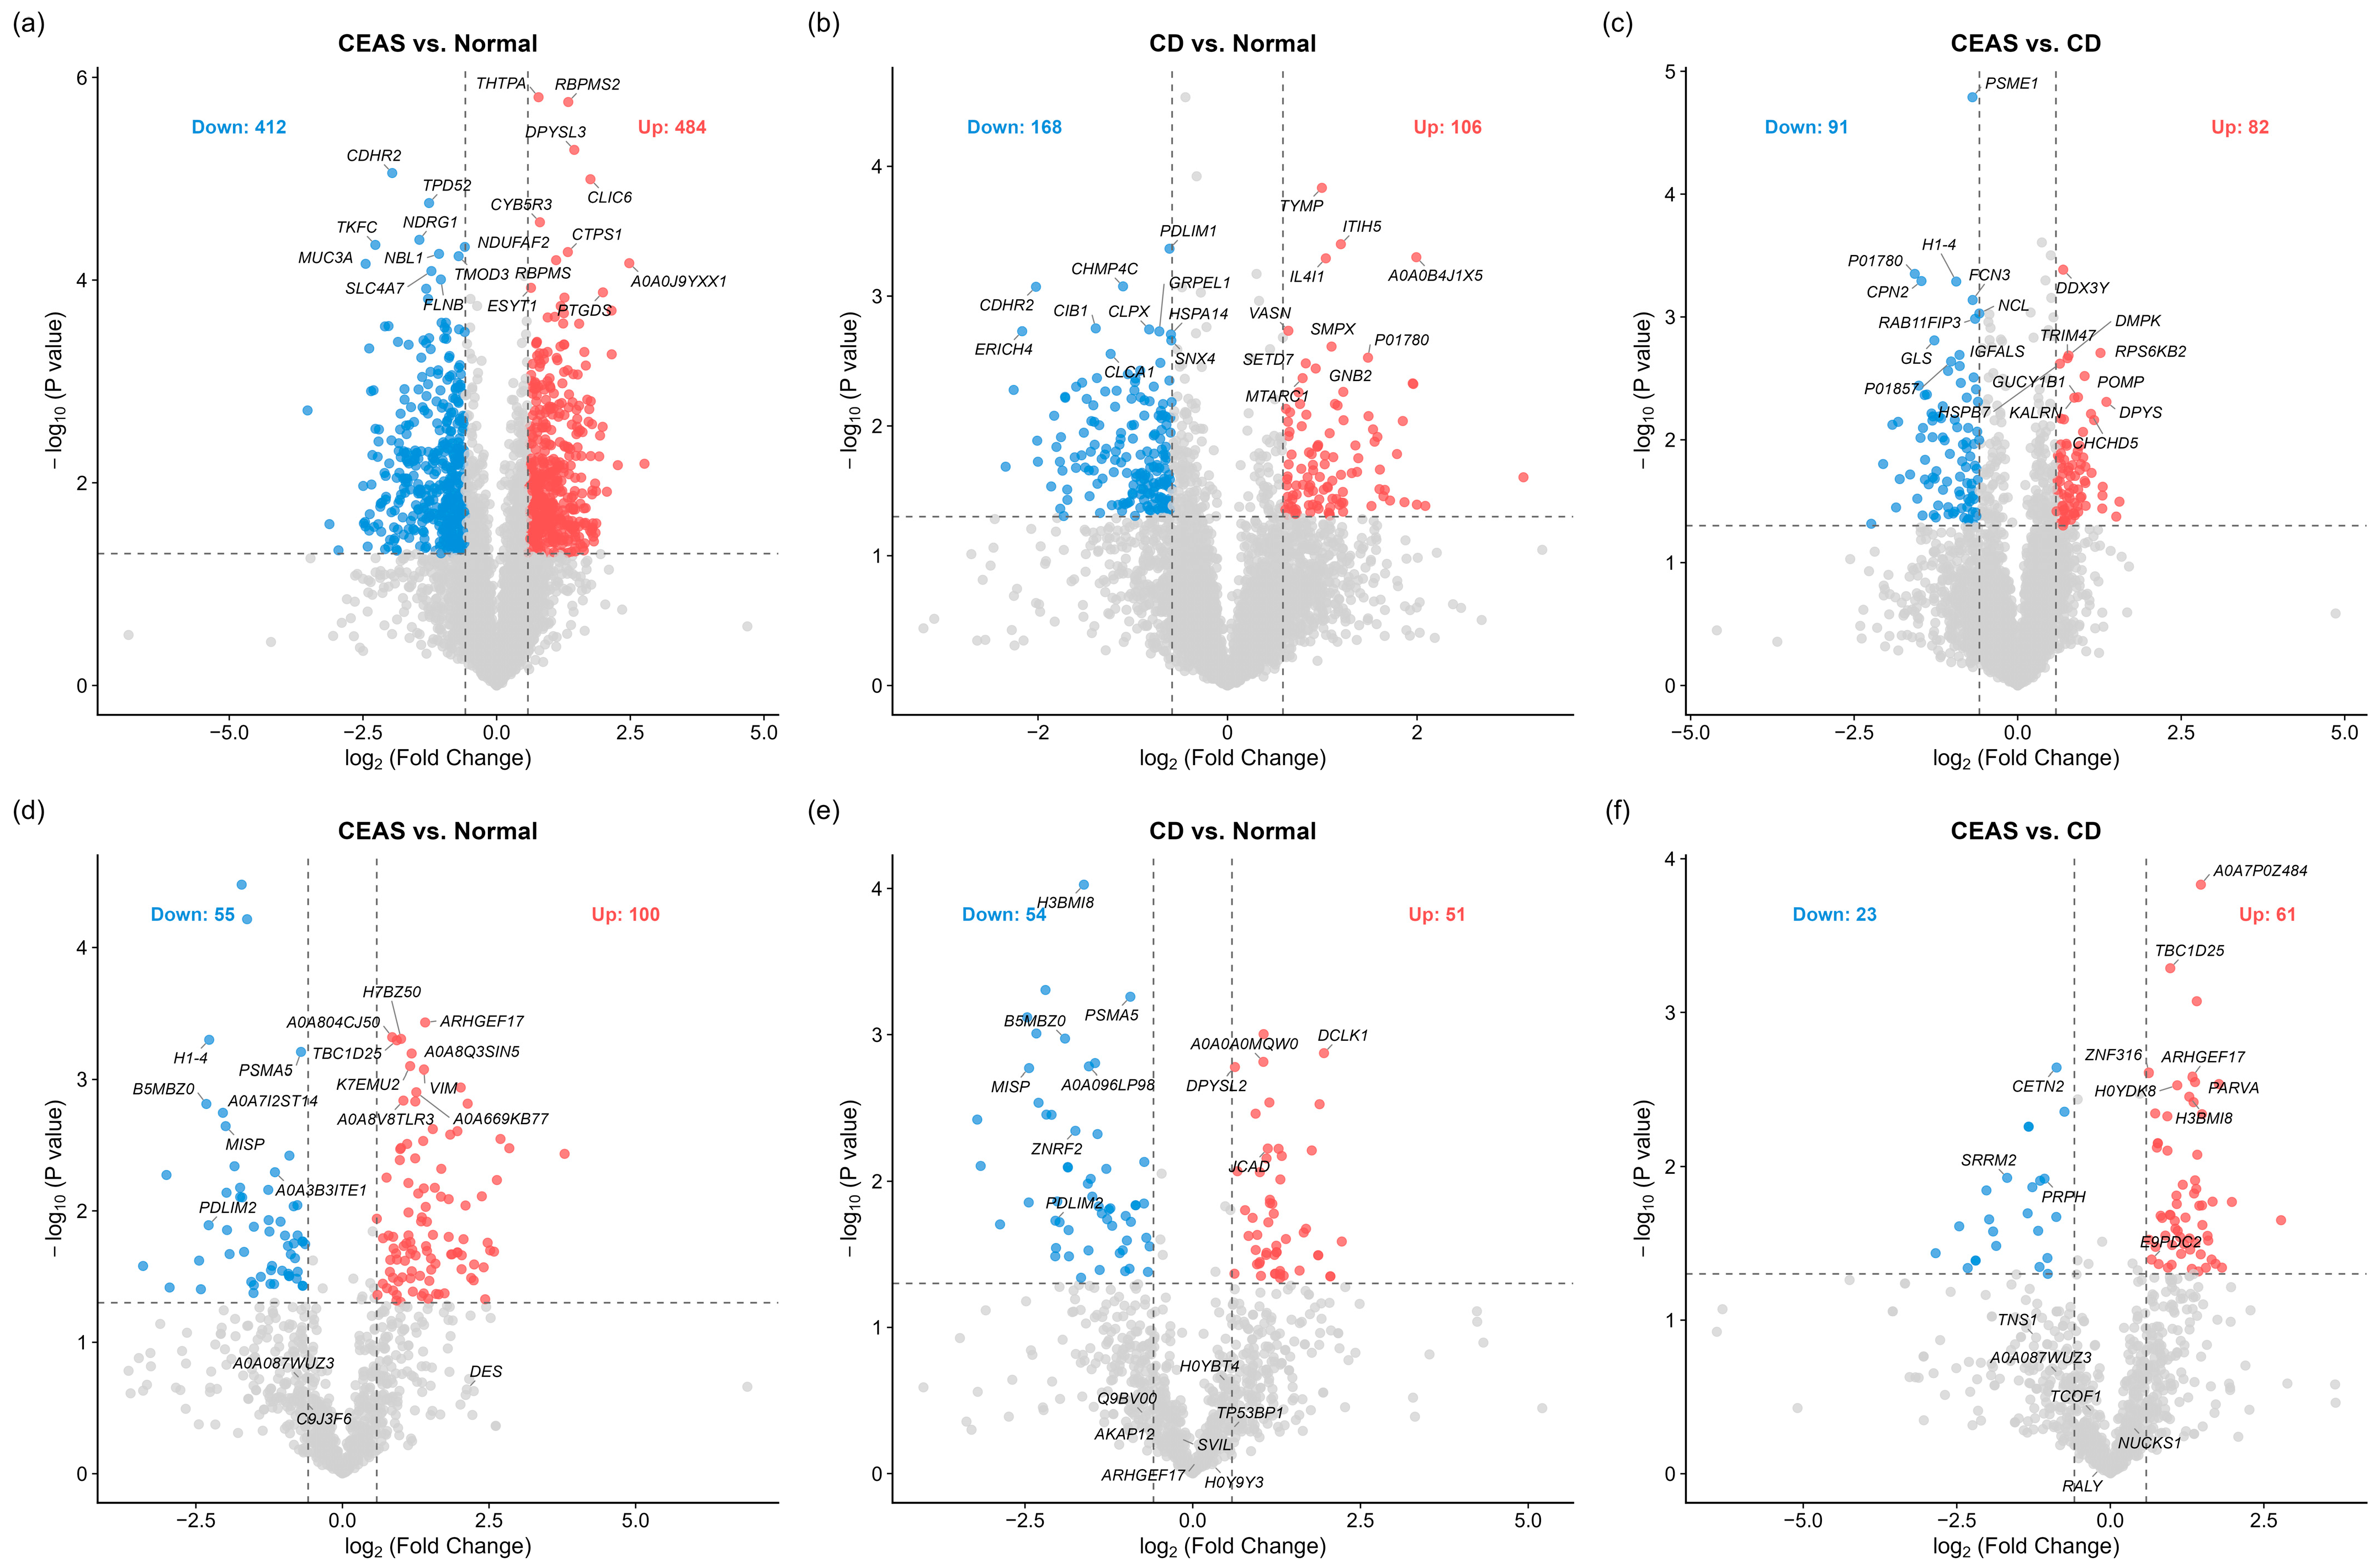
| Dataset | Comparison | Treatment | Control | Upregulated | Downregulated |
|---|---|---|---|---|---|
| Proteomics | 1 | CEAS | Normal | 484 | 416 |
| 2 | CD | Normal | 106 | 171 | |
| 3 | CEAS | CD | 82 | 93 | |
| Phosphoproteomics | 1 | CEAS | Normal | 100 * | 55 * |
| 2 | CD | Normal | 51 * | 54 * | |
| 3 | CEAS | CD | 61 * | 23 * |
| Cluster | Genes | Top Enriched Function | p-Value | Key Genes |
|---|---|---|---|---|
| 1 | 18 | H2O2 catabolic process | 5.20 × 10⁻¹¹ | HBB, HBA1, HBD, MPO |
| 2 | 23 | Ig-mediated immune response | 1.65 × 10⁻⁹ | IGHA1, IGKC, IGHG1 |
| 3 | 10 | Platelet aggregation | 6.27 × 10⁻⁶ | MYL9, MYH11, VCL |
| 4 | 25 | Glycolytic process | 3.17 × 10⁻⁶ | GAPDH, ENO1, ALDOA, PKM |
| 5 | 24 | Epithelial cell apoptotic process | 1.61 × 10⁻⁸ | FGA, FGB, FGG, KRT8 |
| Dataset | Comparison | Database | Total | Up | Down | Top Pathway (NES) |
|---|---|---|---|---|---|---|
| Proteomics | CEAS vs. Normal | GO BP | 145 | 79 | 66 | Digestion (−2.94) |
| Proteomics | CEAS vs. Normal | KEGG | 20 | 15 | 5 | Focal adhesion (2.22) |
| Proteomics | CD vs. Normal | GO BP | 16 | 11 | 5 | Adaptive immune (3.24) |
| Proteomics | CD vs. Normal | KEGG | 2 | 1 | 1 | Cytoskeleton (1.65) |
| Proteomics | CEAS vs. CD | GO BP | 27 | 5 | 22 | Adaptive immune (−2.78) |
| Proteomics | CEAS vs. CD | KEGG | 0 | — | — | — |
| Phosphoproteomics | CEAS vs. Normal | GO BP | 0 | — | — | — |
| Phosphoproteomics | CEAS vs. Normal | KEGG | 0 | — | — | — |
| Phosphoproteomics | CD vs. Normal | GO BP | 4 | 1 | 3 | Cellular localization (−1.98) |
| Phosphoproteomics | CD vs. Normal | KEGG | 0 | — | — | — |
| Phosphoproteomics | CEAS vs. CD | GO BP | 9 | 0 | 9 | Nucleic acid metabolic process (−2.15) |
| Phosphoproteomics | CEAS vs. CD | KEGG | 0 | — | — | — |
| (a) CEAS-Specific DEPs (648 Nodes) | |||||||
| Tied Rank | Gene | MCC Score | Degree | Ratio | Nominal p | q (BH) | FDR Status |
| 1 | COL1A1 | 2.72 × 10⁹ | 46 | 2.76 | 0.044 | 0.164 | No |
| 2 | COL1A2 | 2.72 × 10⁹ | 48 | 2.27 | 0.025 | 0.124 | No |
| 3 | COL3A1 | 2.71 × 10⁹ | 40 | 1.94 | 0.011 | 0.096 | Trend |
| 4 | COL4A1 | 2.70 × 10⁹ | 28 | 2.25 | 0.0017 | 0.051 | Trend |
| 5 | COL5A1 | 2.70 × 10⁹ | 33 | 2.54 | 0.037 | 0.148 | No |
| 6 | FN1 | 2.69 × 10⁹ | 94 | 1.67 | 0.021 | 0.117 | No |
| 7 | ELN | 2.58 × 10⁹ | 33 | 0.48 | 0.038 | 0.151 | No |
| 8 | THBS2 | 2.57 × 10⁹ | 28 | 3.05 | 0.043 | 0.162 | No |
| 9 | POSTN | 2.53 × 10⁹ | 39 | 3.47 | 0.028 | 0.130 | No |
| 10 | THBS1 | 1.59 × 10⁹ | 37 | 0.40 | 0.0068 | 0.081 | Trend |
| (b) CEAS–CD Shared DEPs (134 Nodes) | |||||||
| Tied Rank | Gene | MCC Score | Degree | Ratio | Nominal p | q (BH) | FDR Status |
| 1 | CDH1 | 569 | 28 | 0.35 | 0.0068 | 0.081 | Trend |
| 2 | CTNND1 | 421 | 14 | 0.63 | 0.020 | 0.115 | No |
| 3 | VCL | 387 | 20 | 1.72 | 0.033 | 0.142 | No |
| 4 | TJP3 | 360 | 9 | 0.44 | 0.0057 | 0.078 | Trend |
| 5 | PLEKHA7 | 288 | 8 | 0.49 | 0.031 | 0.137 | No |
| 6 | CGN | 240 | 8 | 0.34 | 0.021 | 0.117 | No |
| 7 | DSP | 224 | 11 | 0.44 | 0.0064 | 0.081 | Trend |
| 8 | KRT19 | 164 | 13 | 0.34 | 0.029 | 0.131 | No |
| 9 | KRT8 | 132 | 10 | 0.35 | 0.0051 | 0.075 | Trend |
| 10 | F11R | 109 | 9 | 0.41 | 0.0021 | 0.053 | Trend |
| (c) CEAS-Specific DPPs (43 Nodes) | |||||||
| Tied Rank | Gene | MCC Score | Degree | Ratio | Nominal p | q (BH) | FDR Status |
| 1 | TPM1 | 64 | 10 | 2.50 | 0.031 | 0.231 | No |
| 2 | CALD1 | 58 | 10 | 2.55 | 0.045 | 0.261 | No |
| 3 | FLNA | 49 | 9 | 3.34 | 0.042 | 0.257 | No |
| 4 | TLN1 | 39 | 10 | 2.27 | 0.029 | 0.223 | No |
| 5 | TAGLN | 38 | 7 | 5.73 | 0.020 | 0.199 | No |
| 6 | CNN1 | 29 | 7 | 3.89 | 0.0025 | 0.109 | No |
| 7 | SORBS1 | 26 | 5 | 2.98 | 0.0067 | 0.148 | No |
| 8 | SORBS3 | 24 | 4 | 2.69 | 0.019 | 0.199 | No |
| 9 | DBN1 | 13 | 5 | 1.83 | 0.019 | 0.199 | No |
| 10 | SYNM | 10 | 5 | 2.15 | 0.0031 | 0.111 | No |
| 10 | CAV1 | 10 | 6 | 2.56 | 0.011 | 0.183 | No |
| (d) CEAS–CD Shared DPPs (27 Nodes) | |||||||
| Tied Rank | Gene | MCC Score | Degree | Ratio | Nominal p | q (BH) | FDR Status |
| 1 | CTTN | 4 | 4 | 0.45 | 0.036 | 0.239 | No |
| 2 | VIM | 3 | 3 | 2.62 | 0.00085 | 0.071 | Trend |
| 2 | PDLIM2 | 3 | 3 | 0.32 | 6.1 × 10⁻⁵ | 0.028 | Yes |
| 2 | DPYSL3 | 3 | 3 | 1.89 | 0.021 | 0.199 | No |
| 5 | PDLIM4 | 2 | 2 | 6.21 | 0.0058 | 0.141 | No |
| 5 | KLC4 | 2 | 2 | 0.48 | 0.012 | 0.183 | No |
| 5 | DPYSL2 | 2 | 2 | 1.51 | 0.044 | 0.258 | No |
| 5 | EML4 | 2 | 2 | 0.20 | 0.0015 | 0.083 | Trend |
| 5 | PALM2AKAP2 | 2 | 2 | — | — | — | NQ |
| 5 | SRRM2 | 2 | 2 | 1.89 | 0.048 | 0.272 | No |
Disclaimer/Publisher’s Note: The statements, opinions and data contained in all publications are solely those of the individual author(s) and contributor(s) and not of MDPI and/or the editor(s). MDPI and/or the editor(s) disclaim responsibility for any injury to people or property resulting from any ideas, methods, instructions or products referred to in the content. |
© 2026 by the authors. Licensee MDPI, Basel, Switzerland. This article is an open access article distributed under the terms and conditions of the Creative Commons Attribution (CC BY) license.
Share and Cite
Xie, Z.; Han, T.; Wu, D.; Li, J.; Yang, A.; Li, Y.; Wang, Q. Integrative Proteomics and Phosphoproteomics Profiling of Chronic Enteropathy Associated with SLCO2A1 Gene Reveals Mucosal Barrier Impairment and Focal Adhesion Pathway Alterations. Biomedicines 2026, 14, 1412. https://doi.org/10.3390/biomedicines14071412
Xie Z, Han T, Wu D, Li J, Yang A, Li Y, Wang Q. Integrative Proteomics and Phosphoproteomics Profiling of Chronic Enteropathy Associated with SLCO2A1 Gene Reveals Mucosal Barrier Impairment and Focal Adhesion Pathway Alterations. Biomedicines. 2026; 14(7):1412. https://doi.org/10.3390/biomedicines14071412
Chicago/Turabian StyleXie, Zhixin, Taotao Han, Dong Wu, Jingnan Li, Aiming Yang, Yue Li, and Qiang Wang. 2026. "Integrative Proteomics and Phosphoproteomics Profiling of Chronic Enteropathy Associated with SLCO2A1 Gene Reveals Mucosal Barrier Impairment and Focal Adhesion Pathway Alterations" Biomedicines 14, no. 7: 1412. https://doi.org/10.3390/biomedicines14071412
APA StyleXie, Z., Han, T., Wu, D., Li, J., Yang, A., Li, Y., & Wang, Q. (2026). Integrative Proteomics and Phosphoproteomics Profiling of Chronic Enteropathy Associated with SLCO2A1 Gene Reveals Mucosal Barrier Impairment and Focal Adhesion Pathway Alterations. Biomedicines, 14(7), 1412. https://doi.org/10.3390/biomedicines14071412