Figure 1.
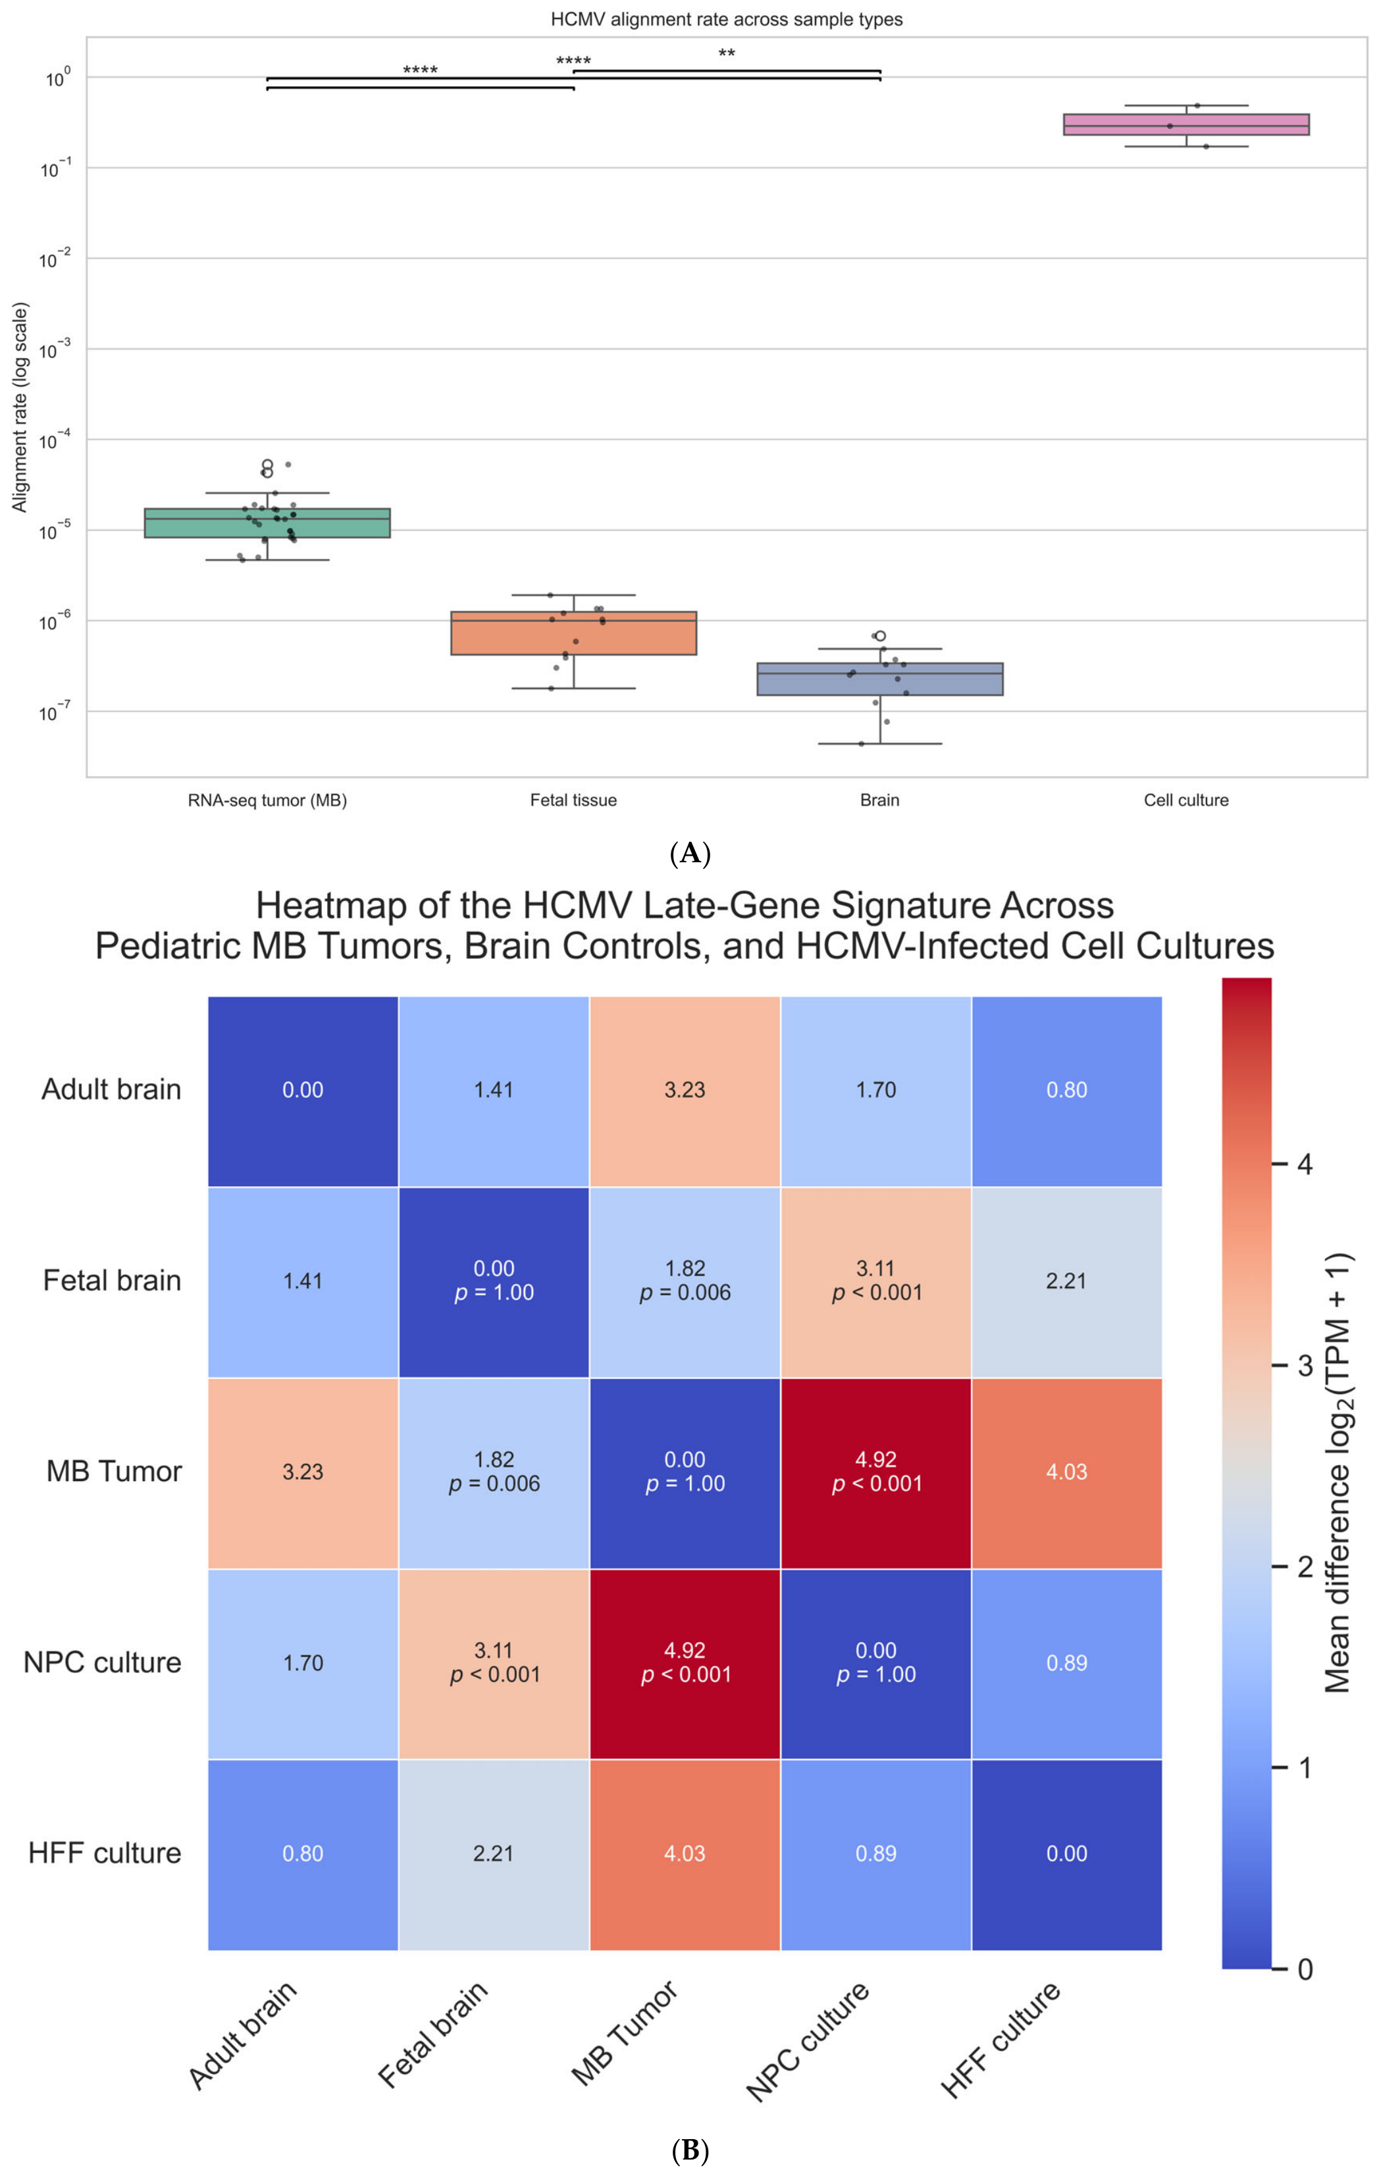
HCMV alignment rates and late-gene transcriptional signature across RNA-seq tumors compared with controls. (A) Kruskal–Wallis analysis revealed significant differences in HCMV alignment rates among sample groups (p = 1.31 × 10⁻⁹). Post hoc pairwise comparisons using Dunn’s test with Bonferroni correction showed clear stratification across conditions. Brain and fetal tissues did not differ significantly (p = 1.0), whereas both groups differed significantly from RNA-seq tumor (MB) samples (p < 0.01) and cell culture models (p < 0.001). Tumor (MB) samples also differed significantly from fetal and brain tissues but not from cell culture (p = 0.667), indicating partial overlap in viral signal distributions between tumor-derived RNA-seq data and in vitro infection systems. Overall, these results indicate a gradient of HCMV abundance, from background levels in neural tissues to elevated signals in tumor and cell culture conditions. Asterisks denote statistically significant differences (** p < 0.01, **** p < 0.001). (B) Heatmap of pairwise log2 fold changes of a composite HCMV late-gene expression signature (UL76, UL88, UL99), calculated as the mean expression across genes. Values represent relative differences between group-level means, with positive values indicating higher signature activity in the row group compared with the column group. Tumor samples exhibit a distinct HCMV-aligned transcriptional pattern compared with neural tissues and in vitro HCMV infection models. Quantitative analysis shows that tumor-derived viral transcript levels are significantly higher than in fetal brain tissue (log2FC = 1.82, p = 0.006) but lower than in in vitro infection systems, including human foreskin fibroblasts (HFF; log2FC = 4.03) and neural progenitor cells (NPC; log2FC = 4.92, p < 0.001). Adult brain samples show intermediate levels (log2FC = 3.23), suggesting a low-level HCMV-aligned transcriptional signal.
Figure 1.
HCMV alignment rates and late-gene transcriptional signature across RNA-seq tumors compared with controls. (A) Kruskal–Wallis analysis revealed significant differences in HCMV alignment rates among sample groups (p = 1.31 × 10⁻⁹). Post hoc pairwise comparisons using Dunn’s test with Bonferroni correction showed clear stratification across conditions. Brain and fetal tissues did not differ significantly (p = 1.0), whereas both groups differed significantly from RNA-seq tumor (MB) samples (p < 0.01) and cell culture models (p < 0.001). Tumor (MB) samples also differed significantly from fetal and brain tissues but not from cell culture (p = 0.667), indicating partial overlap in viral signal distributions between tumor-derived RNA-seq data and in vitro infection systems. Overall, these results indicate a gradient of HCMV abundance, from background levels in neural tissues to elevated signals in tumor and cell culture conditions. Asterisks denote statistically significant differences (** p < 0.01, **** p < 0.001). (B) Heatmap of pairwise log2 fold changes of a composite HCMV late-gene expression signature (UL76, UL88, UL99), calculated as the mean expression across genes. Values represent relative differences between group-level means, with positive values indicating higher signature activity in the row group compared with the column group. Tumor samples exhibit a distinct HCMV-aligned transcriptional pattern compared with neural tissues and in vitro HCMV infection models. Quantitative analysis shows that tumor-derived viral transcript levels are significantly higher than in fetal brain tissue (log2FC = 1.82, p = 0.006) but lower than in in vitro infection systems, including human foreskin fibroblasts (HFF; log2FC = 4.03) and neural progenitor cells (NPC; log2FC = 4.92, p < 0.001). Adult brain samples show intermediate levels (log2FC = 3.23), suggesting a low-level HCMV-aligned transcriptional signal.

Figure 2.
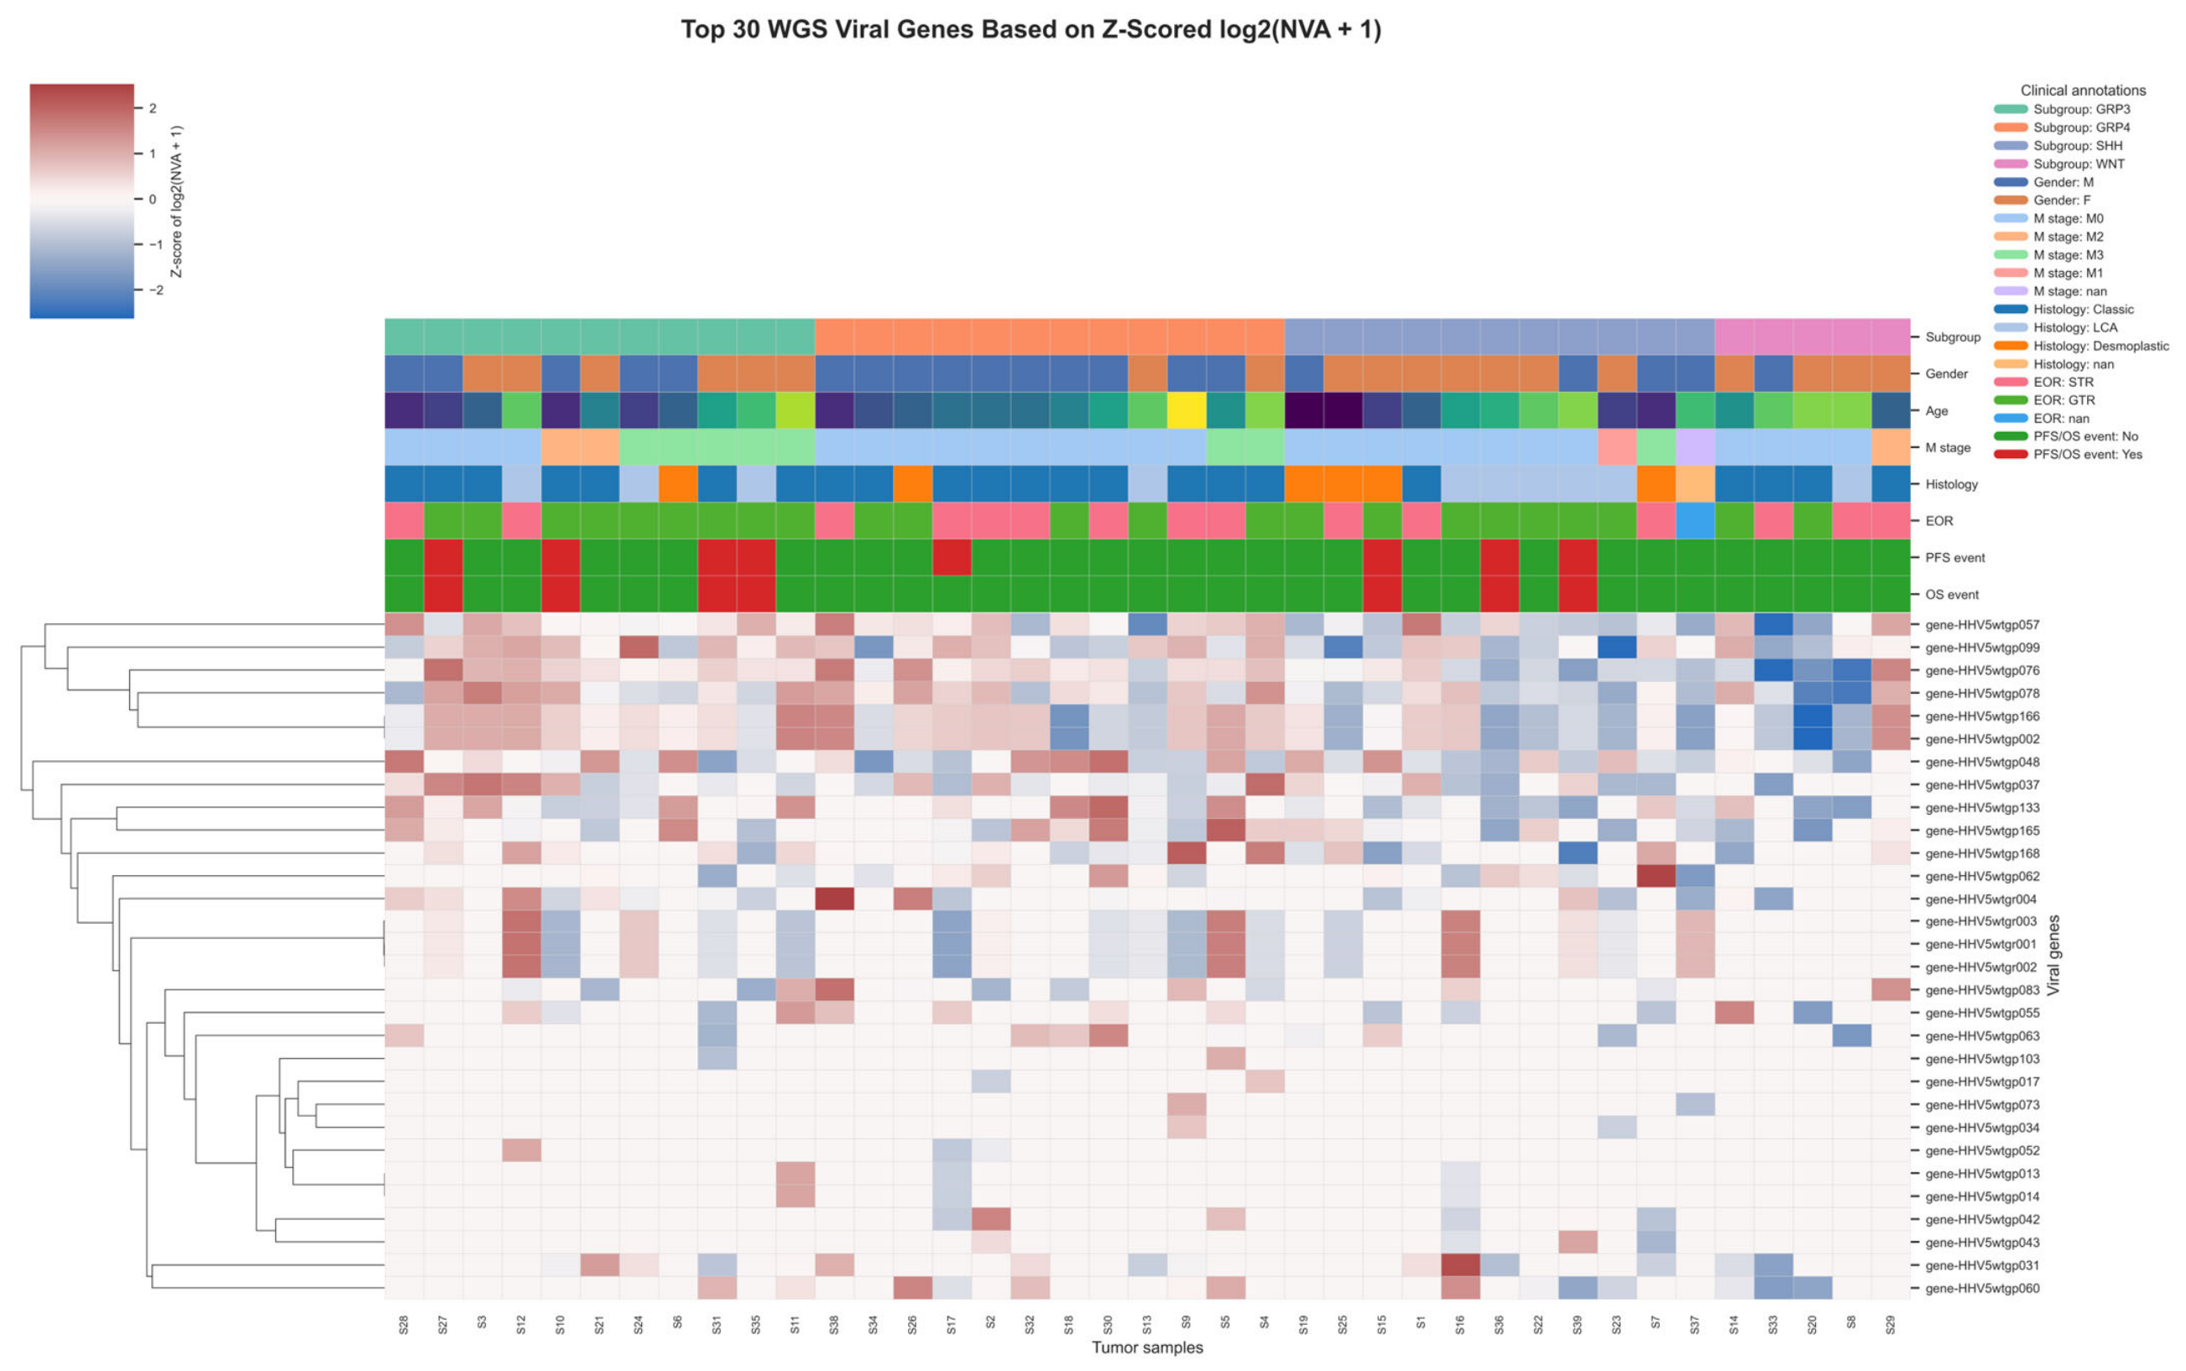
Genomic distribution of HCMV-associated signal across the WGS medulloblastoma cohort. Heatmap showing the top 30 most variable HCMV-associated loci based on z-score normalized log2-transformed normalized viral abundance values [log2(NVA + 1)] across 39 medulloblastoma whole-genome sequencing (WGS) samples. Hierarchical clustering was performed for both samples and viral loci to visualize relative patterns of HCMV-aligned genomic signal across the cohort. Samples are annotated according to molecular subgroup (Group 3, turquoise; Group 4, orange; SHH, violet; WNT, pink) and available clinical variables, including sex, age, metastatic stage (M0 vs. M1–M3), histological subtype, extent of resection (EOR), gross total resection (GTR), subtotal resection (STR), progression-free survival (PFS) event, and overall survival (OS) event. The heatmap demonstrates heterogeneous low-level HCMV-associated genomic signal across medulloblastoma samples, with recurrent enrichment of selected loci, including UL76, UL88, and UL99, particularly within subsets of Group 3 and Group 4 tumors. These findings support subgroup-associated variability in HCMV-aligned genomic signatures rather than evidence of uniform or high-level viral genomic abundance. Nan = not available data.
Figure 2.
Genomic distribution of HCMV-associated signal across the WGS medulloblastoma cohort. Heatmap showing the top 30 most variable HCMV-associated loci based on z-score normalized log2-transformed normalized viral abundance values [log2(NVA + 1)] across 39 medulloblastoma whole-genome sequencing (WGS) samples. Hierarchical clustering was performed for both samples and viral loci to visualize relative patterns of HCMV-aligned genomic signal across the cohort. Samples are annotated according to molecular subgroup (Group 3, turquoise; Group 4, orange; SHH, violet; WNT, pink) and available clinical variables, including sex, age, metastatic stage (M0 vs. M1–M3), histological subtype, extent of resection (EOR), gross total resection (GTR), subtotal resection (STR), progression-free survival (PFS) event, and overall survival (OS) event. The heatmap demonstrates heterogeneous low-level HCMV-associated genomic signal across medulloblastoma samples, with recurrent enrichment of selected loci, including UL76, UL88, and UL99, particularly within subsets of Group 3 and Group 4 tumors. These findings support subgroup-associated variability in HCMV-aligned genomic signatures rather than evidence of uniform or high-level viral genomic abundance. Nan = not available data.

Figure 3.
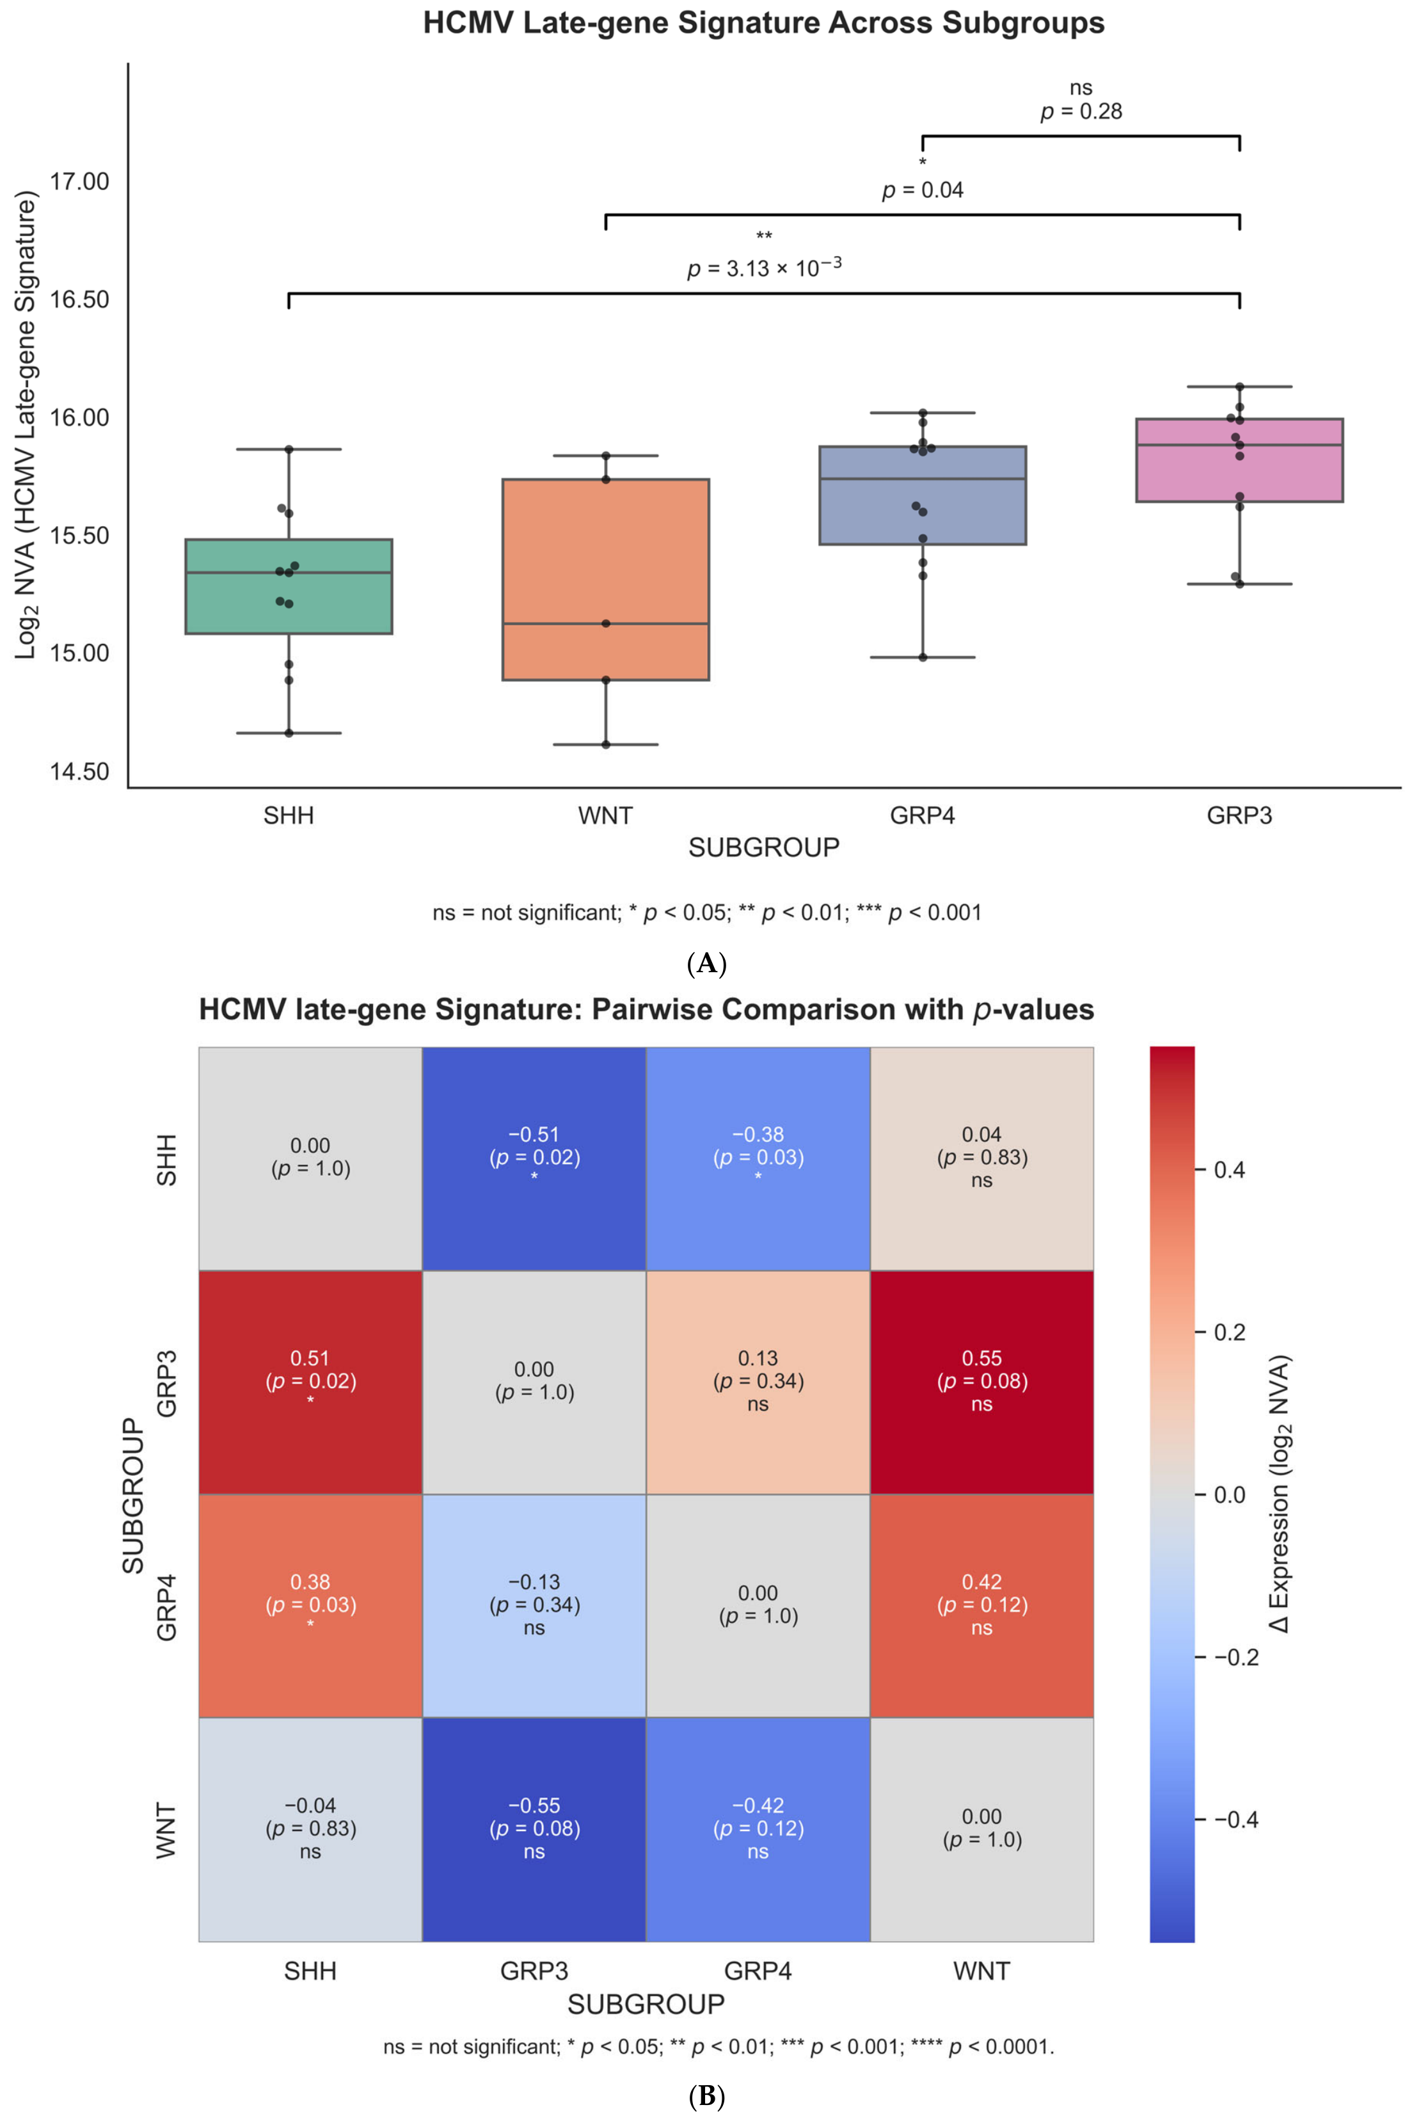
Subgroup-associated enrichment of the HCMV late-gene signature in the WGS cohort. Whole-genome sequencing (WGS) analysis of 39 pediatric medulloblastoma samples demonstrated subgroup-associated differences in the composite HCMV-associated late-gene signature derived from UL76, UL88, and UL99 loci [mean log2(NVA + 1)]. (A) Upper panel: Boxplots comparing the distribution of the composite HCMV-associated late-gene signal across molecular subgroups. Kruskal–Wallis analysis showed significant overall differences among subgroups (p = 0.042). Group 3 tumors exhibited higher composite signal than SHH tumors (mean ranks: 27.45 vs. 12.00; unadjusted p = 0.004; adjusted p = 0.011). A similar trend was observed between Group 3 (GRP3) and WNT tumors, although this difference was not statistically significant after correction for multiple testing (unadjusted p = 0.014, adjusted p = 0.086). (B) Lower panel: Comparative heatmap of subgroup-level composite HCMV-associated late-gene signal demonstrating relative enrichment in Group 3 tumors compared with SHH and WNT tumors. Fold-change analyses showed increased signal in Group 3 relative to SHH (fold change = 0.51, p = 0.003) and WNT tumors (fold change = 0.55, p = 0.038). Overall, these findings indicate heterogeneous but recurrent low-level enrichment of HCMV-associated genomic signal across medulloblastoma subgroups, with the strongest relative enrichment observed in Group 3 tumors. GRP3 = Group 3 MB tumors, GRP4 = Group 4 MB tumors.
Figure 3.
Subgroup-associated enrichment of the HCMV late-gene signature in the WGS cohort. Whole-genome sequencing (WGS) analysis of 39 pediatric medulloblastoma samples demonstrated subgroup-associated differences in the composite HCMV-associated late-gene signature derived from UL76, UL88, and UL99 loci [mean log2(NVA + 1)]. (A) Upper panel: Boxplots comparing the distribution of the composite HCMV-associated late-gene signal across molecular subgroups. Kruskal–Wallis analysis showed significant overall differences among subgroups (p = 0.042). Group 3 tumors exhibited higher composite signal than SHH tumors (mean ranks: 27.45 vs. 12.00; unadjusted p = 0.004; adjusted p = 0.011). A similar trend was observed between Group 3 (GRP3) and WNT tumors, although this difference was not statistically significant after correction for multiple testing (unadjusted p = 0.014, adjusted p = 0.086). (B) Lower panel: Comparative heatmap of subgroup-level composite HCMV-associated late-gene signal demonstrating relative enrichment in Group 3 tumors compared with SHH and WNT tumors. Fold-change analyses showed increased signal in Group 3 relative to SHH (fold change = 0.51, p = 0.003) and WNT tumors (fold change = 0.55, p = 0.038). Overall, these findings indicate heterogeneous but recurrent low-level enrichment of HCMV-associated genomic signal across medulloblastoma subgroups, with the strongest relative enrichment observed in Group 3 tumors. GRP3 = Group 3 MB tumors, GRP4 = Group 4 MB tumors.

Figure 4.
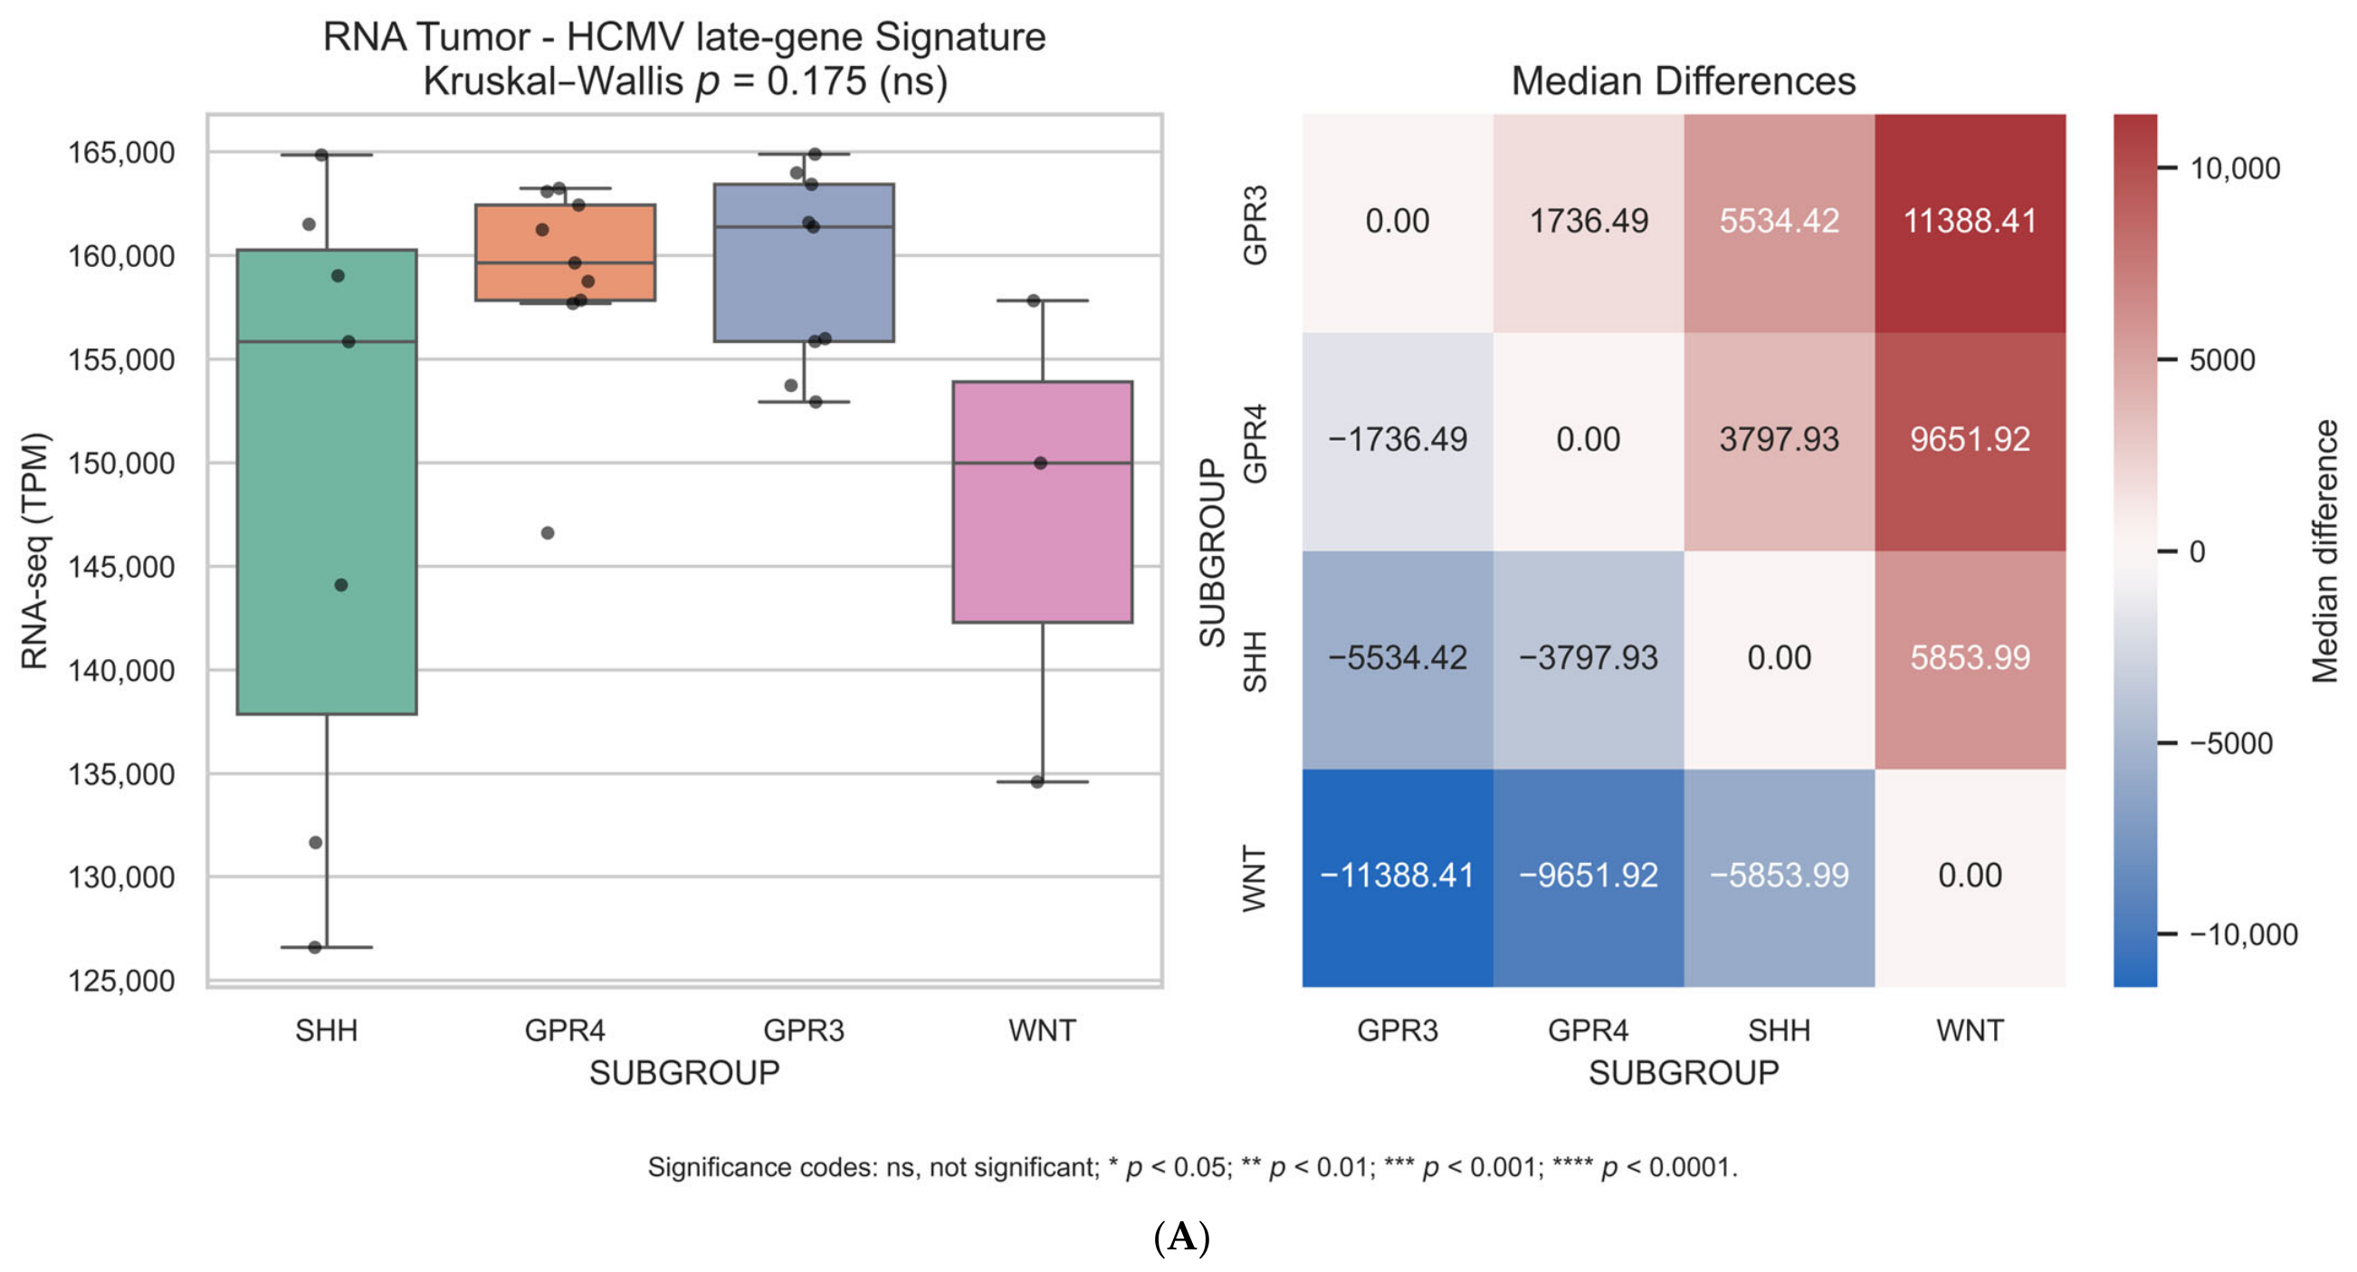
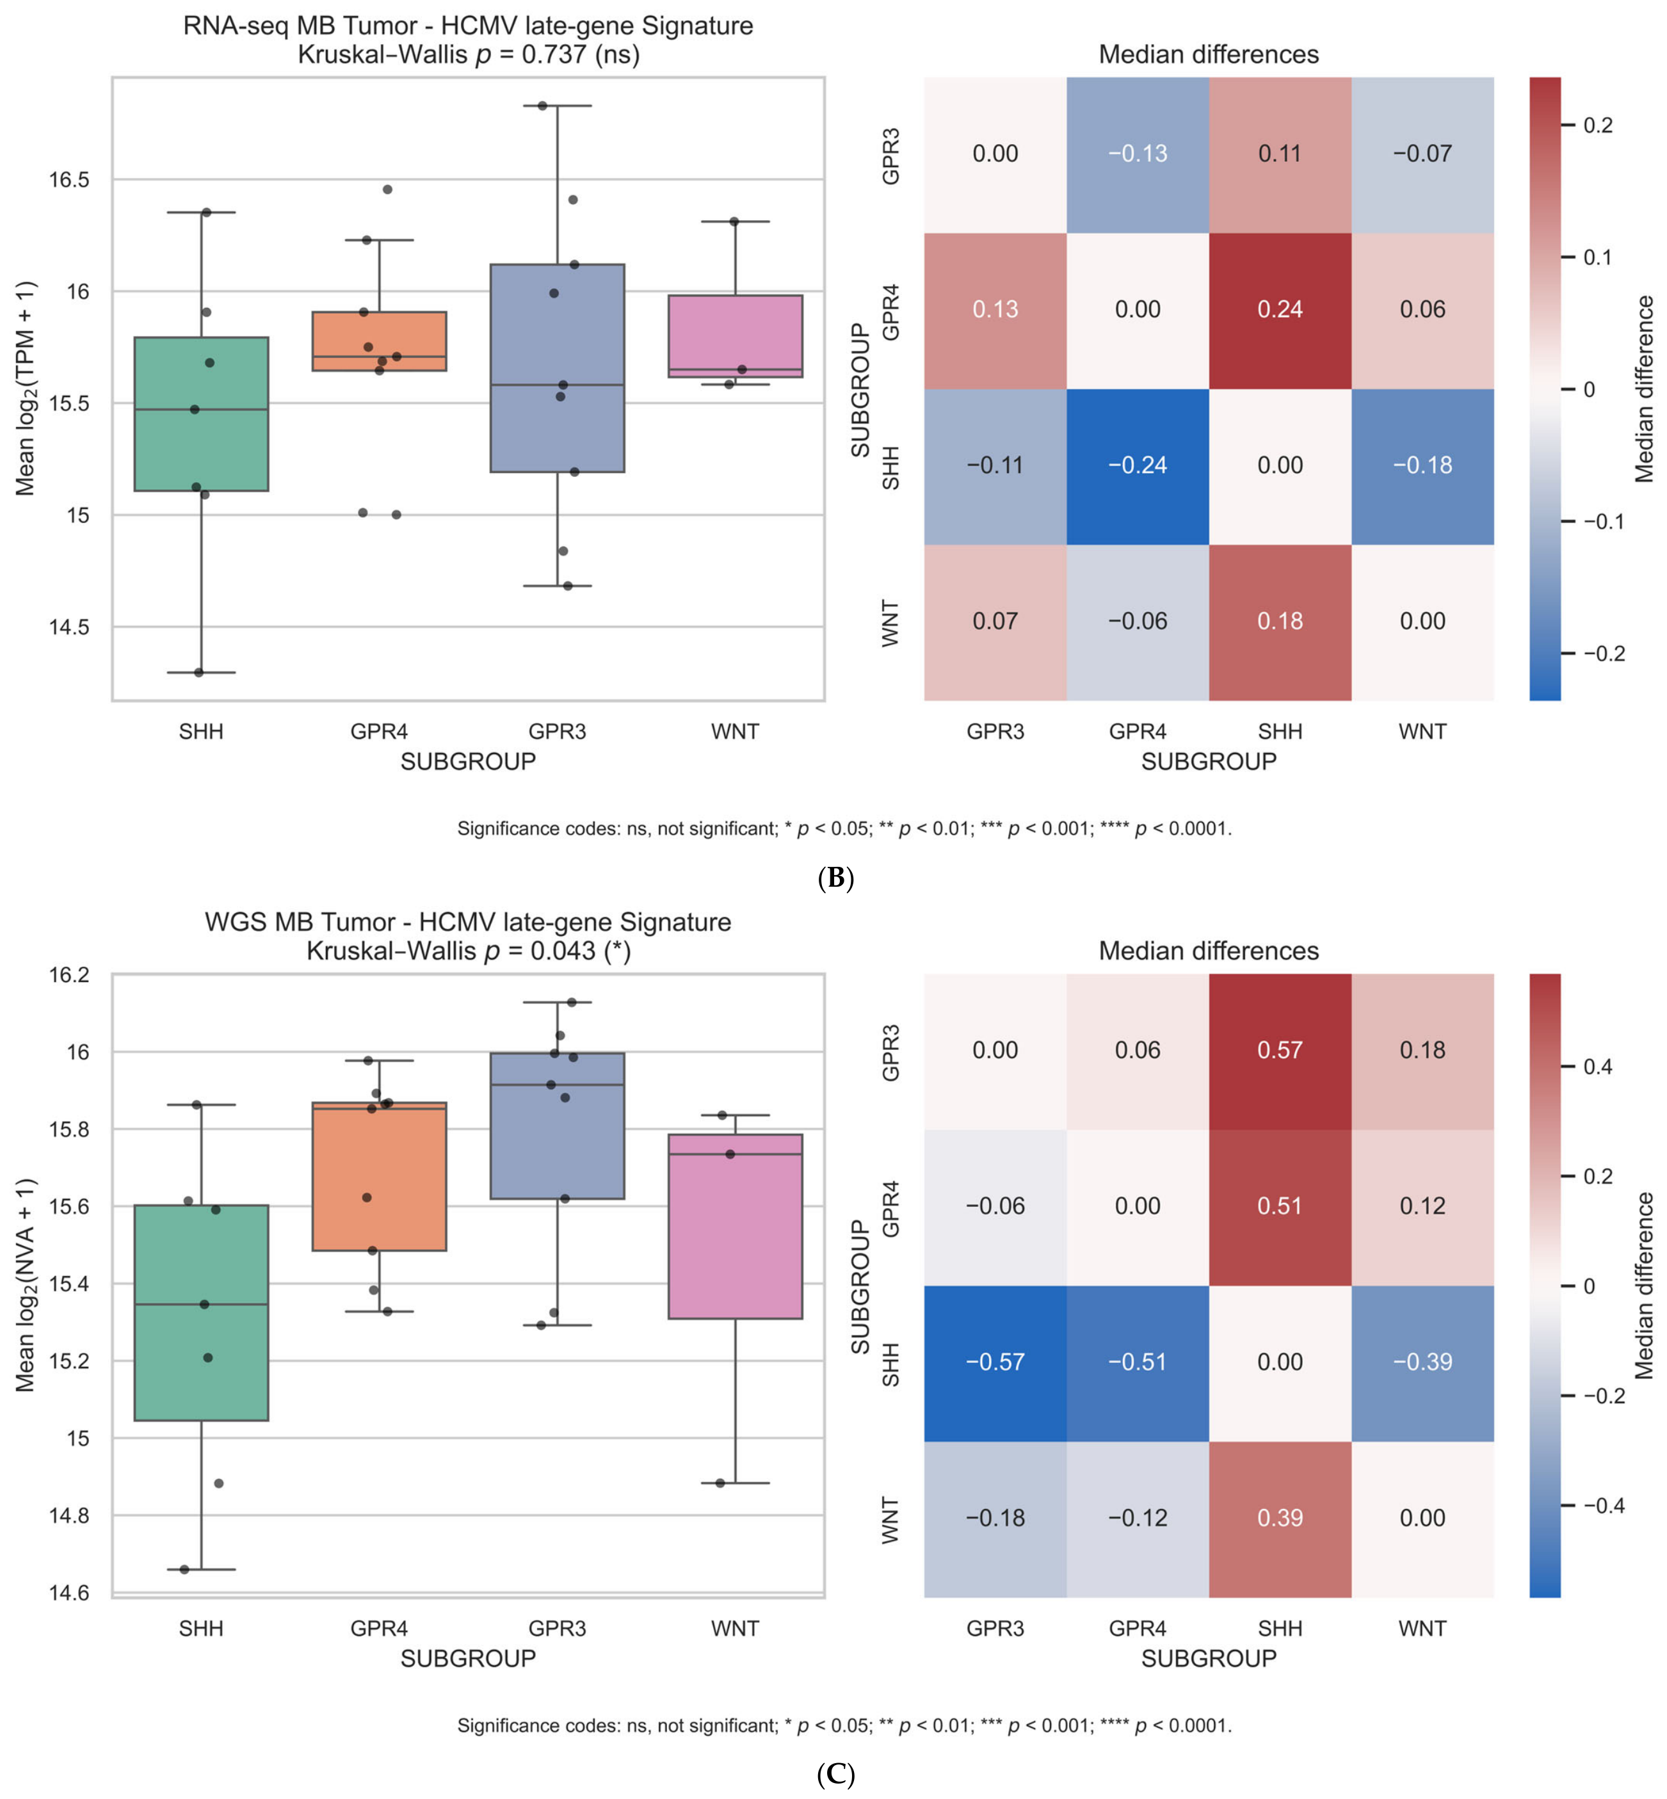
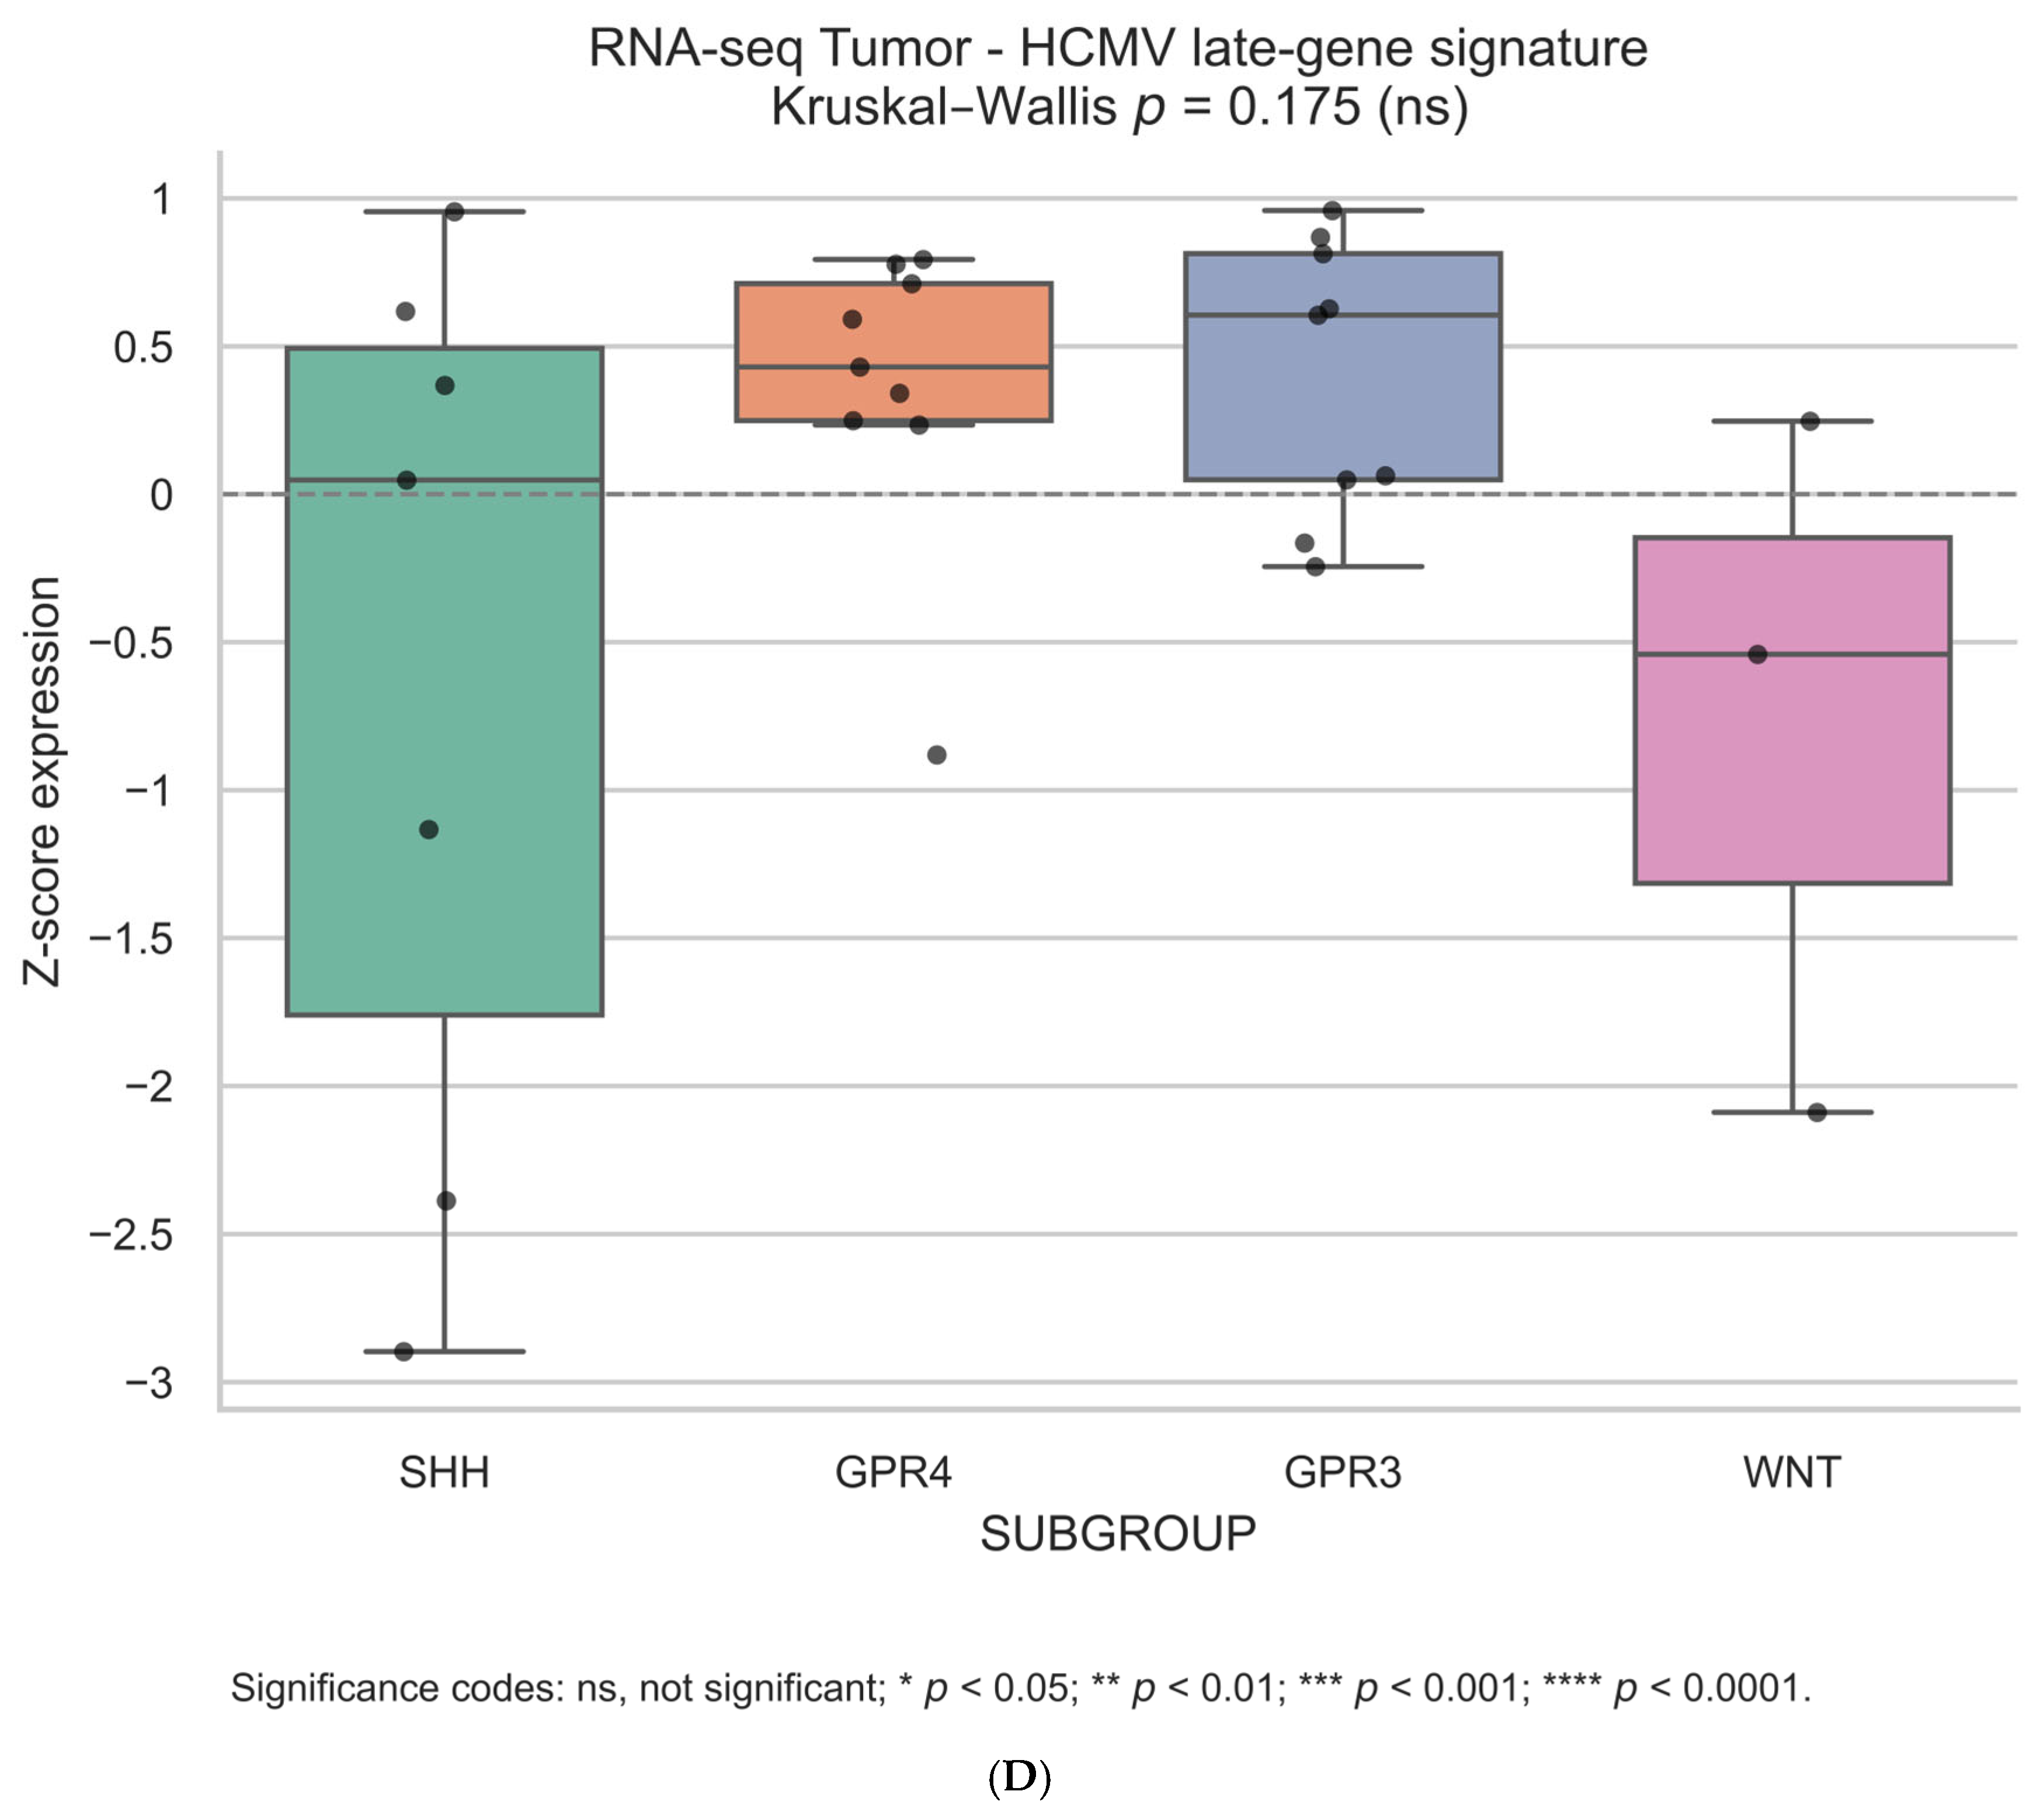
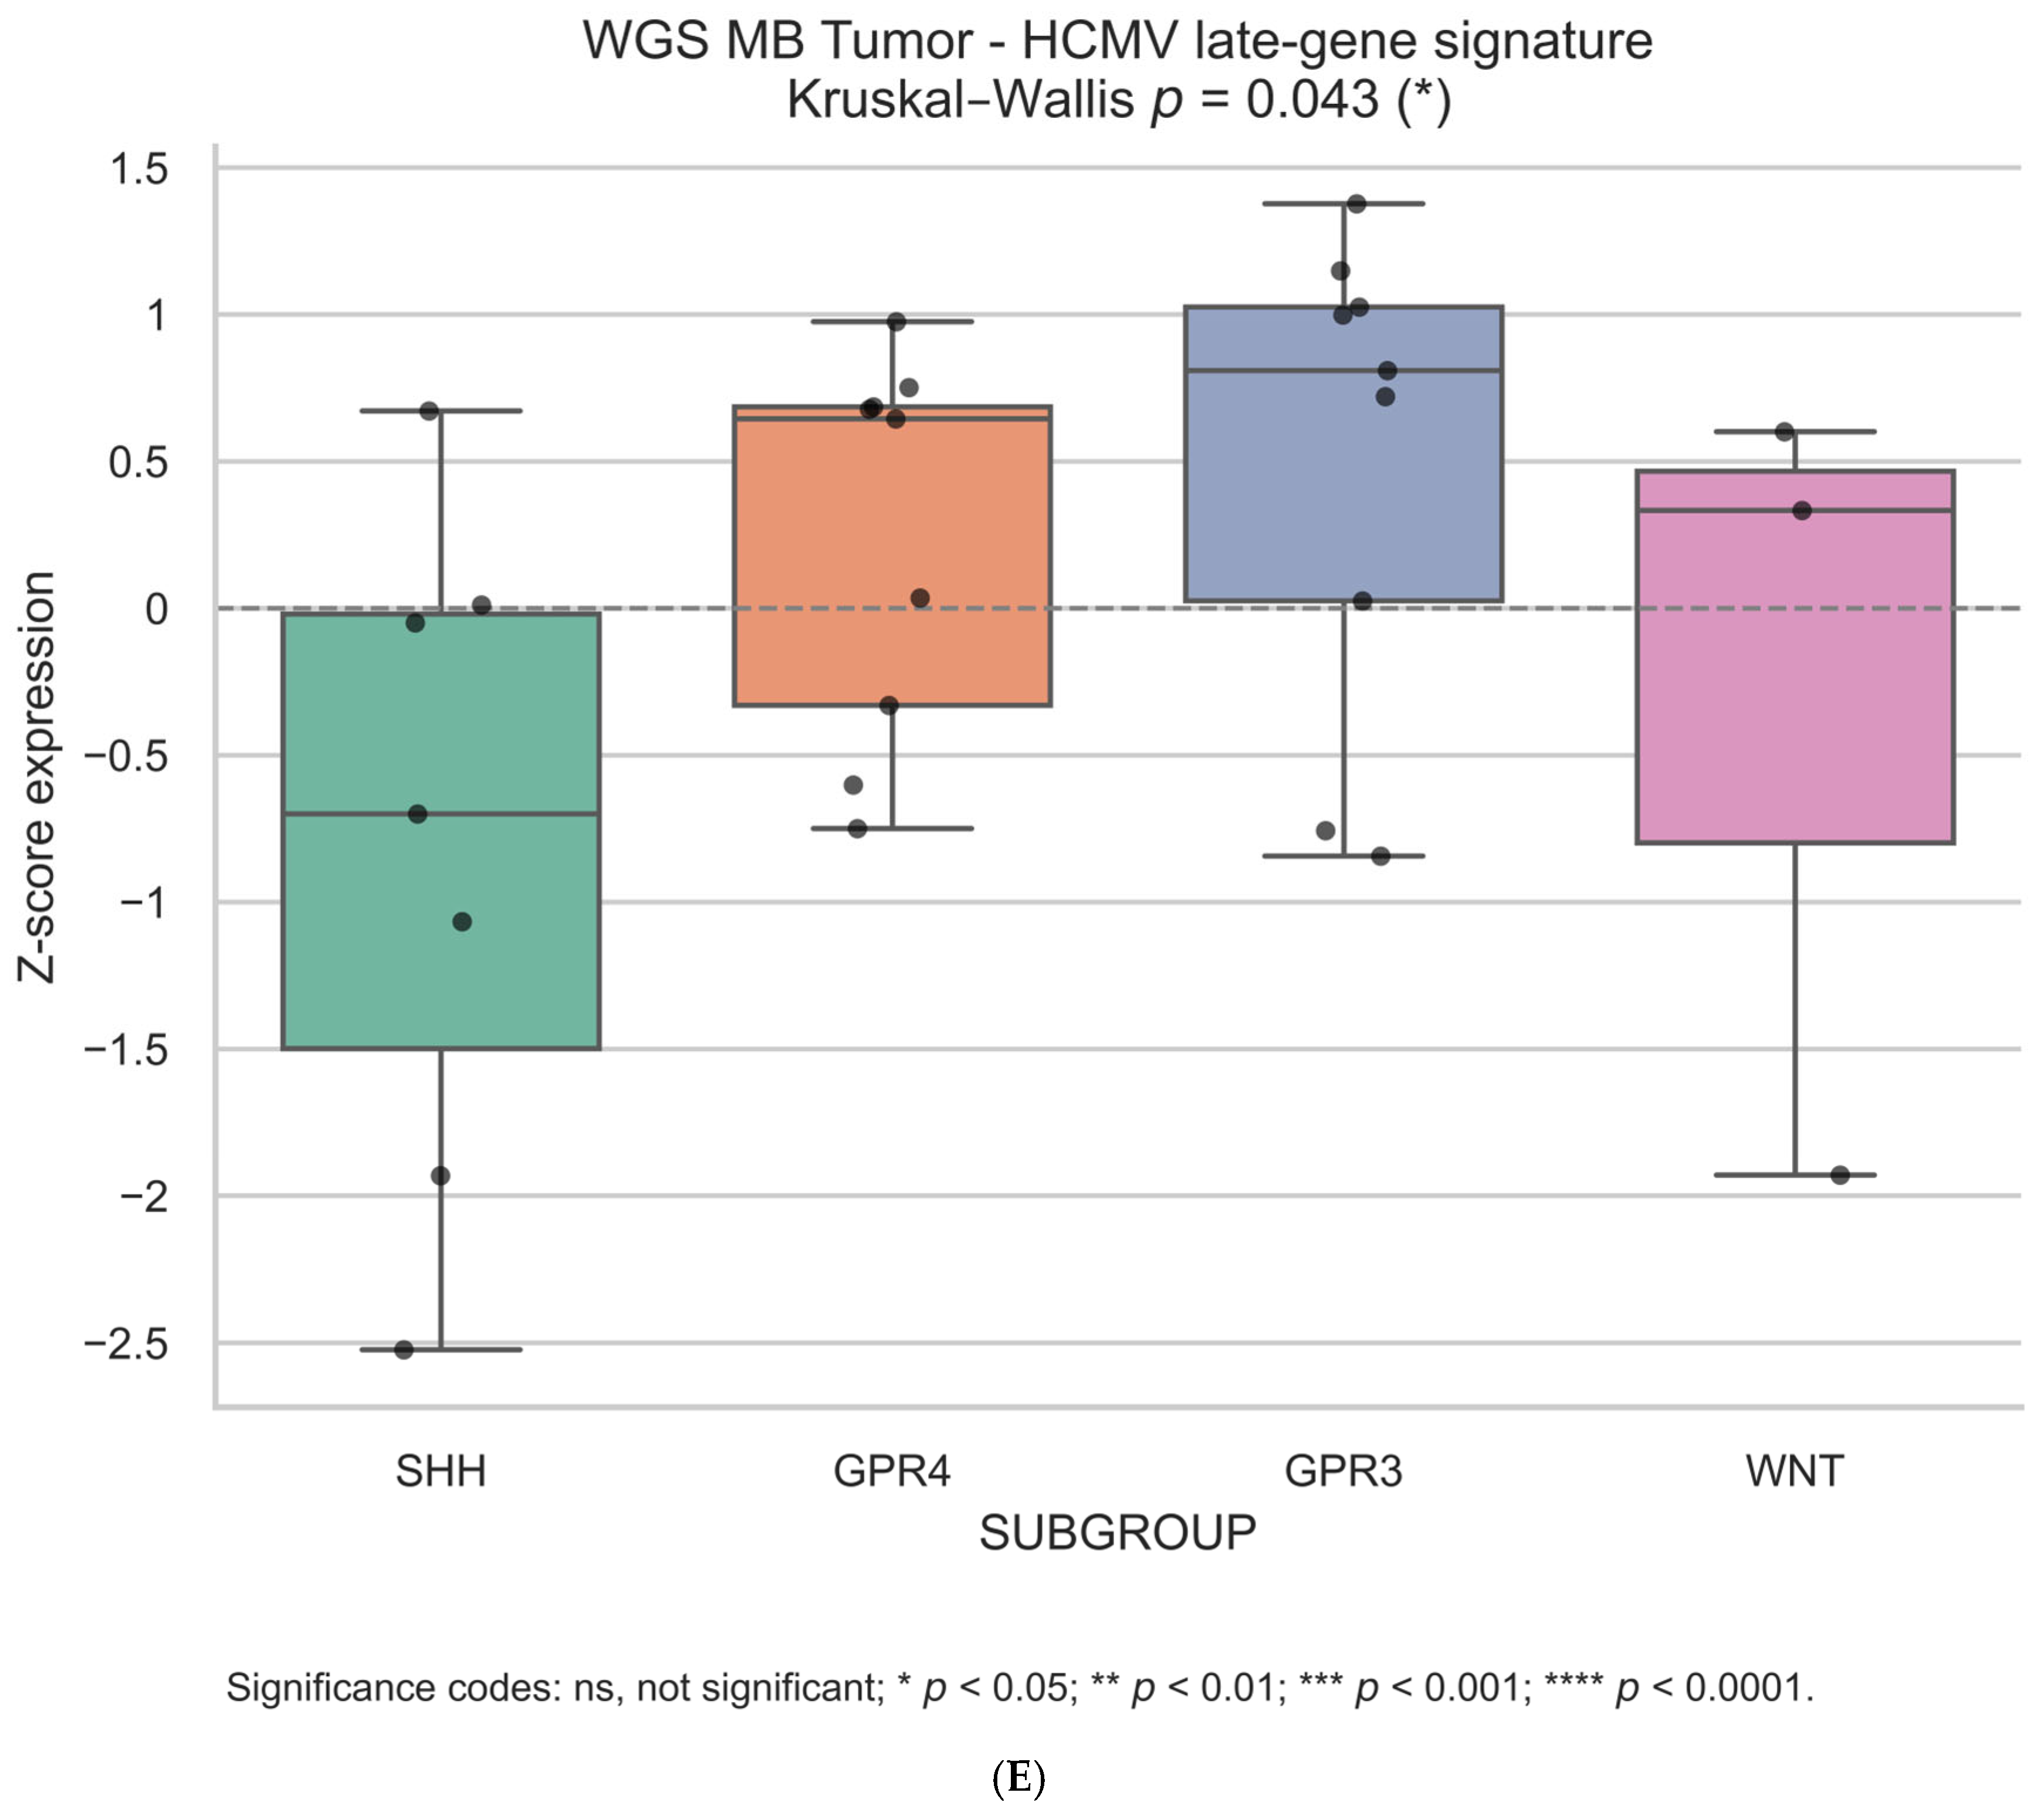
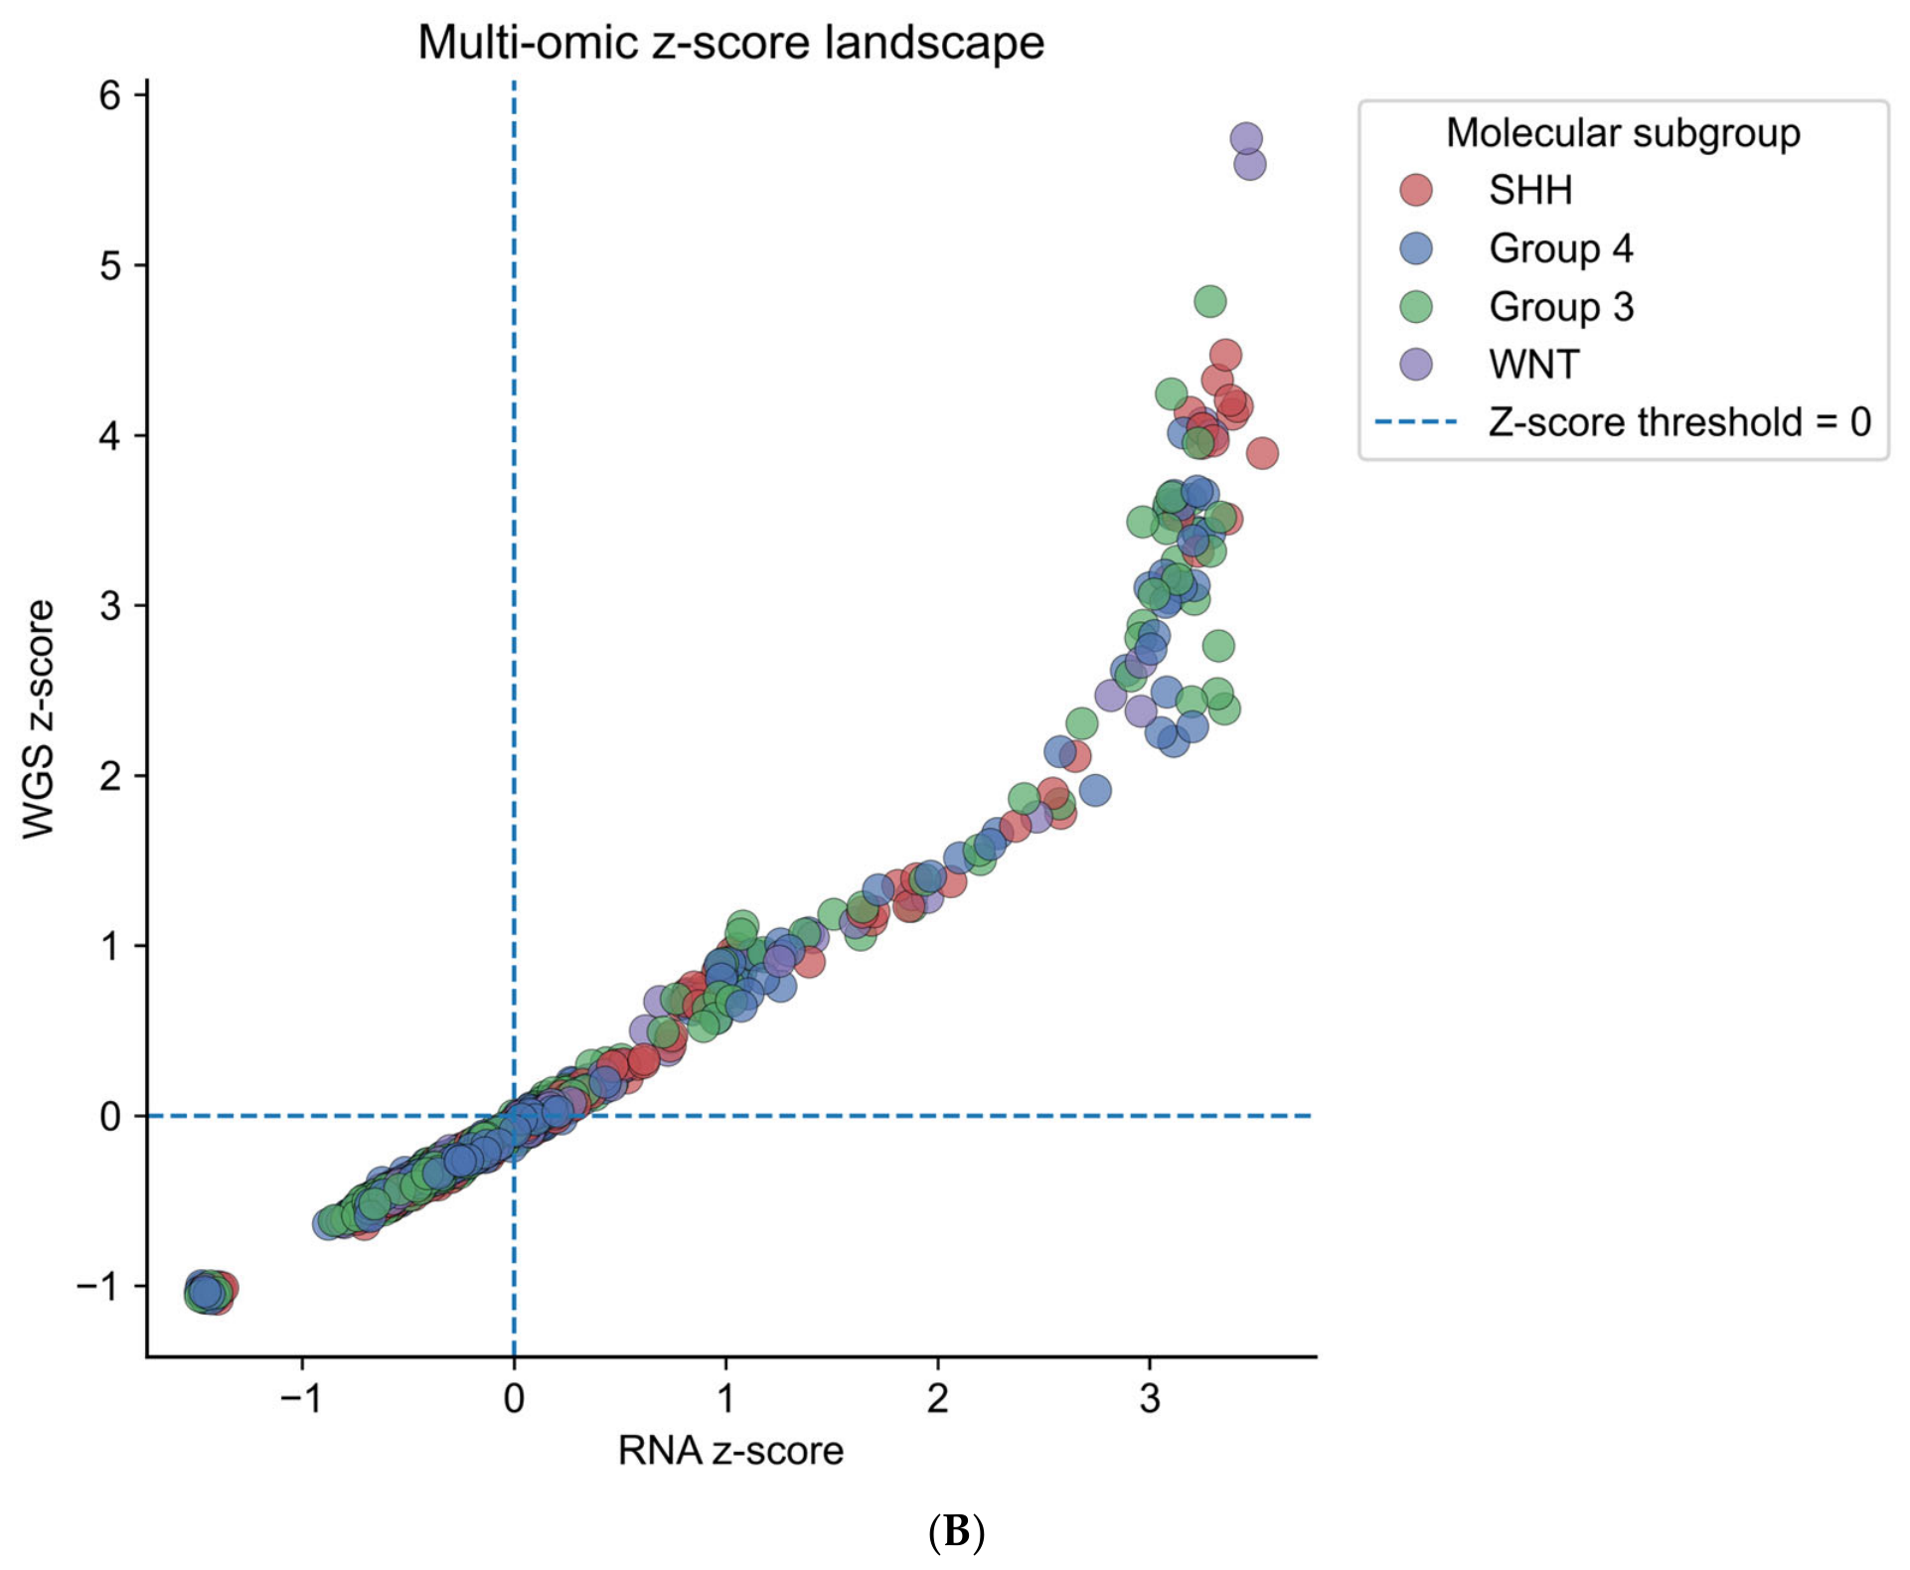
Integrated multi-omics analysis of the HCMV-associated late-gene signature across medulloblastoma subgroups. Integrated transcriptomic and genomic analyses were performed on 28 medulloblastoma cases with matched RNA-seq and WGS datasets. (A,B) RNA-seq analyses showed a trend toward increased expression of the HCMV-associated late-gene signature (UL76, UL88, UL99) in Group 3 tumors compared with other molecular subgroups, as indicated by both TPM and log2-transformed TPM values. However, these differences did not remain statistically significant after multiple-testing correction (Kruskal–Wallis p = 0.071; adjusted p = 0.428), consistent with the low abundance and variable distribution of transcript-level aligned reads across samples. (C) In contrast, WGS-derived analyses demonstrated significant subgroup-associated differences in HCMV-associated genomic signal (Kruskal–Wallis p = 0.043), with Group 3 tumors showing a higher composite late-gene signal than SHH tumors (mean ranks: 19.33 vs. 8.00; adjusted p = 0.038). (D,E) Z-score-normalized analyses integrating RNA-seq and WGS-derived features demonstrated concordant subgroup-associated patterns across molecular datasets, supporting the reproducible enrichment of low-level HCMV-associated molecular signals, particularly within Group 3 medulloblastomas. The integrated multi-omics analyses support heterogeneous but recurrent subgroup-associated HCMV-aligned molecular signatures rather than evidence of high-level or uniform viral abundance across tumors. GRP3 = Group 3 MB tumors, GRP4 = Group 4 MB tumors.
Figure 4.
Integrated multi-omics analysis of the HCMV-associated late-gene signature across medulloblastoma subgroups. Integrated transcriptomic and genomic analyses were performed on 28 medulloblastoma cases with matched RNA-seq and WGS datasets. (A,B) RNA-seq analyses showed a trend toward increased expression of the HCMV-associated late-gene signature (UL76, UL88, UL99) in Group 3 tumors compared with other molecular subgroups, as indicated by both TPM and log2-transformed TPM values. However, these differences did not remain statistically significant after multiple-testing correction (Kruskal–Wallis p = 0.071; adjusted p = 0.428), consistent with the low abundance and variable distribution of transcript-level aligned reads across samples. (C) In contrast, WGS-derived analyses demonstrated significant subgroup-associated differences in HCMV-associated genomic signal (Kruskal–Wallis p = 0.043), with Group 3 tumors showing a higher composite late-gene signal than SHH tumors (mean ranks: 19.33 vs. 8.00; adjusted p = 0.038). (D,E) Z-score-normalized analyses integrating RNA-seq and WGS-derived features demonstrated concordant subgroup-associated patterns across molecular datasets, supporting the reproducible enrichment of low-level HCMV-associated molecular signals, particularly within Group 3 medulloblastomas. The integrated multi-omics analyses support heterogeneous but recurrent subgroup-associated HCMV-aligned molecular signatures rather than evidence of high-level or uniform viral abundance across tumors. GRP3 = Group 3 MB tumors, GRP4 = Group 4 MB tumors.
Figure 5.
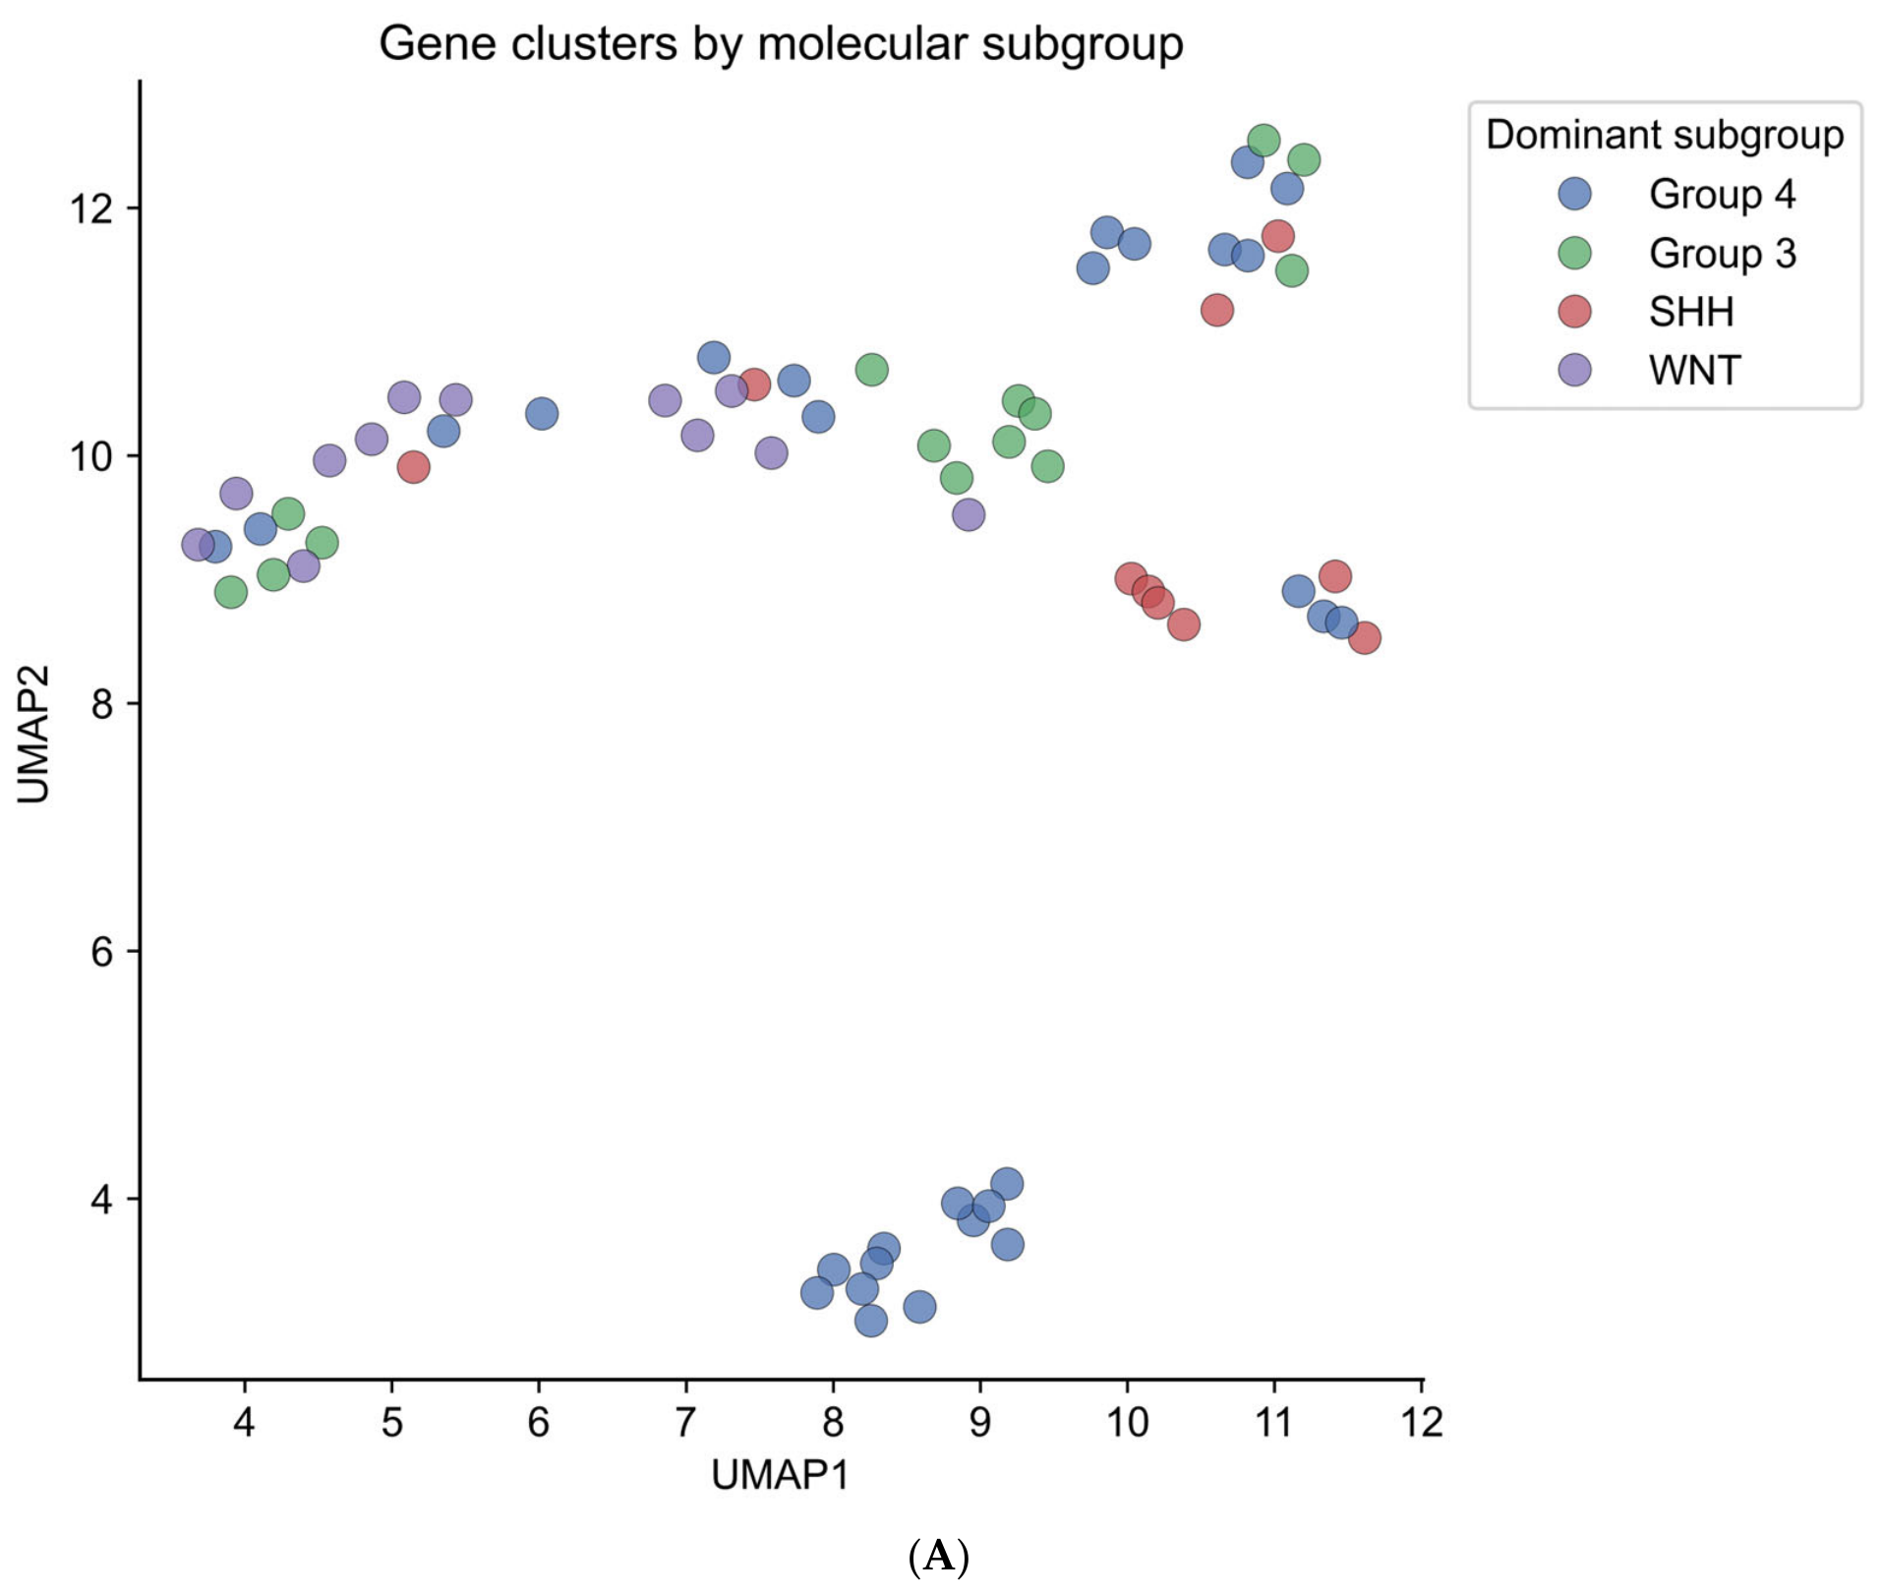
Integrated transcriptomic and genomic characterization of HCMV-associated molecular patterns in medulloblastoma. (A) Uniform Manifold Approximation and Projection (UMAP) analysis of integrated gene-level transcriptomic profiles demonstrates subgroup-associated clustering patterns across SHH, WNT, Group 3, and Group 4 medulloblastomas, highlighting distinct molecular architectures among tumor subgroups. (B) Integrated RNA-seq and WGS analyses using standardized Z-score normalization revealed heterogeneous relationships between transcriptomic and genomic HCMV-associated signals across tumors. A subset of loci showed elevated RNA expression without corresponding genomic enrichment (RNA+/DNA−), suggesting that low-level HCMV-associated transcriptional activity may occur independently of detectable DNA-level signal. Conversely, other loci showed concordant RNA+/DNA+ patterns, supporting reproducible detection of HCMV-associated molecular features across independent sequencing platforms. These analyses demonstrate heterogeneous yet recurrent subgroup-associated HCMV-aligned molecular patterns, particularly in Group 3 tumors, while also underscoring the low abundance and variable nature of the detected viral-associated signals.
Figure 5.
Integrated transcriptomic and genomic characterization of HCMV-associated molecular patterns in medulloblastoma. (A) Uniform Manifold Approximation and Projection (UMAP) analysis of integrated gene-level transcriptomic profiles demonstrates subgroup-associated clustering patterns across SHH, WNT, Group 3, and Group 4 medulloblastomas, highlighting distinct molecular architectures among tumor subgroups. (B) Integrated RNA-seq and WGS analyses using standardized Z-score normalization revealed heterogeneous relationships between transcriptomic and genomic HCMV-associated signals across tumors. A subset of loci showed elevated RNA expression without corresponding genomic enrichment (RNA+/DNA−), suggesting that low-level HCMV-associated transcriptional activity may occur independently of detectable DNA-level signal. Conversely, other loci showed concordant RNA+/DNA+ patterns, supporting reproducible detection of HCMV-associated molecular features across independent sequencing platforms. These analyses demonstrate heterogeneous yet recurrent subgroup-associated HCMV-aligned molecular patterns, particularly in Group 3 tumors, while also underscoring the low abundance and variable nature of the detected viral-associated signals.


Figure 6.
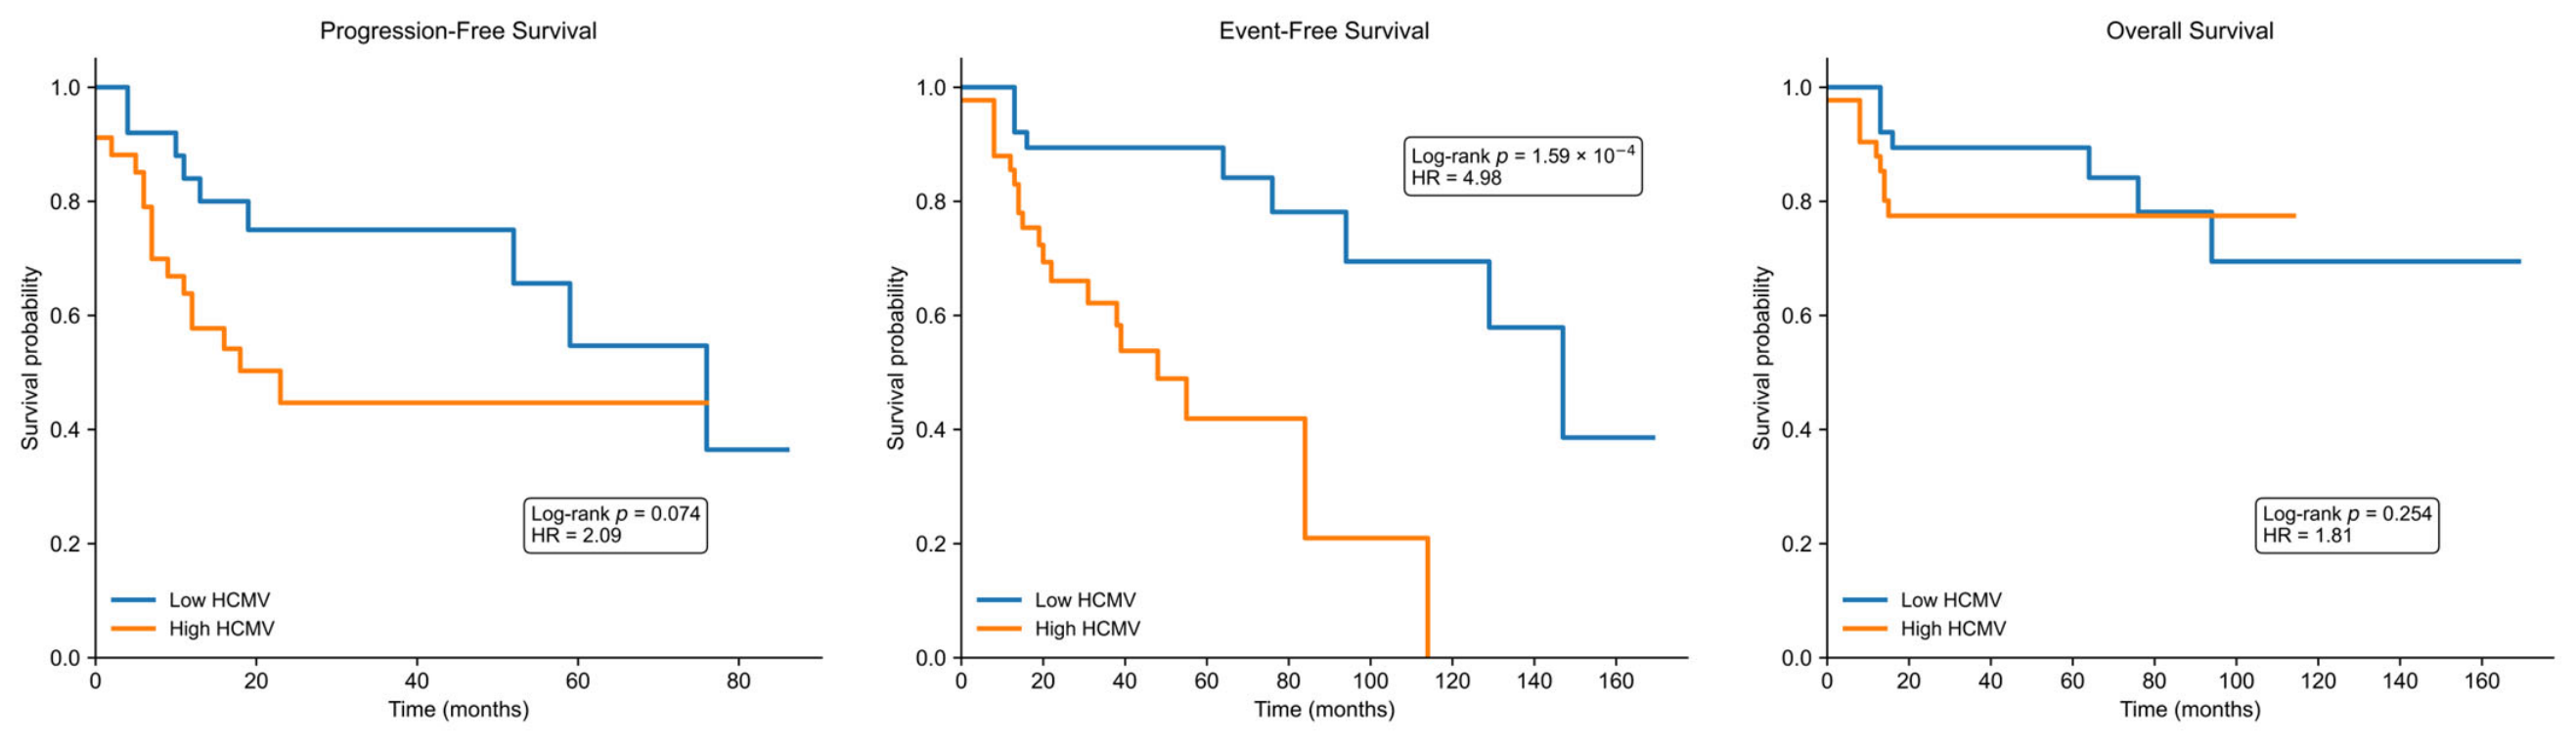
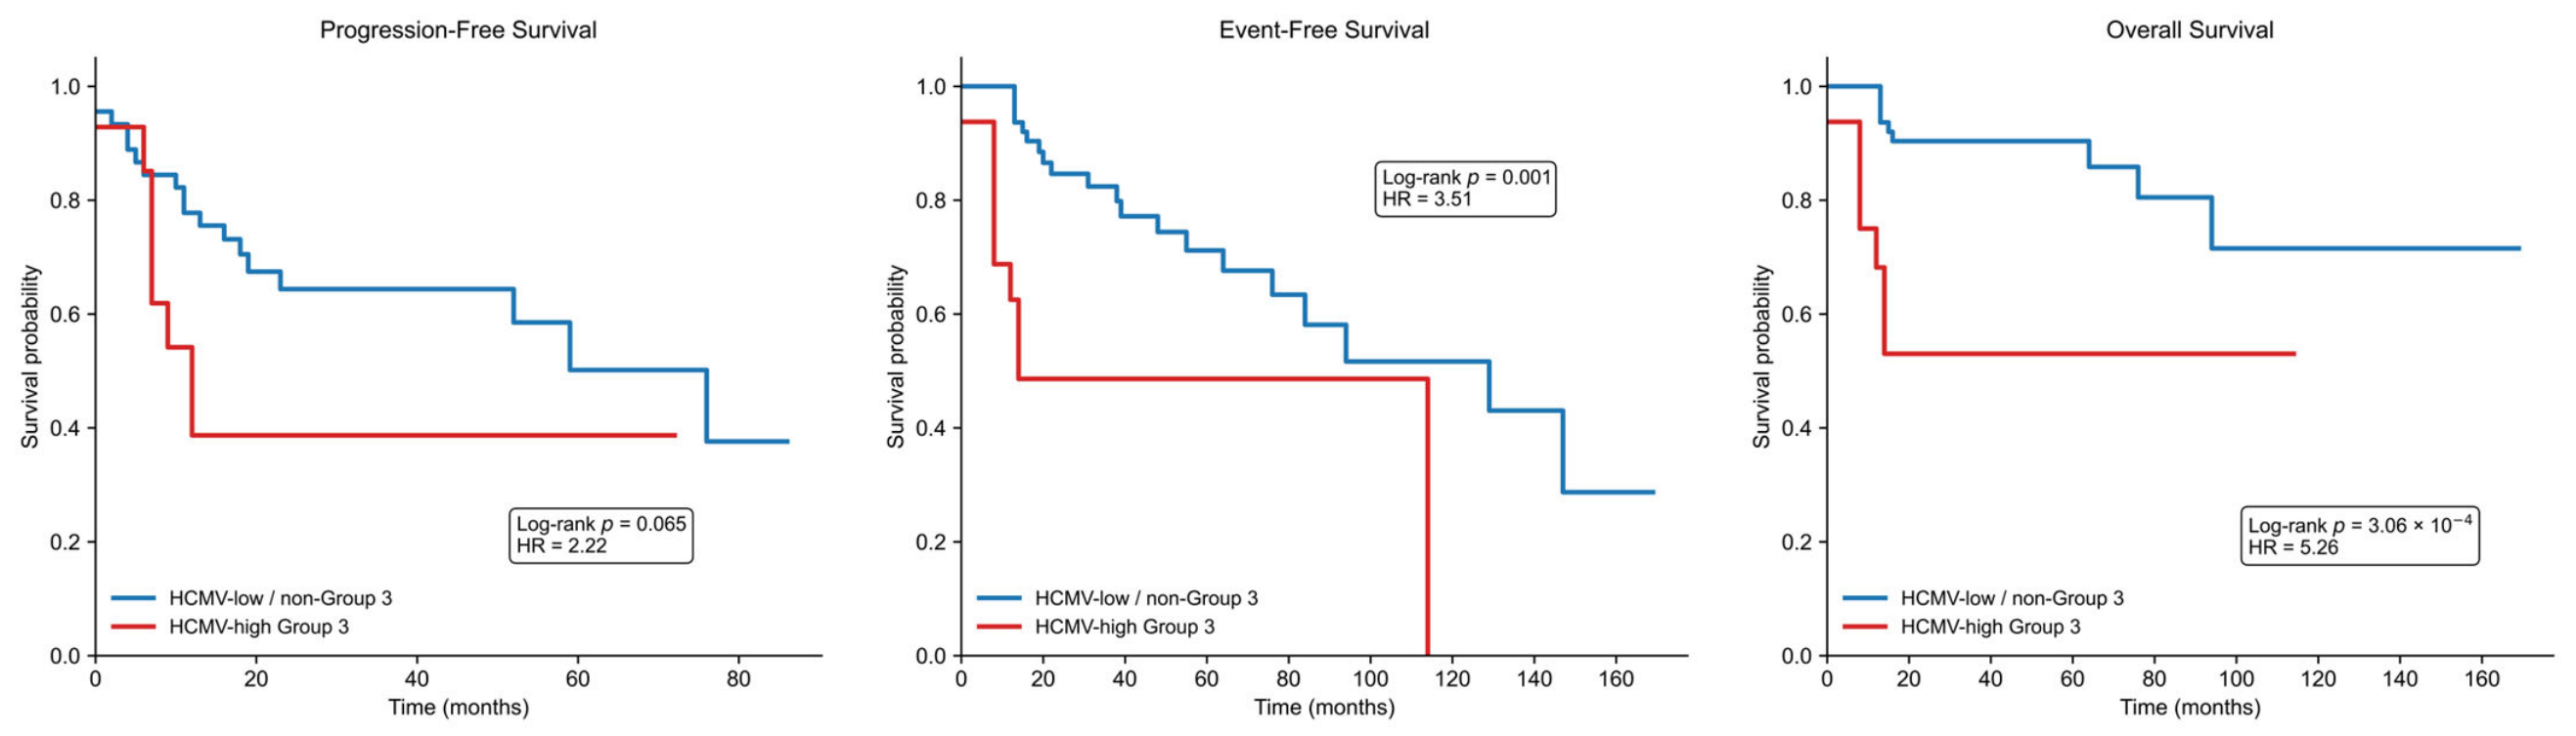
Exploratory Kaplan–Meier survival analysis of the combined pediatric medulloblastoma cohort (n = 84), integrating whole-genome sequencing (WGS; n = 39) and immunohistochemistry (IHC; n = 45) datasets. (Upper panel) Cases with high HCMV-associated signal, defined by cohort-specific WGS or IHC criteria, demonstrated significantly reduced event-free survival (EFS; median 55 vs. 147 months, log-rank p < 0.001) and overall survival (OS; mean 90 vs. 134 months, p = 0.034), whereas progression-free survival (PFS) showed a non-significant trend toward poorer outcome (median 23 vs. 76 months, p = 0.074). (Lower panel) Subgroup analysis revealed that HCMV-high Group 3 tumors were associated with significantly worse EFS (mean 14 vs. 129 months, p = 0.001) and OS (mean 64 vs. 137 months, p < 0.001), while the difference in PFS did not reach statistical significance (mean 12 vs. 76 months, p = 0.065).
Figure 6.
Exploratory Kaplan–Meier survival analysis of the combined pediatric medulloblastoma cohort (n = 84), integrating whole-genome sequencing (WGS; n = 39) and immunohistochemistry (IHC; n = 45) datasets. (Upper panel) Cases with high HCMV-associated signal, defined by cohort-specific WGS or IHC criteria, demonstrated significantly reduced event-free survival (EFS; median 55 vs. 147 months, log-rank p < 0.001) and overall survival (OS; mean 90 vs. 134 months, p = 0.034), whereas progression-free survival (PFS) showed a non-significant trend toward poorer outcome (median 23 vs. 76 months, p = 0.074). (Lower panel) Subgroup analysis revealed that HCMV-high Group 3 tumors were associated with significantly worse EFS (mean 14 vs. 129 months, p = 0.001) and OS (mean 64 vs. 137 months, p < 0.001), while the difference in PFS did not reach statistical significance (mean 12 vs. 76 months, p = 0.065).
Figure 7.
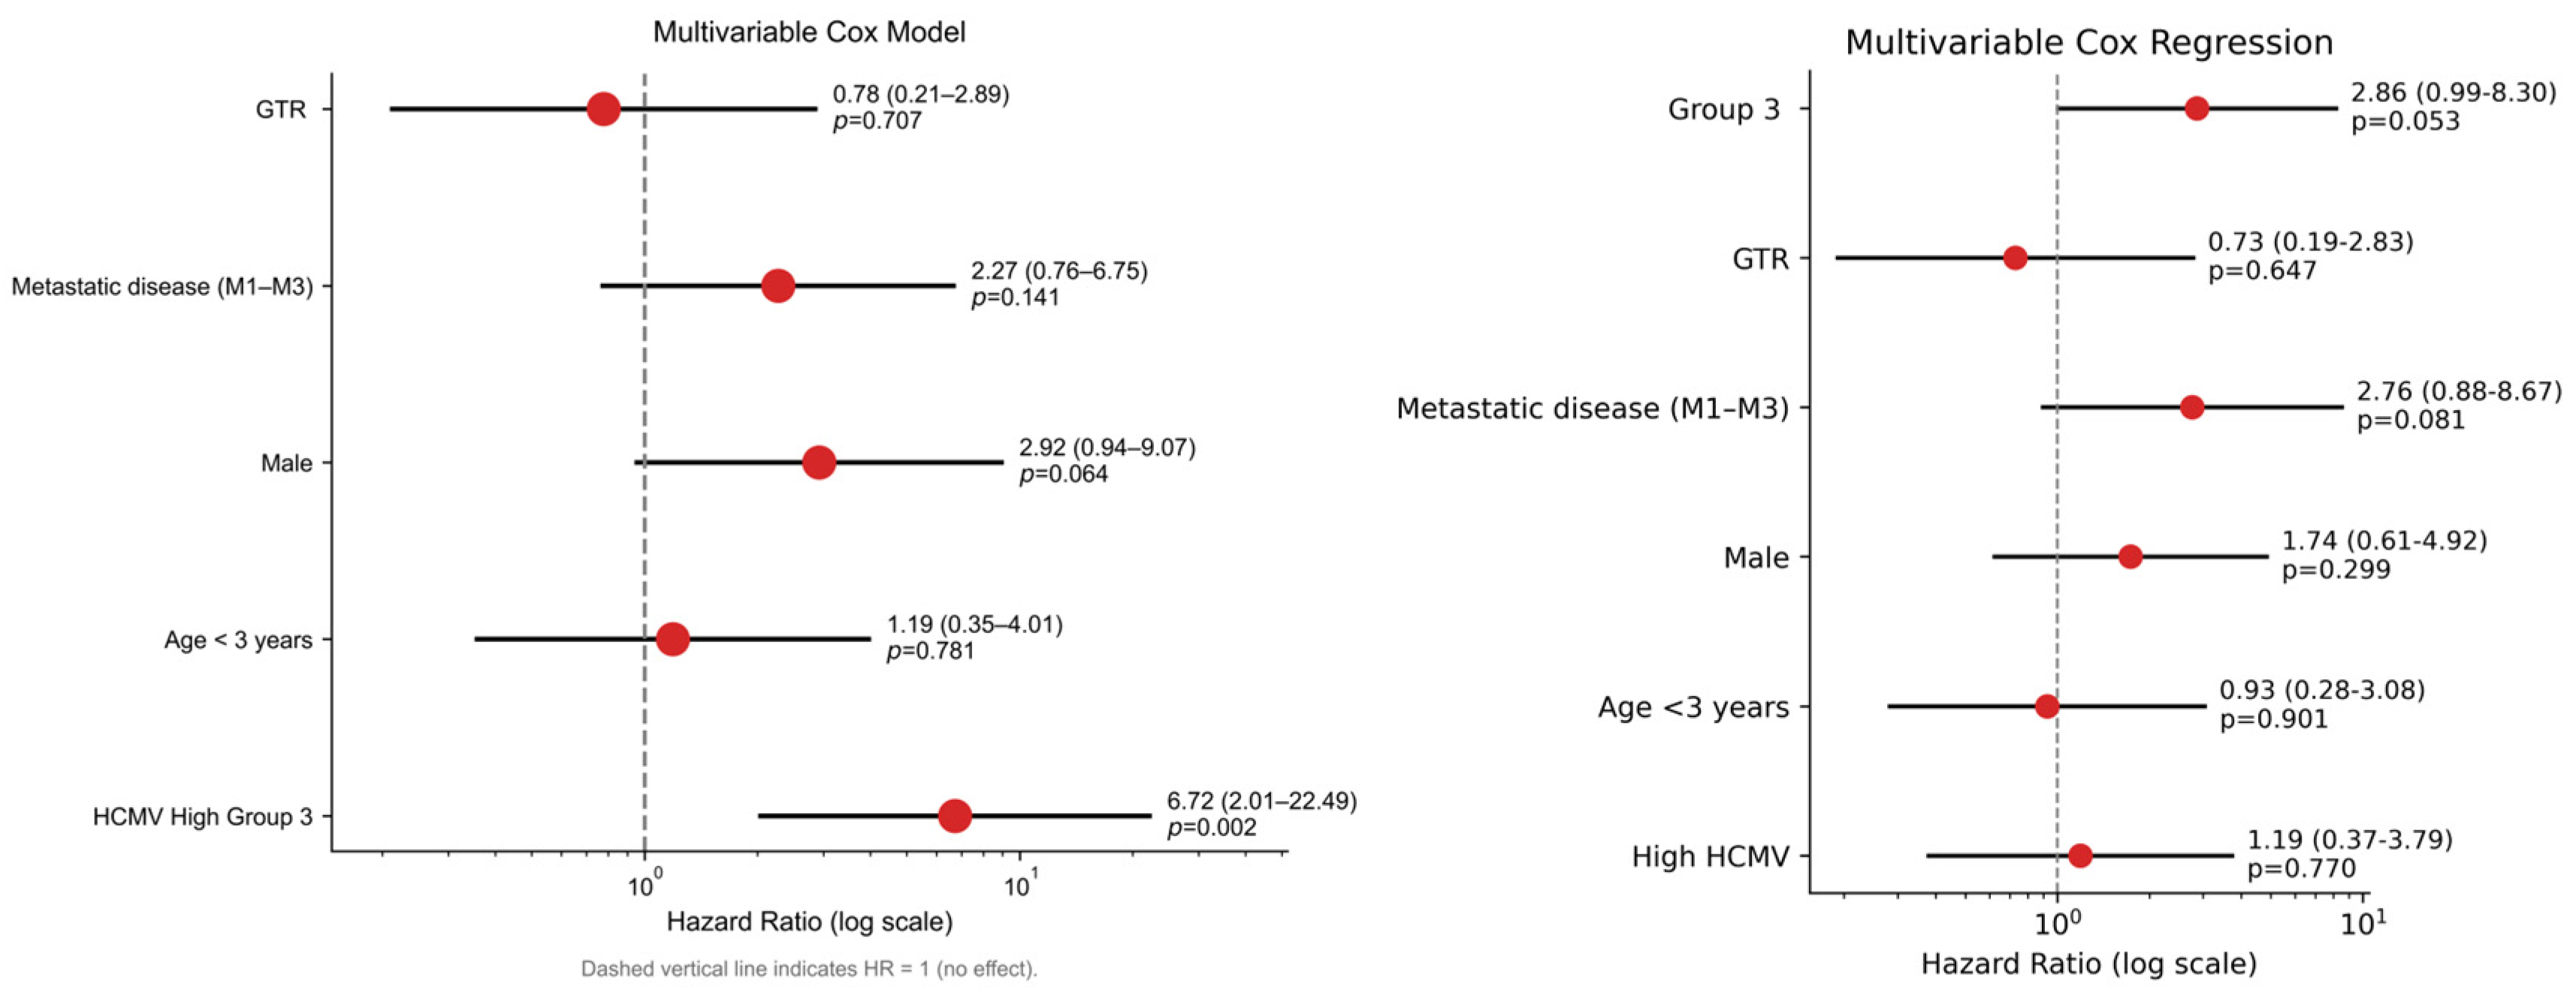
Exploratory multivariable Cox regression analysis identifying a high-risk HCMV-associated subgroup in pediatric medulloblastoma (n = 84). Forest plots summarize hazard ratios (HRs) and 95% confidence intervals (CIs) derived from multivariable Cox proportional hazards models evaluating progression-free survival (PFS), event-free survival (EFS), and overall survival (OS). Models including individual clinicopathological variables (right panel) identified age < 3 years, metastatic disease, and high HCMV-associated signal as independent predictors of adverse outcome, while Group 3 tumors were associated with reduced OS (HR = 2.84, p = 0.050). Models incorporating the combined variable “HCMV-high Group 3 tumors” (left panel) demonstrated the strongest association with poor clinical outcome, including reduced OS (HR = 6.43, p = 0.002) and EFS (HR = 3.50, p = 0.016), supporting the presence of a biologically high-risk subgroup characterized by combined Group 3 biology and elevated HCMV-associated signal.
Figure 7.
Exploratory multivariable Cox regression analysis identifying a high-risk HCMV-associated subgroup in pediatric medulloblastoma (n = 84). Forest plots summarize hazard ratios (HRs) and 95% confidence intervals (CIs) derived from multivariable Cox proportional hazards models evaluating progression-free survival (PFS), event-free survival (EFS), and overall survival (OS). Models including individual clinicopathological variables (right panel) identified age < 3 years, metastatic disease, and high HCMV-associated signal as independent predictors of adverse outcome, while Group 3 tumors were associated with reduced OS (HR = 2.84, p = 0.050). Models incorporating the combined variable “HCMV-high Group 3 tumors” (left panel) demonstrated the strongest association with poor clinical outcome, including reduced OS (HR = 6.43, p = 0.002) and EFS (HR = 3.50, p = 0.016), supporting the presence of a biologically high-risk subgroup characterized by combined Group 3 biology and elevated HCMV-associated signal.

Figure 8.
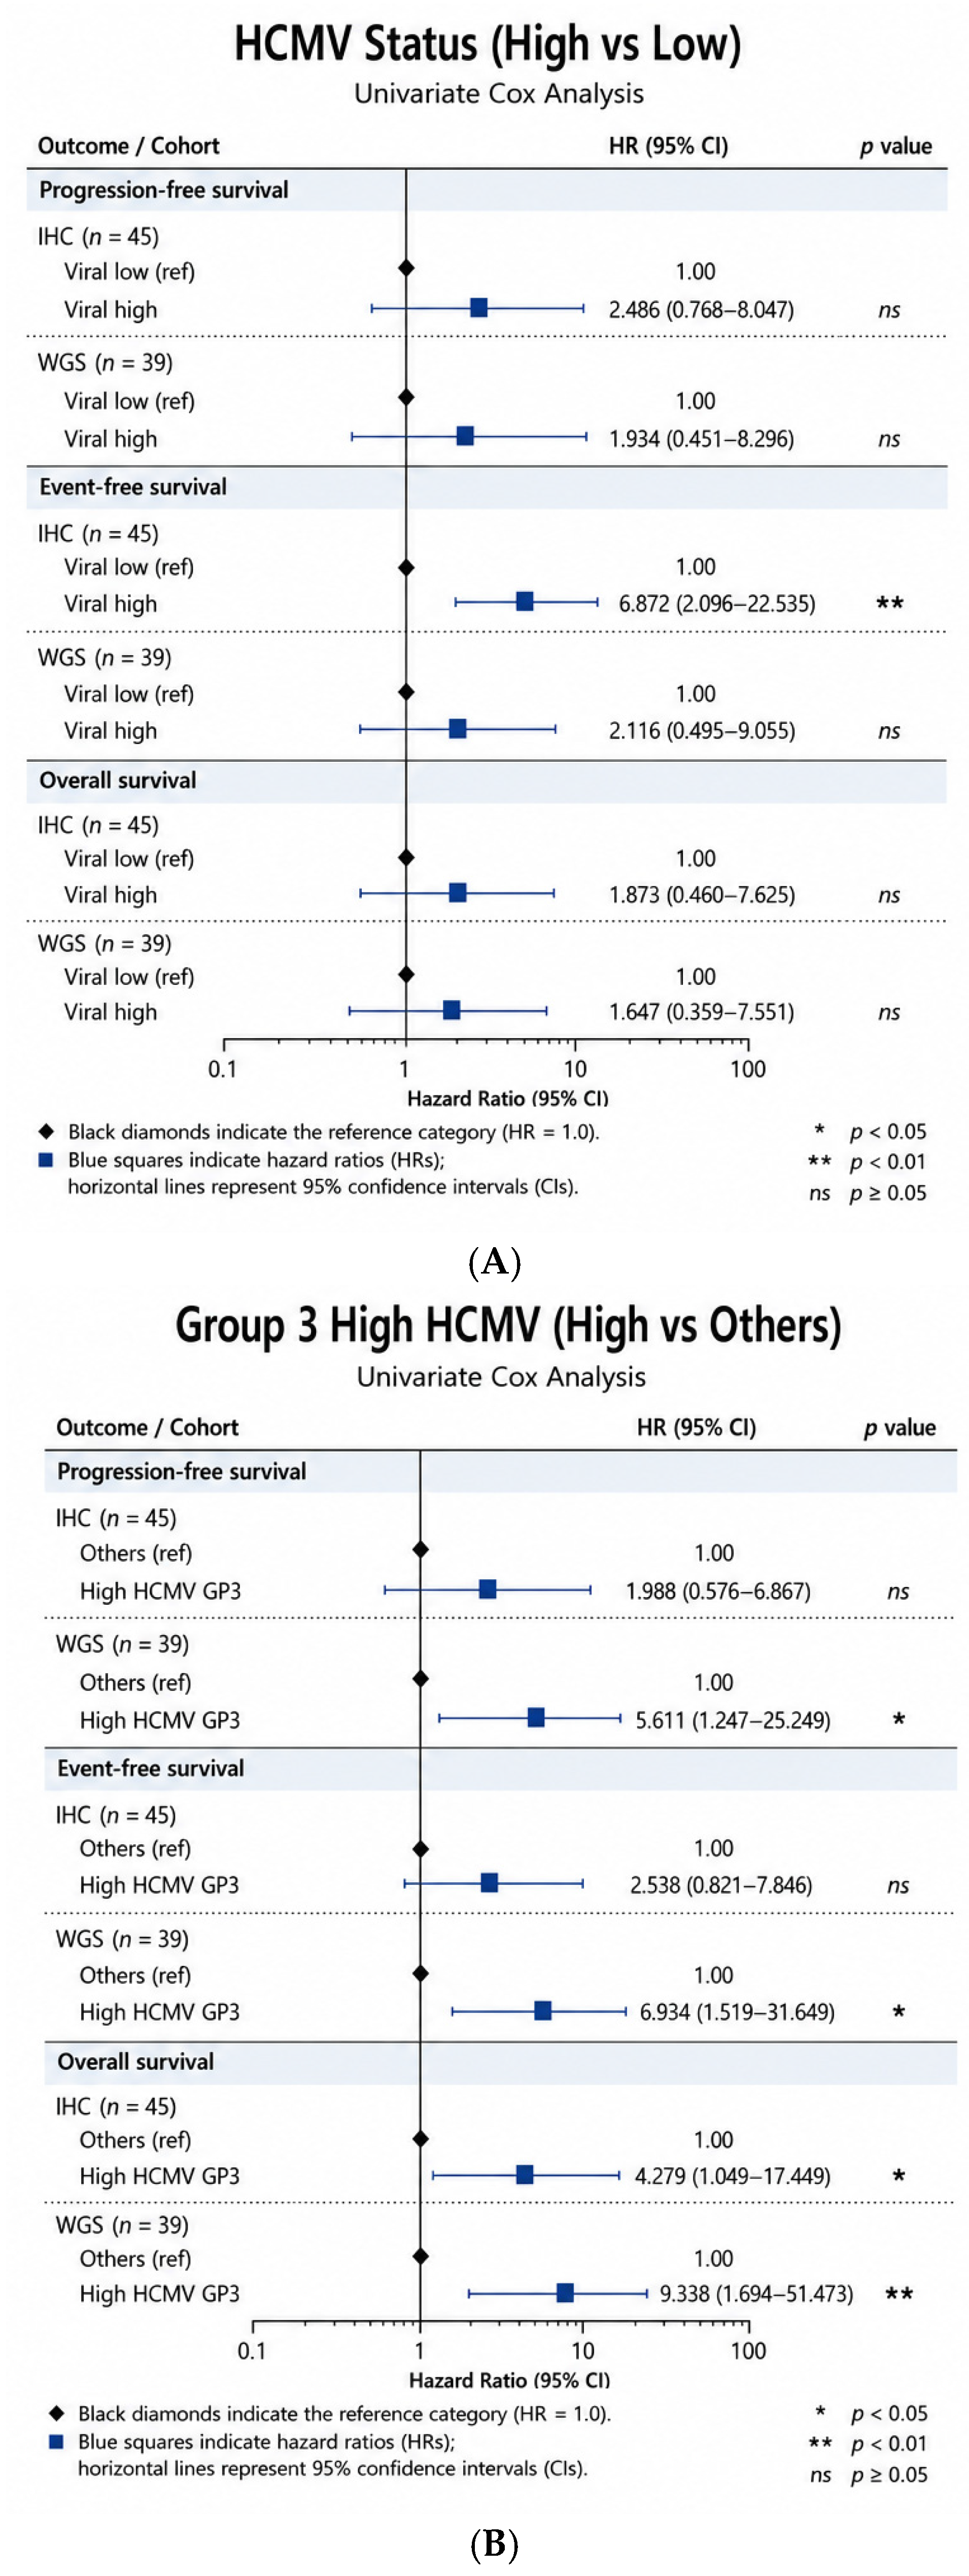
Exploratory univariate Cox proportional hazards analyses of HCMV-associated signal and HCMV-high Group 3 tumors in pediatric medulloblastoma. Forest plots display hazard ratios (HRs) with 95% confidence intervals (CIs) for progression-free survival (PFS), event-free survival (EFS), and overall survival (OS) derived from univariate Cox regression models in the immunohistochemistry (IHC; n = 45) and whole-genome sequencing (WGS; n = 39) cohorts. (A) compares cases with high versus low HCMV-associated signal, while (B) evaluates the combined subgroup “HCMV-high Group 3 tumors” versus all remaining tumors. Squares indicate HR estimates and horizontal lines represent 95% CIs; the vertical reference line indicates HR = 1. Significant associations (* p < 0.05, ** p < 0.01) are shown in bold. HCMV-associated signal detected by IHC showed a significant association with reduced EFS (A), whereas the HCMV-high Group 3 subgroup demonstrated more consistent associations with PFS, EFS, and OS across both cohorts (B), supporting enrichment for adverse clinical outcomes within this biologically high-risk subgroup.
Figure 8.
Exploratory univariate Cox proportional hazards analyses of HCMV-associated signal and HCMV-high Group 3 tumors in pediatric medulloblastoma. Forest plots display hazard ratios (HRs) with 95% confidence intervals (CIs) for progression-free survival (PFS), event-free survival (EFS), and overall survival (OS) derived from univariate Cox regression models in the immunohistochemistry (IHC; n = 45) and whole-genome sequencing (WGS; n = 39) cohorts. (A) compares cases with high versus low HCMV-associated signal, while (B) evaluates the combined subgroup “HCMV-high Group 3 tumors” versus all remaining tumors. Squares indicate HR estimates and horizontal lines represent 95% CIs; the vertical reference line indicates HR = 1. Significant associations (* p < 0.05, ** p < 0.01) are shown in bold. HCMV-associated signal detected by IHC showed a significant association with reduced EFS (A), whereas the HCMV-high Group 3 subgroup demonstrated more consistent associations with PFS, EFS, and OS across both cohorts (B), supporting enrichment for adverse clinical outcomes within this biologically high-risk subgroup.

Figure 9.
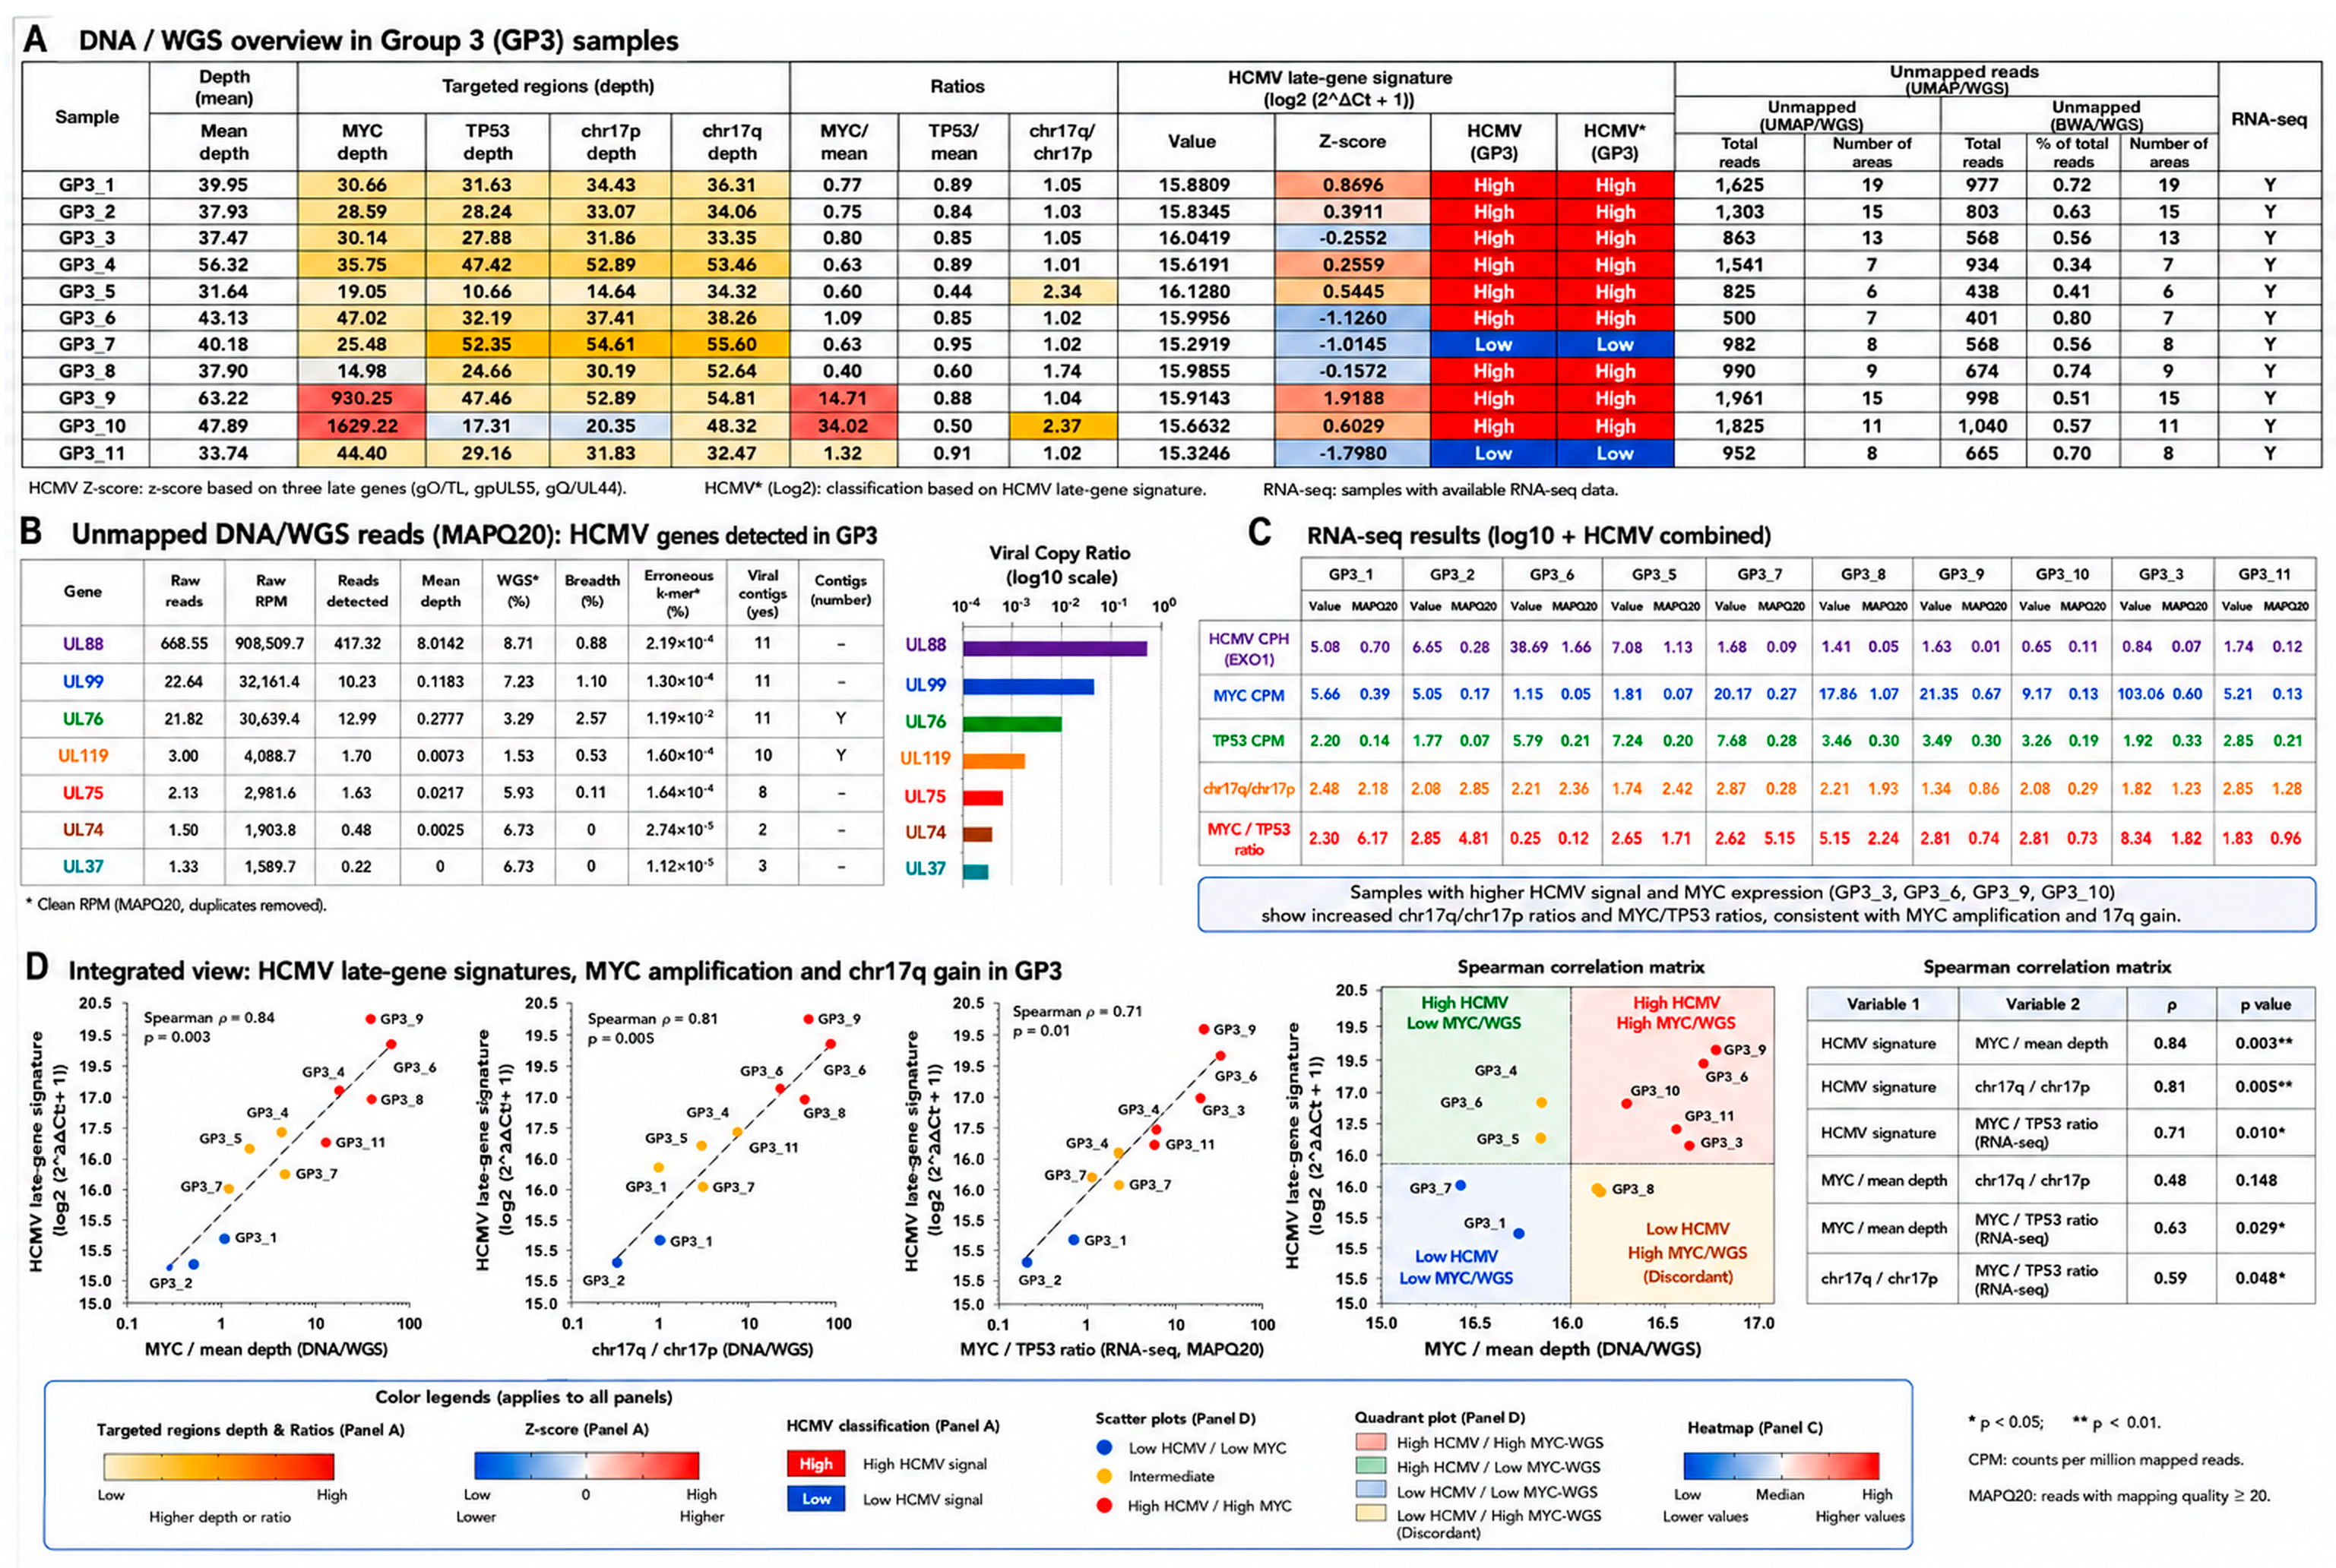
Integrated multi-omics characterization and orthogonal validation of HCMV-associated molecular signals in Group 3 medulloblastoma. (A) Genomic overview of Group 3 (GP3) medulloblastoma samples from whole-genome sequencing (WGS), including mean sequencing depth, MYC and TP53 coverage, chromosome 17p/17q depth ratios, and the composite HCMV late-gene signature [UL76–UL88–UL99; log2(NVA + 1)]. Samples were stratified into HCMV-high and HCMV-low groups based on composite Z-scores. The number of unmapped HCMV-aligned reads before and after MAPQ ≥ 20 filtering, as well as RNA-seq availability, is also shown. (B) Orthogonal analysis of unmapped WGS reads realigned to the HCMV reference genome (NC_006273.2). Recurrent enrichment was observed at the late-gene loci UL76, UL88, and UL99, which exhibited the highest RPM values, genomic coverage, and prevalence across Group 3 tumors, supporting a reproducible, low-level HCMV-associated genomic signal. (C) RNA-seq analysis using a combined hg19 + HCMV reference genome demonstrated concordant detection of low-abundance HCMV-associated transcripts in a subset of Group 3 tumors. Comparative analyses of HCMV CPM, MYC CPM, TP53 CPM, chr17q/chr17p ratios, and MYC/TP53 expression ratios revealed increased MYC-associated activity and chromosomal imbalance in tumors with elevated HCMV-associated transcriptional signal. (D) Integrated correlation analyses showed positive associations between the HCMV late-gene signature and molecular features of aggressive Group 3 biology, including MYC amplification, chr17q gain, and elevated MYC/TP53-associated ratios. Spearman correlation analysis further supported concordance between HCMV-associated genomic and transcriptomic signals and markers of genomic instability. These findings support the presence of reproducible, low-level HCMV-associated molecular signatures that are preferentially enriched in biologically high-risk Group 3 medulloblastoma.
Figure 9.
Integrated multi-omics characterization and orthogonal validation of HCMV-associated molecular signals in Group 3 medulloblastoma. (A) Genomic overview of Group 3 (GP3) medulloblastoma samples from whole-genome sequencing (WGS), including mean sequencing depth, MYC and TP53 coverage, chromosome 17p/17q depth ratios, and the composite HCMV late-gene signature [UL76–UL88–UL99; log2(NVA + 1)]. Samples were stratified into HCMV-high and HCMV-low groups based on composite Z-scores. The number of unmapped HCMV-aligned reads before and after MAPQ ≥ 20 filtering, as well as RNA-seq availability, is also shown. (B) Orthogonal analysis of unmapped WGS reads realigned to the HCMV reference genome (NC_006273.2). Recurrent enrichment was observed at the late-gene loci UL76, UL88, and UL99, which exhibited the highest RPM values, genomic coverage, and prevalence across Group 3 tumors, supporting a reproducible, low-level HCMV-associated genomic signal. (C) RNA-seq analysis using a combined hg19 + HCMV reference genome demonstrated concordant detection of low-abundance HCMV-associated transcripts in a subset of Group 3 tumors. Comparative analyses of HCMV CPM, MYC CPM, TP53 CPM, chr17q/chr17p ratios, and MYC/TP53 expression ratios revealed increased MYC-associated activity and chromosomal imbalance in tumors with elevated HCMV-associated transcriptional signal. (D) Integrated correlation analyses showed positive associations between the HCMV late-gene signature and molecular features of aggressive Group 3 biology, including MYC amplification, chr17q gain, and elevated MYC/TP53-associated ratios. Spearman correlation analysis further supported concordance between HCMV-associated genomic and transcriptomic signals and markers of genomic instability. These findings support the presence of reproducible, low-level HCMV-associated molecular signatures that are preferentially enriched in biologically high-risk Group 3 medulloblastoma.

Table 1.
Cox multivariable analysis in the WGS cohort (n = 39).
Table 1.
Cox multivariable analysis in the WGS cohort (n = 39).
| | Progression-Free Survival (PFS) | Event-Free Survival (EFS) | Overall Survival (OS) |
|---|
| Variables | | HR | 95% CI Lower | 95% CI Upper | p-Value | HR | 95% CI Lower | 95% CI Upper | p-Value | HR | 95% CI Lower | 95% CI Upper | p-Value |
|---|
| Age | | 0.993
| 0.819
| 1.205
| 0.946
| 0.994
| 0.819
| 1.206
| 0.951
| 0.982
| 0.796
| 1.211
| 0.865
|
| Gender | Female | 1 | | | 0.953
| 1 | | | 0.748 | 1 | | | 0.918
|
| Male | 1.052
| 0.196
| 5.653
| | 1.325
| 0.239
| 7.359
| | 0.907
| 0.140
| 5.860
| |
HCMV-high
Group 3 | No | 1 | | | 0.029 * | 1 | | | 0.015 * | 1 | | | 0.014 *
|
| Yes | 5.665
| 1.200
| 26.745
| | 7.596
| 1.475
| 39.116
| | 9.158
| 1.573
| 53.319
| |
Table 2.
Cox multivariable analysis considering the combined cohort (n = 84).
Table 2.
Cox multivariable analysis considering the combined cohort (n = 84).
| | Progression-Free Survival (PFS) | Event-Free Survival (EFS) | Overall Survival (OS) |
|---|
| Variables | | HR | 95% CI Lower | 95% CI Upper | p-Value | HR | 95% CI Lower | 95% CI Upper | p-Value | HR | 95% CI Lower | 95% CI Upper | p-Value |
|---|
| Age | under 3 yr | 2.566
| 1.023
| 6.433
| 0.045 *
| 1.437
| 0.581
| 3.554
| 0.433
| 0.720
| 0.215
| 2.405
| 0.593
|
| over 3 yr | 1
| | | | 1
| | | | 1
| | | |
| Gender | Female | 1
| | | | 1
| | | | 1
| | | |
| Male | 1.429
| 0.555
| 3.679
| 0.459
| 2.533
| 1.079
| 5.945
| 0.033 *
| 2.778
| 0.898
| 8.590
| 0.076
|
| Metastasis | M0 | 1
| | | | 1
| | | | 1
| | | |
| M1–M3 | 2.307
| 0.962
| 5.532
| 0.061
| 3.427
| 1.428
| 8.225
| 0.006 *
| 2.659
| 0.842
| 8.403
| 0.096
|
HCMV-high
WNT | No | 1
| | | | 1
| | | | 1
| | | |
| yes | 1.302
| 0.144
| 11.793
| 0.814
| 1.668
| 0.193
| 14.392
| 0.642
| 0.000
| 0.000
| | 0.989
|
HCMV-high
SHH | No | 1
| | | | 1
| | | | 1
| | | |
| yes | 3.628
| 0.658
| 20.004
| 0.139
| 5.323
| 0.951
| 29.779
| 0.057
| 0.000
| 0.000
| | 0.990
|
HCMV-high
Group 3 | No | 1
| | | | 1
| | | | 1
| | | |
| yes | 2.214
| 0.744
| 6.588
| 0.153
| 7.308
| 2.382
| 22.424
| <0.001 *
| 4.552
| 1.290
| 16.061
| 0.018 *
|
HCMV-high
Group 4 | No | 1
| | | | 1
| | | | 1
| | | |
| yes | 1.832
| 0.610
| 5.498
| 0.281
| 2.951
| 0.894
| 9.736
| 0.076
| 0.444
| 0.079
| 2.494
| 0.356
|