Narrow-Band-Imaging-Derived Mean Optical Intensity: A Potential Biomarker for Monitoring the Progression of Oral Squamous Cell Carcinoma
 , , , ,
  and
and
Abstract
1. Introduction
2. Materials and Methods
2.1. Subjects and Sample Collection
2.1.1. Clinical Samples
2.1.2. Animal Samples
2.2. Main Reagents and Instruments
2.2.1. Reagents
2.2.2. Instruments
2.3. Experimental Methods
2.3.1. NBI Detection of Clinical Samples
2.3.2. Establishment of 4NQO-Induced OSCC Mouse Model and NBI Monitoring, and Hematoxylin and Eosin Staining
- (1)
- Model establishment: 4NQO was dissolved in sterile drinking water to prepare a 50 μg/mL 4NQO solution. A total of 34 C57BL/6 mice were randomly divided into a model group (n = 21) and a control group (n = 13). Mice in the model group were given 4NQO-containing drinking water, while those in the control group received regular sterile drinking water for 16 consecutive weeks. After 16 weeks, mice in both groups were switched to normal drinking water and continuously reared until week 24, during which the occurrence of oral mucosal lesions was observed.
- (2)
- Dynamic NBI monitoring: NBI detection of the oral mucosa was performed on mice from both groups at weeks 4, 8, 12, 16, 20, and 24 post-modeling, respectively. Mice were anesthetized via the intraperitoneal injection of 1% sodium pentobarbital (50 mg/kg). The oral cavity was opened with a mouth gag to fully expose the oral mucosa, and the entire dorsal tongue was imaged under white light using the NBI system. After the completion of white-light imaging, the NBI system equipped with dual narrow-band light sources was applied to image the entire dorsal tongue and key target areas (corresponding to the visual fields under white light). The light intensity, exposure parameters, and focal length were kept consistent throughout the imaging procedure for all subjects. Three images of different visual fields were taken for each sample, and all images were preserved in the original format. Subsequently, mice corresponding to five distinct pathological stages were humanely euthanized in compliance with laboratory animal care guidelines. Specifically, an overdose of 1% sodium pentobarbital (150 mg/kg) was intraperitoneally injected to induce rapid, deep anesthesia and the loss of consciousness. A surgical level of anesthesia was confirmed based on the absence of a withdrawal reflex to a noxious stimulus (toe pinch). Upon verification of complete unconsciousness, cervical dislocation was performed as a secondary euthanasia measure to ensure the animal’s death, thereby minimizing unnecessary suffering. Immediately after euthanasia, the entire tongue was dissected using sterile instruments, subjected to ex vivo NBI imaging, and subsequently processed via routine protocols: the tongue specimens were fixed in formalin, dehydrated, embedded in paraffin, and sectioned into 5 μm-thick slices for hematoxylin and eosin (H&E) staining. Histological images were captured using a light microscope (Olympus CX23; Olympus Corporation, Tokyo, Japan), and the resultant slides were scanned with the Panoramic 250 Flash system (3DHISTECH).
2.3.3. Establishment of Mouse OSCC Syngeneic Graft Model and NBI Evaluation
- (1)
- SCC7 cell culture: The mouse SCC7 cell line was purchased from Xiamen ImmunoCell Biotechnology Co., Ltd. (Xiamen, China). Cells were cultured in DMEM supplemented with 10% FBS, 100 U/mL penicillin, and 100 μg/mL streptomycin and maintained in a humidified incubator at 37 °C with 5% CO2. Cells in the logarithmic growth phase were harvested for transplantation.
- (2)
- Model establishment: Sixteen C57BL/6 mice were randomly divided into a syngeneic tumor group (n = 8) and an HC group (n = 8). Mice in the syngeneic tumor group were anesthetized via the intraperitoneal injection of 1% sodium pentobarbital, followed by the subcutaneous injection of a cell suspension (1 × 10⁷ cells/mL, 0.2 mL per mouse) into the right lateral tongue margin. Mice in the control group were injected with an equal volume of sterile DMEM.
- (3)
- NBI monitoring and indicator detection: The volume of syngeneic grafts was measured weekly after modeling, calculated according to the following formula: volume = length × width2/2. Meanwhile, NBI detection was performed using the same imaging protocol as described in the 4NQO-induced model section.
2.3.4. Histopathological Evaluation
2.4. Image Post-Processing and MOI Measurement
- (1)
- Image import and calibration: Raw NBI images in RGB format were imported into ImageJ via File > Open and split into red, green, and blue channels using Image > Color > Split Channels. Green-channel images were selected for subsequent analysis. Optical density calibration was performed by clicking Analyze > Calibrate under the “Uncalibrated OD” preset to unify measurement criteria for images captured in different batches and at different time points. To ensure standardization and reproducibility, consistent background normalization was applied across all samples, with identical calibration parameters used for both clinical and animal datasets to minimize inter-batch variation.
- (2)
- Image preprocessing: For green-channel images, the color balance was adjusted via Image > Adjust > Color Balance to eliminate ambient light interference.
- (3)
- Region of interest (ROI) selection:
- (4)
- Background optical intensity correction: Tissue-free areas of similar sizes to ROIs were selected as background references; background values were subtracted from the ROI optical intensities to obtain the corrected MOI, eliminating system background interference.
- (5)
- Optical intensity measurement and data recording: Corrected ROIs were analyzed via Analyze > Measure” to extract the MOI (the core evaluation index). Data were recorded in Excel and expressed as the mean ± standard (SD) deviation for subsequent statistical analysis.
- (6)
- Repeatability verification: The same batch of images was independently measured by two experimenters; the intraclass correlation coefficient (ICC) was calculated, with ICC ≥ 0.85 indicating stable and reliable measurement results.
2.5. Heatmap Visualization
- (1)
- Image preprocessing: The preprocessing procedure was consistent with that described in Section 2.4.
- (2)
- Grayscale conversion: Green-channel images were converted to 8-bit grayscale images using Image > Type > 8-bit. The brightness and contrast of all images were uniformly adjusted via Image > Adjust > Brightness/Contrast to ensure comparability of optical density signals across groups.
- (3)
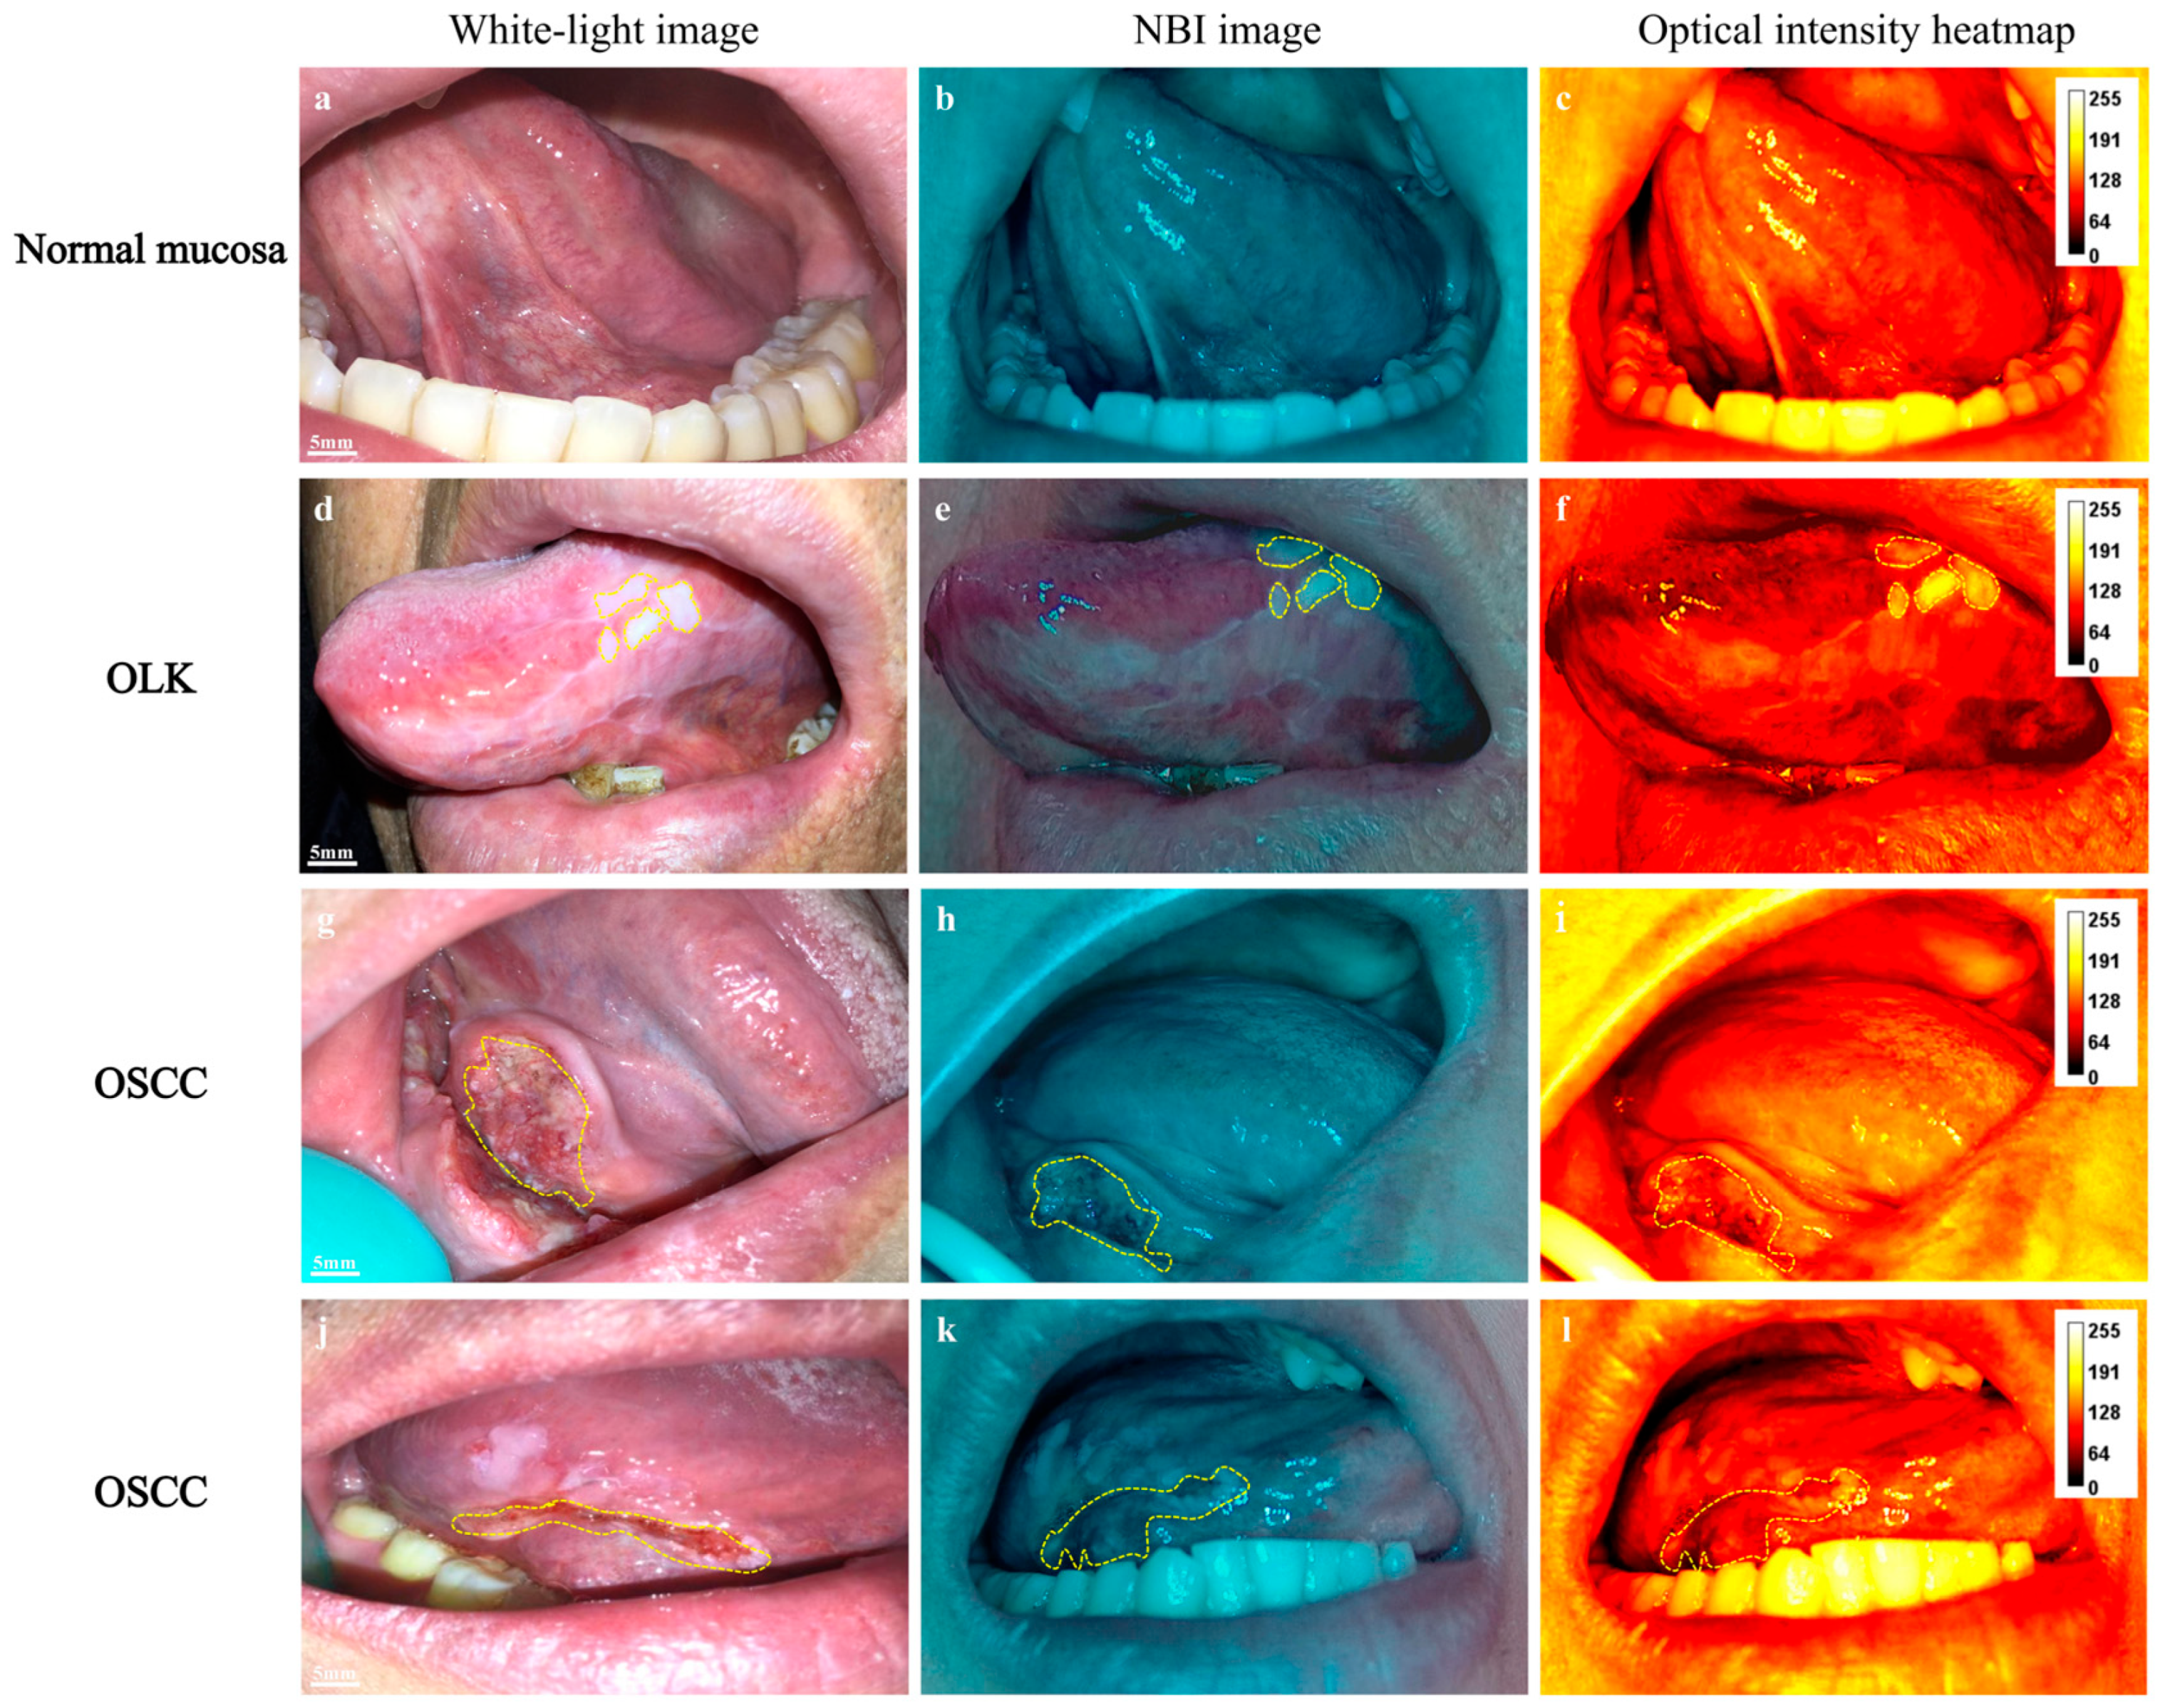
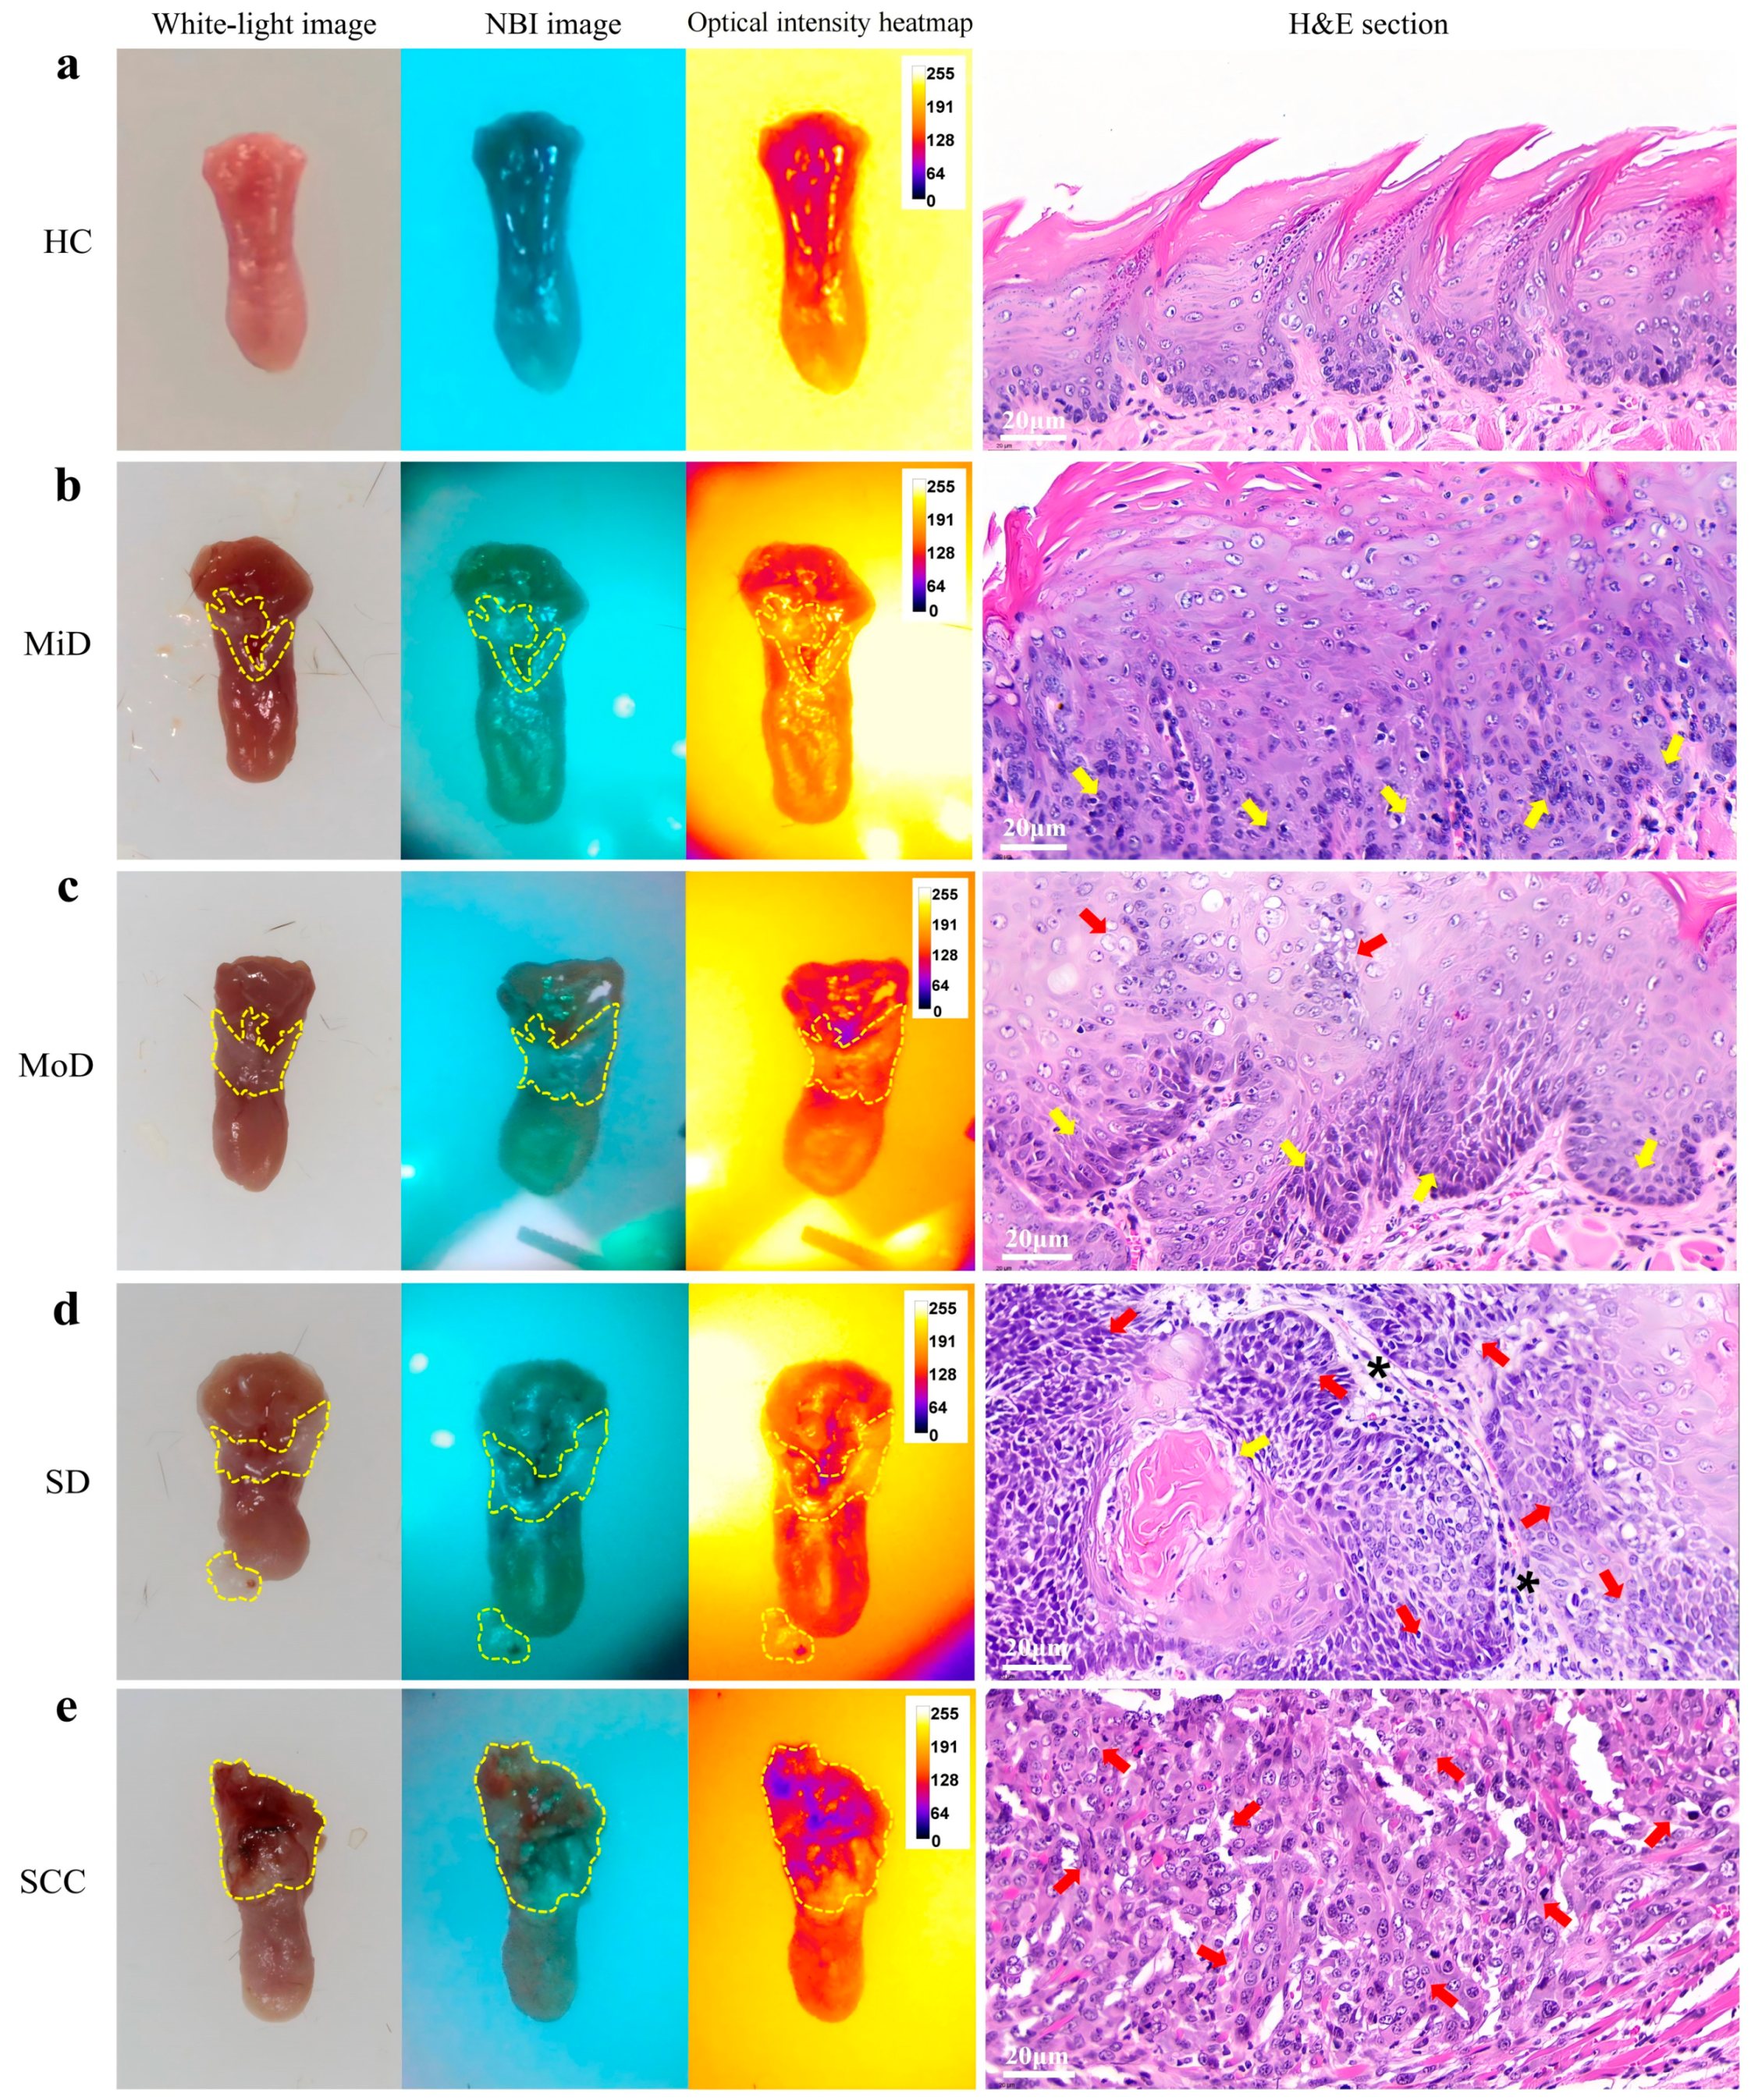
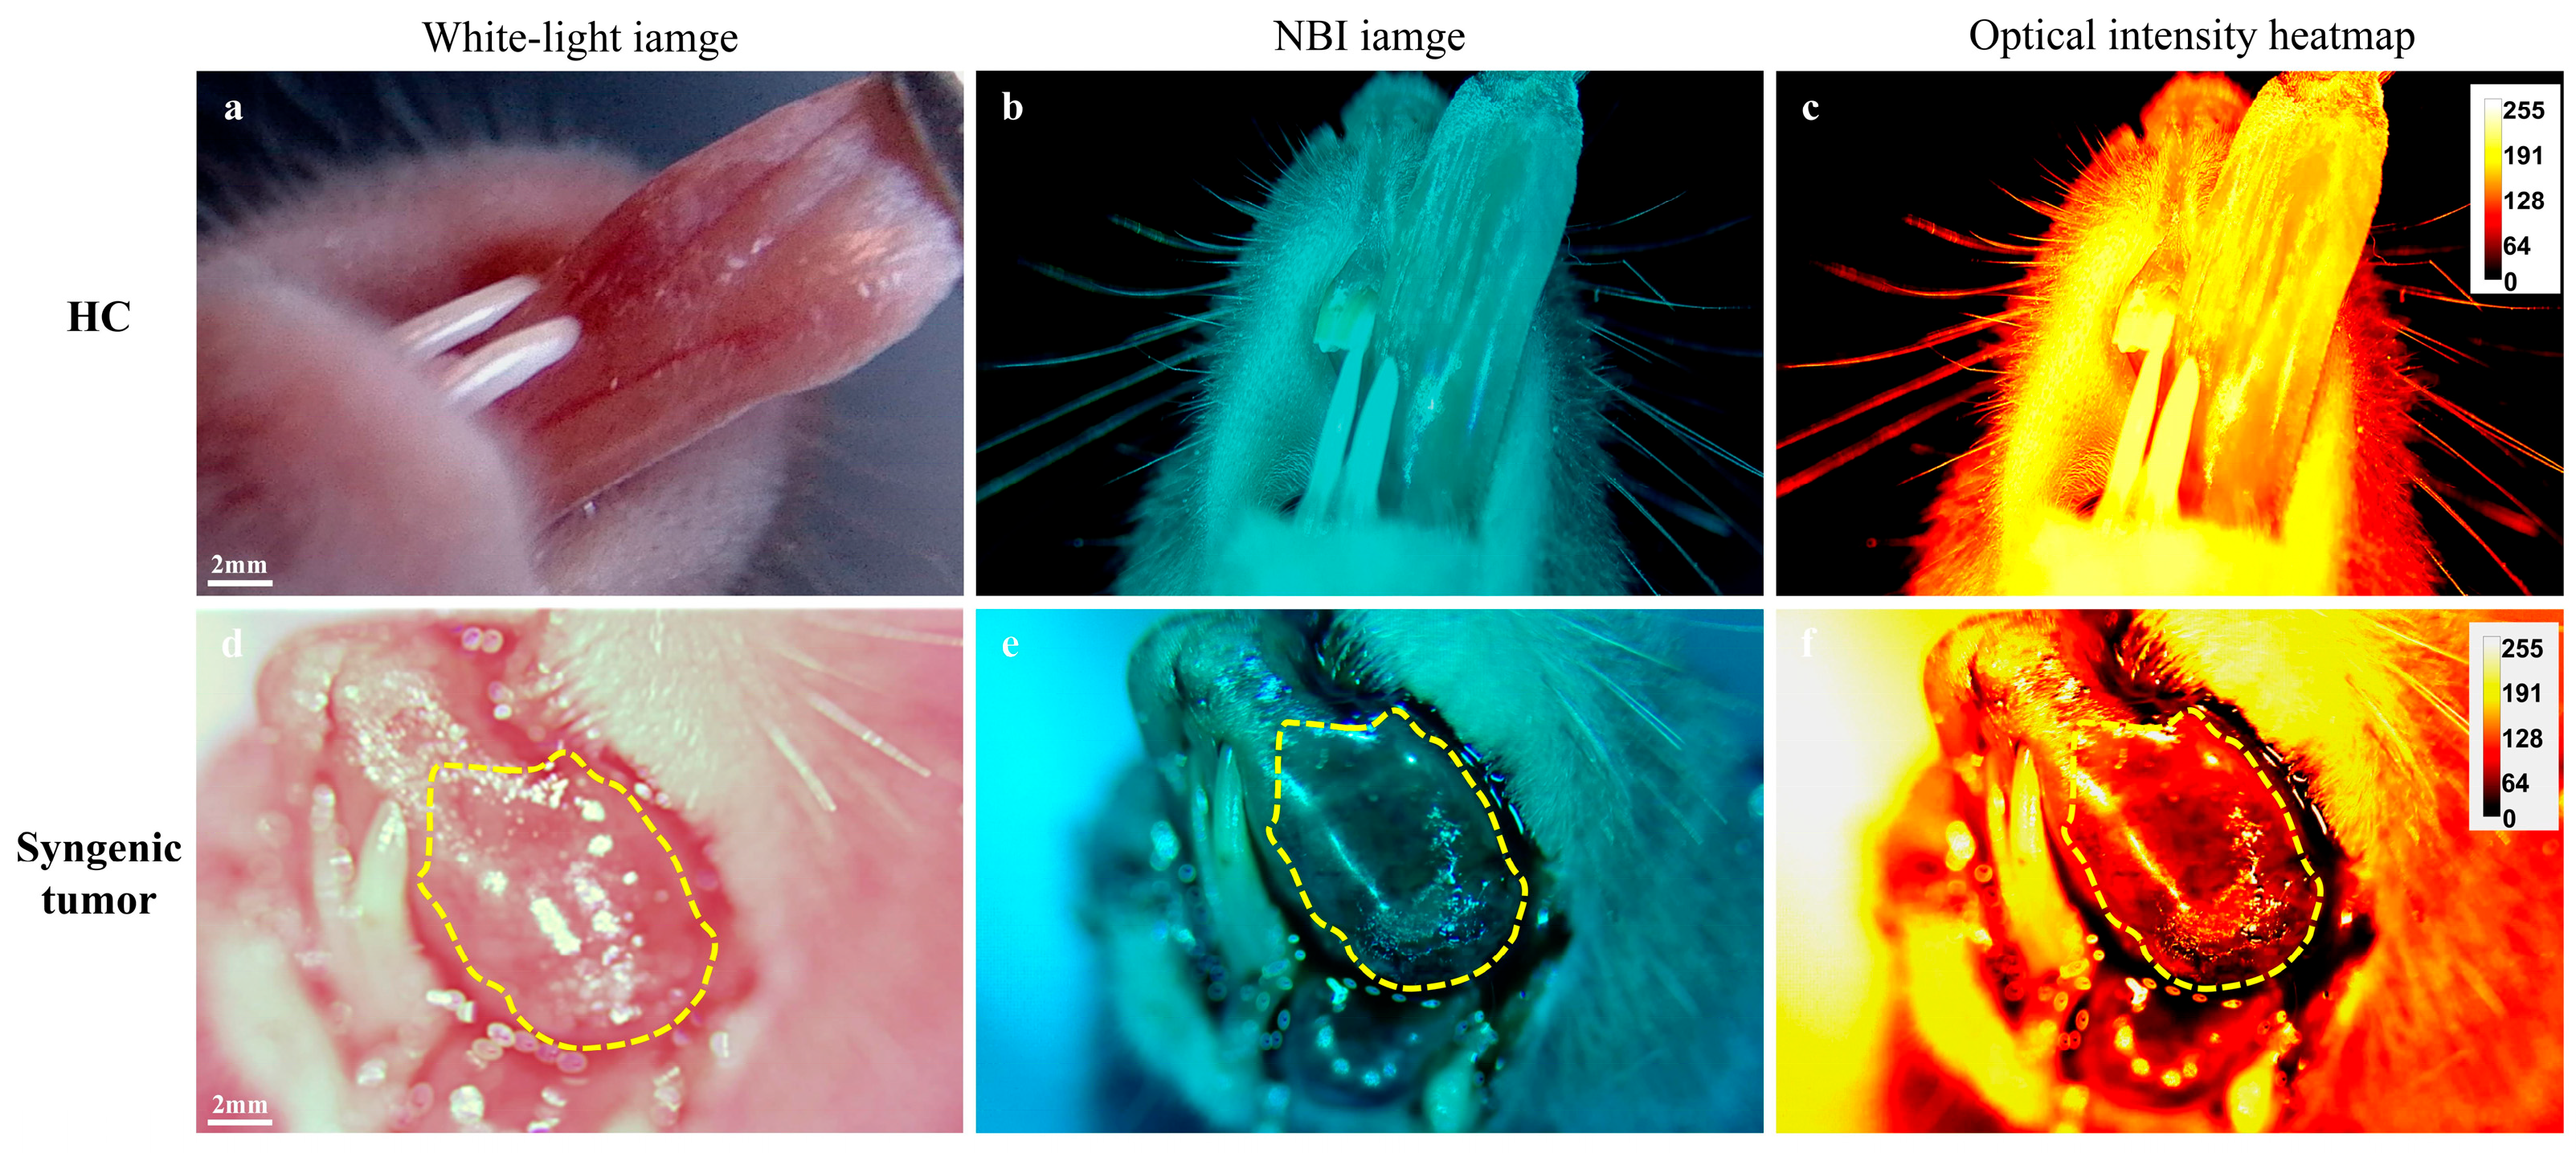
- Standardized pseudo-color lookup table (LUT) application: A unified pseudo-color lookup table (Image > Lookup Tables > Red Hot) was applied to the grayscale images for color mapping. Under this mapping scheme, regions with low optical density (lesional tissues) mainly appeared black, blue, or purple, whereas regions with high optical density (normal oral mucosa) were predominantly orange or yellow, directly reflecting spatial variations in the mucosal optical intensity.
- (4)
- Quantitative color bar generation: To define the quantitative correspondence between pseudo-color and optical density values, a standardized calibration bar was generated on the pseudo-color images using Analyze > Tools > Calibration Bar after parameter adjustment. The color bar was permanently embedded into images and saved via Image > Overlay > Flatten.
- (5)
- Quality control: Identical LUT and image-processing parameters were used for heatmap generation across all images. All operations were independently performed by two researchers to guarantee the reproducibility and the reliability of visualized results.
2.6. Statistical Analysis
3. Results
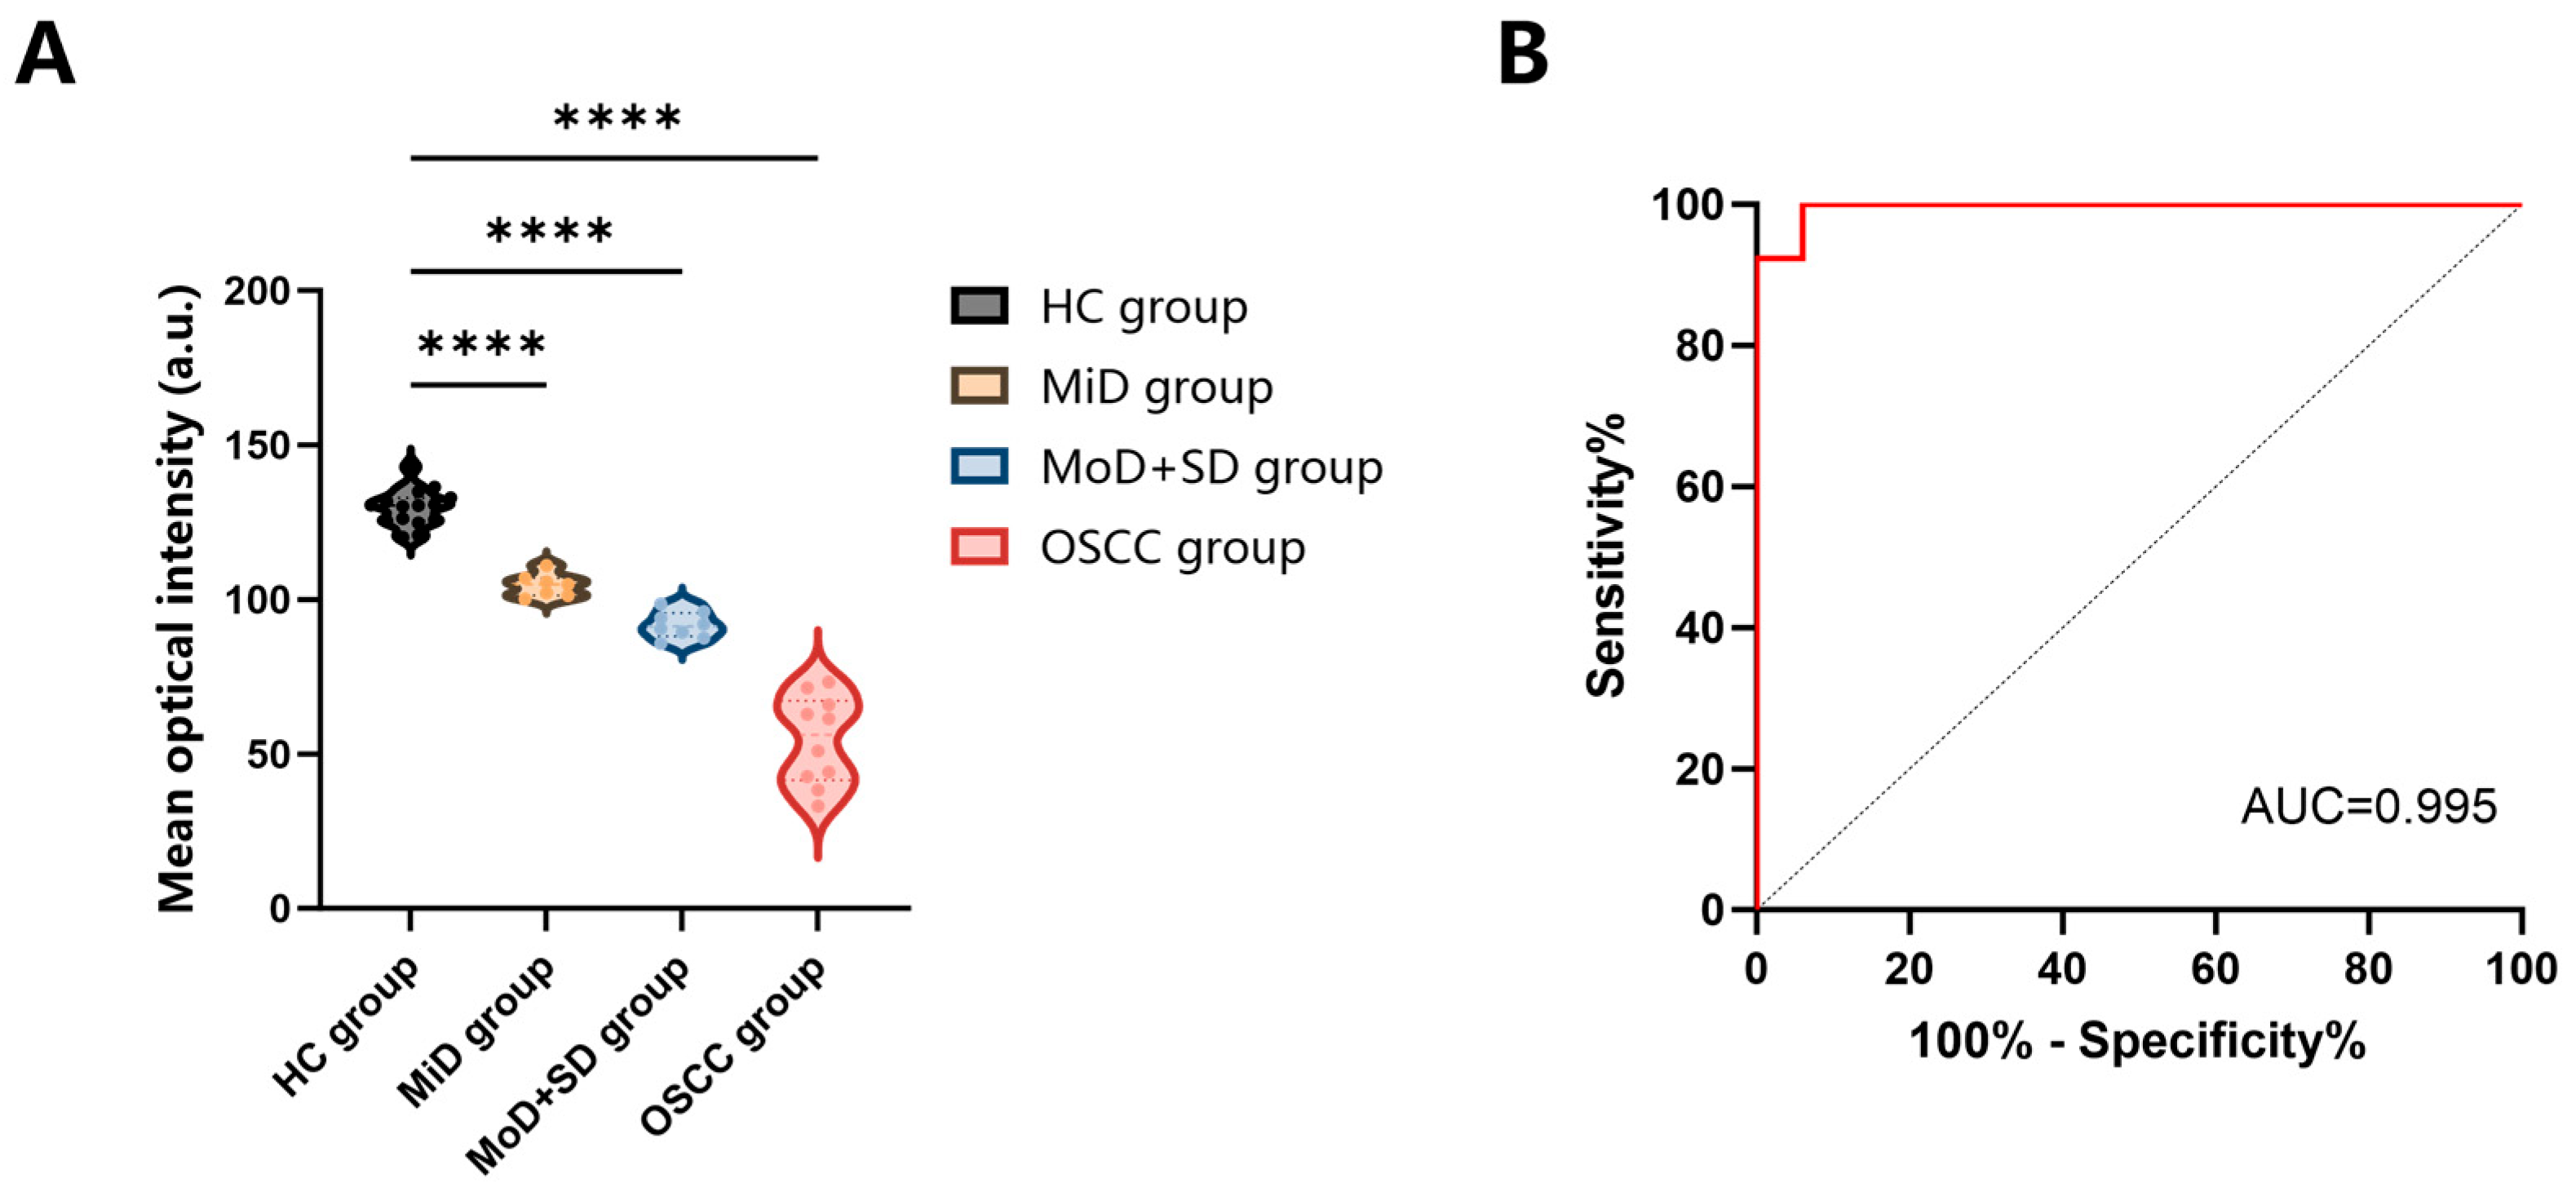
3.1. Gradual Optical Intensity Loss of Oral Mucosa Under NBI from Normal Mucosa to OLK and OSCC
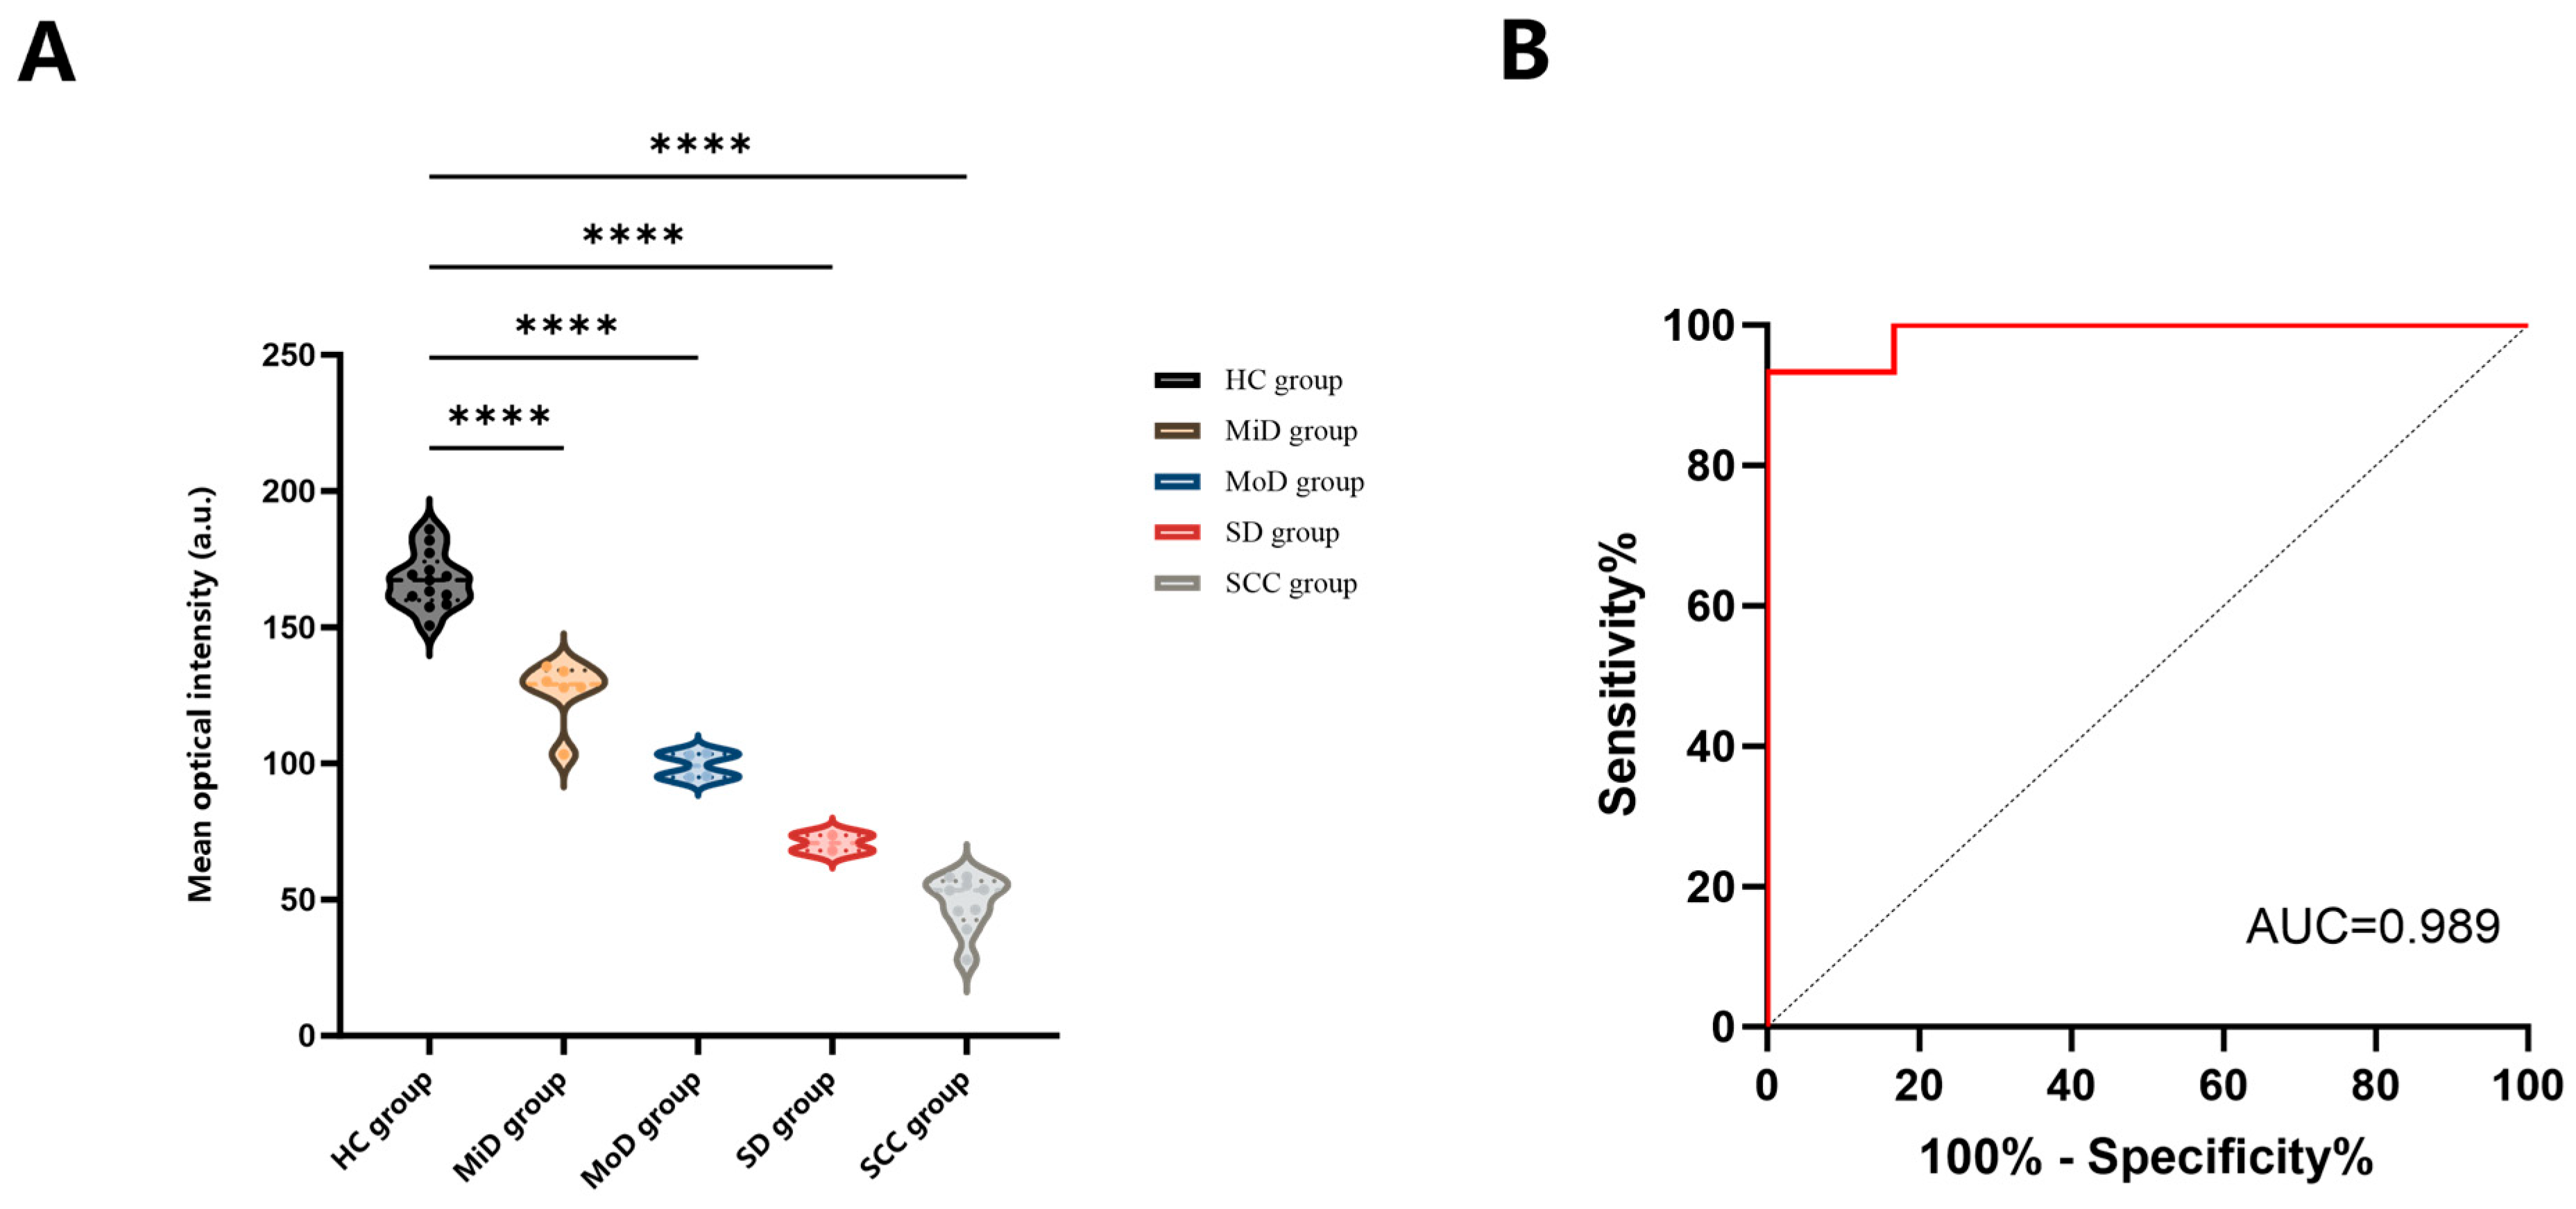
3.2. NBI-Derived MOI Is Negatively Correlated with Lesion Severity in 4NQO-Induced Carcinogenesis and Consistent with Pathological Findings
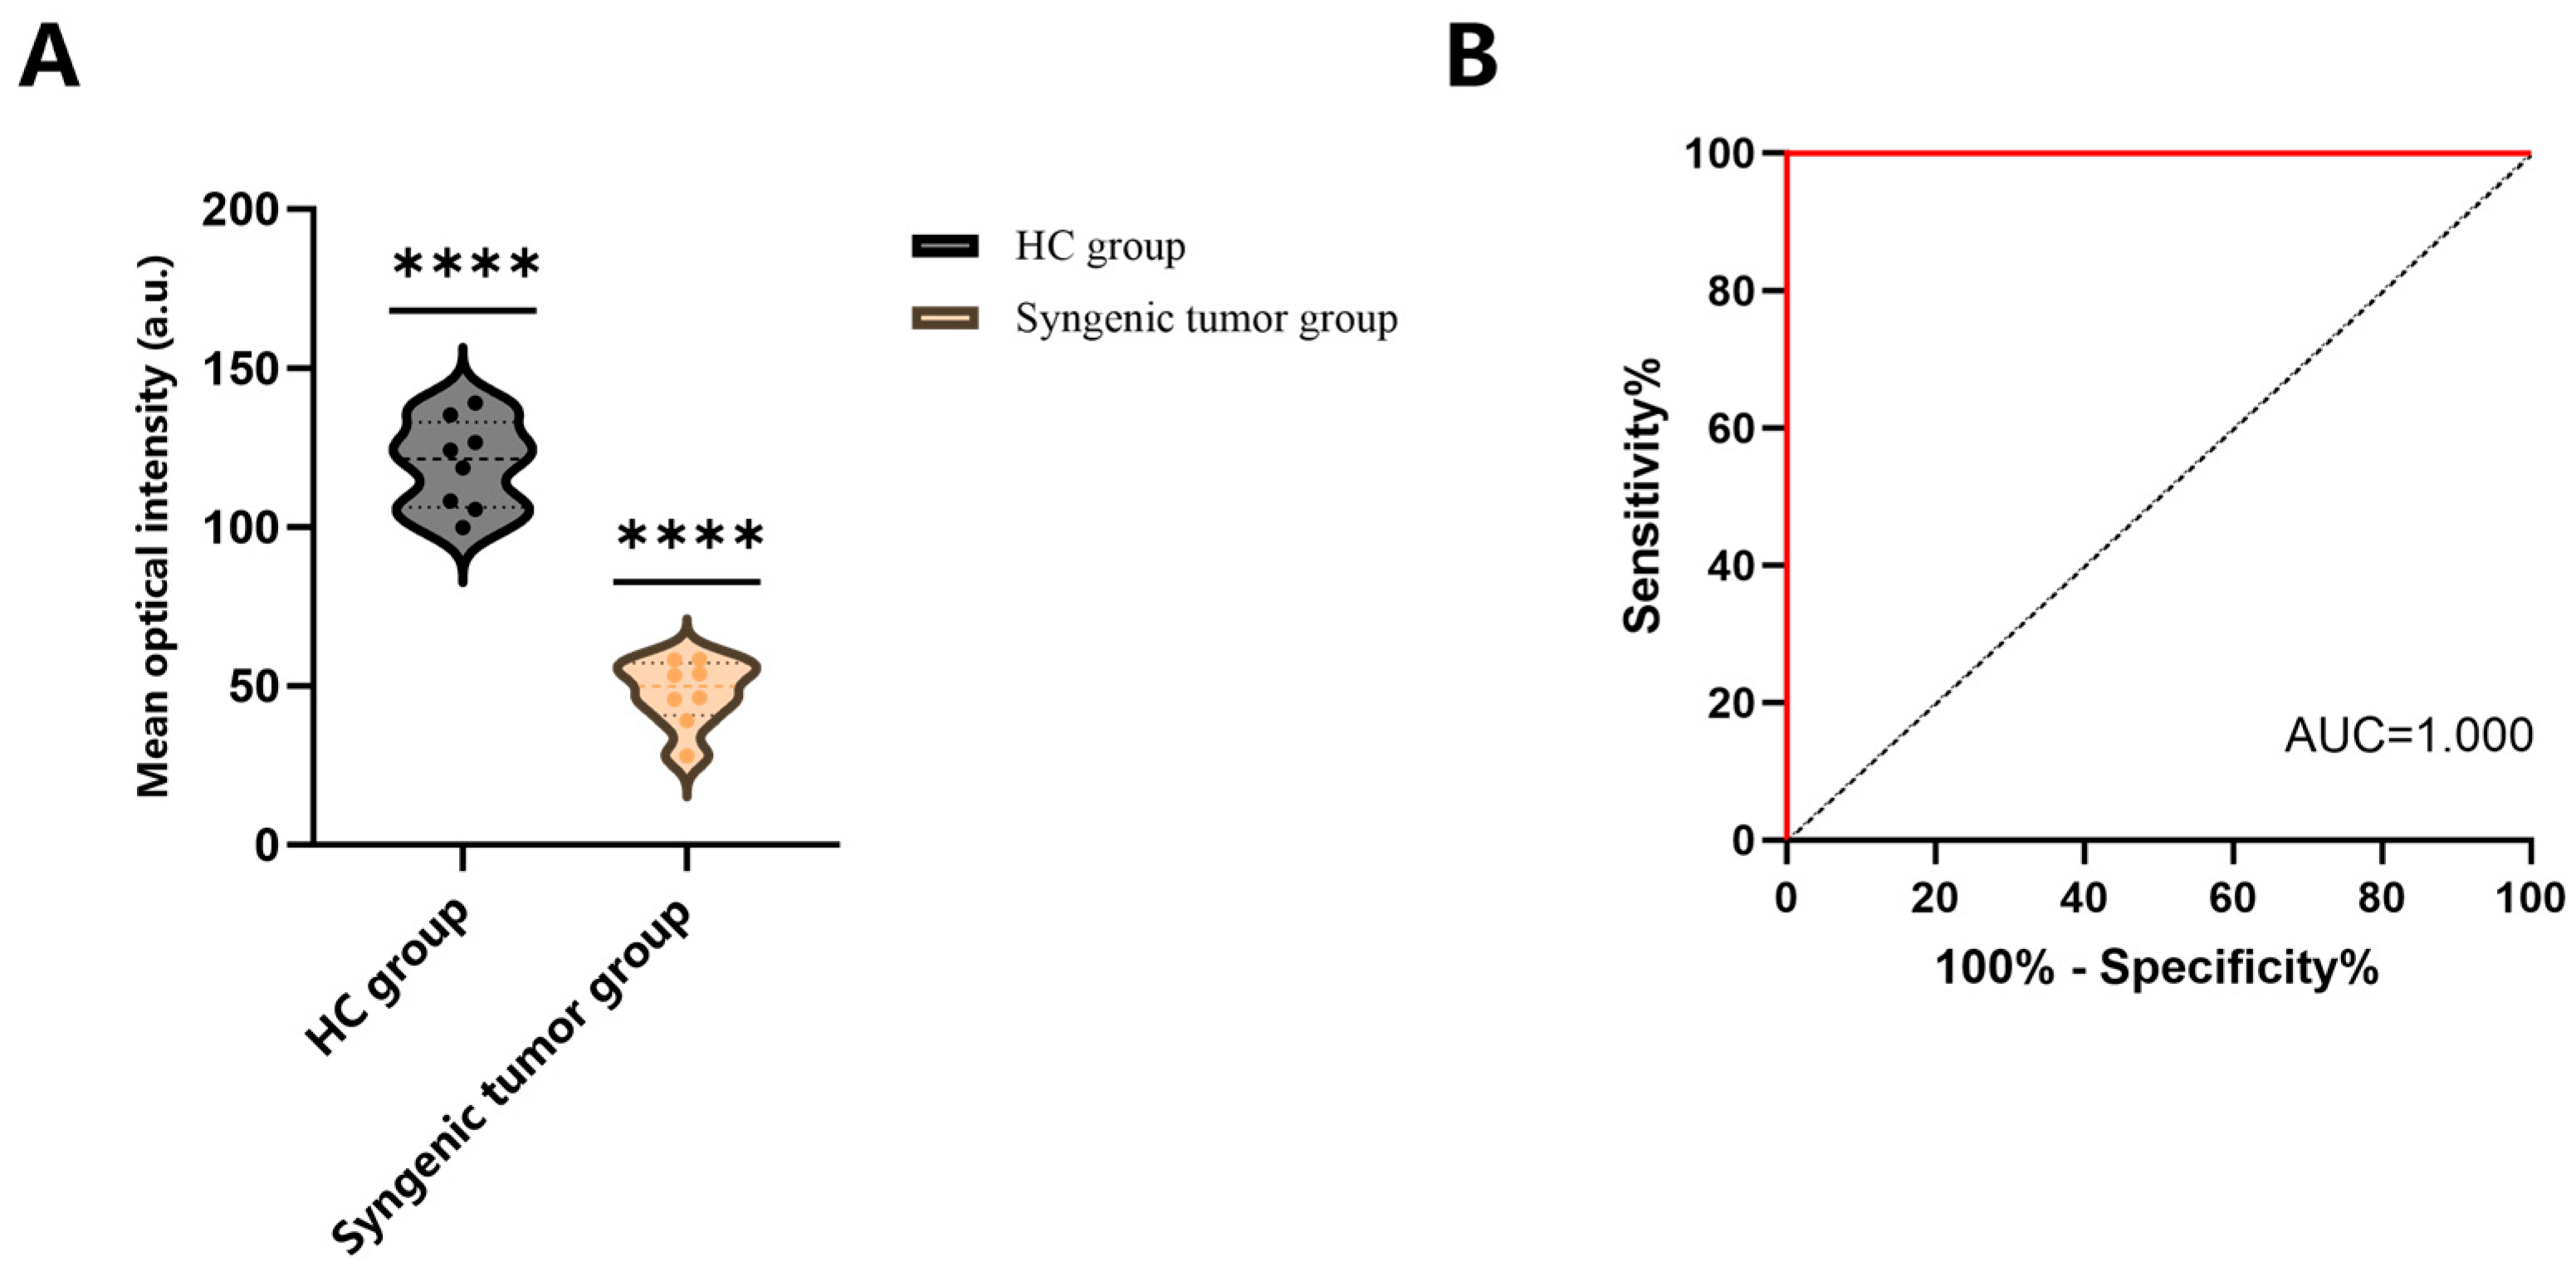
3.3. NBI Imaging Enables Accurate Identification of Syngeneic Tumor Lesion Boundaries with a Marked Reduction in Optical Intensity
4. Discussion
5. Conclusions
Supplementary Materials
Author Contributions
Funding
Institutional Review Board Statement
Informed Consent Statement
Data Availability Statement
Conflicts of Interest
Abbreviations
| 4NQO | 4-nitroquinoline 1-oxide |
| a.u. | arbitrary units |
| AUC | Area under the ROC curve |
| CI | Confidence interval |
| cv-AUC | cross-validated area under the curve |
| H&E | Hematoxylin and eosin |
| HC | Healthy control |
| MOI | Mean optical intensity |
| MiD | Mild dysplasia |
| MoD | Moderate dysplasia |
| NBI | Narrow-band imaging |
| OLK | Oral leukoplakia |
| OSCC | Oral squamous cell carcinoma |
| ROC | Receiver operating characteristic |
| ROI | Region of interest |
| SCC | Squamous cell carcinoma |
| SD | Severe dysplasia |
References
- Tan, Y.; Wang, Z.; Xu, M.; Li, B.; Huang, Z.; Qin, S.; Nice, E.C.; Tang, J.; Huang, C. Oral Squamous Cell Carcinomas: State of the Field and Emerging Directions. Int. J. Oral Sci. 2023, 15, 44. [Google Scholar] [CrossRef]
- Ali, A.; Molska, G.R.; Yeo, H.; Esfandiari, N.; Jeong, W.; Huang, M.; Magalhaes, M. Immune Microenvironment in Oral Potentially Malignant Disorders and Oral Cancer: A Narrative Review. Int. J. Mol. Sci. 2025, 26, 6650. [Google Scholar] [CrossRef]
- Ford, P.J.; Rich, A.M. Tobacco Use and Oral Health. Addiction 2021, 116, 3531–3540. [Google Scholar] [CrossRef] [PubMed]
- Jagadeesan, D.; Sathasivam, K.V.; Fuloria, N.K.; Balakrishnan, V.; Khor, G.H.; Ravichandran, M.; Solyappan, M.; Fuloria, S.; Gupta, G.; Ahlawat, A.; et al. Comprehensive Insights into Oral Squamous Cell Carcinoma: Diagnosis, Pathogenesis, and Therapeutic Advances. Pathol.-Res. Pract. 2024, 261, 155489. [Google Scholar] [CrossRef]
- Cristaldi, M.; Mauceri, R.; Di Fede, O.; Giuliana, G.; Campisi, G.; Panzarella, V. Salivary Biomarkers for Oral Squamous Cell Carcinoma Diagnosis and Follow-up: Current Status and Perspectives. Front. Physiol. 2019, 10, 1476. [Google Scholar] [CrossRef]
- Awan, K.H.; Morgan, P.R.; Warnakulasuriya, S. Assessing the Accuracy of Autofluorescence, Chemiluminescence and Toluidine Blue as Diagnostic Tools for Oral Potentially Malignant Disorders—A Clinicopathological Evaluation. Clin. Oral Investig. 2015, 19, 2267–2272. [Google Scholar] [CrossRef] [PubMed]
- Rex, D.K.; Clodfelter, R.; Rahmani, F.; Fatima, H.; James-Stevenson, T.N.; Tang, J.C.; Kim, H.N.; McHenry, L.; Kahi, C.J.; Rogers, N.A.; et al. Narrow-Band Imaging versus White Light for the Detection of Proximal Colon Serrated Lesions: A Randomized, Controlled Trial. Gastrointest. Endosc. 2016, 83, 166–171. [Google Scholar] [CrossRef]
- Kaise, M.; Kato, M.; Urashima, M.; Arai, Y.; Kaneyama, H.; Kanzazawa, Y.; Yonezawa, J.; Yoshida, Y.; Yoshimura, N.; Yamasaki, T.; et al. Magnifying Endoscopy Combined with Narrow-Band Imaging for Differential Diagnosis of Superficial Depressed Gastric Lesions. Endoscopy 2009, 41, 310–315. [Google Scholar] [CrossRef]
- Sharma, P.; Bergman, J.J.G.H.M.; Goda, K.; Kato, M.; Messmann, H.; Alsop, B.R.; Gupta, N.; Vennalaganti, P.; Hall, M.; Konda, V.; et al. Development and Validation of a Classification System to Identify High-Grade Dysplasia and Esophageal Adenocarcinoma in Barrett’s Esophagus Using Narrow-Band Imaging. Gastroenterology 2016, 150, 591–598. [Google Scholar] [CrossRef]
- Takano, J.H.; Yakushiji, T.; Kamiyama, I.; Nomura, T.; Katakura, A.; Takano, N.; Shibahara, T. Detecting Early Oral Cancer: Narrowband Imaging System Observation of the Oral Mucosa Microvasculature. Int. J. Oral Maxillofac. Surg. 2010, 39, 208–213. [Google Scholar] [CrossRef] [PubMed]
- Yang, Q.; Liu, Z.; Sun, H.; Jiao, F.; Zhang, B.; Chen, J. A Narrative Review: Narrow-Band Imaging Endoscopic Classifications. Quant. Imaging Med. Surg. 2023, 13, 1138–1163. [Google Scholar] [CrossRef] [PubMed]
- Kain, J.J.; Birkeland, A.C.; Udayakumar, N.; Morlandt, A.B.; Stevens, T.M.; Carroll, W.R.; Rosenthal, E.L.; Warram, J.M. Surgical Margins in Oral Cavity Squamous Cell Carcinoma: Current Practices and Future Directions. Laryngoscope 2020, 130, 128–138. [Google Scholar] [CrossRef] [PubMed]
- Noorlag, R.; De Bree, R.; Witjes, M.J.H. Image-Guided Surgery in Oral Cancer: Toward Improved Margin Control. Curr. Opin. Oncol. 2022, 34, 170–176. [Google Scholar] [CrossRef] [PubMed]
- Ugumori, T.; Muto, M.; Hayashi, R.; Hayashi, T.; Kishimoto, S. Prospective Study of Early Detection of Pharyngeal Superficial Carcinoma with the Narrowband Imaging Laryngoscope. Head Neck 2009, 31, 189–194. [Google Scholar] [CrossRef]
- Watanabe, A.; Taniguchi, M.; Tsujie, H.; Hosokawa, M.; Fujita, M.; Sasaki, S. The Value of Narrow Band Imaging Endoscope for Early Head and Neck Cancers. Otolaryngol.—Head Neck Surg. 2008, 138, 446–451. [Google Scholar] [CrossRef]
- Xu, Y.; Zhang, T.; Liu, D.; Qiu, X.; Hou, F.; Wang, J.; Luo, X.; Dan, H.; Zhou, Y.; Zeng, X.; et al. New IPCL Classification Using NBI for Early Detection of OPMDS Malignant Transformation. Oral Dis. 2025, 31, 1198–1205. [Google Scholar] [CrossRef]
- Ota, A.; Miyamoto, I.; Ohashi, Y.; Chiba, T.; Takeda, Y.; Yamada, H. Diagnostic Accuracy of High-Grade Intraepithelial Papillary Capillary Loops by Narrow Band Imaging for Early Detection of Oral Malignancy: A Cross-Sectional Clinicopathological Imaging Study. Cancers 2022, 14, 2415. [Google Scholar] [CrossRef]
- Hsu, P.-C.; Huang, J.-H.; Tsai, C.-C.; Lin, Y.-H.; Kuo, C.-Y. Early Molecular Diagnosis and Comprehensive Treatment of Oral Cancer. Curr. Issues Mol. Biol. 2025, 47, 452. [Google Scholar] [CrossRef]
- Yuvaraj, M.; Udayakumar, K.; Jayanth, V.; Prakasa Rao, A.; Bharanidharan, G.; Koteeswaran, D.; Munusamy, B.D.; Murali Krishna, C.; Ganesan, S. Fluorescence Spectroscopic Characterization of Salivary Metabolites of Oral Cancer Patients. J. Photochem. Photobiol. B Biol. 2014, 130, 153–160. [Google Scholar] [CrossRef]
- Liu, Y.; Yang, Z.; Pu, J.J.; Zhong, J.; Khoo, U.; Su, Y.; Zhang, G. Proteogenomic Characterisation of Primary Oral Cancer Unveils Extracellular Matrix Remodelling and Immunosuppressive Microenvironment Linked to Lymph Node Metastasis. Clin. Transl. Med. 2025, 15, e70261. [Google Scholar] [CrossRef]
- Ibi, H.; Takahashi, K.; Harada, H.; Watabe, T.; Podyma-Inoue, K.A. Transforming Growth Factor-β Signals Promote Progression of Squamous Cell Carcinoma by Inducing Epithelial-Mesenchymal Transition and Angiogenesis. Biochem. Biophys. Res. Commun. 2024, 714, 149965. [Google Scholar] [CrossRef]
- Pohl, M.; Riphaus, A.; Steckstor, M.; Canbay, D.; Tannapfel, A.; Canbay, A.; Kunkel, M.; Weninger, J. Diagnostic Value of White-Light Endoscopy, Narrow-Band Imaging, and Chromoendoscopy in Detecting Esophageal Involvement in Oral Lichen Planus and Based Squamous Cell Carcinoma. Digestion, 2025; Online ahead of print. [CrossRef]
- Hong, K.; Lei, C.; Kan, X.; Ouyang, Y.; Mei, Y.; Guo, Y.; Wang, B.; Zhang, D.; Li, J.; Li, R.; et al. Artificial Intelligence for Early Gastric Cancer Boundary Recognition in NBI and nF-NBI Endoscopic Images. Scand. J. Gastroenterol. 2025, 60, 624–634. [Google Scholar] [CrossRef]
- Sampieri, C.; Azam, M.A.; Ioppi, A.; Baldini, C.; Moccia, S.; Kim, D.; Tirrito, A.; Paderno, A.; Piazza, C.; Mattos, L.S.; et al. Real-Time Laryngeal Cancer Boundaries Delineation on White Light and Narrow-Band Imaging Laryngoscopy with Deep Learning. Laryngoscope 2024, 134, 2826–2834. [Google Scholar] [CrossRef] [PubMed]
- Yang, S.-W.; Lee, Y.-S.; Chang, L.-C.; Hsieh, T.-Y.; Chen, T.-A. Implications of Morphologic Patterns of Intraepithelial Microvasculature Observed by Narrow-Band Imaging System in Cases of Oral Squamous Cell Carcinoma. Oral Oncol. 2013, 49, 86–92. [Google Scholar] [CrossRef]
- Kuroki, T.; Maeda, Y.; Kudo, S.-E.; Ogata, N.; Takabayashi, K.; Takenaka, K.; Kawashima, J.; Kawabata, Y.; Iwasaki, S.; Shiina, O.; et al. Combination of White-Light Imaging-Based and Narrow-Band Imaging-Based Artificial Intelligence Models during Colonoscopy in Patients with Ulcerative Colitis. J. Crohn’s Colitis 2025, 19, jjaf014. [Google Scholar] [CrossRef] [PubMed]
- Baik, Y.S.; Lee, H.; Kim, Y.J.; Chung, J.-W.; Kim, K.G. Early Detection of Esophageal Cancer: Evaluating AI Algorithms with Multi-Institutional Narrowband and White-Light Imaging Data. PLoS ONE 2025, 20, e0321092. [Google Scholar] [CrossRef]
- Tang, D.; Ni, M.; Zheng, C.; Ding, X.; Zhang, N.; Yang, T.; Zhan, Q.; Fu, Y.; Liu, W.; Zhuang, D.; et al. A Deep Learning-Based Model Improves Diagnosis of Early Gastric Cancer under Narrow Band Imaging Endoscopy. Surg. Endosc. 2022, 36, 7800–7810. [Google Scholar] [CrossRef] [PubMed]
- Yuan, X.-L.; Liu, W.; Lin, Y.-X.; Deng, Q.-Y.; Gao, Y.-P.; Wan, L.; Zhang, B.; Zhang, T.; Zhang, W.-H.; Bi, X.-G.; et al. Effect of an Artificial Intelligence-Assisted System on Endoscopic Diagnosis of Superficial Oesophageal Squamous Cell Carcinoma and Precancerous Lesions: A Multicentre, Tandem, Double-Blind, Randomised Controlled Trial. Lancet Gastroenterol. Hepatol. 2024, 9, 34–44. [Google Scholar] [CrossRef]


Disclaimer/Publisher’s Note: The statements, opinions and data contained in all publications are solely those of the individual author(s) and contributor(s) and not of MDPI and/or the editor(s). MDPI and/or the editor(s) disclaim responsibility for any injury to people or property resulting from any ideas, methods, instructions or products referred to in the content. |
© 2026 by the authors. Licensee MDPI, Basel, Switzerland. This article is an open access article distributed under the terms and conditions of the Creative Commons Attribution (CC BY) license.
Share and Cite
Huang, Z.; Wang, Y.; Luo, Y.; Zhang, Z.; Huang, J.; Zang, S.; Ye, P.; Peng, Q.; Liu, T.; Wang, W.; et al. Narrow-Band-Imaging-Derived Mean Optical Intensity: A Potential Biomarker for Monitoring the Progression of Oral Squamous Cell Carcinoma. Biomedicines 2026, 14, 1234. https://doi.org/10.3390/biomedicines14061234
Huang Z, Wang Y, Luo Y, Zhang Z, Huang J, Zang S, Ye P, Peng Q, Liu T, Wang W, et al. Narrow-Band-Imaging-Derived Mean Optical Intensity: A Potential Biomarker for Monitoring the Progression of Oral Squamous Cell Carcinoma. Biomedicines. 2026; 14(6):1234. https://doi.org/10.3390/biomedicines14061234
Chicago/Turabian StyleHuang, Zhuwei, Yuan Wang, Yixian Luo, Zixu Zhang, Jiaxuan Huang, Shixian Zang, Pei Ye, Qiao Peng, Ting Liu, Wenmei Wang, and et al. 2026. "Narrow-Band-Imaging-Derived Mean Optical Intensity: A Potential Biomarker for Monitoring the Progression of Oral Squamous Cell Carcinoma" Biomedicines 14, no. 6: 1234. https://doi.org/10.3390/biomedicines14061234
APA StyleHuang, Z., Wang, Y., Luo, Y., Zhang, Z., Huang, J., Zang, S., Ye, P., Peng, Q., Liu, T., Wang, W., Wang, X., & Duan, N. (2026). Narrow-Band-Imaging-Derived Mean Optical Intensity: A Potential Biomarker for Monitoring the Progression of Oral Squamous Cell Carcinoma. Biomedicines, 14(6), 1234. https://doi.org/10.3390/biomedicines14061234