Article

Comparative Analysis of Selected UGT and SULT MRNA Expression in Non-Obese Rat Models of Metabolic Syndrome


1
Department of Pharmacology, Faculty of Medicine and Dentistry, Palacky University Olomouc, 779 00 Olomouc, Czech Republic
2
Centre for Experimental Medicine, Institute of Clinical and Experimental Medicine, 140 21 Prague, Czech Republic
*
Authors to whom correspondence should be addressed.
Biomedicines 2026, 14(6), 1206; https://doi.org/10.3390/biomedicines14061206
Submission received: 14 April 2026 / Revised: 19 May 2026 / Accepted: 25 May 2026 / Published: 27 May 2026
(This article belongs to the Section Molecular Genetics and Genetic Diseases)

Abstract

Background: Metabolic syndrome (MetS) is a cluster of risk factors increasing the likelihood of cardiovascular and metabolic diseases. Objectives: This study investigated the relative mRNA expression of key hepatic and intestinal phase II drug-metabolising enzymes, specifically UDP-glycosyltransferases (UGTs) and sulfotransferases (SULTs), in four non-obese rat models of MetS characterised by different dominant traits: the hereditary hypertriglyceridaemic (HHTg) rat, spontaneously hypertensive rat (SHR), SHR-expressing transgenic human C-reactive protein (SHR-CRP) rat, and bilaterally ovariectomised female Wistar (W-OVX) rat, compared to Wistar controls. Methods: Gene expression was quantified by RT-PCR with data normalised using the ΔΔCt method. Results: Measurements showed significant model-specific differences, especially in the liver. HHTg rats exhibited significant hepatic suppression of Ugt1a9 (−90%) and undetectable Ugt2b transcripts, alongside compensatory upregulation of Sult1a1 (196%) and Sult1b1 (277%). The SHR model showed significant hepatic upregulation of Ugt1a1 (330%), Sult1a1 (266%), and Sult1b1 (328%). Chronic inflammation in SHR-CRP rats caused a significant decrease in hepatic Ugt1a1, whereas a significant induction occurred in the intestine. Oestrogen deprivation (W-OVX) led to significant downregulation of hepatic Ugt1a6 and Ugt1a9. Conclusions: These findings highlight that the alterations in phase II metabolism strongly depend on the pathophysiological context, potentially affecting drug disposition in preclinical models.

1. Introduction

Metabolic syndrome (MetS) represents a cluster of interrelated metabolic disorders characterised by hypertension, dyslipidaemia, insulin resistance and altered glucose homeostasis, collectively increasing the risk of cardiovascular and metabolic diseases [1]. Whilst obesity is commonly associated with MetS, non-obese phenotypes of metabolic dysfunction have garnered increasing attention as they represent a distinct pathophysiological entity that may reflect genetic predisposition or specific metabolic derangements [2].
Non-obese animal models of MetS offer valuable tools for dissecting the molecular mechanisms underlying these conditions whilst circumventing the confounding effects of adiposity. Our previous work examined cytochrome P450-mediated (phase I) drug metabolism across various non-obese rat models, revealing significant inter-strain differences in gene expression of key drug-metabolising enzymes and nuclear receptors [3]. Phase I metabolism, catalysed primarily by the CYP superfamily, is responsible for the initial modification of xenobiotics. However, the efficiency of drug clearance and the generation of metabolites often depends critically on phase II biotransformation enzymes, which catalyse conjugation reactions that enhance hydrophilicity and facilitate elimination [4].
The two major families of phase II enzymes are UDP-glycosyltransferases (UGTs) and sulfotransferases (SULTs) [4]. While the UGT superfamily encompasses enzymes that transfer various UDP-sugars, the specific UGT1 and UGT2 families analysed in this study primarily catalyse glucuronidation of endogenous substrates (e.g., oestrogens) and xenobiotics, whereas SULTs mediate sulphation of phenolic and hydroxylic compounds [4]. Both enzyme families display tissue-specific and sex-specific expression patterns. Their activity can be modulated by metabolic stress, systemic inflammation and various hormonal factors [5].
The pathophysiological hallmarks of MetS, particularly chronic low-grade inflammation, oxidative stress, and dyslipidaemia, impact both hepatic and extrahepatic tissues, directly affecting the expression and activity of drug-metabolising enzymes [6]. While the impact of MetS on CYP is well documented, emerging evidence highlights that phase II pathways are also highly susceptible to these metabolic disturbances. The dysregulation of nuclear receptors (PXR, CAR, AhR) driven by pro-inflammatory cytokines and altered lipid homeostasis can lead to significant shifts in UGT an SULT expression profiles [7]. Furthermore, because UGTs and SULTs are responsible not only for metabolism of xenobiotics, but also for the biotransformation of endogenous signalling molecules, their alteration in MetS can create a pathophysiological feedback loop that further exacerbates metabolic dysfunction [8,9].
To date, comprehensive comparative data on UGT and SULT mRNA expression across multiple non-obese MetS models remain limited. This article extends our previous findings by systematically examining hepatic and intestinal UGT and SULT mRNA expression in established rat models representing distinct phenotypes of MetS. The specific UGT and SULT genes analysed in this study were selected on the basis of their established pharmacological relevance, their documented expression in rat hepatic and intestinal tissues, and their shared transcriptional regulation by the nuclear receptors studied in our previous work. To dissect the individual impact of specific cardiometabolic stressors, we have selected four male strains, the hereditary hypertriglyceridaemic (HHTg) rat, the spontaneously hypertensive rat (SHR), the SHR with transgenic human C-reactive protein (SHR-CRP) and the Wistar rat as a control group. We also compared ovariectomised female Wistar (W-OVX) rats with SHAM-operated female Wistar (W-SHAM) rats to clarify the impact of postmenopausal oestrogen deprivation. Our aim is to determine how these specific pathophysiological components individually drive strain-specific and tissue-specific patterns of phase II enzyme expression.

2. Materials and Methods

The animal strains, experimental design, and ethical procedures were described in detail in our previous study, which was focused on selected phase I enzymes, ABC transporters and nuclear receptors [3]. The metabolic and physiological characteristics of the specific animal cohorts used in this study, including body weight, plasma lipid levels, blood pressure and glucose homeostasis markers, were also characterised in our previous work [3]. A detailed summary of phenotypic data is available in Table S1 of the aforementioned publication. Briefly, the study included four groups of 7–9-month-old male rats, namely Wistar rats serving as the control group, and HHTg, SHR, and SHR rats with transgenic human C-reactive protein (SHR-CRP). To investigate sex-specific differences, two groups of seven-month-old female Wistar rats were also included: SHAM-operated Wistar (W-SHAM) and ovariectomised Wistar (W-OVX) rats. All animals were maintained under standard housing conditions with free access to food and water. The study was performed in accordance with the guidelines and practices established by the Animal Care and Use Committee of the Institute for Clinical and Experimental Medicine (IKEM), Prague, which accord with the European Convention on Animal Protection and Guidelines on Research Animal Use, and were approved by this committee and subsequently by the Ministry of Health of the Czech Republic (the decision number for this project is 25976/2016-OVZ and 27513/2022-5/OVZ). All experiments are in accordance with the ARRIVE guidelines.

2.1. Tissue Preparation and Real-Time Quantitative RT-PCR

Following the protocol established in our previous study, all animals were euthanised by decapitation under light anaesthesia in a postprandial state [3]. Samples of the liver and small intestine were immediately washed in saline and stored at −80 °C. Total RNA was isolated from the samples using the RNeasy Mini Kit (Qiagen, Hilden, Germany) according to the manufacturer’s instructions. RNA quality and concentration were determined spectrophotometrically, ensuring the criteria were met as previously described [3]. RNA purity was confirmed by A260/280 and A260/230 ratios ranging between 1.8 and 2.1. To ensure robust normalisation, Hprt1 was utilised as the endogenous reference gene, having demonstrated stable expression across all experimental groups in both hepatic and intestinal tissues. A transcript was considered non-detectable if the quantification cycle (Cp) values exceeded 40 cycles. Complete information regarding primer sequences is provided in Supplementary Table S1. Commercially available, pre-validated primer assays were utilised, which guarantee optimal amplification efficiency for all targets. To extend the initial analysis of xenobiotic metabolism, we assessed the mRNA expression of key UGTs and SULTs. The obtained data were normalised using the ΔΔCt method, and the values of the control groups were set to 100%.

2.2. Statistical Analysis

Statistical analysis was performed with TIBCO Statistica software (DataBon, Prague, Czech Republic, ver. 14.0.0.15). Prior to parametric testing, data were evaluated for normal distribution using the Shapiro–Wilk test. While some variables exhibited deviations from strict normality, parametric tests were utilised due to their established robustness when group sample sizes are balanced. One-way ANOVA with a subsequent post hoc Bonferroni correction was used for the comparison of the Wistar, HHTg and SHR groups. For the comparison of the groups (SHR and SHR-CRP, W-SHAM and W-OVX), an unpaired Student’s t-test was used. Statistical significance was defined as p < 0.05.

3. Results

3.1. Comparison of Hepatic UGT and SULT mRNA Expression in Wistar, HHTg and SHR Rats

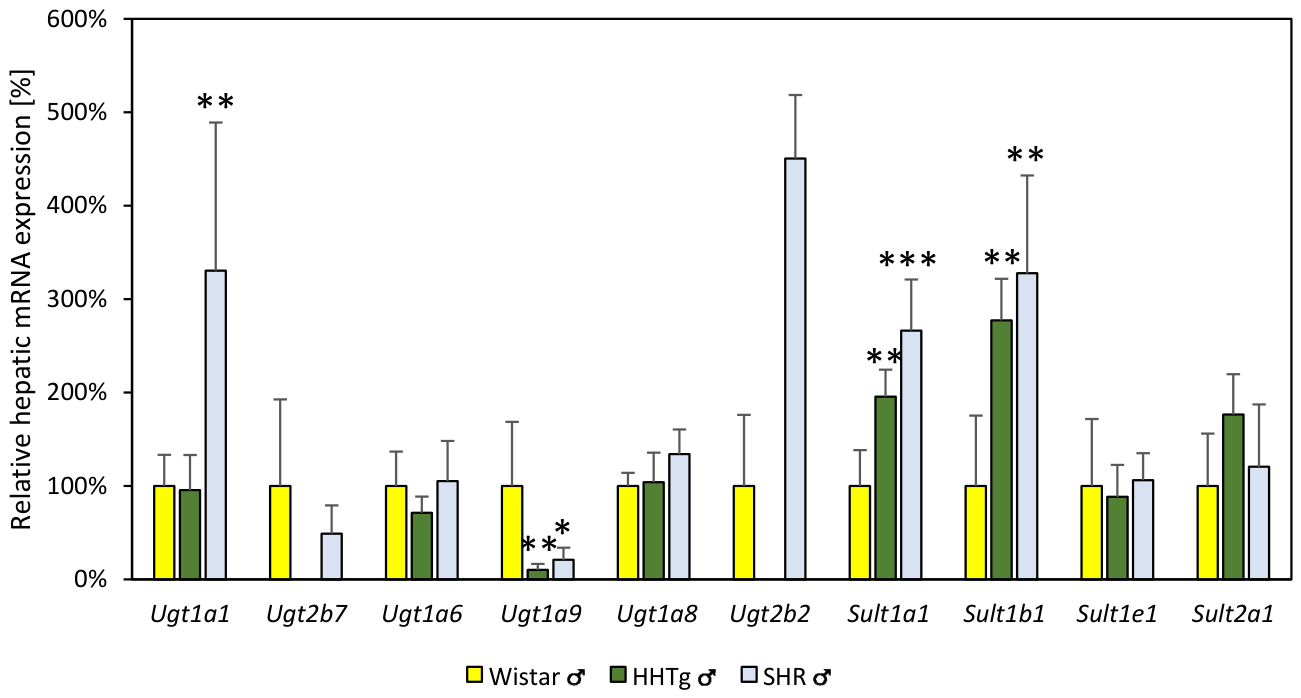
Differences in the relative mRNA expression of selected UGT and SULT isoforms in the hepatic tissue of HHTg and SHR rats, compared with the control Wistar strain, are illustrated in Figure 1. HHTg rats exhibited a statistically significant reduction in Ugt1a9 expression to 10% compared to Wistar rats (p < 0.05). Conversely, a significantly increased expression to 196% (p < 0.01) for Sult1a1 and to 277% (p < 0.01) for Sult1b1 was observed. Notably, mRNA expression for Ugt2b7 and Ugt2b2 was not detected in the HHTg strain. The remaining isoforms analysed in this strain showed no statistically significant differences relative to controls. As for the SHR group, a statistically significant reduction in Ugt1a9 expression to 21% (p < 0.01) was also observed in comparison with the Wistar group. In contrast to the Wistar controls, SHR rats demonstrated highly statistically significant increases to 330% (p < 0.01) in the expression of Ugt1a1, to 266% (p < 0.001) for Sult1a1, and to 328% (p < 0.01) for Sult1b1. Regarding the other isoforms in the SHR strain, the mean expression of Ugt2b2 reached 451% of the control value; however, this difference did not achieve statistical significance. The expression levels of the remaining isoforms analysed in SHR rats did not differ significantly from the Wistar group.

3.2. Effect of Human C-Reactive Protein on Hepatic UGT and SULT mRNA Expression in SHR Rats

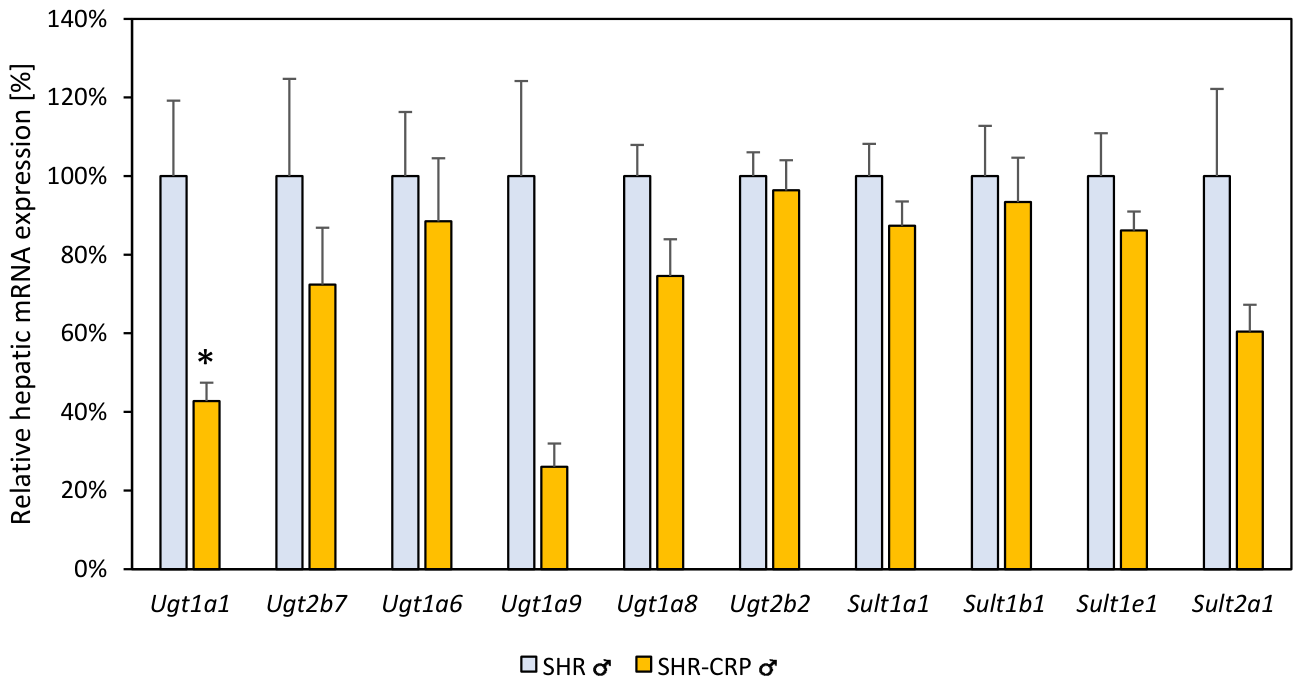
Differences in the relative mRNA expression of selected UGT and SULT isoforms in the hepatic tissue of male SHR-CRP rats, compared with the control male SHR rats, are demonstrated in Figure 2. Compared with the control SHR group (set as the 100% baseline), the SHR-CRP rats exhibited a statistically significant reduction in Ugt1a1 expression to approximately 43% (p < 0.05). A trend towards decreased mean expression was also observed for all other isoforms analysed. However, these differences did not achieve statistical significance. The most pronounced, though statistically non-significant, reductions to approximately 26% for Ugt1a9 and to approximately 60% for Sult2a1 were noted.

3.3. Effect of Ovariectomy on Hepatic UGT and SULT mRNA Expression in Female Wistar Rats

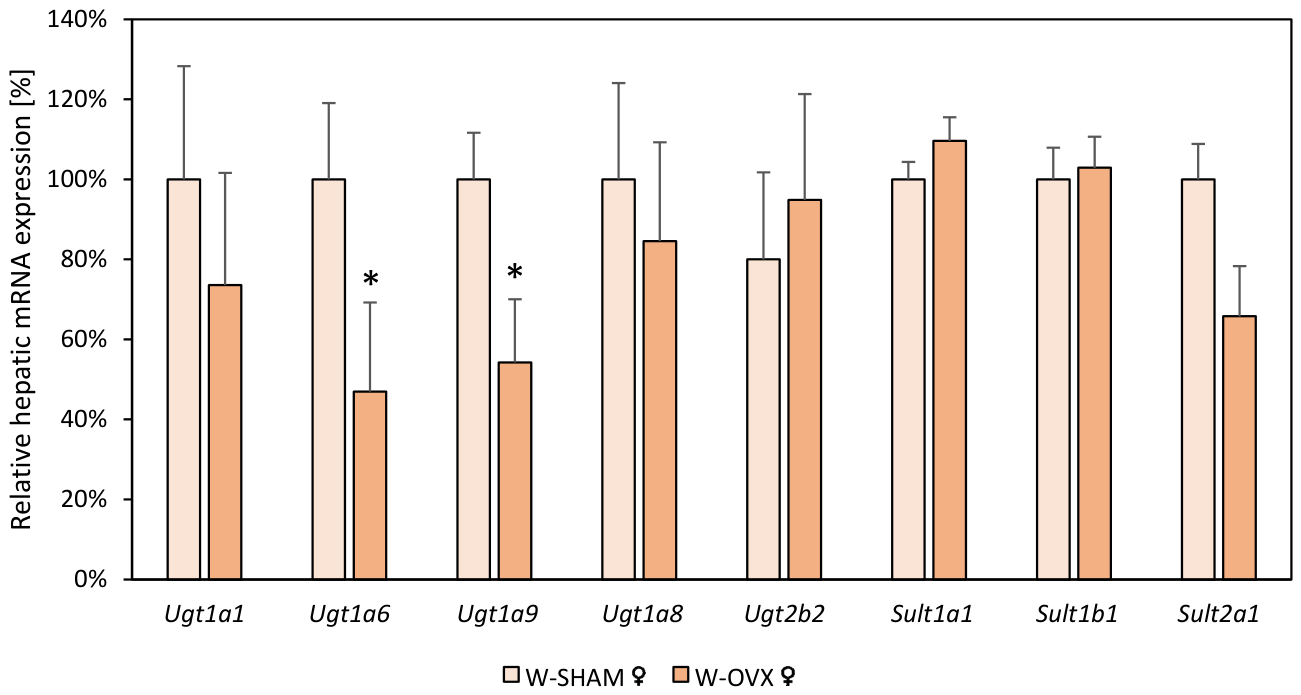
The effect of ovariectomy on the relative mRNA expression of hepatic UGT and SULT isoforms in female Wistar (W-OVX) rats is shown in Figure 3. The baseline for the control group, SHAM-operated female Wistar (W-SHAM) rats, was set to 100%. The W-OVX group exhibited statistically significant downregulation of Ugt1a6 to 47% and of Ugt1a9 to 54% in comparison with the W-SHAM group (p < 0.05). A non-significant trend towards reduced expression in the W-OVX group was also observed in Ugt1a1, Ugt1a8 and Sult2a1. The expression levels of the remaining isoforms analysed did not differ significantly between the W-OVX and W-SHAM groups.

3.4. Comparison of Intestinal UGT and SULT mRNA Expression in Wistar, HHTg and SHR Rats

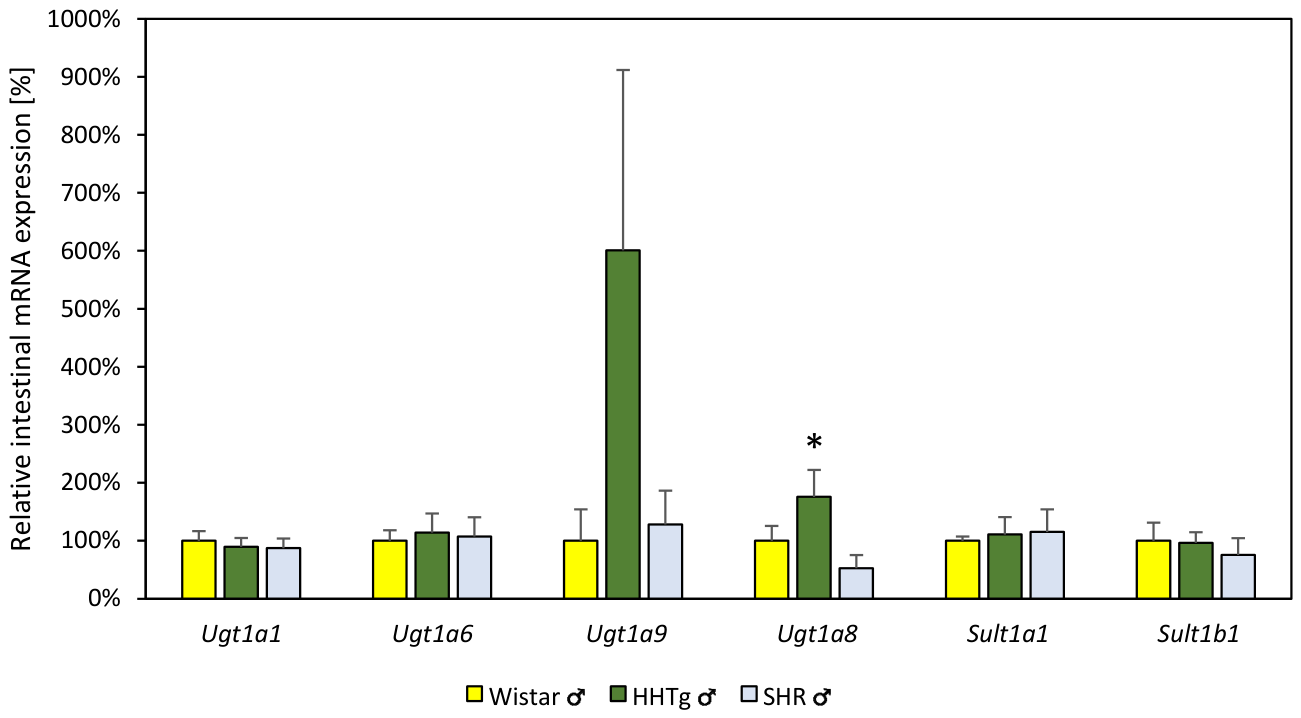
The differences in relative mRNA expression of selected UGT and SULT isoforms in the small intestine tissues of male HHTg and SHR rats, compared with control male Wistar rats, are presented in Figure 4. In the HHTg strain, a statistically significant increase in Ugt1a8 expression was observed, reaching approximately 176% of the Wistar control (p < 0.05). A substantial, though statistically non-significant, mean increase was also noted for Ugt1a9 in this group, to approximately 600%, but this finding was associated with high biological variability, as indicated by the SEM. No statistically significant differences from the Wistar controls were found for any of the other isoforms analysed in the HHTg strain, nor for any of the isoforms measured in the SHR strain.

3.5. Effect of Human C-Reactive Protein on Intestinal UGT and SULT mRNA Expression in SHR Rats

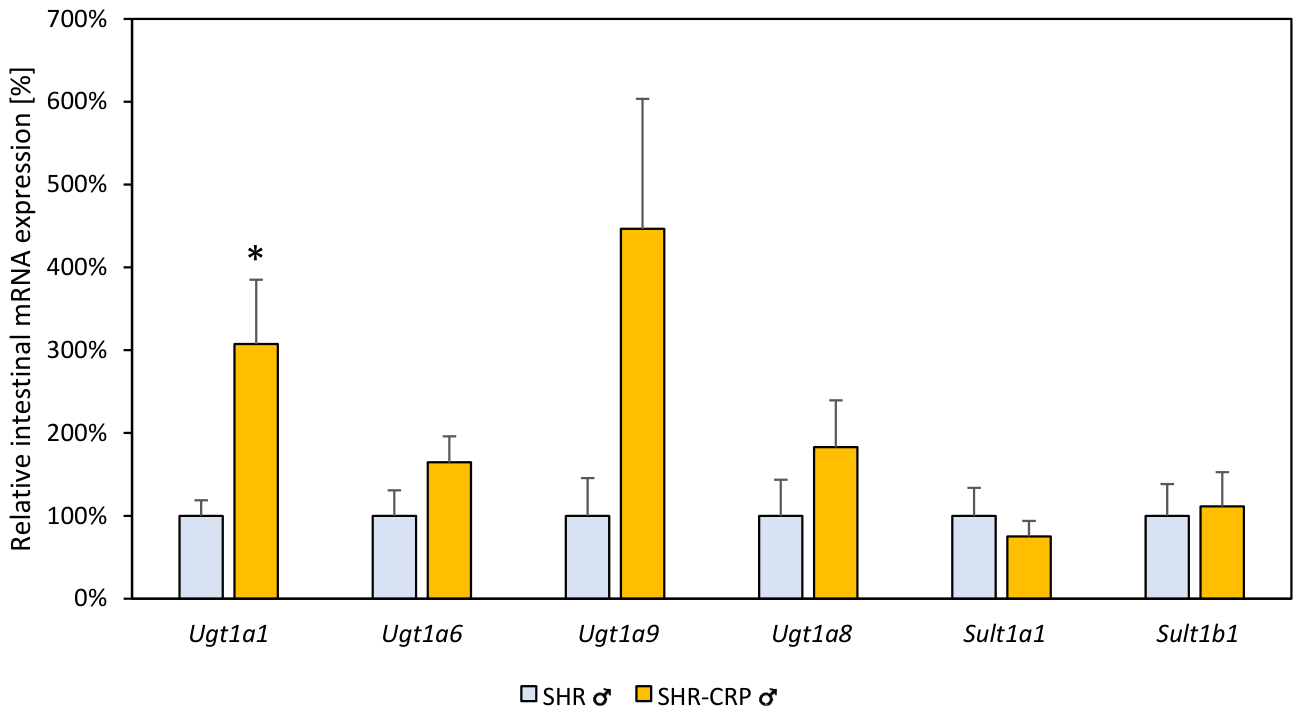
The effect of human C-reactive protein on the relative mRNA expression of selected UGT and SULT isoforms in the small intestine tissues of male SHR-CRP rats, compared with control male SHR rats, is shown in Figure 5. The SHR-CRP group demonstrated a statistically significant increase in Ugt1a1 expression, which reached 307% of the control SHR group (p < 0.05). Although mean expression levels for Ugt1a6, Ugt1a9 and Ugt1a8 were also elevated in the SHR-CRP group, these changes did not achieve statistical significance. The substantial mean increase observed for Ugt1a9 was associated with high data variability. The expression levels of Sult1a1 and Sult1b1 did not differ significantly between the two groups.

3.6. Effect of Ovariectomy on Intestinal UGT and SULT mRNA Expression in Female Wistar Rats

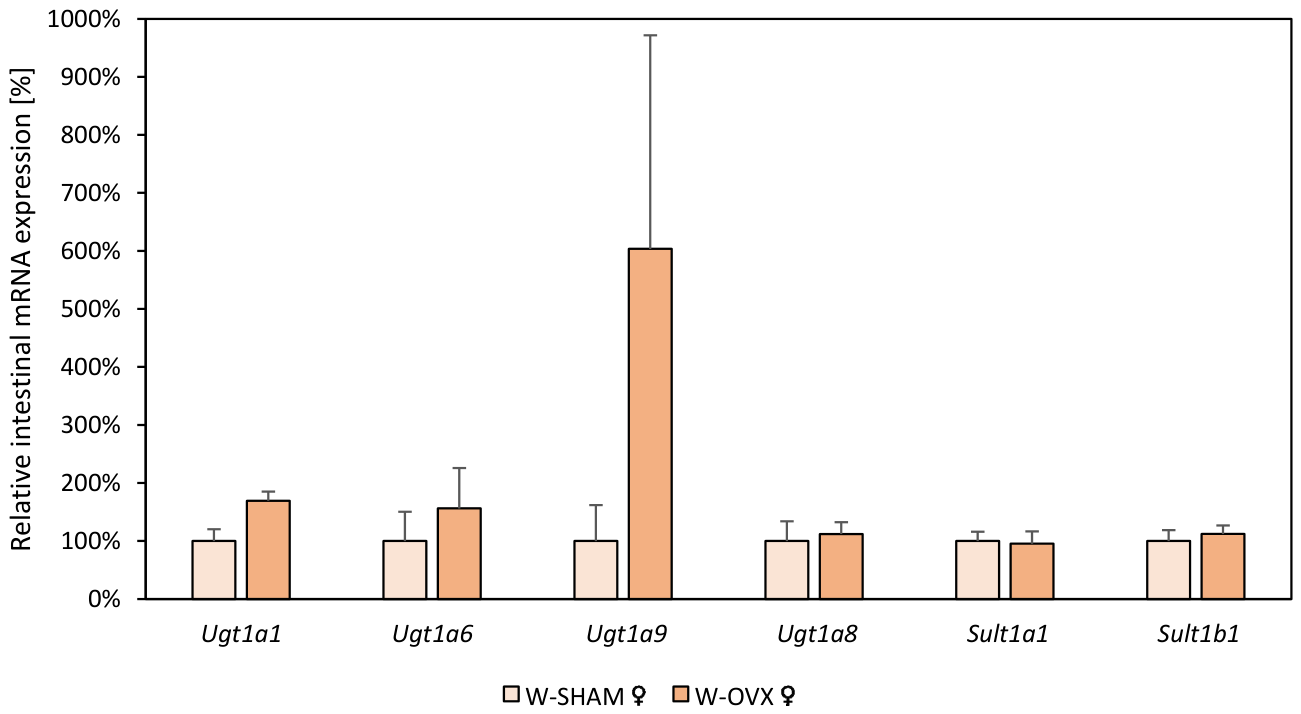
The effect of ovariectomy on the relative mRNA expression of UGT and SULT isoforms in the small intestine of female Wistar (W-OVX) rats, compared with SHAM-operated control (W-SHAM) rats, is presented in Figure 6. No statistically significant differences were found between the W-OVX and W-SHAM groups for any of the isoforms analysed. However, a substantial mean increase in Ugt1a9 expression was observed in the W-OVX group, reaching approximately 604% of the SHAM control group. This pronounced change did not achieve statistical significance, as it was associated with extremely high biological variability within the group, as indicated by the large SEM. Non-significant trends towards increased expression in the W-OVX group were also noted for Ugt1a1 and Ugt1a6. The expression levels of Ugt1a8, Sult1a1, and Sult1b1 remained largely unchanged compared with the W-SHAM group.

4. Discussion

Glycosylation and sulfation represent the key mechanisms for the elimination of xenobiotics and the regulation of endogenous signalling molecules, including bile acids and steroids [10,11]. Under physiological conditions, the phase II enzymes effectively maintain metabolic homeostasis and prevent toxicity. In contrast, our data indicate that under pathological conditions, such as hypertriglyceridaemia, hypertension, and ovariectomy-induced menopause, the transcriptional regulation pathways related to the metabolic capacity may be altered, suggesting a potential compromise.

4.1. The mRNA Expression of UGT and SULT Enzymes in Hypertriglyceridaemic State

The HHTg rat model replicates the prevalent condition of human hypertriglyceridaemia and the metabolic disturbances associated with it [12]. We previously reported that despite the hypertriglyceridaemic state, cholesterol levels in HHTg rats remained comparable to controls, an effect that was attributed to a compensatory balance between a downward trend in hepatic Abcg5/Abcg8 expression and an upward trend in Cyp7a1 [3].
Our current investigation into phase II metabolism reinforces this theme of hepatic compensation. As seen in Figure 1, the primary finding in the HHTg liver was the significant suppression of hepatic Ugt1a9 expression. This is highly consistent with our previous report of a downward trend in its key transcriptional factors, PXR/Nr1i2 and Ahr, and the significant suppression of another key target, Cyp1a2 [3]. This concurrent suppression of phase I (Cyp1a2) and phase II (Ugt1a9) enzymes, both regulated by the same suppressed nuclear receptors, indicates a broad, transcriptionally driven impairment of the liver’s capacity to metabolise xenobiotics and specific endogenous substrates [13]. This hepatic downregulation appears to trigger distinct compensatory mechanisms. We also observed a significant hepatic upregulation of the sulfotransferase isoforms Sult1a1 and Sult1b1. The parallel suppression of phase I and phase II enzymes regulated by the same transcriptional pathways strongly suggests a coordinated, transcriptionally driven impairment of selected hepatic detoxification routes in the hypertriglyceridaemic state [13,14].
Members of the UGT2B subfamily contribute substantially to the glucuronidation of bile acids and steroid hormones, thereby increasing their hydrophilicity and facilitating biliary and urinary excretion in mammals [15]. The non-detectable expression of Ugt2b isoforms in HHTg livers suggests a possible transcriptional deficit that may translate to reduced hepatic capacity for glucuronidation of these key endogenous substrates, which may contribute to altered bile acid and sterol handling under dyslipidaemic conditions [16].
When interpreted alongside our prior observations of altered Cyp7a1 expression and suppressed sterol transporters Abcg5 and Abcg8, these data collectively suggest a potential impairment of hepatic bile acid and sterol conjugation capacity in HHTg rats, rather than a complete failure of cholesterol metabolism [3]. Conjugation reactions mediated by UGT and SULT enzymes represent major phase II detoxification pathways that integrate both xenobiotic and endobiotic metabolic fluxes through transcriptional control by nuclear receptors such as PXR, CAR and PPARs [17]. Thus, the observed Ugt2b deficiency may reflect a transcriptionally mediated shift in hepatic detoxification programming.
Interestingly, this apparent suppression of glucuronidation pathways was accompanied by a significant upregulation of the sulfotransferases Sult1a1 and Sult1b1 in the liver. Phase II enzyme families exhibit overlapping substrate specificity for many phenolic compounds, steroids and bile acids, and both sulfation and glucuronidation often act as complementary conjugation pathways for the same substrates, with their relative contribution changing in response to metabolic or inflammatory stress [18,19]. While functional validation is required, the observed induction of SULTs is consistent with an adaptive response that helps maintain overall conjugation capacity within the liver when specific high-capacity glucuronidation routes are compromised [13,18].
In contrast to the liver, the intestinal tissue of HHTg rats exhibited an opposing regulatory pattern. We observed a significant induction of Ugt1a8 and a pronounced, albeit highly variable, increase in Ugt1a9 expression. This finding closely mirrors our previous report of intestinal upregulation of the nuclear receptors AhR, PXR/Nr1i2 and CAR/Nr1i3 in this strain [3]. The concordant induction of transcription factors and their downstream phase II targets strongly supports the concept of a transcriptionally driven enhancement in intestinal metabolic capacity. Enhanced intestinal phase II activity may therefore serve as an extrahepatic compensatory mechanism, buffering systemic exposure to lipophilic endogenous substrates and xenobiotics when hepatic detoxification is compromised [20,21].
Taken together, these findings define a distinctive metabolic fingerprint of the HHTg model characterised by hepatic suppression of selected PXR/AhR-regulated phase I and phase II pathways, combined with compensatory induction of sulfation in the liver and enhanced glucuronidation capacity in the intestine. This liver–intestine contrast highlights the importance of tissue-specific adaptive responses in hypertriglyceridaemia and suggests that extrahepatic metabolism may partially compensate for altered hepatic conjugation under dyslipidaemic conditions.

4.2. The mRNA Expression of UGT and SULT Enzymes in Hypertensive State

While the HHTg model is primarily defined by dyslipidaemia, the SHR rat serves as a more direct and established model for human essential hypertension [22,23]. In our previous work, we identified a unique hepatic fingerprint in SHR rats, notably the significant upregulation of Cyp3a23 (human CYP3A4 orthologue) and Cyp2d1 (human CYP2D6 orthologue), alongside the downregulation of Cyp1a2 and Cyp2a1 [3]. Our new data on phase II enzymes not only reinforce this unique SHR phenotype but also significantly expand upon it. The suppression of hepatic Cyp1a2, which we previously linked to a downward trend in hepatic Pxr, is now mirrored by a significant downregulation of hepatic Ugt1a9. This concurrent suppression of both a key phase I and phase II enzymes, both of which are known PXR/AhR targets, strengthens the hypothesis that a broad transcriptional suppression of this specific metabolic pathway is a characteristic of the SHR liver [24].
However, the most compelling findings relate to the specific inductions observed in this model. Our previous report of upregulated Cyp3a23, Cyp2d1, and Cyp2c6 is now complemented by the highly significant upregulation of Ugt1a1 and the SULT isoforms Sult1a1 and Sult1b1. This is a critical finding, as the induction of Ugt1a1 is unique to the SHR strain and was not observed in HHTg rats. This collective upregulation of multiple, mechanistically distinct phase I and phase II enzymes (CYPs, UGTs, and SULTs) suggests a complex hepatic adaptation to the hypertensive state, far different from the simple suppression seen with inflammation [3,25]. Furthermore, the UGT expression data clearly distinguish between our two pathological models. Unlike HHTg rats, which exhibited absent Ugt2b7/2b2 transcripts, SHR maintained normal, Wistar-level expression of these isoforms, indicating preserved bile acid conjugation capacity and distinguishing hypertension pathophysiology from HHTg dyslipidaemia. In the small intestine, the SHR strain did not show any significant alterations in any measured UGT or SULT isoforms. This stands in contrast to the HHTg model, where we observed significant intestinal PXR/CAR induction and a corresponding upregulation of UGTs. This expanded enzymatic profile presents potential clinical implications, although highly hypothetical without further validation. As we noted previously, almost 80% of individuals with MetS suffer from hypertension and are at risk of drug–drug interactions [1]. Our refined data show that the significant upregulation of Cyp3a23, Cyp2d1, Cyp2c6, and now Ugt1a1, Sult1a1, and Sult1b1, coupled with the downregulation of Cyp1a2 and Ugt1a9, could theoretically alter the metabolism of drugs used for treating MetS disorders [3].
This altered enzymatic distribution suggests the potential to affect the pharmacokinetics of common therapies, such as antiarrhythmics or β-blockers, underscoring the need for careful therapeutic management in hypertensive patients.

4.3. The mRNA Expression of UGT and SULT Enzymes in a Condition of Chronic Inflammation

Metabolic syndrome is linked to a state of chronic low-grade inflammation, with C-reactive protein serving as a key biomarker [26]. As detailed in our previous work, we used the SHR-CRP model to investigate the effects of human CRP, which is known to be pro-inflammatory in rats. Our new data on phase II enzymes provide crucial functional context to our earlier findings on nuclear receptors, revealing a striking, tissue-specific response to inflammation.
In the liver, our findings align with the established pattern of inflammation-mediated suppression of hepatic metabolism. We observed a significant downregulation of hepatic Ugt1a1, alongside a general non-significant downward trend for most other measured UGT and SULT isoforms. This suppression of phase II enzymes complements our previous data on CYPs and the broader literature, which indicates that CRP negatively modulates hepatic gene expression [3,27,28]. Interestingly, this suppression occurs despite our previous observation of a significant upregulation of Nr1i3 in the SHR-CRP liver. This suggests that the pro-inflammatory signalling cascade is dominant, effectively overriding the transcriptional activity of CAR and repressing target gene expression, a well-documented phenomenon during the acute-phase response [27,28].
In contrast, the response in the small intestine was diametrically opposed and provides a functional validation of our previous hypothesis. We measured a significant, threefold induction of intestinal Ugt1a1, along with strong upward trends for Ugt1a9 and Ugt1a8. In our previous study, we reported a significant upregulation of the intestinal nuclear receptors PXR/Nr1i2 and CAR/Nr1i3 in these same animals, and we hypothesised this would impact intestinal metabolism [3]. The Ugt1a1 induction we now report provides evidence that the CRP-driven inflammation induces intestinal nuclear receptors, which in turn upregulate the expression of their target Phase II enzymes.
Taken together, the current findings reveal a complex, tissue-specific role for chronic inflammation. CRP appears to mediate a dual response, a systemic suppression of hepatic metabolism (diminishing clearance of drugs via Ugt1a1) while simultaneously “fortifying the gut barrier” via a PXR/CAR-mediated induction of intestinal phase II enzymes (Ugt1a1). This intestinal response may serve as a critical defence mechanism, enhancing the gut’s metabolic capacity to limit the systemic translocation of microbial products or other pro-inflammatory stimuli from the lumen [29,30,31].

4.4. The mRNA Expression of UGT and SULT Enzymes in Postmenopausal State

The increased prevalence of metabolic syndrome in postmenopausal women is a significant clinical issue, a state we investigated using the ovariectomised (W-OVX) rat model [32,33]. Our previous analysis in these animals revealed a specific hepatic downregulation of Gsta1 and intestinal upregulation of Abcg5 and Abcb1 [3]. Our new data on phase II enzymes further support the tissue-specific nature of this hormonal regulation and also provide critical mechanistic links to the transcriptional pathways we previously identified [3].
In the liver, we observed a significant downregulation of both Ugt1a6 and Ugt1a9 (Figure 3). The suppression of Ugt1a9 is particularly noteworthy. It strongly complements our previous observation of a downward trend in both its key regulator, AhR, and the well-known phase I enzyme Cyp1a2. This concurrent, hormone-driven suppression of both a phase I (Cyp1a2) and a phase II (Ugt1a9) enzyme suggests a coordinated downregulation of the AhR-mediated metabolic pathway in response to oestrogen loss [3,34]. This finding is also consistent with human data showing decreased CYP1A2 activity in postmenopausal women [34]. Interestingly, this suppression appears highly specific, as other hepatic pathways, such as those represented by Ugt1a8, Sult1a1, and Sult1b1, remained unaffected.
As seen in other models in this study, the intestinal expression in W-OVX rats was also different from that of the liver. In our previous study, we reported significant intestinal upregulation of the ABC transporters Abcg5 and Abcb1 [3]. Our current data reinforce this finding. We observed a substantial, albeit statistically non-significant, mean increase of approximately 600% in intestinal Ugt1a9, along with upward trends for Ugt1a1 and Ugt1a6.
Although the high inter-individual variability, likely due to sampling challenges as discussed previously, prevented this Ugt1a9 change from reaching statistical significance, its direction and sheer magnitude are perfectly aligned with the significant inductions of Abcg5 and Abcb1 we previously reported, as well as the upward trends in Cyp1a1 and Cyp2c6 [3]. Taken together, these data strongly suggest that oestrogen deprivation triggers a broad transcriptional upregulation of the intestinal metabolic barrier, an effect that is diametrically opposed to the specific suppression observed in the liver [35].

4.5. Limitations of the Study

The conclusions drawn from this study on phase II UGT and SULT enzymes are subject to several limitations, many of which are shared with our previous work on phase I enzymes, transporters and transcription factors.
Firstly, the selected rat models successfully replicate specific features of human MetS, but it is important to recognise that they do not fully capture the complete clinical and pathophysiological complexity observed in humans. Each model provides valuable insight into isolated aspects of the condition: HHTg rats primarily model dyslipidaemia, SHR rats reflect hypertension, W-OVX rats simulate oestrogen deficiency, and the SHR-CRP model introduces a component of low-grade inflammation. However, human MetS is multifactorial and polygenic, involving a complex interaction of metabolic disturbances that are not comprehensively represented across these individual animal models. This inherent difference poses significant challenges for direct application of our preclinical findings. For instance, the HHTg model, while an excellent model of HHTg, has limitations in reflecting the full spectrum of human dyslipidaemia, which must be considered when interpreting our UGT findings related to bile acid metabolism. Similarly, the SHR-CRP model’s restricted metabolic profile, lacking broader disturbances common in human inflammatory MetS, must be considered when interpreting the inflammation-driven changes in UGT expression.
Secondly, while metabolic syndrome is inherently associated with oxidative stress and potential alterations in glutathione (GSH) status, this study focused exclusively on UGT and SULT pathways. GSH conjugation, specifically the transcript expression of glutathione S-transferase alpha 1 (Gsta1), was evaluated in our previous study on these exact animal cohorts [3]. To logically extend those findings and avoid data duplication, the current work prioritised the UGT and SULT superfamilies due to their shared transcriptional regulation by the nuclear receptors analysed in our phase I study [3]. Nevertheless, the exclusion of a broader panel of GST isoforms and direct functional GSH assays in the present manuscript represents a limitation when evaluating the comprehensive antioxidant and detoxification capacity of these models.
Thirdly, our experimental design relied on established genetic and transgenic models, which differ fundamentally from diet-induced models of MetS. Diet-induced rodent models, typically generated via high-fat, high-carbohydrate, or high-fructose diets, are highly informative as they closely replicate the nutritional aetiology and multifactorial pathogenesis of human MetS [36]. However, diet-induced models frequently develop obesity and can exhibit significant phenotypic variability, making it difficult to uncouple the effects of specific MetS components from generalised adiposity. In contrast, the genetic and transgenic models utilised in our study offer the ability to isolate specific, dominant cardiometabolic stressors strictly within a non-obese context. This allows for a more targeted mechanistic dissection of how individual pathological factors modulate phase II enzymes. Nevertheless, the lack of a diet-induced pathogenesis in our models represents a limitation, as they may not fully capture the complete metabolic complexity of human MetS.
A principal limitation of this study, as in our previous work, is its reliance on mRNA expression analysis. The observed changes in UGT and SULT transcripts, while substantial, do not always directly correlate with protein levels or, more critically, functional enzyme activity. For example, the non-detectable Ugt2b transcripts in HHTg rats are a strong finding, but confirmation at the protein level is essential. Therefore, verification of these findings using proteomics and functional assays is crucial to confirm their physiological relevance.
Furthermore, several key findings, particularly in the small intestine (e.g., Ugt1a9 in HHTg and W-OVX rats), were characterised by extremely high inter-individual variability. This variability, while likely biological, prevented substantial mean changes from reaching statistical significance, as our study utilised a relatively small sample size for each experimental group (n = 5–6).
A statistical limitation relates to the multiple comparisons across numerous genes. As this study was designed as an exploratory investigation, we treated the expression of each individual UGT and SULT isoform as an independent hypothesis. Therefore, we did not apply a global statistical adjustment (such as the False Discovery Rate) across all tested transcripts, as this could increase type II errors and obscure potentially relevant biological trends. Consequently, we cannot entirely exclude the possibility of false-positive findings, and the statistically significant alterations reported herein should be considered preliminary targets requiring future functional validation. Furthermore, when translating preclinical findings to human pharmacology in general, the interspecies differences must be considered. Although rats and humans share functional orthologues for selected UGT and SULT forms, they often exhibit distinct tissue-specific expression patterns and substrate affinities [37,38].
Therefore, while this research provides new insights into how specific metabolic conditions affect phase II drug-metabolising enzymes, these results should be interpreted with caution. They highlight the need for further validation at the protein and functional level in models that may more fully encompass the complexity of human MetS.

5. Conclusions

Despite the inherent limitations of mRNA-based analyses, this study identified pronounced, model-specific differences in hepatic and intestinal expression of phase II drug-metabolising enzymes across non-obese rat models of metabolic syndrome. In hypertriglyceridaemic HHTg rats, hepatic suppression of selected UGT isoforms, including loss of detectable Ugt2b transcripts, was accompanied by compensatory induction of sulfotransferases and increased intestinal UGT expression. In contrast, the hypertensive SHR model displayed a distinct hepatic adaptive pattern characterised by induction of multiple phase II enzymes without evidence of impaired Ugt2b expression. Chronic CRP-driven inflammation resulted in divergent regulation between the liver and intestine, with suppression of hepatic UGT expression alongside a marked induction of intestinal glucuronidation. Oestrogen deprivation in ovariectomised rats further demonstrated tissue-specific modulation of phase II enzyme expression.
These findings indicate that alterations in phase II metabolism are strongly dependent on the underlying pathophysiological context and tissue compartment. Such differences may influence drug disposition, first-pass metabolism and susceptibility to drug–drug interactions in preclinical models of cardiometabolic disease. However, confirmation at the protein and functional levels will be required to establish the translational relevance of these observations.

Supplementary Materials

The following supporting information can be downloaded at: https://www.mdpi.com/article/10.3390/biomedicines14061206/s1, Table S1: List of primers used for real-time RT-qPCR.

Author Contributions

Conceptualisation, J.S., M.P., Z.R., I.Z., H.M., M.H., I.M. and R.V.; formal analysis, J.S. and I.Z.; investigation, J.S.; data curation, J.S.; writing—original draft preparation, J.S., M.P., Z.R. and R.V.; writing—review and editing, J.S.; visualisation, J.S.; supervision, M.P. and R.V.; project administration, R.V.; funding, R.V. and H.M. All authors have read and agreed to the published version of the manuscript.

Funding

This study was supported by internal student grant from Palacky University Olomouc, number IGA_LF_2026_006, CZ-OPENSCREEN-LM2023052 and EATRIS-CZ-LM2023053, Ministry of Industry and Trade of the Czech Republic, CZ.01.01.01/01/22_002/0000717 DiPha, and by the Ministry of Health of the Czech Republic as part of its programme to support conceptual development among research organisations IKEM, IN 00023001.

Institutional Review Board Statement

The animal study protocol was approved by the Ethics Committee of Institute for Clinical and Experimental Medicine (IKEM) Prague (the decision number for this project is 25976/2016-OVZ-20 April 2016 and 27513/2022-5/OVZ-4 October 2022) for studies involving animals.

Informed Consent Statement

Not applicable.

Data Availability Statement

Data supporting the findings of this study are available upon request from the corresponding author.

Conflicts of Interest

The authors declare no conflicts of interest.

References

  1. Alemany, M. The Metabolic Syndrome, a Human Disease. Int. J. Mol. Sci. 2024, 25, 2251. [Google Scholar] [CrossRef]
  2. Ye, Q.; Zou, B.; Yeo, Y.H.; Li, J.; Huang, D.Q.; Wu, Y.; Yang, H.; Liu, C.; Kam, L.Y.; Tan, X.X.E.; et al. Global prevalence, incidence, and outcomes of non-obese or lean non-alcoholic fatty liver disease: A systematic review and meta-analysis. Lancet Gastroenterol. Hepatol. 2020, 5, 739–752. [Google Scholar] [CrossRef]
  3. Soukop, J.; Rácová, Z.; Kazdová, L.; Zapletalová, I.; Poruba, M.; Malínská, H.; Hüttl, M.; Marková, I.; Nováková, K.; VečeřA, R. Differences in mRNA Expression of Selected Cytochrome P450, Transporters and Nuclear Receptors Among Various Rat Models of Metabolic Syndrome. Basic Clin. Pharmacol. Toxicol. 2025, 137, e70075. [Google Scholar] [CrossRef]
  4. Babalola, C.P.; Kotila, O.; Iwuchukwu, O.F.; Babalola, C.P.; Kotila, O.; Iwuchukwu, O.F. The expanding role of gene-based prescribing for phase II drug-metabolizing enzymes. Am. J. Pharmacother. Pharm. Sci. 2023, 2, 24. [Google Scholar] [CrossRef]
  5. McCoy, M. Multitissue analysis of absorption, distribution, metabolism, and excretion gene expression: Sex and age effects across human organ systems. Drug Metab. Dispos. 2025, 53, 100162. [Google Scholar] [CrossRef] [PubMed]
  6. Dana Arcan, O.; Vasincu, A.; Ababei, D.C.; Bulea, D.; Macadan, I.; Rusu, R.N.; Neamțu, M.; Bild, V. Molecular Perspectives on the Impact of Inflammatory processes on drug metabolism. Farmacia 2026, 74, 12–26. [Google Scholar] [CrossRef]
  7. Rakateli, L.; Huchzermeier, R.; van der Vorst, E.P.C. AhR, PXR and CAR: From Xenobiotic Receptors to Metabolic Sensors. Cells 2023, 12, 2752. [Google Scholar] [CrossRef] [PubMed]
  8. Wang, J.; Young, G.; Zhang, M.; Salvatore, S.R.; Qin, F.-Y.; Cai, X.; Xu, M.; Ke, M.; Liu, L.; Kim, J.-W.; et al. Inhibition of sulfotransferase SULT2B1 prevents obesity and insulin resistance by regulating energy expenditure and intestinal lipid absorption. J. Biol. Chem. 2025, 301, 110327. [Google Scholar] [CrossRef]
  9. Bock, K.W. Roles of human UDP-glucuronosyltransferases in clearance and homeostasis of endogenous substrates, and functional implications. Biochem. Pharmacol. 2015, 96, 77–82. [Google Scholar] [CrossRef] [PubMed]
  10. Anzenbacher, P. Nejvýznamnější enzymy druhé fáze metabolismu léčiv: UDP-glukuronosyltransferázy a sulfotransferázy. Klin. Farmakol. Farm. 2023, 37, 49–51. [Google Scholar] [CrossRef]
  11. Thakare, R.; Alamoudi, J.A.; Gautam, N.; Rodrigues, A.D.; Alnouti, Y. Species differences in bile acids II. Bile acid metabolism. J. Appl. Toxicol. 2018, 38, 1336–1352. [Google Scholar] [CrossRef]
  12. Vrána, A.; Kazdová, L. The hereditary hypertriglyceridemic nonobese rat: An experimental model of human hypertriglyceridemia. Transpl. Proc. 1990, 22, 2579. [Google Scholar]
  13. Runge-Morris, M.; Kocarek, T.A. Regulation of Sulfotransferase and UDP-Glucuronosyltransferase Gene Expression by the PPARs. PPAR Res. 2009, 2009, 728941. [Google Scholar] [CrossRef]
  14. Xu, C.; Li, C.Y.T.; Kong, A.N.T. Induction of phase I, II and III drug metabolism/transport by xenobiotics. Arch. Pharmacal Res. 2005, 28, 249–268. [Google Scholar] [CrossRef]
  15. Wells, P.G.; Mackenzie, P.I.; Chowdhury, J.R.; Guillemette, C.; Gregory, P.A.; Ishii, Y.; Hansen, A.J.; Kessler, F.K.; Kim, P.M.; Chowdhury, N.R.; et al. Glucuronidation and the udp-glucuronosyltransferases in health and disease. Drug Metab. Dispos. 2004, 32, 281–290. [Google Scholar] [CrossRef]
  16. Fay, M.J.; Nguyen, M.T.; Snouwaert, J.N.; Dye, R.; Grant, D.J.; Bodnar, W.M.; Koller, B.H. Xenobiotic metabolism in mice lacking the UDP-Glucuronosyltransferase 2 family. Drug Metab. Dispos. 2015, 43, 1838–1846. [Google Scholar] [CrossRef] [PubMed]
  17. MacKenzie, P.I.; Hu, D.G.; Gardner-Stephen, D.A. The regulation of UDP-glucuronosyltransferase genes by tissue-specific and ligand-activated transcription factors. Drug Metab. Rev. 2010, 42, 99–109. [Google Scholar] [CrossRef]
  18. Hardwick, R.N.; Ferreira, D.W.; More, V.R.; Lake, A.D.; Lu, Z.; Manautou, J.E.; Slitt, A.L.; Cherrington, N.J. Altered UDP-Glucuronosyltransferase and Sulfotransferase Expression and Function during Progressive Stages of Human Nonalcoholic Fatty Liver Disease. Drug Metab. Dispos. 2013, 41, 554–561. [Google Scholar] [CrossRef]
  19. Barre, L.; Fournel-Gigleux, S.; Finel, M.; Netter, P.; Magdalou, J.; Ouzzine, M. Substrate specificity of the human UDP-glucuronosyltransferase UGT2B4 and UGT2B7: Identification of a critical aromatic amino acid residue at position 33. FEBS J. 2007, 274, 1256–1264. [Google Scholar] [CrossRef]
  20. Buckley, D.B.; Klaassen, C.D. Induction of Mouse UDP-Glucuronosyltransferase mRNA Expression in Liver and Intestine by Activators of Aryl-Hydrocarbon Receptor, Constitutive Androstane Receptor, Pregnane X Receptor, Peroxisome Proliferator-Activated Receptor α, and Nuclear Factor Erythroid 2-Related Factor 2. Drug Metab. Dispos. 2009, 37, 847–856. [Google Scholar] [CrossRef] [PubMed]
  21. Sugatani, J. Function, Genetic Polymorphism, and Transcriptional Regulation of Human UDP-glucuronosyltransferase (UGT) 1A1. Drug Metab. Pharmacokinet. 2013, 28, 83–92. [Google Scholar] [CrossRef]
  22. Okamoto, K.; Aoki, K. Development of a Strain of Spontaneously Hypertensive Rats. Jpn. Circ. J. 1963, 27, 282–293. [Google Scholar] [CrossRef]
  23. Pravenec, M.; Křen, V.; Landa, V.; Mlejnek, P.; Musilová, A.; Šilhavý, J.; Šimáková, M.; Zídek, V. Recent Progress in the Genetics of Spontaneously Hypertensive Rats. Physiol. Res. 2014, 63, 932622. [Google Scholar] [CrossRef] [PubMed]
  24. Aleksunes, L.M.; Klaassen, C.D. Coordinated Regulation of Hepatic Phase I and II Drug-Metabolizing Genes and Transporters using AhR-, CAR-, PXR-, PPARα-, and Nrf2-Null Mice. Drug Metab. Dispos. 2012, 40, 1366–1379. [Google Scholar] [CrossRef] [PubMed]
  25. Zhang, Z.; Zhao, L.; Zhou, X.; Meng, X.; Zhou, X. Role of inflammation, immunity, and oxidative stress in hypertension: New insights and potential therapeutic targets. Front. Immunol. 2023, 13, 1098725. [Google Scholar] [CrossRef]
  26. Pravenec, M.; Kajiya, T.; Zídek, V.; Landa, V.; Mlejnek, P.; Šimáková, M.; Šilhavý, J.; Malínská, H.; Oliyarnyk, O.; Kazdová, L.; et al. Effects of human C-reactive protein on pathogenesis of features of the metabolic syndrome. Hypertension 2011, 57, 731–737. [Google Scholar] [CrossRef]
  27. Ghose, R.; White, D.; Guo, T.; Vallejo, J.; Karpen, S.J. Regulation of Hepatic Drug-Metabolizing Enzyme Genes by Toll-Like Receptor 4 Signaling Is Independent of Toll-Interleukin 1 Receptor Domain-Containing Adaptor Protein. Drug Metab. Dispos. 2008, 36, 95–101. [Google Scholar] [CrossRef]
  28. Goldstein, I.; Paakinaho, V.; Baek, S.; Sung, M.H.; Hager, G.L. Synergistic gene expression during the acute phase response is characterized by transcription factor assisted loading. Nat. Commun. 2017, 8, 1849. [Google Scholar] [CrossRef] [PubMed]
  29. Zhang, Q.Y.; Wikoff, J.; Dunbar, D.; Kaminsky, L. Characterization of rat small intestinal cytochrome P450 composition and inducibility. Drug Metab. Dispos. 1996, 24, 322–328. [Google Scholar] [CrossRef] [PubMed]
  30. Kutsukake, T.; Furukawa, Y.; Ondo, K.; Gotoh, S.; Fukami, T.; Nakajima, M. Quantitative Analysis of UDP-Glucuronosyltransferase Ugt1a and Ugt2b mRNA Expression in the Rat Liver and Small Intestine: Sex and Strain Differences. Drug Metab. Dispos. 2019, 47, 38–44. [Google Scholar] [CrossRef]
  31. Santos-Marcos, J.A.; Perez-Jimenez, F.; Camargo, A. The role of diet and intestinal microbiota in the development of metabolic syndrome. J. Nutr. Biochem. 2019, 70, 1–27. [Google Scholar] [CrossRef] [PubMed]
  32. Pu, D.; Tan, R.; Yu, Q.; Wu, J. Metabolic syndrome in menopause and associated factors: A meta-analysis. Climacteric 2017, 20, 583–591. [Google Scholar] [CrossRef]
  33. Mumusoglu, S.; Yildiz, B.O. Metabolic Syndrome During Menopause. Curr. Vasc. Pharmacol. 2018, 17, 595–603. [Google Scholar] [CrossRef]
  34. Tsiokou, V.; Kilindris, T.; Begas, E.; Kouvaras, E.; Kouretas, D.; Asprodini, E.K. Altered activity of xenobiotic detoxifying enzymes at menopause—A cross-sectional study. Env. Res. 2020, 182, 109074. [Google Scholar] [CrossRef]
  35. Peters, B.A.; Hanna, D.B.; Xue, X.; Weber, K.; Appleton, A.A.; Kassaye, S.G.; Topper, E.; Tracy, R.P.; Guillemette, C.; Caron, P.; et al. Menopause and Estrogen Associations With Gut Barrier, Microbial Translocation, and Immune Activation Biomarkers in Women With and Without HIV. J. Acquir Immune Defic. Syndr. 2024, 96, 214–222. [Google Scholar] [CrossRef]
  36. Vatashchuk, M.V.; Bayliak, M.M.; Hurza, V.V.; Storey, K.B.; Lushchak, V.I. Metabolic Syndrome: Lessons from Rodent and Drosophila Models. BioMed Res. Int. 2022, 2022, 5850507. [Google Scholar] [CrossRef]
  37. Dubaisi, S.; Caruso, J.A.; Gaedigk, R.; Vyhlidal, C.A.; Smith, P.C.; Hines, R.N.; Kocarek, T.A.; Runge-Morris, M. Developmental Expression of the Cytosolic Sulfotransferases in Human Liver. Drug Metab. Dispos. 2019, 47, 592–600. [Google Scholar] [CrossRef] [PubMed]
  38. Fujiwara, R.; Yoda, E.; Tukey, R.H. Species differences in drug glucuronidation: Humanized UDP-glucuronosyltransferase 1 mice and their application for predicting drug glucuronidation and drug-induced toxicity in humans. Drug Metab. Pharmacokinet. 2017, 33, 9. [Google Scholar] [CrossRef] [PubMed]
Figure 1. Differences in the relative mRNA expression of UGT and SULT isoforms in the liver tissues of male HHTg and SHR rats compared with control male Wistar rats, with their values set to 100%. Data are expressed as the mean ± SEM, n = 5–6. * Denotes p < 0.05; ** denotes p < 0.01; *** denotes p < 0.001 compared with the Wistar group.
Biomedicines 14 01206 g001
Figure 2. Differences in the relative mRNA expression of UGT and SULT isoforms in the liver tissues of male SHR-CRP rats compared with male SHR rats, with their values set to 100%. Data are expressed as the mean ± SEM, n = 5–6. * Denotes p < 0.05 compared with the SHR group.
Biomedicines 14 01206 g002
Figure 3. Differences in relative mRNA expression of UGT and SULT isoforms in the liver tissues of ovariectomised female Wistar (W-OVX) rats compared to SHAM-operated control (W-SHAM) rats, with their values set to 100%. Data are expressed as the mean ± SEM, n = 5. * Denotes p < 0.05 compared with the W-SHAM group.
Biomedicines 14 01206 g003
Figure 4. Differences in the relative mRNA expression of UGT and SULT isoforms in the small intestine tissues of male HHTg and SHR rats compared with male Wistar rats, with their values set to 100%. Data are expressed as the mean ± SEM, n = 5–7. * Denotes p < 0.05 compared with the Wistar group.
Biomedicines 14 01206 g004
Figure 5. Differences in the relative mRNA expression of UGT and SULT isoforms in the small intestine tissues of male SHR-CRP rats compared with male SHR rats, with their values set to 100%. Data are expressed as the mean ± SEM, n = 5–6. * Denotes p < 0.05 compared with the SHR group.
Biomedicines 14 01206 g005
Figure 6. Differences in the relative mRNA expression of UGT and SULT isoforms in the small intestine tissues of female W-OVX Wistar rats compared to female SHAM-operated Wistar rats, with their values set to 100%. Data are expressed as the mean ± SEM, n = 5.
Biomedicines 14 01206 g006
Disclaimer/Publisher’s Note: The statements, opinions and data contained in all publications are solely those of the individual author(s) and contributor(s) and not of MDPI and/or the editor(s). MDPI and/or the editor(s) disclaim responsibility for any injury to people or property resulting from any ideas, methods, instructions or products referred to in the content.