Very High vs. High Tumor Mutational Burden Across Tumors: Real-World Associations with MSI, Pathway Features, and Immunotherapy Outcomes
 ,
,  ,
,  ,
, 
Abstract
1. Introduction
2. Methods
2.1. Study Design and Population
2.2. Clinical Data Collection
2.3. Genomic Profiling and Biomarker Definitions
2.3.1. TMB Calculation
2.3.2. MSI Assessment
2.4. Pathway Mapping
2.5. Treatment Response Assessment
2.6. Statistical Analysis
3. Results
4. Discussion
5. Conclusions
Supplementary Materials
Author Contributions
Funding
Institutional Review Board Statement
Informed Consent Statement
Data Availability Statement
Conflicts of Interest
References
- Yarchoan, M.; Hopkins, A.; Jaffee, E.M. Tumor Mutational Burden and Response Rate to PD-1 Inhibition. N. Engl. J. Med. 2017, 377, 2500–2501. [Google Scholar] [CrossRef] [Scilit] [PubMed]
- Goodman, A.M.; Kato, S.; Bazhenova, L.; Patel, S.P.; Frampton, G.M.; Miller, V.; Stephens, P.J.; Daniels, G.A.; Kurzrock, R. Tumor Mutational Burden as an Independent Predictor of Response to Immunotherapy in Diverse Cancers. Mol. Cancer Ther. 2017, 16, 2598–2608. [Google Scholar] [CrossRef] [Scilit] [PubMed]
- Chalmers, Z.R.; Connelly, C.F.; Fabrizio, D.; Gay, L.; Ali, S.M.; Ennis, R.; Schrock, A.; Campbell, B.; Shlien, A.; Chmielecki, J.; et al. Analysis of 100,000 human cancer genomes reveals the landscape of tumor mutational burden. Genome Med. 2017, 9, 34. [Google Scholar] [CrossRef] [Scilit] [PubMed]
- McGrail, D.J.; Pilié, P.G.; Rashid, N.U.; Voorwerk, L.; Slagter, M.; Kok, M.; Jonasch, E.; Khasraw, M.; Heimberger, A.; Lim, B.; et al. High tumor mutation burden fails to predict immune checkpoint blockade response across all cancer types. Ann. Oncol. 2021, 32, 661–672. [Google Scholar] [CrossRef] [Scilit] [PubMed]
- Marabelle, A.; Fakih, M.; Lopez, J.; Shah, M.; Shapira-Frommer, R.; Nakagawa, K.; Chung, H.C.; Kindler, H.L.; Lopez-Martin, J.A.; Miller, W.H., Jr.; et al. Association of tumour mutational burden with outcomes in patients with advanced solid tumours treated with pembrolizumab: Prospective biomarker analysis of the multicohort, open-label, phase 2 KEYNOTE-158 study. Lancet Oncol. 2020, 21, 1353–1365. [Google Scholar] [CrossRef] [Scilit] [PubMed]
- Marcus, L.; Fashoyin-Aje, L.A.; Donoghue, M.; Yuan, M.; Rodriguez, L.; Gallagher, P.S.; Philip, R.; Ghosh, S.; Theoret, M.R.; Beaver, J.A.; et al. FDA Approval Summary: Pembrolizumab for the Treatment of Tumor Mutational Burden–High Solid Tumors. Clin. Cancer Res. 2021, 27, 4685–4689. [Google Scholar] [CrossRef] [Scilit] [PubMed]
- Leone, R.D.; Powell, J.D. Metabolism of immune cells in cancer. Nat. Rev. Cancer 2020, 20, 516–531. [Google Scholar] [CrossRef] [Scilit] [PubMed]
- Anderson, N.M.; Simon, M.C. The tumor microenvironment. Curr. Biol. 2020, 30, R921–R925. [Google Scholar] [CrossRef] [Scilit] [PubMed]
- Alexandrov, L.B.; Nik-Zainal, S.; Wedge, D.C.; Aparicio, S.A.J.R.; Behjati, S.; Biankin, A.V.; Bignell, G.R.; Bolli, N.; Borg, A.; Børresen-Dale, A.-L.; et al. Signatures of mutational processes in human cancer. Nature 2013, 500, 415–421, Correction in Nature 2013, 502, 258. [Google Scholar] [CrossRef] [Scilit] [PubMed]
- Chan, T.A.; Yarchoan, M.; Jaffee, E.; Swanton, C.; Quezada, S.A.; Stenzinger, A.; Peters, S. Development of tumor mutation burden as an immunotherapy biomarker: Utility for the oncology clinic. Ann. Oncol. 2019, 30, 44–56. [Google Scholar] [CrossRef] [Scilit] [PubMed]
- McGrail, D.J.; Federico, L.; Li, Y.; Dai, H.; Lu, Y.; Mills, G.B.; Yi, S.; Lin, S.-Y.; Sahni, N. Multi-omics analysis reveals neoantigen-independent immune cell infiltration in copy-number driven cancers. Nat. Commun. 2018, 9, 1317. [Google Scholar] [CrossRef] [Scilit] [PubMed]
- Makrooni, M.A.; O’Sullivan, B.; Seoighe, C. Bias and inconsistency in the estimation of tumour mutation burden. BMC Cancer 2022, 22, 840. [Google Scholar] [CrossRef] [Scilit] [PubMed]
- Muquith, M.; Espinoza, M.; Elliott, A.; Xiu, J.; Seeber, A.; El-Deiry, W.; Antonarakis, E.S.; Graff, S.L.; Hall, M.J.; Borghaei, H.; et al. Tissue-specific thresholds of mutation burden associated with anti-PD-1/L1 therapy benefit and prognosis in microsatellite-stable cancers. Nat. Cancer 2024, 5, 1121–1129. [Google Scholar] [CrossRef] [Scilit] [PubMed]
- Shao, C.; Li, G.; Huang, L.; Pruitt, S.; Castellanos, E.; Frampton, G.; Carson, K.R.; Snow, T.; Singal, G.; Fabrizio, D.; et al. Prevalence of High Tumor Mutational Burden and Association with Survival in Patients with Less Common Solid Tumors. JAMA Netw. Open 2020, 3, e2025109. [Google Scholar] [CrossRef] [Scilit] [PubMed]
- Samstein, R.M.; Lee, C.H.; Shoushtari, A.N.; Hellmann, M.D.; Shen, R.; Janjigian, Y.Y.; Barron, D.A.; Zehir, A.; Jordan, E.J.; Omuro, A.; et al. Tumor mutational load predicts survival after immunotherapy across multiple cancer types. Nat. Genet. 2019, 51, 202–206. [Google Scholar] [CrossRef] [Scilit] [PubMed]
- Patel, S.A.; Minn, A.J. Combination Cancer Therapy with Immune Checkpoint Blockade: Mechanisms and Strategies. Immunity 2018, 48, 417–433. [Google Scholar] [CrossRef] [Scilit] [PubMed]



| Variable | TMB-H (10–20, N = 91) | TMB-VH (>20, N = 42) | p -Value |
|---|---|---|---|
| TMB (MUT/MB) | - | ||
| Median (IQR) | 12 (11–14) | 38 (25–60) | |
| Range | 10–20 | 20–116 | |
| Age | 0.647 | ||
| Mean ± SD | 67.8 ± 11.0 | 66.6 ± 15.0 | |
| Range | 43–97 | 27–94 | |
| Sex | 0.075 | ||
| Female | 47 (51.6%) | 14 (33.3%) | |
| Male | 44 (48.4%) | 28 (66.7%) | |
| MSI | 8.9 × 10⁻⁸ | ||
| Positive | 2 (2.2%) | 16 (38.1%) | |
| Negative | 88 (96.7%) | 26 (61.9%) | |
| Indeterminate | 1 (1.1%) | 0 (0%) | |
| Clinical stage at diagnosis | 0.735 | ||
| I | 1 (1.1%) | 2 (4.8%) | |
| II | 18 (19.8%) | 9 (21.4%) | |
| III | 13 (14.3%) | 5 (11.9%) | |
| IV | 35 (38.5%) | 17 (40.5%) | |
| Unknown | 24 (26.4%) | 9 (21.4%) | |
| Race | 0.545 | ||
| White | 33 (36.3%) | 21 (50.0%) | |
| Asian | 2 (2.2%) | 1 (2.4%) | |
| Mixed | 2 (2.2%) | 1 (2.4%) | |
| Not declared | 54 (59.3%) | 19 (45.2%) | |
| Diagnosis * | 0.515 | ||
| Colorectal adenocarcinoma | 8 (8.8%) | 4 (9.5%) | |
| Urothelial carcinoma | 9 (9.9%) | 4 (9.5%) | |
| Melanoma | 3 (3.3%) | 4 (9.5%) | |
| Non-small cell lung cancer | 28 (30.8%) | 8 (19.0%) | |
| Other | 43 (47.3%) | 22 (52.4%) |
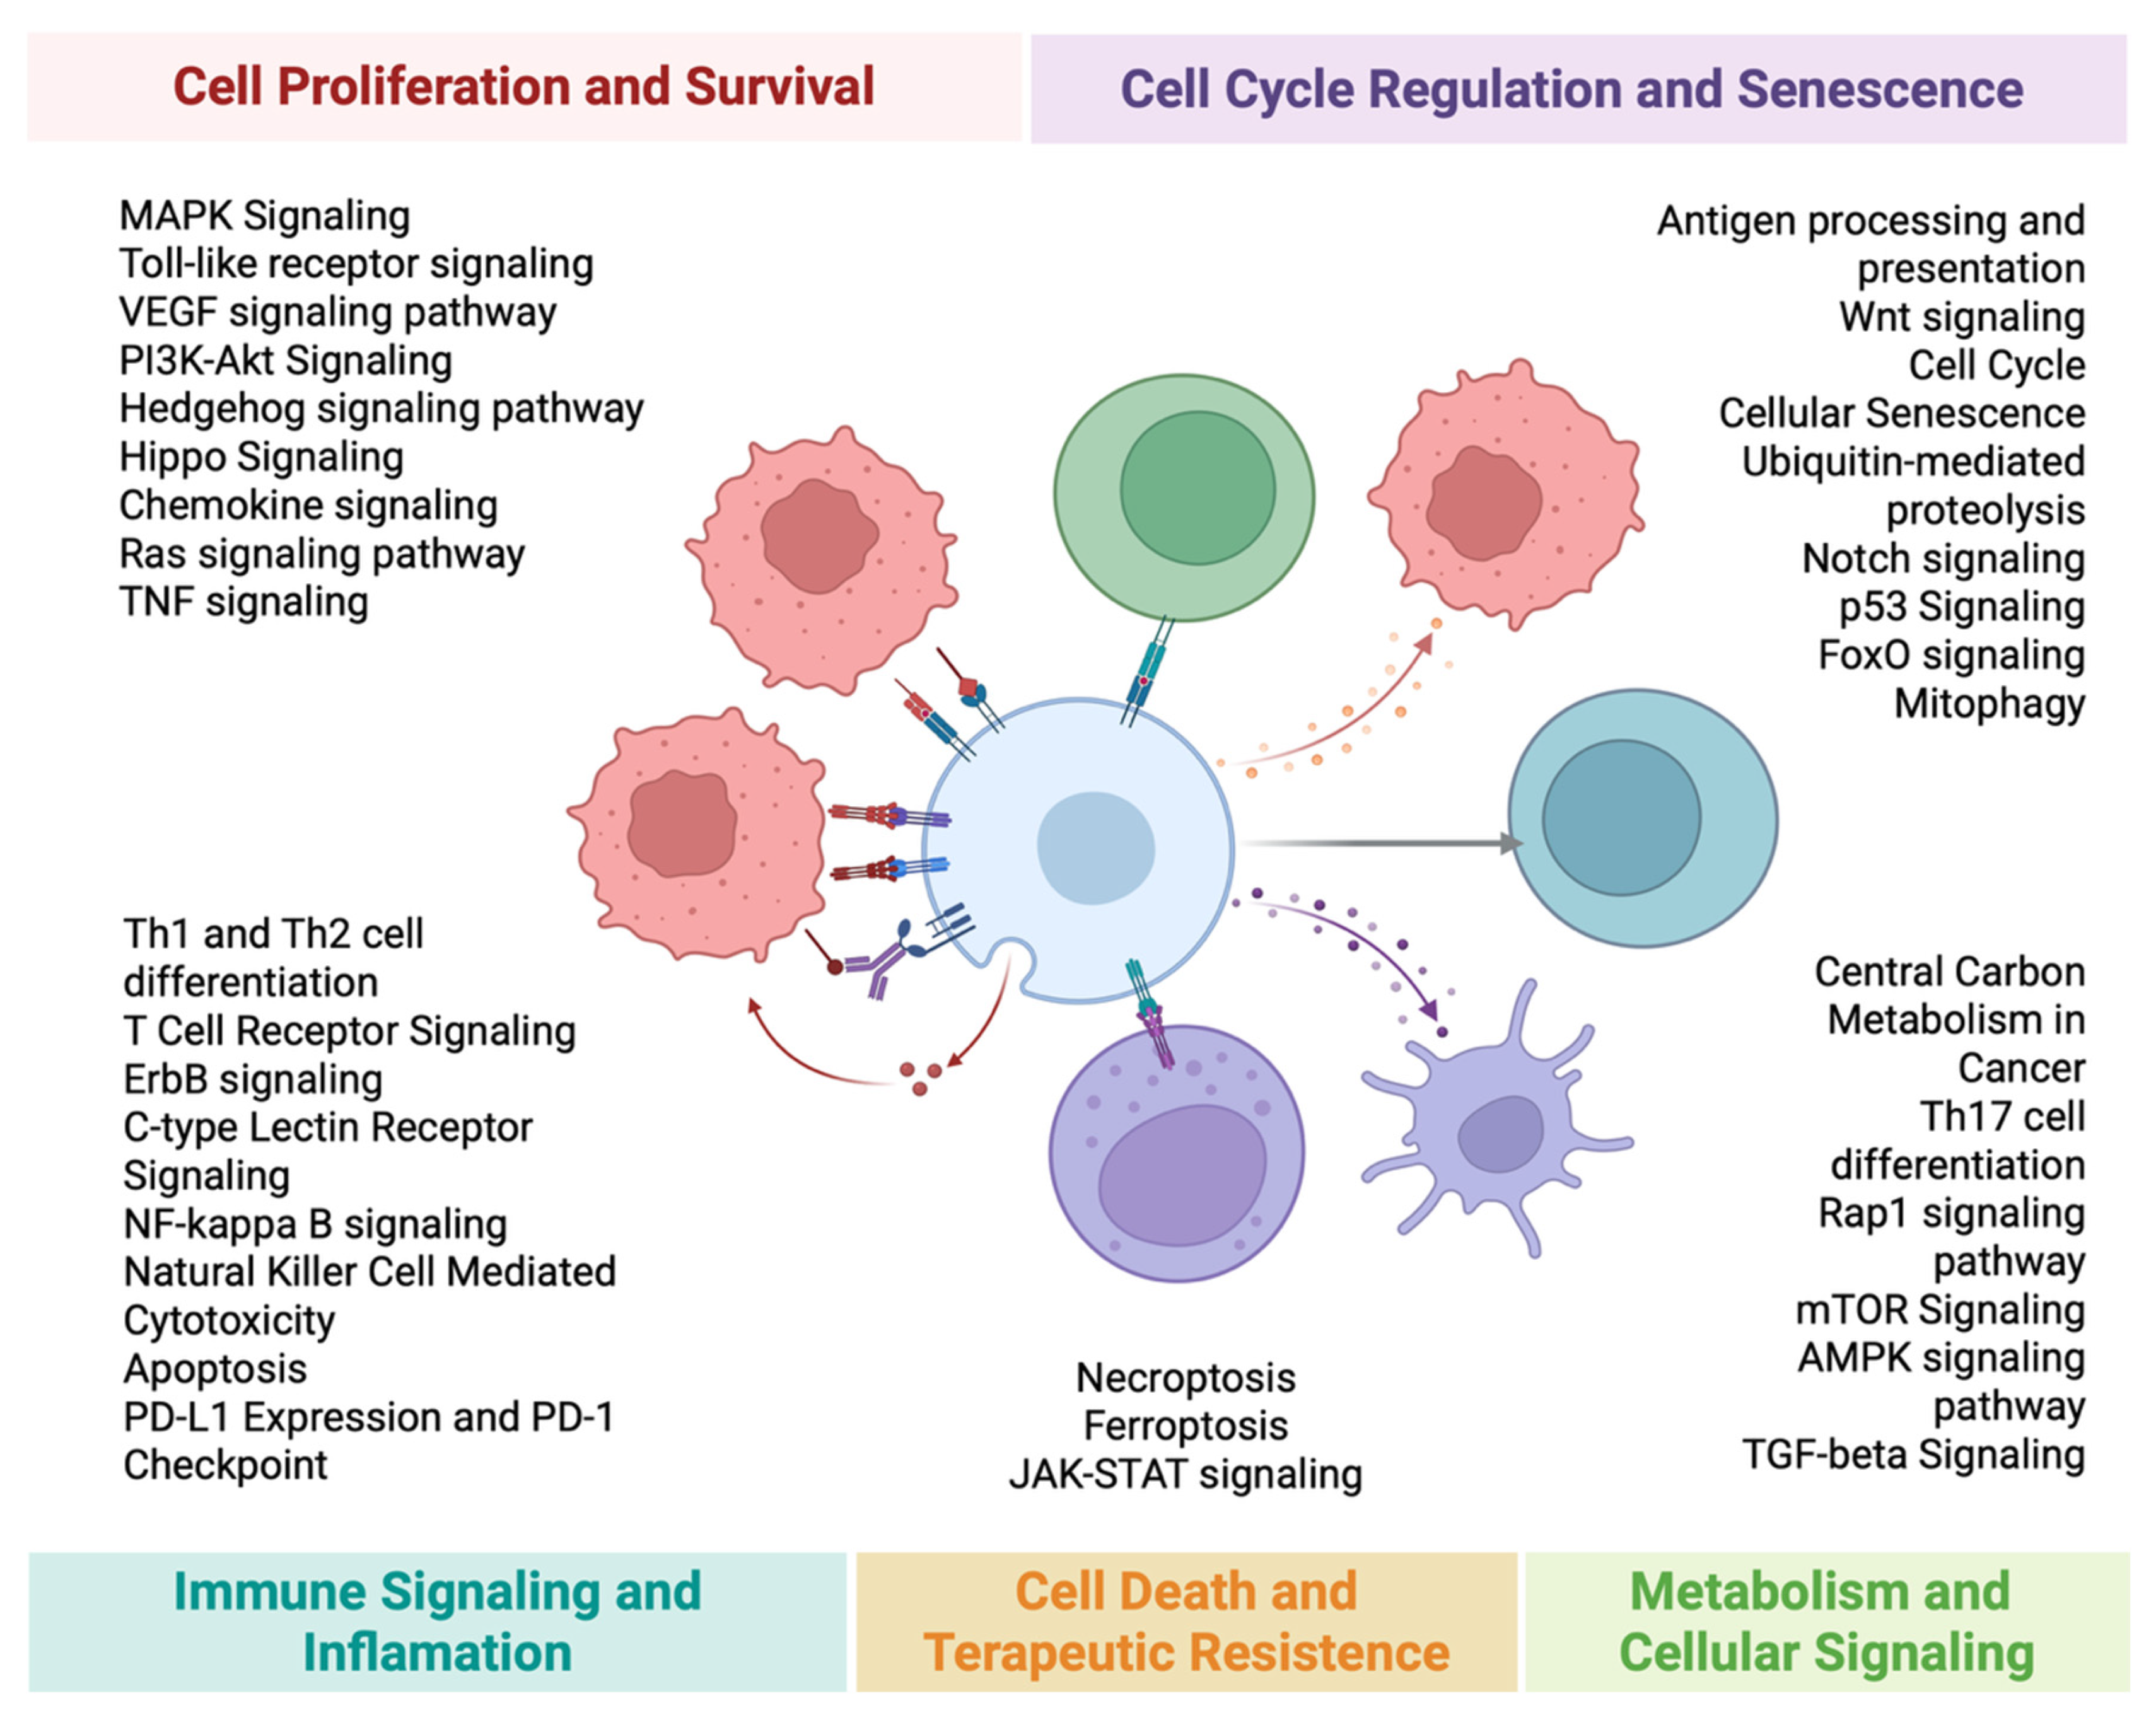
| Pathway | TMB 10–20 (N = 91) | TMB > 20 (N = 42) | OR (95% CI) | PHI | p | Q (FDR) |
|---|---|---|---|---|---|---|
| Metabolism and general cell signaling | ||||||
| Central carbon metabolism in cancer | 46/91 (50.5%) | 13/42 (31.0%) | 0.44 (0.20–0.95) | 0.18 | 0.040 | 1.00 |
| TH17 cell differentiation | 24/91 (26.4%) | 11/42 (26.2%) | 0.99 (0.43–2.27) | 0.00 | 1.000 | 1.00 |
| RAP1 signaling pathway | 14/91 (15.4%) | 8/42 (19.0%) | 1.29 (0.50–3.37) | 0.05 | 0.621 | 1.00 |
| MTOR signaling | 41/91 (45.1%) | 17/42 (40.5%) | 0.83 (0.39–1.74) | 0.04 | 0.708 | 1.00 |
| AMPK signaling pathway | 9/91 (9.9%) | 1/42 (2.4%) | 0.22 (0.03–1.81) | 0.13 | 0.169 | 1.00 |
| TGF-beta signaling | 29/91 (31.9%) | 12/42 (28.6%) | 0.86 (0.38–1.91) | 0.03 | 0.840 | 1.00 |
| Cell cycle regulation and senescence | ||||||
| WNT signaling | 18/91 (19.8%) | 6/42 (14.3%) | 0.68 (0.25–1.85) | 0.07 | 0.628 | 1.00 |
| Cell cycle | 47/91 (51.6%) | 19/42 (45.2%) | 0.77 (0.37–1.61) | 0.06 | 0.577 | 1.00 |
| Cellular senescence | 49/91 (53.8%) | 20/42 (47.6%) | 0.78 (0.37–1.62) | 0.06 | 0.577 | 1.00 |
| Ubiquitin mediated proteolysis | 11/91 (12.1%) | 6/42 (14.3%) | 1.21 (0.42–3.53) | 0.03 | 0.782 | 1.00 |
| NOTCH signaling | 20/91 (22.0%) | 10/42 (23.8%) | 1.11 (0.47–2.64) | 0.02 | 0.826 | 1.00 |
| P53 signaling | 41/91 (45.1%) | 15/42 (35.7%) | 0.68 (0.32–1.44) | 0.09 | 0.349 | 1.00 |
| FOXO signaling | 49/91 (53.8%) | 19/42 (45.2%) | 0.71 (0.34–1.48) | 0.08 | 0.456 | 1.00 |
| Mitophagy | 20/91 (22.0%) | 10/42 (23.8%) | 1.11 (0.47–2.64) | 0.02 | 0.826 | 1.00 |
| Immune signaling and inflammation | ||||||
| Antigen processing and presentation | 20/91 (22.0%) | 11/42 (26.2%) | 1.26 (0.54–2.94) | 0.05 | 0.661 | 1.00 |
| PD-L1 expression and PD-1 checkpoint | 45/91 (49.5%) | 19/42 (45.2%) | 0.84 (0.41–1.76) | 0.04 | 0.711 | 1.00 |
| TH1 and TH2 cell differentiation | 21/91 (23.1%) | 10/42 (23.8%) | 1.04 (0.44–2.47) | 0.01 | 1.000 | 1.00 |
| T cell receptor signaling | 42/91 (46.2%) | 16/42 (38.1%) | 0.72 (0.34–1.52) | 0.08 | 0.453 | 1.00 |
| ERBB signaling | 21/91 (23.1%) | 7/42 (16.7%) | 0.67 (0.26–1.72) | 0.07 | 0.496 | 1.00 |
| C-type lectin receptor signaling | 37/91 (40.7%) | 11/42 (26.2%) | 0.52 (0.23–1.16) | 0.14 | 0.123 | 1.00 |
| NF-kappa B signaling | 14/91 (15.4%) | 7/42 (16.7%) | 1.10 (0.41–2.96) | 0.02 | 1.000 | 1.00 |
| Natural killer cell mediated cytotoxicity | 43/91 (47.3%) | 17/42 (40.5%) | 0.76 (0.36–1.59) | 0.06 | 0.574 | 1.00 |
| Chemokine signaling | 34/91 (37.4%) | 15/42 (35.7%) | 0.93 (0.44–1.99) | 0.02 | 1.000 | 1.00 |
| Cell proliferation and survival | ||||||
| MAPK signaling | 45/91 (49.5%) | 18/42 (42.9%) | 0.77 (0.37–1.60) | 0.06 | 0.576 | 1.00 |
| Toll-like receptor signaling | 13/91 (14.3%) | 3/42 (7.1%) | 0.46 (0.12–1.72) | 0.10 | 0.390 | 1.00 |
| VEGF signaling pathway | 20/91 (22.0%) | 10/42 (23.8%) | 1.11 (0.47–2.64) | 0.02 | 0.826 | 1.00 |
| PI3K-AKT signaling | 45/91 (49.5%) | 17/42 (40.5%) | 0.70 (0.33–1.46) | 0.08 | 0.356 | 1.00 |
| Hedgehog signaling pathway | 5/91 (5.5%) | 2/42 (4.8%) | 0.86 (0.16–4.62) | 0.02 | 1.000 | 1.00 |
| HIPPO signaling | 13/91 (14.3%) | 6/42 (14.3%) | 1.00 (0.35–2.84) | 0.00 | 1.000 | 1.00 |
| RAS signaling pathway | 20/91 (22.0%) | 10/42 (23.8%) | 1.11 (0.47–2.64) | 0.02 | 0.826 | 1.00 |
| TNF signaling | 13/91 (14.3%) | 3/42 (7.1%) | 0.46 (0.12–1.72) | 0.10 | 0.390 | 1.00 |
| Cell death and therapeutic resistance | ||||||
| Apoptosis | 28/91 (30.8%) | 12/42 (28.6%) | 0.90 (0.40–2.01) | 0.02 | 0.842 | 1.00 |
| Necroptosis | 20/91 (22.0%) | 11/42 (26.2%) | 1.26 (0.54–2.94) | 0.05 | 0.661 | 1.00 |
| Ferroptosis | 20/91 (22.0%) | 10/42 (23.8%) | 1.11 (0.47–2.64) | 0.02 | 0.826 | 1.00 |
| JAK-stat signaling | 21/91 (23.1%) | 5/42 (11.9%) | 0.45 (0.16–1.29) | 0.13 | 0.162 | 1.00 |
Disclaimer/Publisher’s Note: The statements, opinions and data contained in all publications are solely those of the individual author(s) and contributor(s) and not of MDPI and/or the editor(s). MDPI and/or the editor(s) disclaim responsibility for any injury to people or property resulting from any ideas, methods, instructions or products referred to in the content. |
© 2026 by the authors. Licensee MDPI, Basel, Switzerland. This article is an open access article distributed under the terms and conditions of the Creative Commons Attribution (CC BY) license.
Share and Cite
Teixeira, M.F.; Tomaz, V.; Barbosa e Silva, L.C.; Donizete, U.; Tustumi, F.; Nakaya, H.I.; Beal, J.R.; Moura, F.; Borad, M.J.; Campregher, P.V.; et al. Very High vs. High Tumor Mutational Burden Across Tumors: Real-World Associations with MSI, Pathway Features, and Immunotherapy Outcomes. Biomedicines 2026, 14, 593. https://doi.org/10.3390/biomedicines14030593
Teixeira MF, Tomaz V, Barbosa e Silva LC, Donizete U, Tustumi F, Nakaya HI, Beal JR, Moura F, Borad MJ, Campregher PV, et al. Very High vs. High Tumor Mutational Burden Across Tumors: Real-World Associations with MSI, Pathway Features, and Immunotherapy Outcomes. Biomedicines. 2026; 14(3):593. https://doi.org/10.3390/biomedicines14030593
Chicago/Turabian StyleTeixeira, Maria Fernanda, Victoria Tomaz, Lucas Campos Barbosa e Silva, Uelson Donizete, Francisco Tustumi, Helder Imoto Nakaya, Juliana Rodrigues Beal, Fernando Moura, Mitesh J. Borad, Paulo Vidal Campregher, and et al. 2026. "Very High vs. High Tumor Mutational Burden Across Tumors: Real-World Associations with MSI, Pathway Features, and Immunotherapy Outcomes" Biomedicines 14, no. 3: 593. https://doi.org/10.3390/biomedicines14030593
APA StyleTeixeira, M. F., Tomaz, V., Barbosa e Silva, L. C., Donizete, U., Tustumi, F., Nakaya, H. I., Beal, J. R., Moura, F., Borad, M. J., Campregher, P. V., & Uson Junior, P. L. S. (2026). Very High vs. High Tumor Mutational Burden Across Tumors: Real-World Associations with MSI, Pathway Features, and Immunotherapy Outcomes. Biomedicines, 14(3), 593. https://doi.org/10.3390/biomedicines14030593